Zip Codes with the Highest Percentage of Population Employed in Architecture & Engineering in Redmond, WA
RELATED REPORTS & OPTIONS
Architecture & Engineering
Redmond
Compare Zip Codes
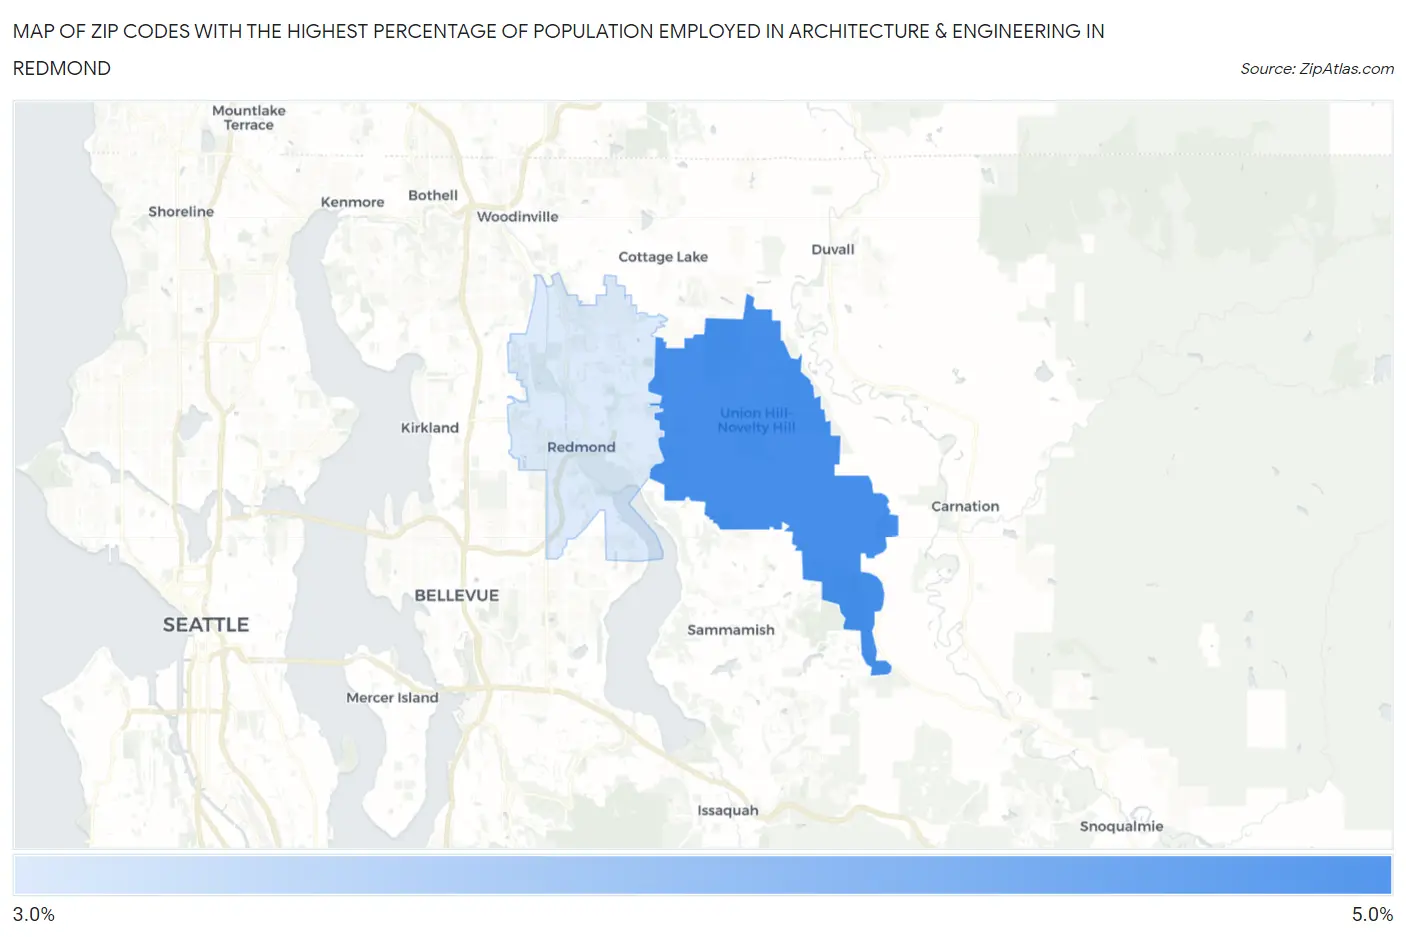
Map of Zip Codes with the Highest Percentage of Population Employed in Architecture & Engineering in Redmond
4.0%
4.4%
Zip Codes with the Highest Percentage of Population Employed in Architecture & Engineering in Redmond, WA
| Zip Code | % Employed | vs State | vs National | |
| 1. | 98053 | 4.4% | 2.8%(+1.65)#63 | 2.1%(+2.29)#2,205 |
| 2. | 98052 | 4.0% | 2.8%(+1.19)#81 | 2.1%(+1.84)#2,788 |
1
Common Questions
What are the Top Zip Codes with the Highest Percentage of Population Employed in Architecture & Engineering in Redmond, WA?
Top Zip Codes with the Highest Percentage of Population Employed in Architecture & Engineering in Redmond, WA are:
What zip code has the Highest Percentage of Population Employed in Architecture & Engineering in Redmond, WA?
98053 has the Highest Percentage of Population Employed in Architecture & Engineering in Redmond, WA with 4.4%.
What is the Percentage of Population Employed in Architecture & Engineering in Redmond, WA?
Percentage of Population Employed in Architecture & Engineering in Redmond is 4.0%.
What is the Percentage of Population Employed in Architecture & Engineering in Washington?
Percentage of Population Employed in Architecture & Engineering in Washington is 2.8%.
What is the Percentage of Population Employed in Architecture & Engineering in the United States?
Percentage of Population Employed in Architecture & Engineering in the United States is 2.1%.