Zip Codes with the Highest Percentage of Population Employed in Architecture & Engineering in Issaquah, WA
RELATED REPORTS & OPTIONS
Architecture & Engineering
Issaquah
Compare Zip Codes
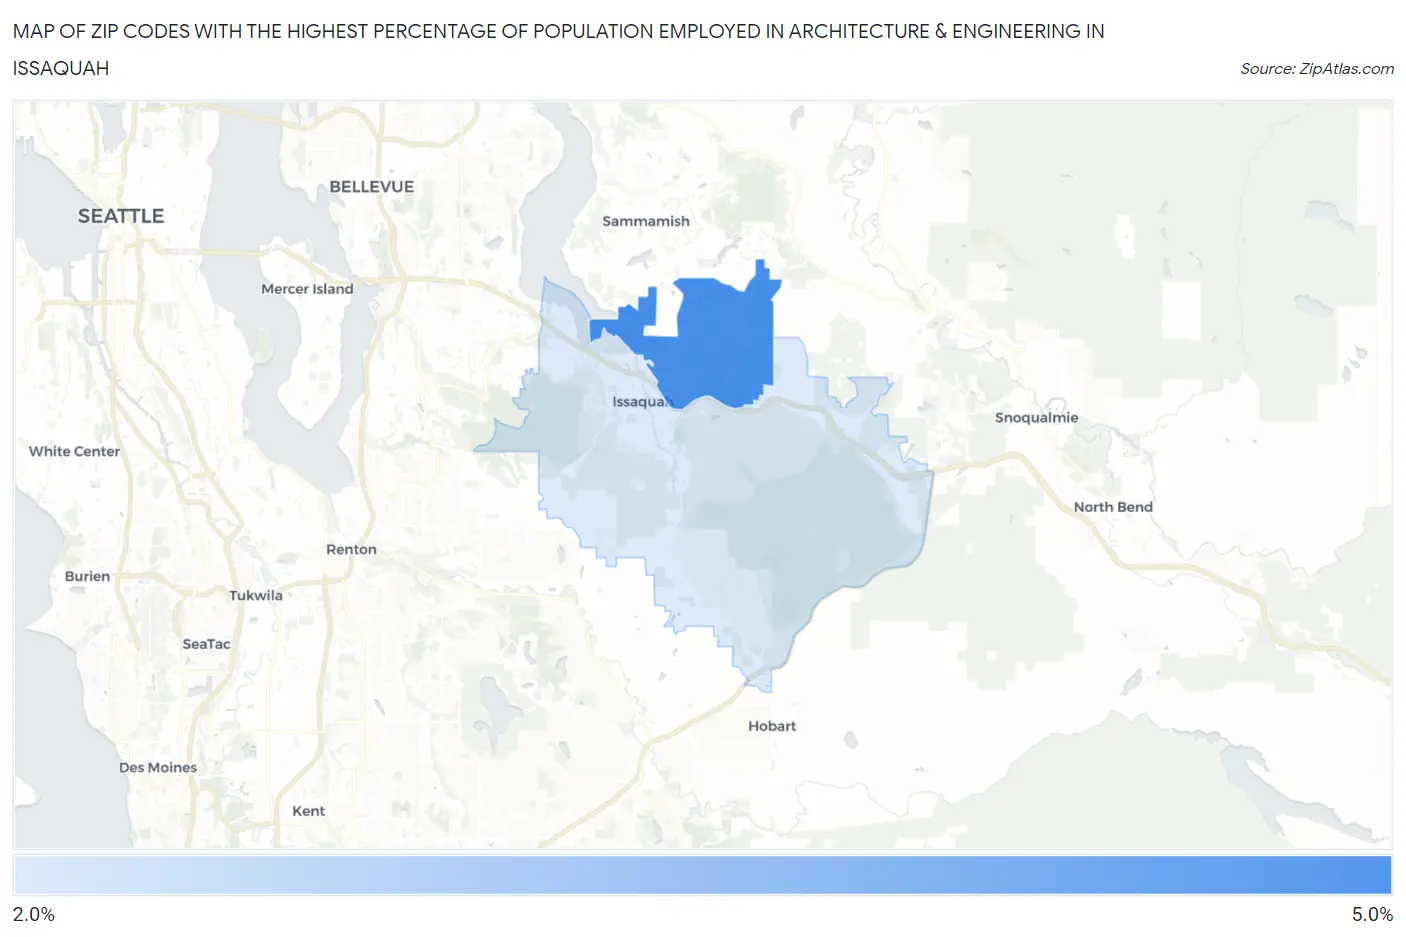
Map of Zip Codes with the Highest Percentage of Population Employed in Architecture & Engineering in Issaquah
2.9%
4.0%
Zip Codes with the Highest Percentage of Population Employed in Architecture & Engineering in Issaquah, WA
| Zip Code | % Employed | vs State | vs National | |
| 1. | 98029 | 4.0% | 2.8%(+1.22)#79 | 2.1%(+1.86)#2,751 |
| 2. | 98027 | 2.9% | 2.8%(+0.145)#150 | 2.1%(+0.787)#5,294 |
1
Common Questions
What are the Top Zip Codes with the Highest Percentage of Population Employed in Architecture & Engineering in Issaquah, WA?
Top Zip Codes with the Highest Percentage of Population Employed in Architecture & Engineering in Issaquah, WA are:
What zip code has the Highest Percentage of Population Employed in Architecture & Engineering in Issaquah, WA?
98029 has the Highest Percentage of Population Employed in Architecture & Engineering in Issaquah, WA with 4.0%.
What is the Percentage of Population Employed in Architecture & Engineering in Issaquah, WA?
Percentage of Population Employed in Architecture & Engineering in Issaquah is 3.3%.
What is the Percentage of Population Employed in Architecture & Engineering in Washington?
Percentage of Population Employed in Architecture & Engineering in Washington is 2.8%.
What is the Percentage of Population Employed in Architecture & Engineering in the United States?
Percentage of Population Employed in Architecture & Engineering in the United States is 2.1%.