Brush Prairie, WA Map & Demographics
Brush Prairie Map
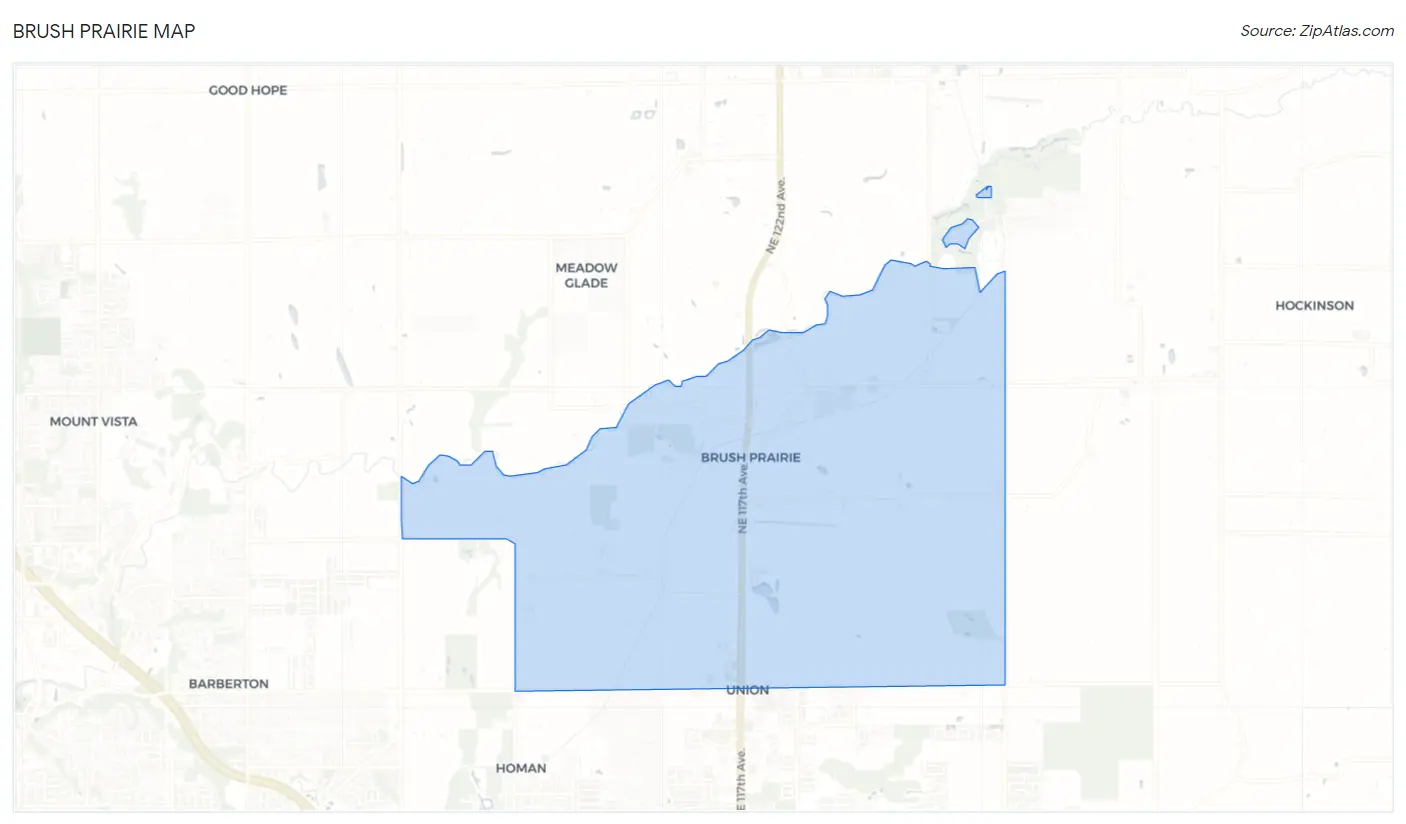
Brush Prairie Overview
$50,436
PER CAPITA INCOME
$112,813
AVG FAMILY INCOME
$106,719
AVG HOUSEHOLD INCOME
60.2%
WAGE / INCOME GAP [ % ]
39.8¢/ $1
WAGE / INCOME GAP [ $ ]
0.39
INEQUALITY / GINI INDEX
2,623
TOTAL POPULATION
1,267
MALE POPULATION
1,356
FEMALE POPULATION
93.44
MALES / 100 FEMALES
107.02
FEMALES / 100 MALES
46.8
MEDIAN AGE
3.0
AVG FAMILY SIZE
2.5
AVG HOUSEHOLD SIZE
1,361
LABOR FORCE [ PEOPLE ]
61.5%
PERCENT IN LABOR FORCE
3.9%
UNEMPLOYMENT RATE
Brush Prairie Zip Codes
Brush Prairie Area Codes
Income in Brush Prairie
Income Overview in Brush Prairie
Per Capita Income in Brush Prairie is $50,436, while median incomes of families and households are $112,813 and $106,719 respectively.
| Characteristic | Number | Measure |
| Per Capita Income | 2,623 | $50,436 |
| Median Family Income | 687 | $112,813 |
| Mean Family Income | 687 | $138,098 |
| Median Household Income | 1,041 | $106,719 |
| Mean Household Income | 1,041 | $125,435 |
| Income Deficit | 687 | $0 |
| Wage / Income Gap (%) | 2,623 | 60.16% |
| Wage / Income Gap ($) | 2,623 | 39.84¢ per $1 |
| Gini / Inequality Index | 2,623 | 0.39 |
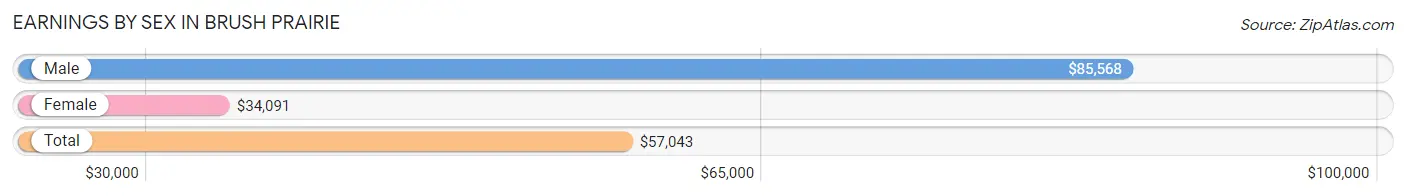
Earnings by Sex in Brush Prairie
Average Earnings in Brush Prairie are $57,043, $85,568 for men and $34,091 for women, a difference of 60.2%.
| Sex | Number | Average Earnings |
| Male | 793 (57.9%) | $85,568 |
| Female | 576 (42.1%) | $34,091 |
| Total | 1,369 (100.0%) | $57,043 |
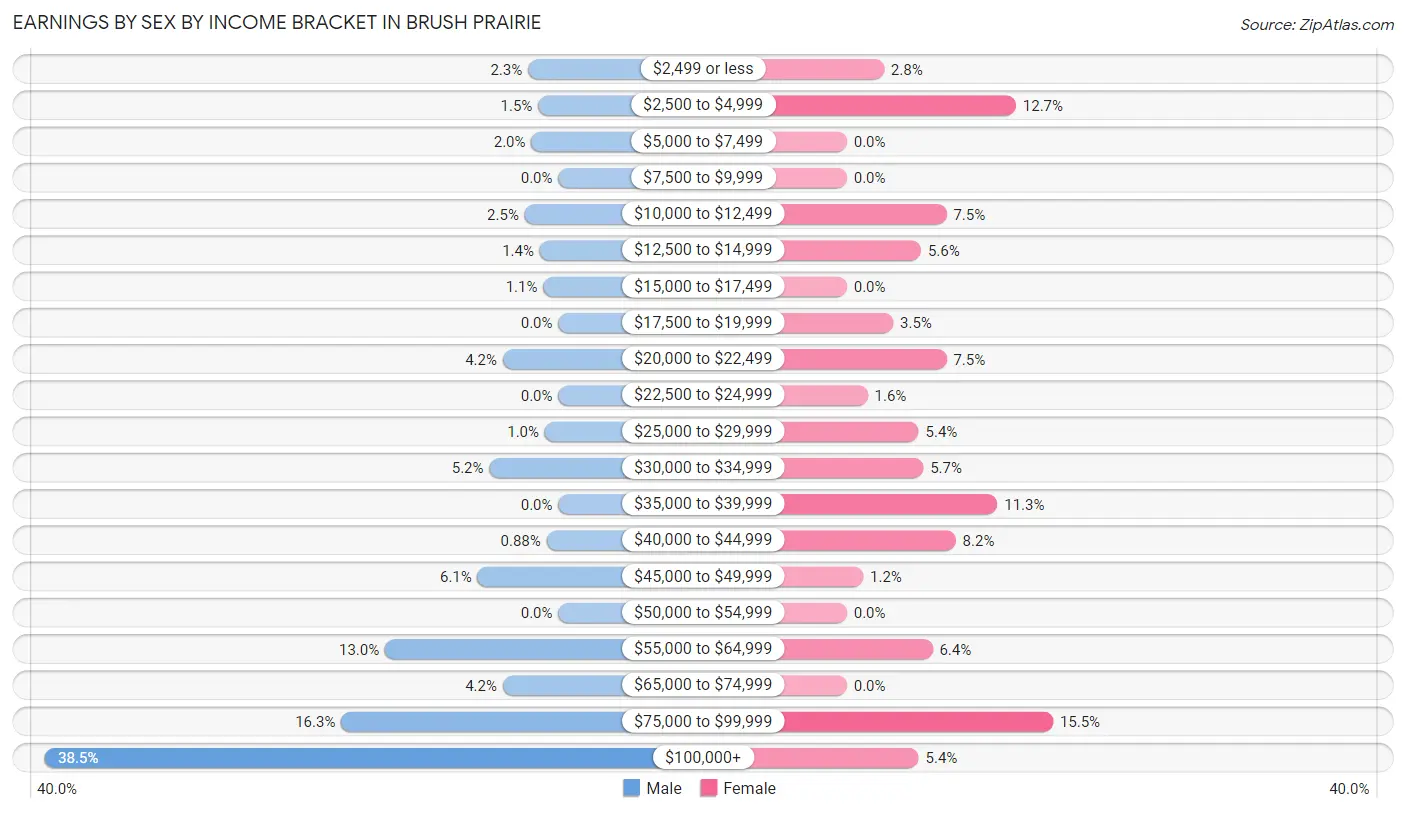
Earnings by Sex by Income Bracket in Brush Prairie
The most common earnings brackets in Brush Prairie are $100,000+ for men (305 | 38.5%) and $75,000 to $99,999 for women (89 | 15.4%).
| Income | Male | Female |
| $2,499 or less | 18 (2.3%) | 16 (2.8%) |
| $2,500 to $4,999 | 12 (1.5%) | 73 (12.7%) |
| $5,000 to $7,499 | 16 (2.0%) | 0 (0.0%) |
| $7,500 to $9,999 | 0 (0.0%) | 0 (0.0%) |
| $10,000 to $12,499 | 20 (2.5%) | 43 (7.5%) |
| $12,500 to $14,999 | 11 (1.4%) | 32 (5.6%) |
| $15,000 to $17,499 | 9 (1.1%) | 0 (0.0%) |
| $17,500 to $19,999 | 0 (0.0%) | 20 (3.5%) |
| $20,000 to $22,499 | 33 (4.2%) | 43 (7.5%) |
| $22,500 to $24,999 | 0 (0.0%) | 9 (1.6%) |
| $25,000 to $29,999 | 8 (1.0%) | 31 (5.4%) |
| $30,000 to $34,999 | 41 (5.2%) | 33 (5.7%) |
| $35,000 to $39,999 | 0 (0.0%) | 65 (11.3%) |
| $40,000 to $44,999 | 7 (0.9%) | 47 (8.2%) |
| $45,000 to $49,999 | 48 (6.0%) | 7 (1.2%) |
| $50,000 to $54,999 | 0 (0.0%) | 0 (0.0%) |
| $55,000 to $64,999 | 103 (13.0%) | 37 (6.4%) |
| $65,000 to $74,999 | 33 (4.2%) | 0 (0.0%) |
| $75,000 to $99,999 | 129 (16.3%) | 89 (15.4%) |
| $100,000+ | 305 (38.5%) | 31 (5.4%) |
| Total | 793 (100.0%) | 576 (100.0%) |
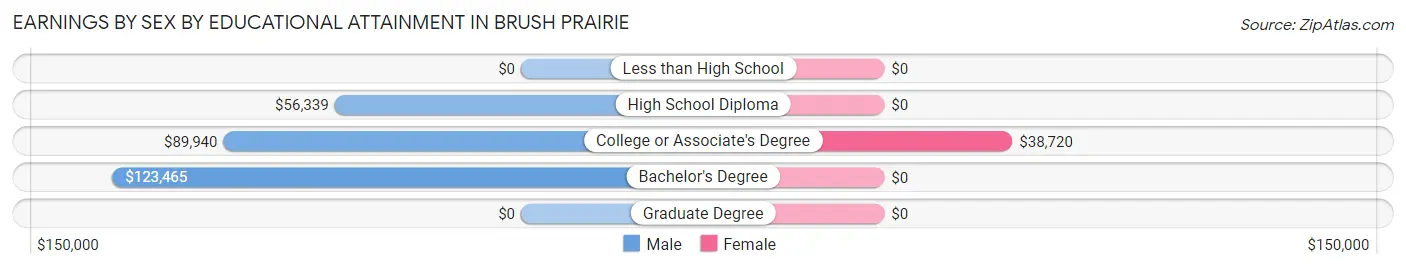
Earnings by Sex by Educational Attainment in Brush Prairie
Average earnings in Brush Prairie are $93,333 for men and $35,909 for women, a difference of 61.5%. Men with an educational attainment of bachelor's degree enjoy the highest average annual earnings of $123,465, while those with high school diploma education earn the least with $56,339. Women with an educational attainment of college or associate's degree earn the most with the average annual earnings of $38,720, while those with college or associate's degree education have the smallest earnings of $38,720.
| Educational Attainment | Male Income | Female Income |
| Less than High School | - | - |
| High School Diploma | $56,339 | $0 |
| College or Associate's Degree | $89,940 | $38,720 |
| Bachelor's Degree | $123,465 | $0 |
| Graduate Degree | - | - |
| Total | $93,333 | $35,909 |
Family Income in Brush Prairie
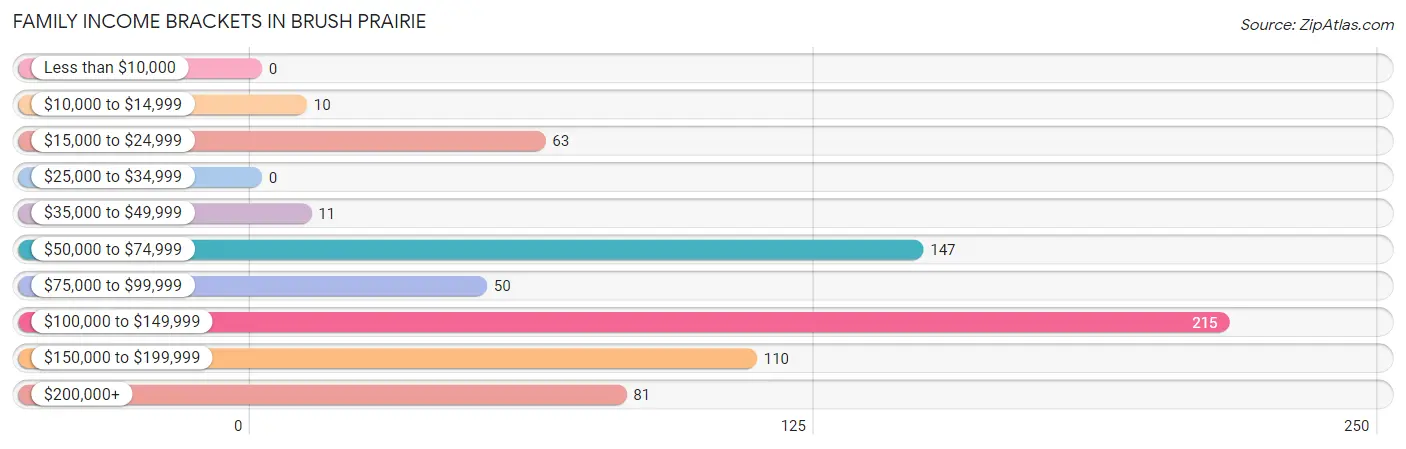
Family Income Brackets in Brush Prairie
According to the Brush Prairie family income data, there are 215 families falling into the $100,000 to $149,999 income range, which is the most common income bracket and makes up 31.3% of all families.
| Income Bracket | # Families | % Families |
| Less than $10,000 | 0 | 0.0% |
| $10,000 to $14,999 | 10 | 1.5% |
| $15,000 to $24,999 | 63 | 9.2% |
| $25,000 to $34,999 | 0 | 0.0% |
| $35,000 to $49,999 | 11 | 1.6% |
| $50,000 to $74,999 | 147 | 21.4% |
| $75,000 to $99,999 | 50 | 7.3% |
| $100,000 to $149,999 | 215 | 31.3% |
| $150,000 to $199,999 | 110 | 16.0% |
| $200,000+ | 81 | 11.8% |
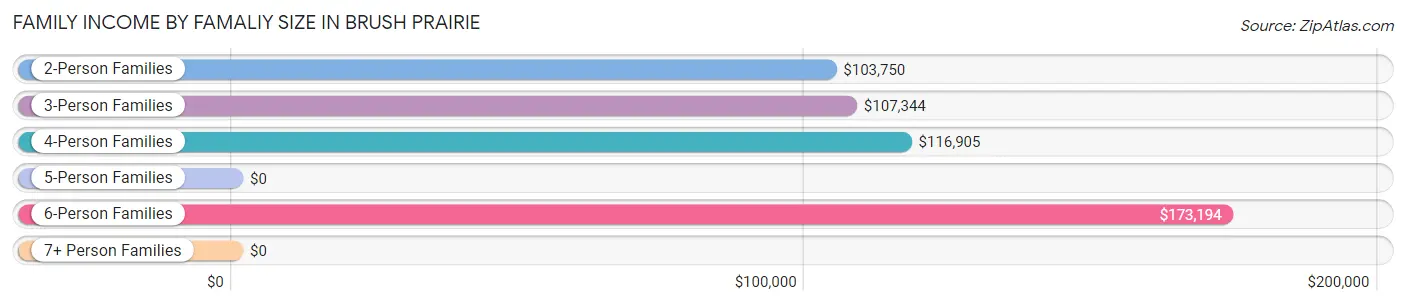
Family Income by Famaliy Size in Brush Prairie
6-person families (39 | 5.7%) account for the highest median family income in Brush Prairie with $173,194 per family, while 2-person families (375 | 54.6%) have the highest median income of $51,875 per family member.
| Income Bracket | # Families | Median Income |
| 2-Person Families | 375 (54.6%) | $103,750 |
| 3-Person Families | 117 (17.0%) | $107,344 |
| 4-Person Families | 126 (18.3%) | $116,905 |
| 5-Person Families | 12 (1.8%) | $0 |
| 6-Person Families | 39 (5.7%) | $173,194 |
| 7+ Person Families | 18 (2.6%) | $0 |
| Total | 687 (100.0%) | $112,813 |
Family Income by Number of Earners in Brush Prairie
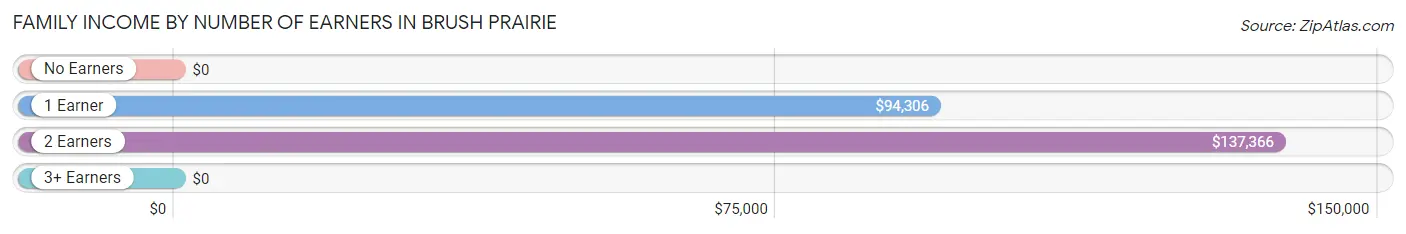
| Number of Earners | # Families | Median Income |
| No Earners | 129 (18.8%) | $0 |
| 1 Earner | 175 (25.5%) | $94,306 |
| 2 Earners | 343 (49.9%) | $137,366 |
| 3+ Earners | 40 (5.8%) | $0 |
| Total | 687 (100.0%) | $112,813 |
Household Income in Brush Prairie
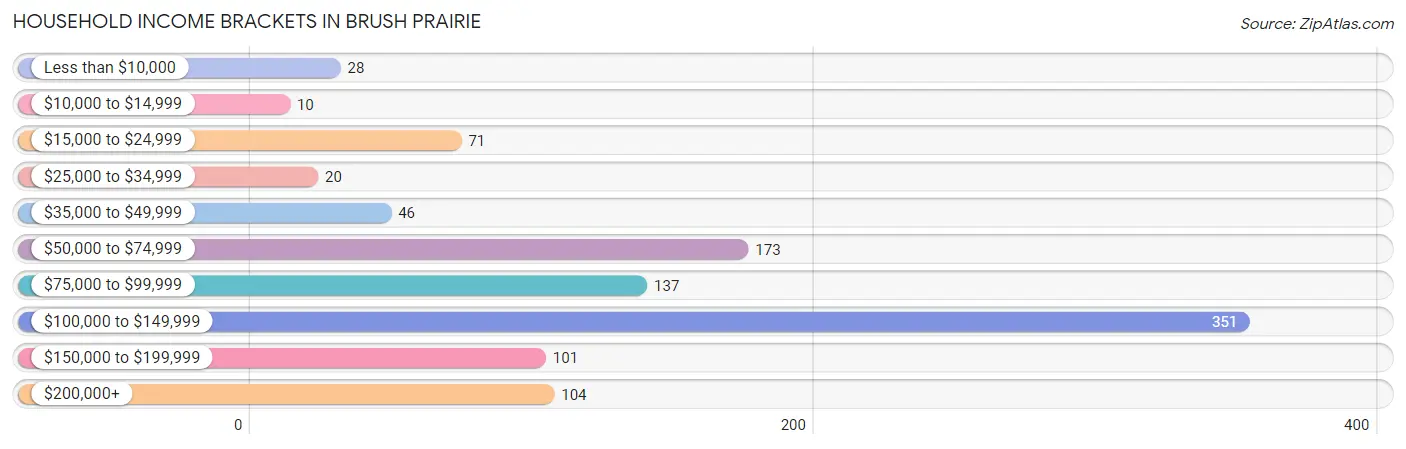
Household Income Brackets in Brush Prairie
With 351 households falling in the category, the $100,000 to $149,999 income range is the most frequent in Brush Prairie, accounting for 33.7% of all households. In contrast, only 10 households (1.0%) fall into the $10,000 to $14,999 income bracket, making it the least populous group.
| Income Bracket | # Households | % Households |
| Less than $10,000 | 28 | 2.7% |
| $10,000 to $14,999 | 10 | 1.0% |
| $15,000 to $24,999 | 71 | 6.8% |
| $25,000 to $34,999 | 20 | 1.9% |
| $35,000 to $49,999 | 46 | 4.4% |
| $50,000 to $74,999 | 173 | 16.6% |
| $75,000 to $99,999 | 137 | 13.2% |
| $100,000 to $149,999 | 351 | 33.7% |
| $150,000 to $199,999 | 101 | 9.7% |
| $200,000+ | 104 | 10.0% |
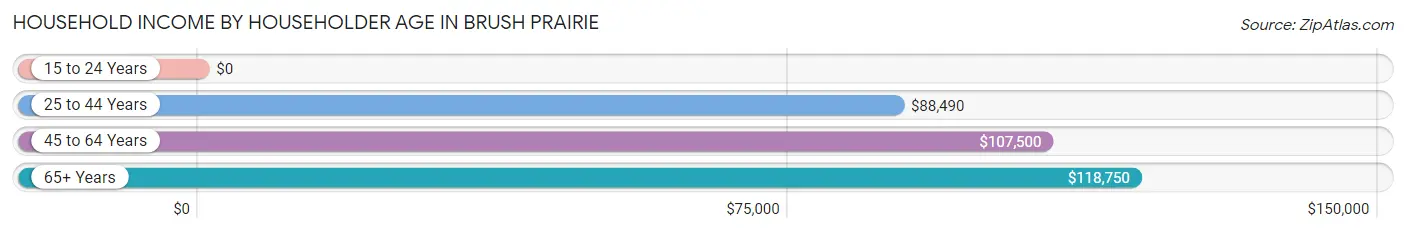
Household Income by Householder Age in Brush Prairie
The median household income in Brush Prairie is $106,719, with the highest median household income of $118,750 found in the 65+ years age bracket for the primary householder. A total of 372 households (35.7%) fall into this category.
| Income Bracket | # Households | Median Income |
| 15 to 24 Years | 0 (0.0%) | $0 |
| 25 to 44 Years | 233 (22.4%) | $88,490 |
| 45 to 64 Years | 436 (41.9%) | $107,500 |
| 65+ Years | 372 (35.7%) | $118,750 |
| Total | 1,041 (100.0%) | $106,719 |
Poverty in Brush Prairie
Income Below Poverty by Sex and Age in Brush Prairie
With 4.6% poverty level for males and 9.1% for females among the residents of Brush Prairie, 18 to 24 year old males and 45 to 54 year old females are the most vulnerable to poverty, with 14 males (16.9%) and 60 females (48.8%) in their respective age groups living below the poverty level.
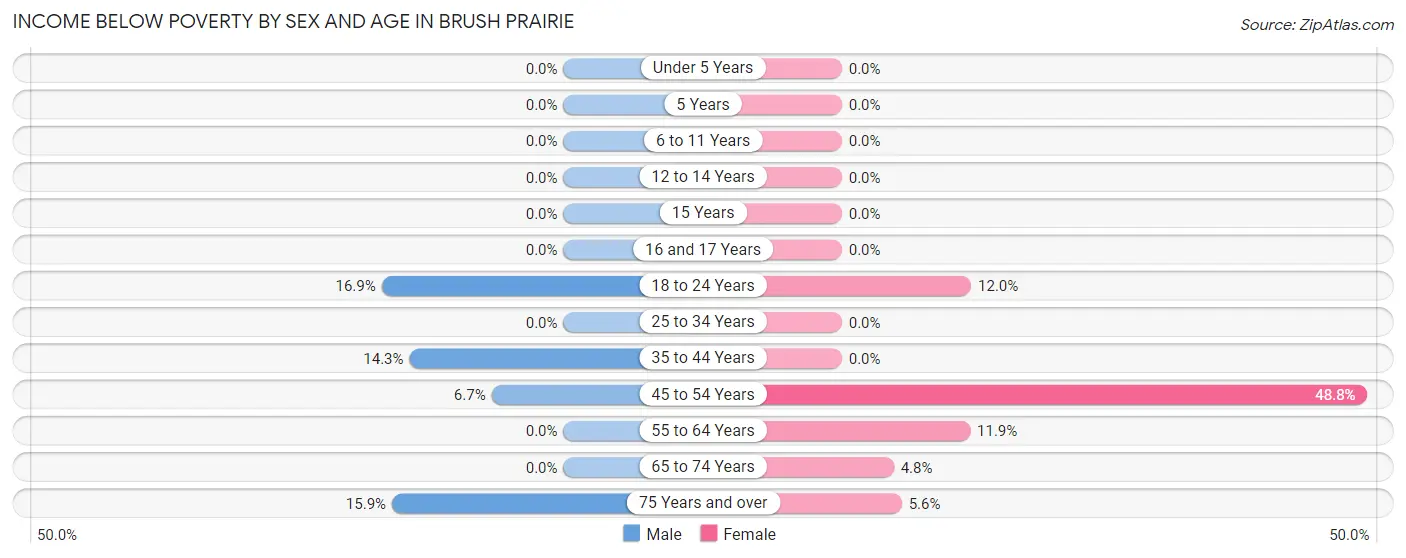
| Age Bracket | Male | Female |
| Under 5 Years | 0 (0.0%) | 0 (0.0%) |
| 5 Years | 0 (0.0%) | 0 (0.0%) |
| 6 to 11 Years | 0 (0.0%) | 0 (0.0%) |
| 12 to 14 Years | 0 (0.0%) | 0 (0.0%) |
| 15 Years | 0 (0.0%) | 0 (0.0%) |
| 16 and 17 Years | 0 (0.0%) | 0 (0.0%) |
| 18 to 24 Years | 14 (16.9%) | 18 (12.0%) |
| 25 to 34 Years | 0 (0.0%) | 0 (0.0%) |
| 35 to 44 Years | 25 (14.3%) | 0 (0.0%) |
| 45 to 54 Years | 12 (6.7%) | 60 (48.8%) |
| 55 to 64 Years | 0 (0.0%) | 33 (11.9%) |
| 65 to 74 Years | 0 (0.0%) | 8 (4.8%) |
| 75 Years and over | 7 (15.9%) | 5 (5.6%) |
| Total | 58 (4.6%) | 124 (9.1%) |
Income Above Poverty by Sex and Age in Brush Prairie
According to the poverty statistics in Brush Prairie, males aged under 5 years and females aged under 5 years are the age groups that are most secure financially, with 100.0% of males and 100.0% of females in these age groups living above the poverty line.
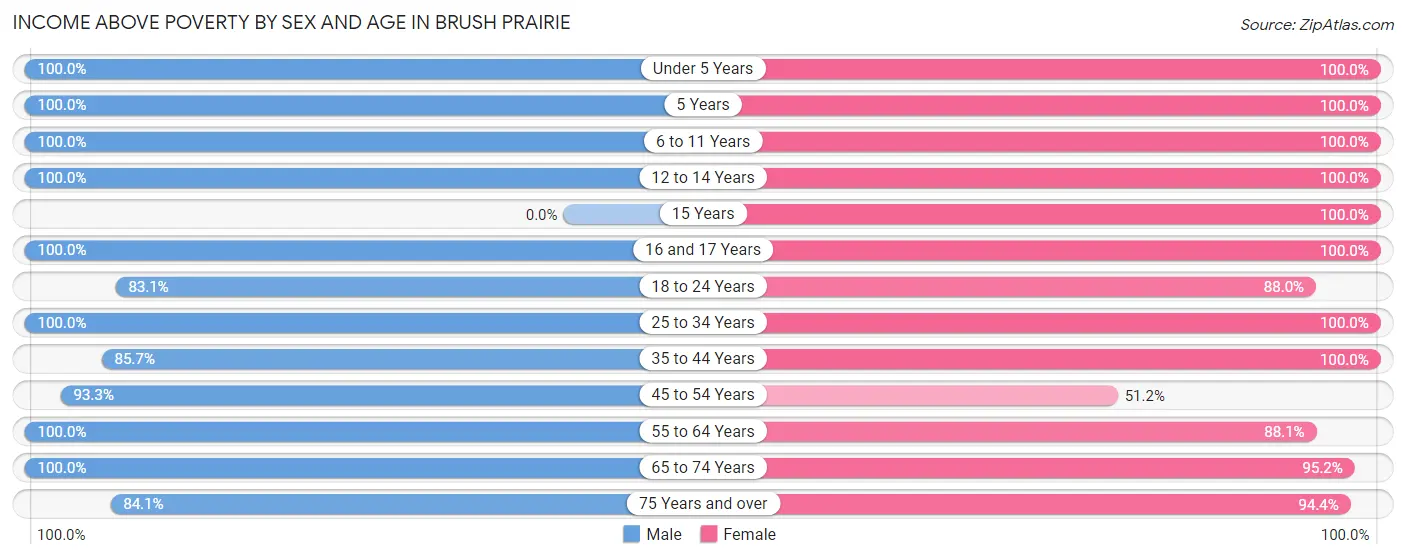
| Age Bracket | Male | Female |
| Under 5 Years | 46 (100.0%) | 81 (100.0%) |
| 5 Years | 16 (100.0%) | 39 (100.0%) |
| 6 to 11 Years | 91 (100.0%) | 42 (100.0%) |
| 12 to 14 Years | 9 (100.0%) | 65 (100.0%) |
| 15 Years | 0 (0.0%) | 8 (100.0%) |
| 16 and 17 Years | 28 (100.0%) | 5 (100.0%) |
| 18 to 24 Years | 69 (83.1%) | 132 (88.0%) |
| 25 to 34 Years | 106 (100.0%) | 127 (100.0%) |
| 35 to 44 Years | 150 (85.7%) | 182 (100.0%) |
| 45 to 54 Years | 168 (93.3%) | 63 (51.2%) |
| 55 to 64 Years | 229 (100.0%) | 244 (88.1%) |
| 65 to 74 Years | 247 (100.0%) | 158 (95.2%) |
| 75 Years and over | 37 (84.1%) | 85 (94.4%) |
| Total | 1,196 (95.4%) | 1,231 (90.8%) |
Income Below Poverty Among Married-Couple Families in Brush Prairie
The poverty statistics for married-couple families in Brush Prairie show that 3.2% or 17 of the total 532 families live below the poverty line. Families with no children have the highest poverty rate of 4.4%, comprising of 17 families. On the other hand, families with 1 or 2 children have the lowest poverty rate of 0.0%, which includes 0 families.
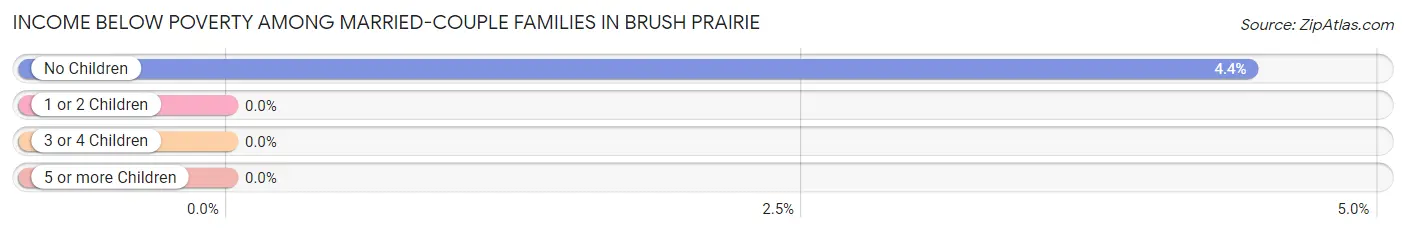
| Children | Above Poverty | Below Poverty |
| No Children | 366 (95.6%) | 17 (4.4%) |
| 1 or 2 Children | 106 (100.0%) | 0 (0.0%) |
| 3 or 4 Children | 34 (100.0%) | 0 (0.0%) |
| 5 or more Children | 9 (100.0%) | 0 (0.0%) |
| Total | 515 (96.8%) | 17 (3.2%) |
Income Below Poverty Among Single-Parent Households in Brush Prairie
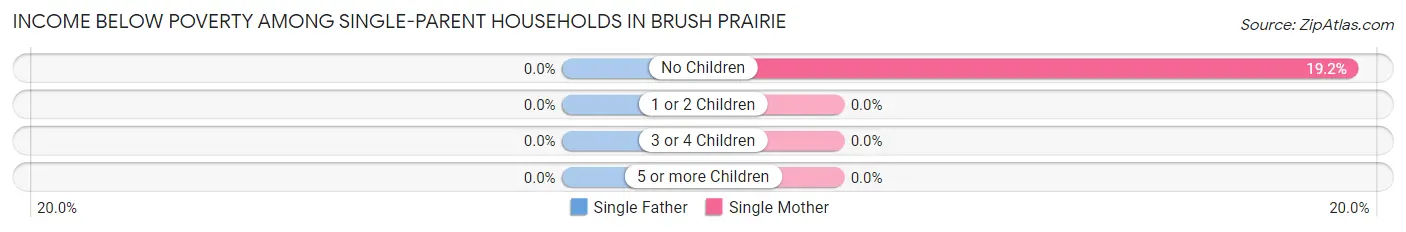
| Children | Single Father | Single Mother |
| No Children | 0 (0.0%) | 14 (19.2%) |
| 1 or 2 Children | 0 (0.0%) | 0 (0.0%) |
| 3 or 4 Children | 0 (0.0%) | 0 (0.0%) |
| 5 or more Children | 0 (0.0%) | 0 (0.0%) |
| Total | 0 (0.0%) | 14 (14.0%) |
Income Below Poverty Among Married-Couple vs Single-Parent Households in Brush Prairie
The poverty data for Brush Prairie shows that 17 of the married-couple family households (3.2%) and 14 of the single-parent households (9.0%) are living below the poverty level. Within the married-couple family households, those with no children have the highest poverty rate, with 17 households (4.4%) falling below the poverty line. Among the single-parent households, those with no children have the highest poverty rate, with 14 household (12.1%) living below poverty.
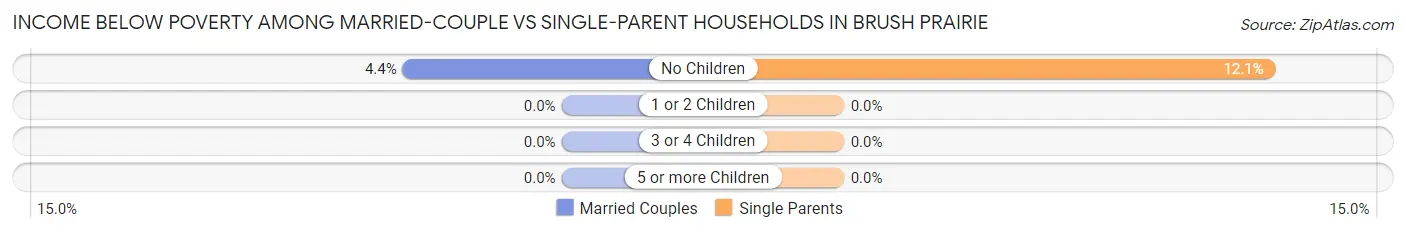
| Children | Married-Couple Families | Single-Parent Households |
| No Children | 17 (4.4%) | 14 (12.1%) |
| 1 or 2 Children | 0 (0.0%) | 0 (0.0%) |
| 3 or 4 Children | 0 (0.0%) | 0 (0.0%) |
| 5 or more Children | 0 (0.0%) | 0 (0.0%) |
| Total | 17 (3.2%) | 14 (9.0%) |
Race in Brush Prairie
The most populous races in Brush Prairie are White / Caucasian (2,521 | 96.1%), Hispanic or Latino (156 | 5.9%), and Asian (38 | 1.5%).
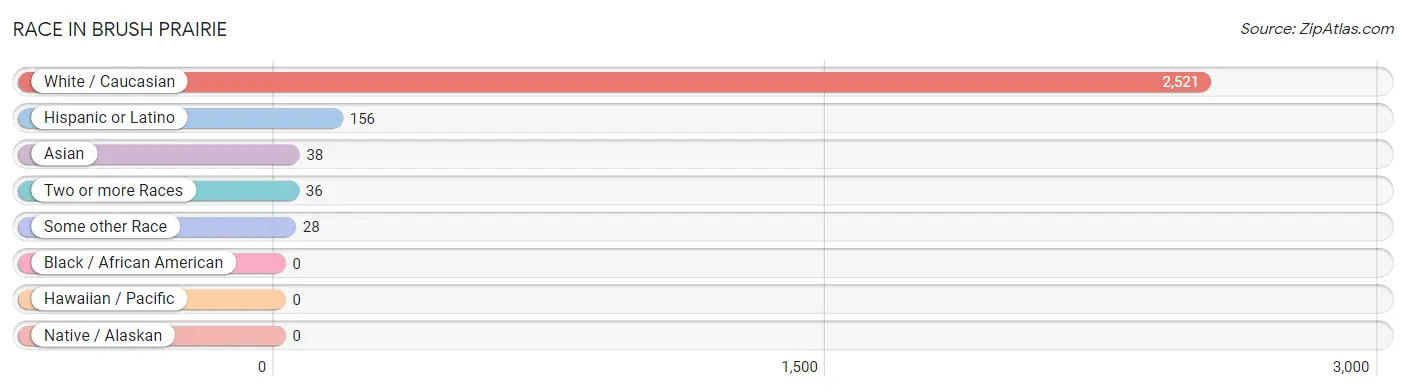
| Race | # Population | % Population |
| Asian | 38 | 1.5% |
| Black / African American | 0 | 0.0% |
| Hawaiian / Pacific | 0 | 0.0% |
| Hispanic or Latino | 156 | 5.9% |
| Native / Alaskan | 0 | 0.0% |
| White / Caucasian | 2,521 | 96.1% |
| Two or more Races | 36 | 1.4% |
| Some other Race | 28 | 1.1% |
| Total | 2,623 | 100.0% |
Ancestry in Brush Prairie
The most populous ancestries reported in Brush Prairie are English (506 | 19.3%), German (431 | 16.4%), Irish (363 | 13.8%), Norwegian (266 | 10.1%), and Swedish (154 | 5.9%), together accounting for 65.6% of all Brush Prairie residents.
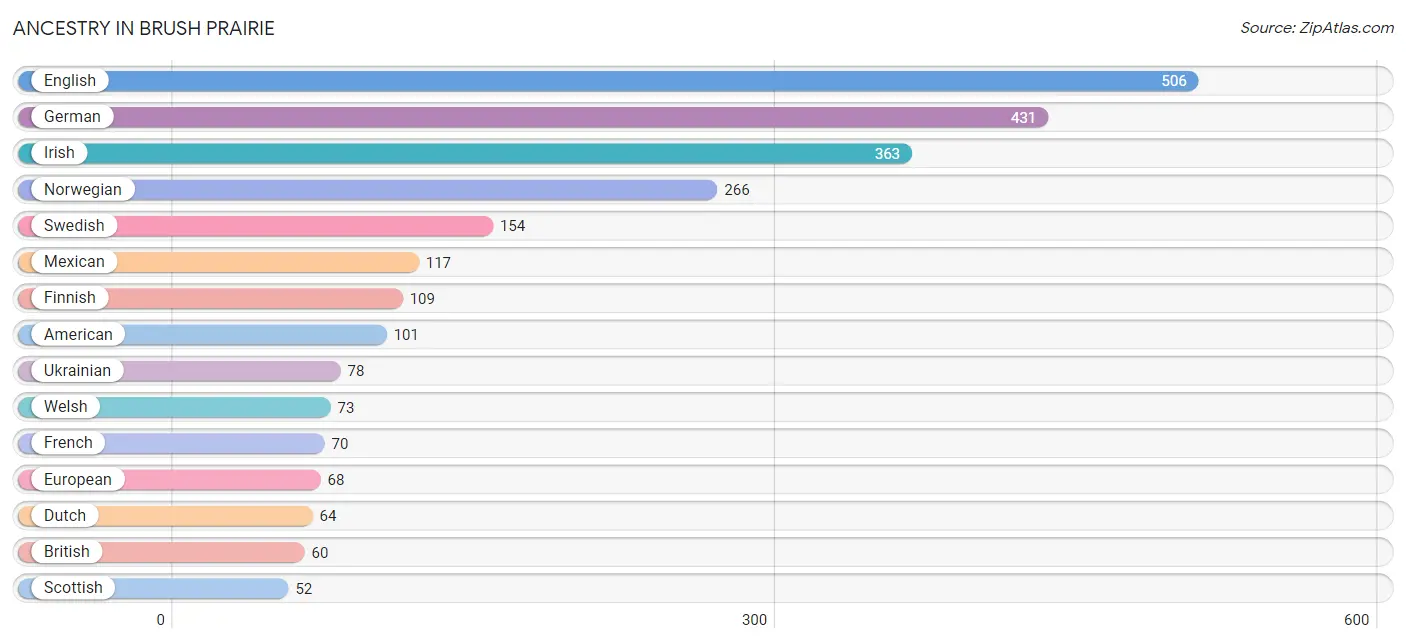
| Ancestry | # Population | % Population |
| American | 101 | 3.8% |
| Argentinean | 12 | 0.5% |
| Armenian | 7 | 0.3% |
| Bhutanese | 7 | 0.3% |
| British | 60 | 2.3% |
| Central American | 17 | 0.6% |
| Danish | 26 | 1.0% |
| Dutch | 64 | 2.4% |
| English | 506 | 19.3% |
| European | 68 | 2.6% |
| Finnish | 109 | 4.2% |
| French | 70 | 2.7% |
| German | 431 | 16.4% |
| Irish | 363 | 13.8% |
| Italian | 29 | 1.1% |
| Mexican | 117 | 4.5% |
| Northern European | 27 | 1.0% |
| Norwegian | 266 | 10.1% |
| Polish | 39 | 1.5% |
| Russian | 14 | 0.5% |
| Salvadoran | 17 | 0.6% |
| Scottish | 52 | 2.0% |
| South American | 12 | 0.5% |
| Spanish | 10 | 0.4% |
| Sri Lankan | 31 | 1.2% |
| Swedish | 154 | 5.9% |
| Ukrainian | 78 | 3.0% |
| Welsh | 73 | 2.8% | View All 28 Rows |
Immigrants in Brush Prairie
The most numerous immigrant groups reported in Brush Prairie came from Latin America (57 | 2.2%), Central America (45 | 1.7%), Eastern Europe (39 | 1.5%), Europe (39 | 1.5%), and Ukraine (39 | 1.5%), together accounting for 8.4% of all Brush Prairie residents.
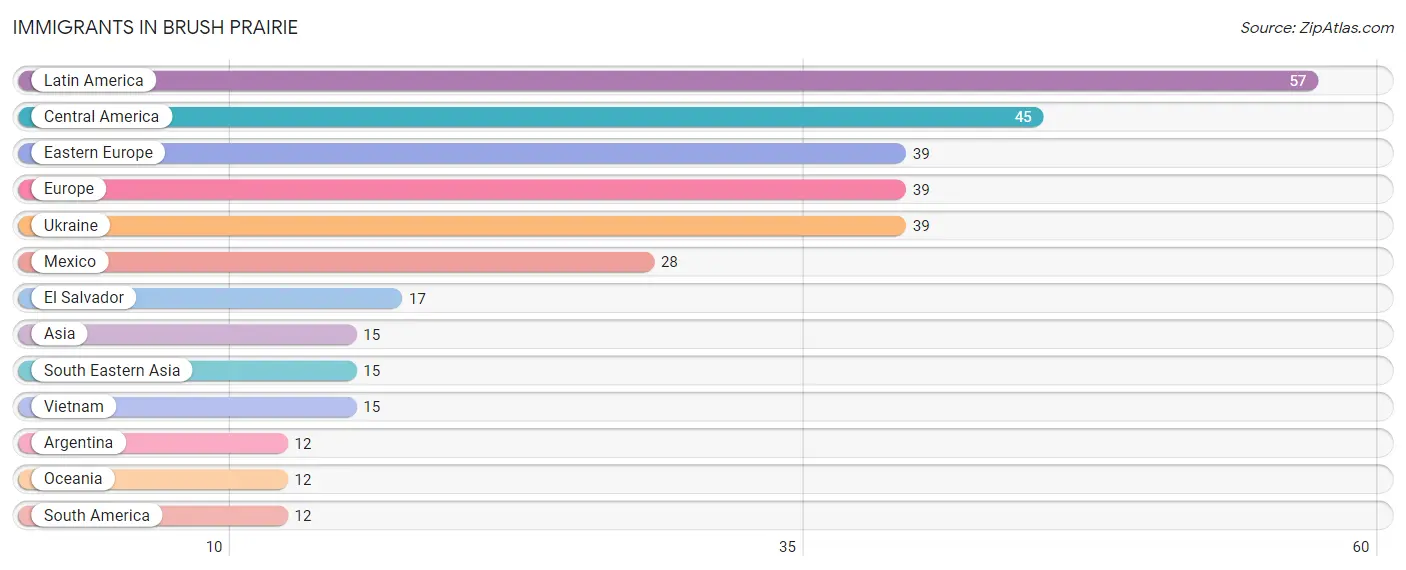
| Immigration Origin | # Population | % Population |
| Argentina | 12 | 0.5% |
| Asia | 15 | 0.6% |
| Central America | 45 | 1.7% |
| Eastern Europe | 39 | 1.5% |
| El Salvador | 17 | 0.6% |
| Europe | 39 | 1.5% |
| Latin America | 57 | 2.2% |
| Mexico | 28 | 1.1% |
| Oceania | 12 | 0.5% |
| South America | 12 | 0.5% |
| South Eastern Asia | 15 | 0.6% |
| Ukraine | 39 | 1.5% |
| Vietnam | 15 | 0.6% | View All 13 Rows |
Sex and Age in Brush Prairie
Sex and Age in Brush Prairie
The most populous age groups in Brush Prairie are 65 to 69 Years (191 | 15.1%) for men and 20 to 24 Years (150 | 11.1%) for women.
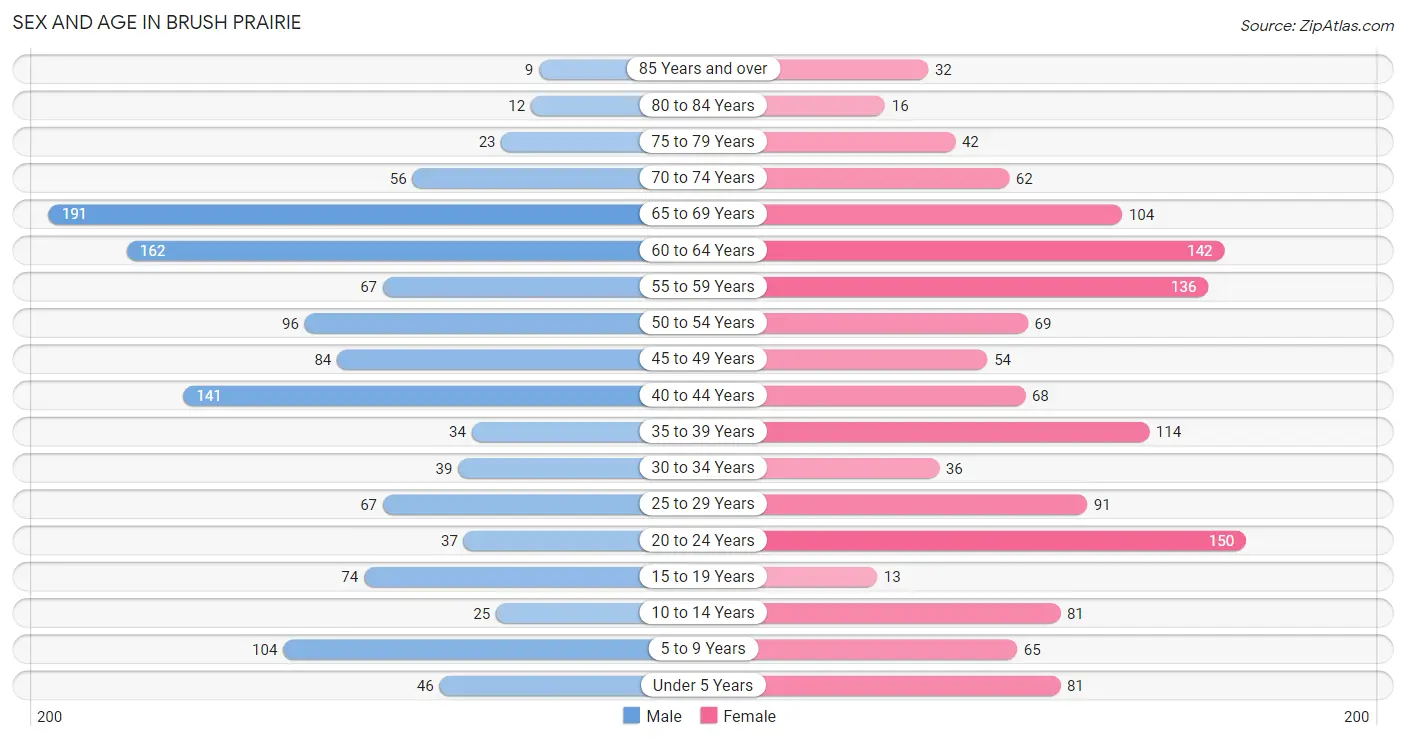
| Age Bracket | Male | Female |
| Under 5 Years | 46 (3.6%) | 81 (6.0%) |
| 5 to 9 Years | 104 (8.2%) | 65 (4.8%) |
| 10 to 14 Years | 25 (2.0%) | 81 (6.0%) |
| 15 to 19 Years | 74 (5.8%) | 13 (1.0%) |
| 20 to 24 Years | 37 (2.9%) | 150 (11.1%) |
| 25 to 29 Years | 67 (5.3%) | 91 (6.7%) |
| 30 to 34 Years | 39 (3.1%) | 36 (2.6%) |
| 35 to 39 Years | 34 (2.7%) | 114 (8.4%) |
| 40 to 44 Years | 141 (11.1%) | 68 (5.0%) |
| 45 to 49 Years | 84 (6.6%) | 54 (4.0%) |
| 50 to 54 Years | 96 (7.6%) | 69 (5.1%) |
| 55 to 59 Years | 67 (5.3%) | 136 (10.0%) |
| 60 to 64 Years | 162 (12.8%) | 142 (10.5%) |
| 65 to 69 Years | 191 (15.1%) | 104 (7.7%) |
| 70 to 74 Years | 56 (4.4%) | 62 (4.6%) |
| 75 to 79 Years | 23 (1.8%) | 42 (3.1%) |
| 80 to 84 Years | 12 (0.9%) | 16 (1.2%) |
| 85 Years and over | 9 (0.7%) | 32 (2.4%) |
| Total | 1,267 (100.0%) | 1,356 (100.0%) |
Families and Households in Brush Prairie
Median Family Size in Brush Prairie
The median family size in Brush Prairie is 3.03 persons per family, with married-couple families (532 | 77.4%) accounting for the largest median family size of 3.1 persons per family. On the other hand, single male/father families (55 | 8.0%) represent the smallest median family size with 2.33 persons per family.
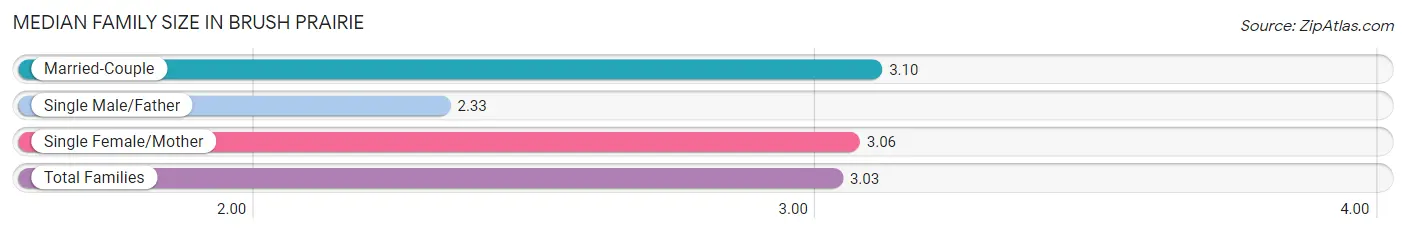
| Family Type | # Families | Family Size |
| Married-Couple | 532 (77.4%) | 3.10 |
| Single Male/Father | 55 (8.0%) | 2.33 |
| Single Female/Mother | 100 (14.6%) | 3.06 |
| Total Families | 687 (100.0%) | 3.03 |
Median Household Size in Brush Prairie
The median household size in Brush Prairie is 2.50 persons per household, with single female/mother households (100 | 9.6%) accounting for the largest median household size of 3.38 persons per household. non-family households (354 | 34.0%) represent the smallest median household size with 1.18 persons per household.
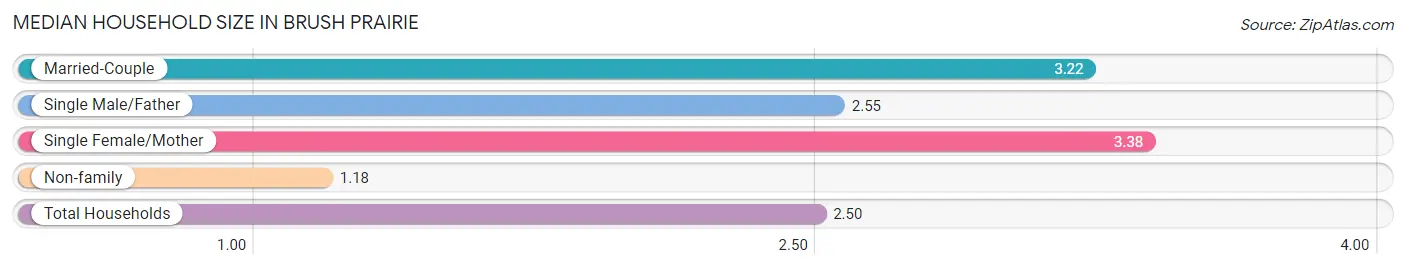
| Household Type | # Households | Household Size |
| Married-Couple | 532 (51.1%) | 3.22 |
| Single Male/Father | 55 (5.3%) | 2.55 |
| Single Female/Mother | 100 (9.6%) | 3.38 |
| Non-family | 354 (34.0%) | 1.18 |
| Total Households | 1,041 (100.0%) | 2.50 |
Household Size by Marriage Status in Brush Prairie
Out of a total of 1,041 households in Brush Prairie, 687 (66.0%) are family households, while 354 (34.0%) are nonfamily households. The most numerous type of family households are 2-person households, comprising 375, and the most common type of nonfamily households are 1-person households, comprising 292.
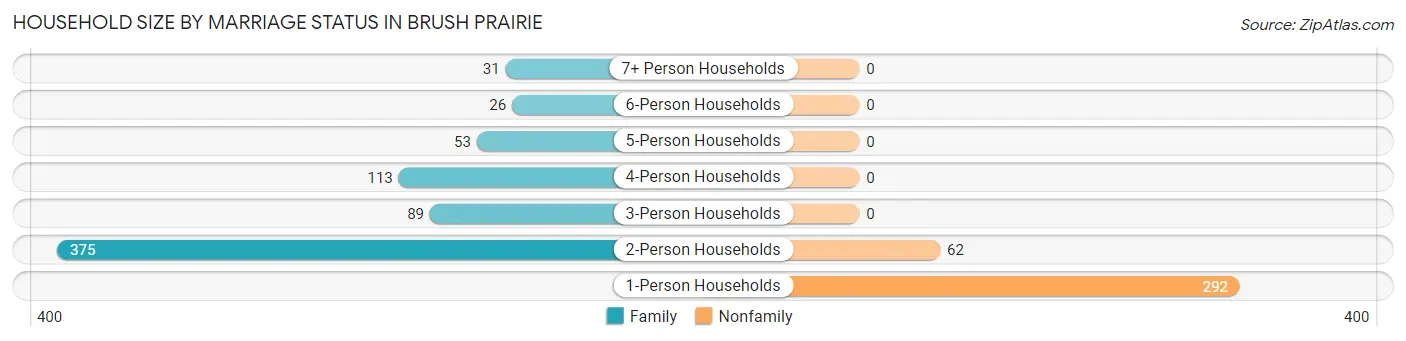
| Household Size | Family Households | Nonfamily Households |
| 1-Person Households | - | 292 (28.1%) |
| 2-Person Households | 375 (36.0%) | 62 (6.0%) |
| 3-Person Households | 89 (8.6%) | 0 (0.0%) |
| 4-Person Households | 113 (10.8%) | 0 (0.0%) |
| 5-Person Households | 53 (5.1%) | 0 (0.0%) |
| 6-Person Households | 26 (2.5%) | 0 (0.0%) |
| 7+ Person Households | 31 (3.0%) | 0 (0.0%) |
| Total | 687 (66.0%) | 354 (34.0%) |
Female Fertility in Brush Prairie
Fertility by Age in Brush Prairie
Average fertility rate in Brush Prairie is 16.0 births per 1,000 women. Women in the age bracket of 20 to 34 years have the highest fertility rate with 32.0 births per 1,000 women. Women in the age bracket of 20 to 34 years acount for 100.0% of all women with births.
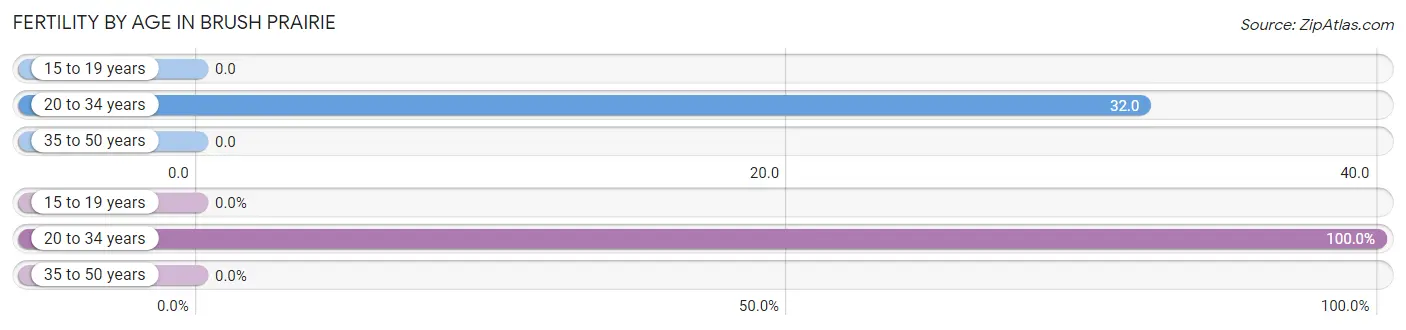
| Age Bracket | Women with Births | Births / 1,000 Women |
| 15 to 19 years | 0 (0.0%) | 0.0 |
| 20 to 34 years | 9 (100.0%) | 32.0 |
| 35 to 50 years | 0 (0.0%) | 0.0 |
| Total | 9 (100.0%) | 16.0 |
Fertility by Age by Marriage Status in Brush Prairie
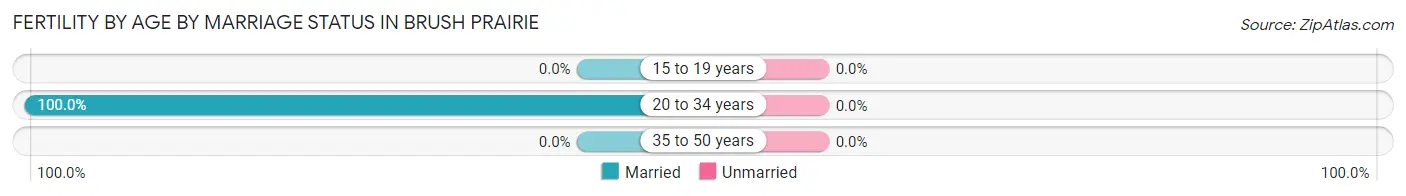
| Age Bracket | Married | Unmarried |
| 15 to 19 years | 0 (0.0%) | 0 (0.0%) |
| 20 to 34 years | 9 (100.0%) | 0 (0.0%) |
| 35 to 50 years | 0 (0.0%) | 0 (0.0%) |
| Total | 9 (100.0%) | 0 (0.0%) |
Fertility by Education in Brush Prairie
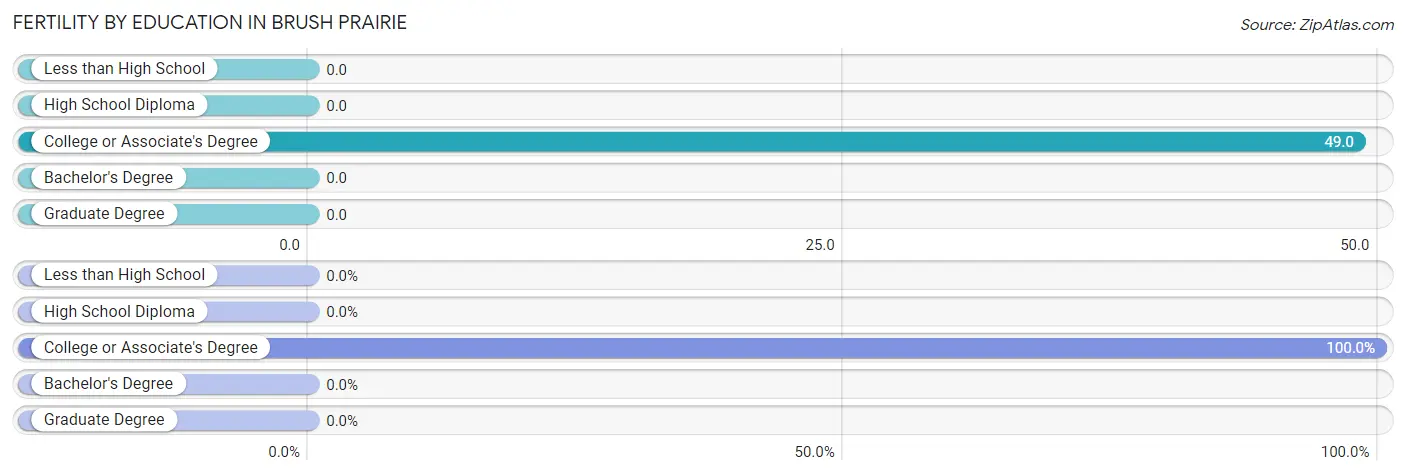
| Educational Attainment | Women with Births | Births / 1,000 Women |
| Less than High School | 0 (0.0%) | 0.0 |
| High School Diploma | 0 (0.0%) | 0.0 |
| College or Associate's Degree | 9 (100.0%) | 49.0 |
| Bachelor's Degree | 0 (0.0%) | 0.0 |
| Graduate Degree | 0 (0.0%) | 0.0 |
| Total | 9 (100.0%) | 16.0 |
Fertility by Education by Marriage Status in Brush Prairie
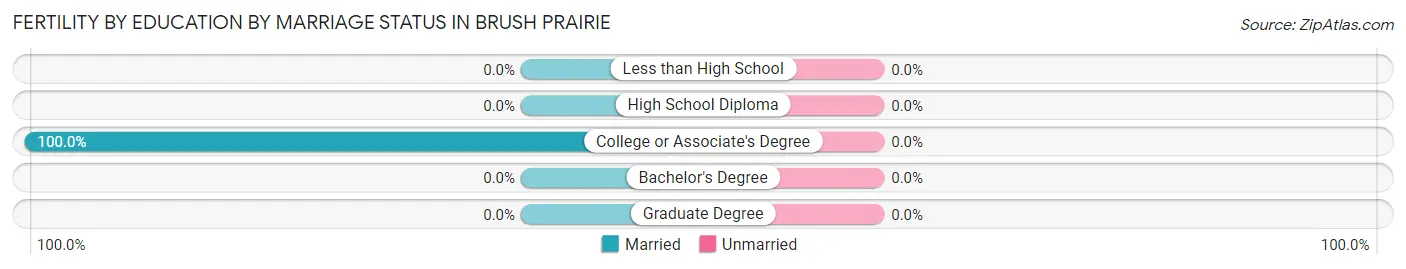
| Educational Attainment | Married | Unmarried |
| Less than High School | 0 (0.0%) | 0 (0.0%) |
| High School Diploma | 0 (0.0%) | 0 (0.0%) |
| College or Associate's Degree | 9 (100.0%) | 0 (0.0%) |
| Bachelor's Degree | 0 (0.0%) | 0 (0.0%) |
| Graduate Degree | 0 (0.0%) | 0 (0.0%) |
| Total | 9 (100.0%) | 0 (0.0%) |
Employment Characteristics in Brush Prairie
Employment by Class of Employer in Brush Prairie
Among the 1,257 employed individuals in Brush Prairie, private company employees (742 | 59.0%), self-employed (not incorporated) (166 | 13.2%), and self-employed (incorporated) (113 | 9.0%) make up the most common classes of employment.
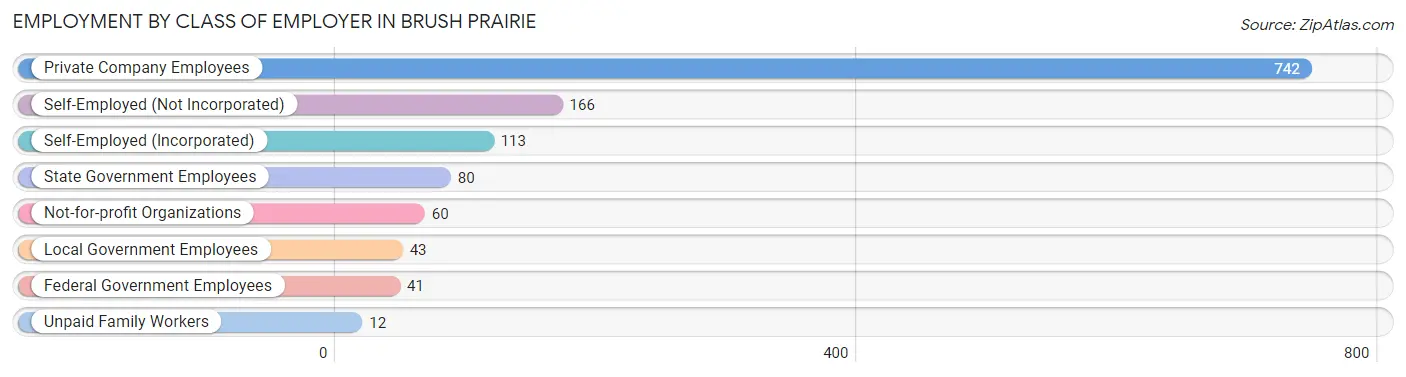
| Employer Class | # Employees | % Employees |
| Private Company Employees | 742 | 59.0% |
| Self-Employed (Incorporated) | 113 | 9.0% |
| Self-Employed (Not Incorporated) | 166 | 13.2% |
| Not-for-profit Organizations | 60 | 4.8% |
| Local Government Employees | 43 | 3.4% |
| State Government Employees | 80 | 6.4% |
| Federal Government Employees | 41 | 3.3% |
| Unpaid Family Workers | 12 | 0.9% |
| Total | 1,257 | 100.0% |
Employment Status by Age in Brush Prairie
According to the labor force statistics for Brush Prairie, out of the total population over 16 years of age (2,213), 61.5% or 1,361 individuals are in the labor force, with 3.9% or 53 of them unemployed. The age group with the highest labor force participation rate is 55 to 59 years, with 96.6% or 196 individuals in the labor force. Within the labor force, the 16 to 19 years age range has the highest percentage of unemployed individuals, with 21.2% or 14 of them being unemployed.
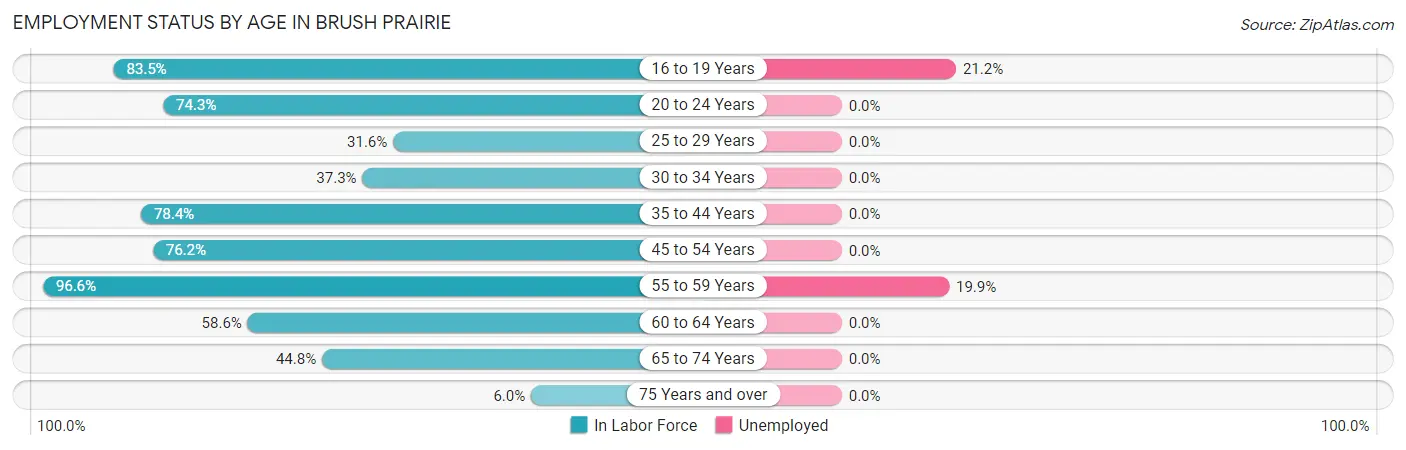
| Age Bracket | In Labor Force | Unemployed |
| 16 to 19 Years | 66 (83.5%) | 14 (21.2%) |
| 20 to 24 Years | 139 (74.3%) | 0 (0.0%) |
| 25 to 29 Years | 50 (31.6%) | 0 (0.0%) |
| 30 to 34 Years | 28 (37.3%) | 0 (0.0%) |
| 35 to 44 Years | 280 (78.4%) | 0 (0.0%) |
| 45 to 54 Years | 231 (76.2%) | 0 (0.0%) |
| 55 to 59 Years | 196 (96.6%) | 39 (19.9%) |
| 60 to 64 Years | 178 (58.6%) | 0 (0.0%) |
| 65 to 74 Years | 185 (44.8%) | 0 (0.0%) |
| 75 Years and over | 8 (6.0%) | 0 (0.0%) |
| Total | 1,361 (61.5%) | 53 (3.9%) |
Employment Status by Educational Attainment in Brush Prairie
According to labor force statistics for Brush Prairie, 68.8% of individuals (963) out of the total population between 25 and 64 years of age (1,400) are in the labor force, with 4.0% or 39 of them being unemployed. The group with the highest labor force participation rate are those with the educational attainment of bachelor's degree or higher, with 71.5% or 233 individuals in the labor force. Within the labor force, individuals with high school diploma education have the highest percentage of unemployment, with 8.6% or 28 of them being unemployed.
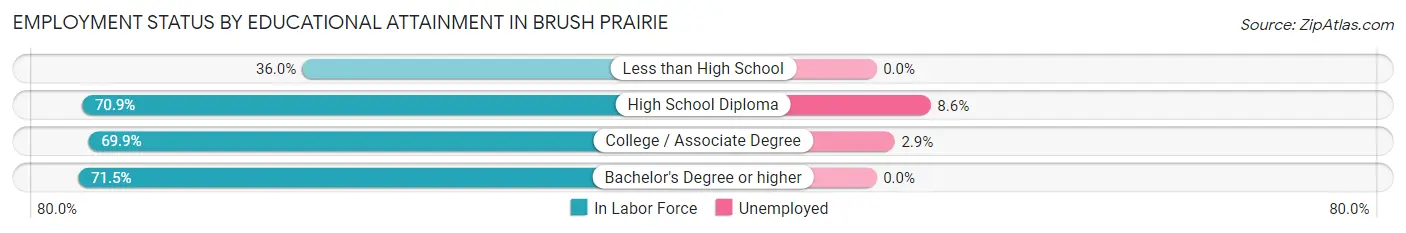
| Educational Attainment | In Labor Force | Unemployed |
| Less than High School | 27 (36.0%) | 0 (0.0%) |
| High School Diploma | 324 (70.9%) | 39 (8.6%) |
| College / Associate Degree | 379 (69.9%) | 16 (2.9%) |
| Bachelor's Degree or higher | 233 (71.5%) | 0 (0.0%) |
| Total | 963 (68.8%) | 56 (4.0%) |
Employment Occupations by Sex in Brush Prairie
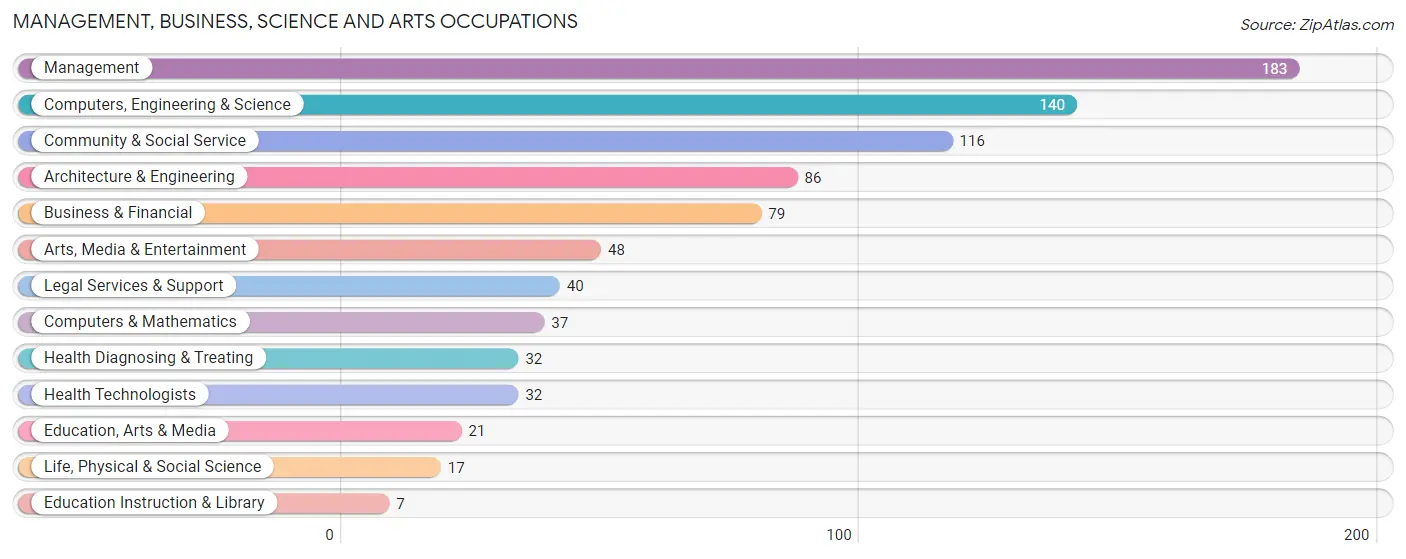
Management, Business, Science and Arts Occupations
The most common Management, Business, Science and Arts occupations in Brush Prairie are Management (183 | 14.0%), Computers, Engineering & Science (140 | 10.7%), Community & Social Service (116 | 8.9%), Architecture & Engineering (86 | 6.6%), and Business & Financial (79 | 6.0%).
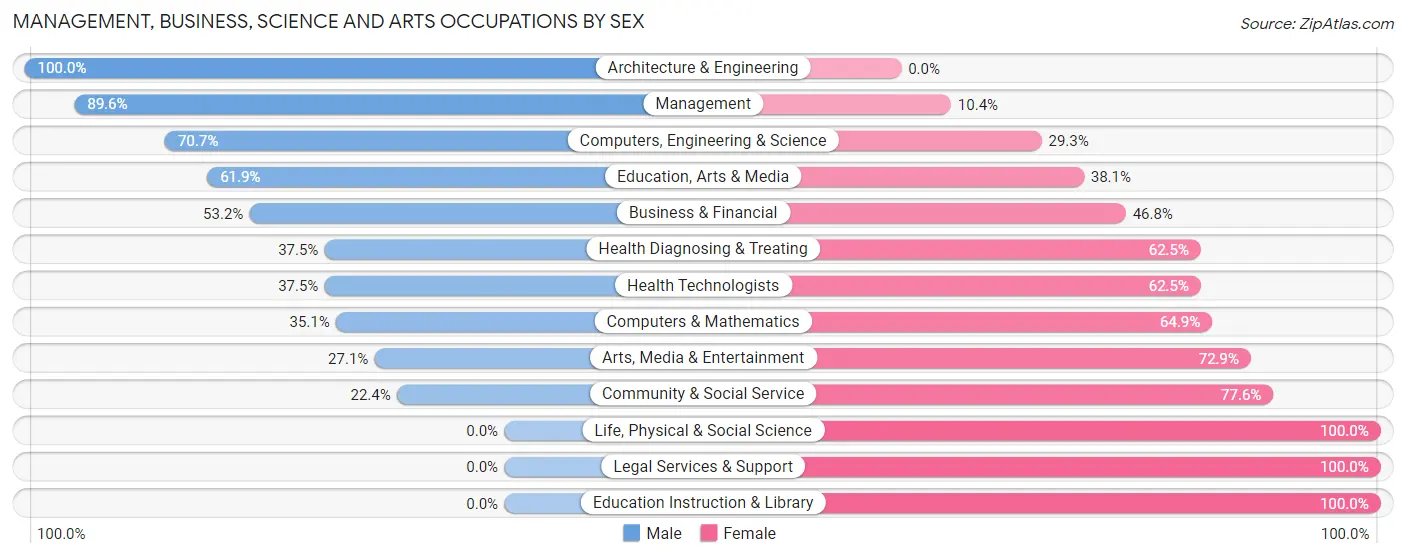
Management, Business, Science and Arts Occupations by Sex
Within the Management, Business, Science and Arts occupations in Brush Prairie, the most male-oriented occupations are Architecture & Engineering (100.0%), Management (89.6%), and Computers, Engineering & Science (70.7%), while the most female-oriented occupations are Life, Physical & Social Science (100.0%), Legal Services & Support (100.0%), and Education Instruction & Library (100.0%).
| Occupation | Male | Female |
| Management | 164 (89.6%) | 19 (10.4%) |
| Business & Financial | 42 (53.2%) | 37 (46.8%) |
| Computers, Engineering & Science | 99 (70.7%) | 41 (29.3%) |
| Computers & Mathematics | 13 (35.1%) | 24 (64.9%) |
| Architecture & Engineering | 86 (100.0%) | 0 (0.0%) |
| Life, Physical & Social Science | 0 (0.0%) | 17 (100.0%) |
| Community & Social Service | 26 (22.4%) | 90 (77.6%) |
| Education, Arts & Media | 13 (61.9%) | 8 (38.1%) |
| Legal Services & Support | 0 (0.0%) | 40 (100.0%) |
| Education Instruction & Library | 0 (0.0%) | 7 (100.0%) |
| Arts, Media & Entertainment | 13 (27.1%) | 35 (72.9%) |
| Health Diagnosing & Treating | 12 (37.5%) | 20 (62.5%) |
| Health Technologists | 12 (37.5%) | 20 (62.5%) |
| Total (Category) | 343 (62.4%) | 207 (37.6%) |
| Total (Overall) | 775 (59.3%) | 533 (40.7%) |
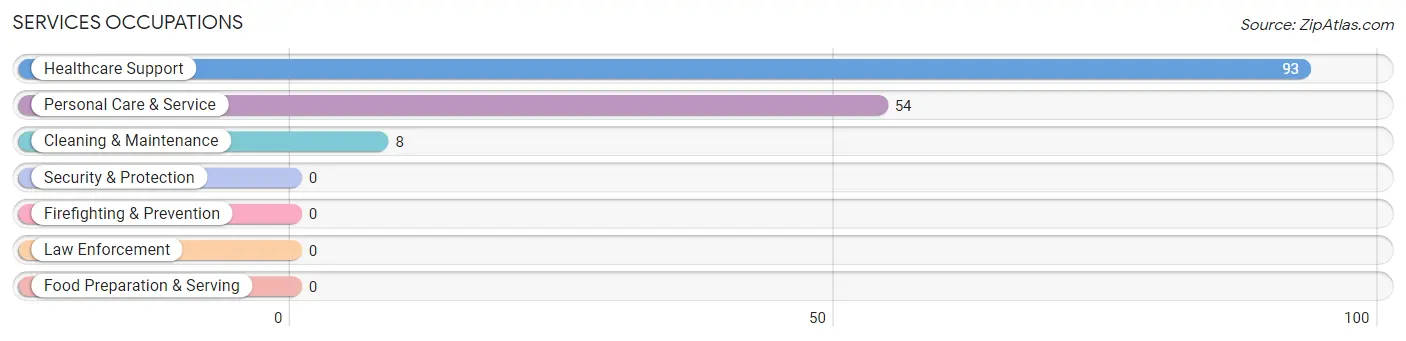
Services Occupations
The most common Services occupations in Brush Prairie are Healthcare Support (93 | 7.1%), Personal Care & Service (54 | 4.1%), and Cleaning & Maintenance (8 | 0.6%).
Services Occupations by Sex
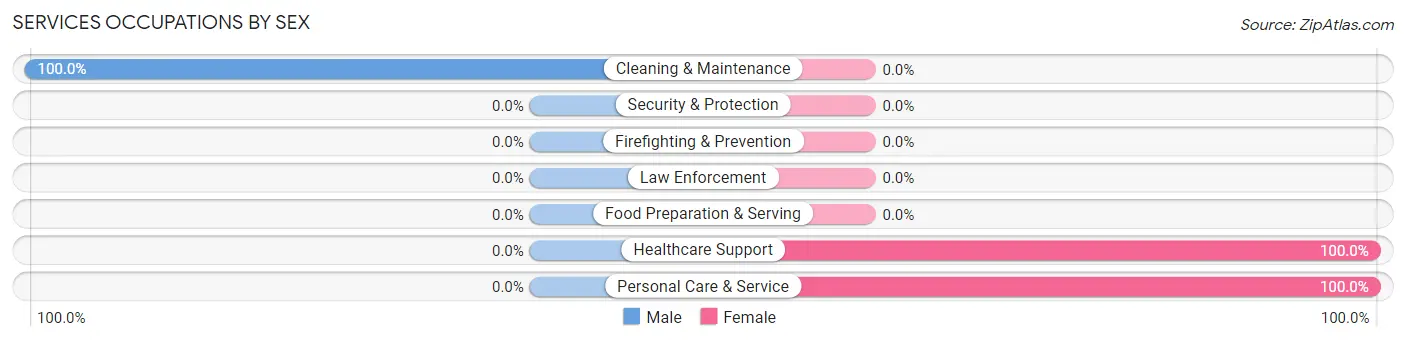
| Occupation | Male | Female |
| Healthcare Support | 0 (0.0%) | 93 (100.0%) |
| Security & Protection | 0 (0.0%) | 0 (0.0%) |
| Firefighting & Prevention | 0 (0.0%) | 0 (0.0%) |
| Law Enforcement | 0 (0.0%) | 0 (0.0%) |
| Food Preparation & Serving | 0 (0.0%) | 0 (0.0%) |
| Cleaning & Maintenance | 8 (100.0%) | 0 (0.0%) |
| Personal Care & Service | 0 (0.0%) | 54 (100.0%) |
| Total (Category) | 8 (5.2%) | 147 (94.8%) |
| Total (Overall) | 775 (59.3%) | 533 (40.7%) |
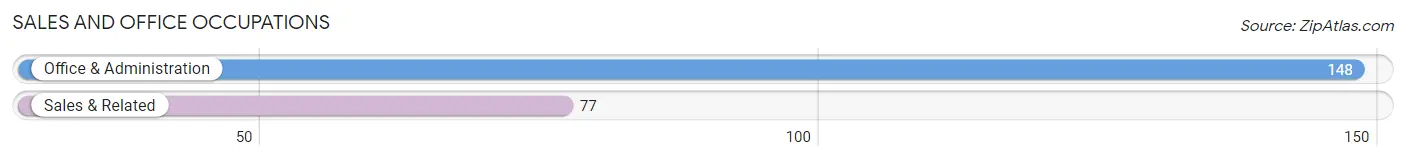
Sales and Office Occupations
The most common Sales and Office occupations in Brush Prairie are Office & Administration (148 | 11.3%), and Sales & Related (77 | 5.9%).
Sales and Office Occupations by Sex
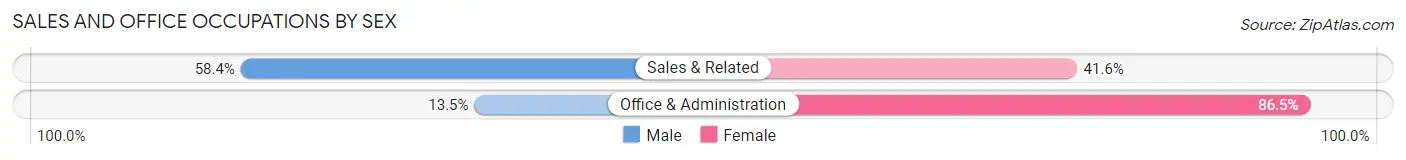
| Occupation | Male | Female |
| Sales & Related | 45 (58.4%) | 32 (41.6%) |
| Office & Administration | 20 (13.5%) | 128 (86.5%) |
| Total (Category) | 65 (28.9%) | 160 (71.1%) |
| Total (Overall) | 775 (59.3%) | 533 (40.7%) |
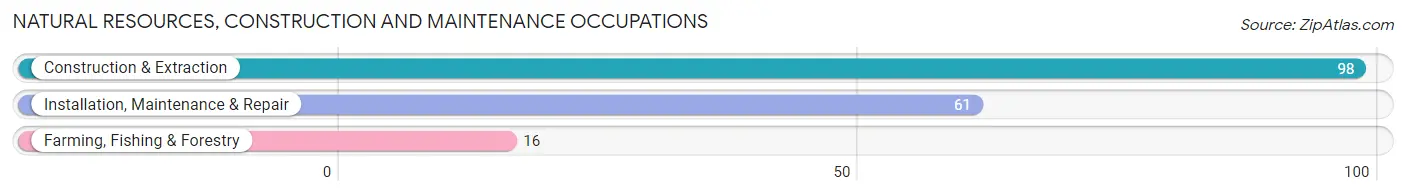
Natural Resources, Construction and Maintenance Occupations
The most common Natural Resources, Construction and Maintenance occupations in Brush Prairie are Construction & Extraction (98 | 7.5%), Installation, Maintenance & Repair (61 | 4.7%), and Farming, Fishing & Forestry (16 | 1.2%).
Natural Resources, Construction and Maintenance Occupations by Sex
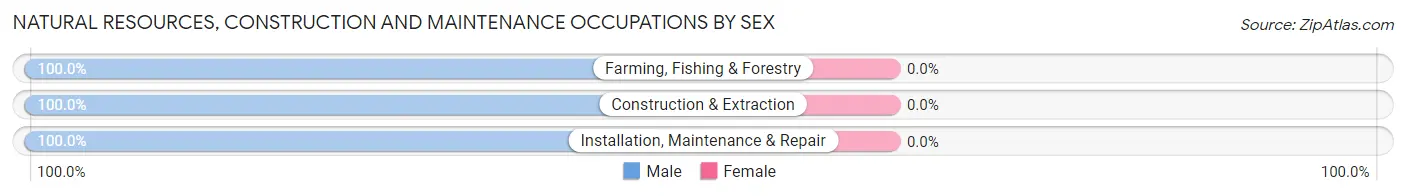
| Occupation | Male | Female |
| Farming, Fishing & Forestry | 16 (100.0%) | 0 (0.0%) |
| Construction & Extraction | 98 (100.0%) | 0 (0.0%) |
| Installation, Maintenance & Repair | 61 (100.0%) | 0 (0.0%) |
| Total (Category) | 175 (100.0%) | 0 (0.0%) |
| Total (Overall) | 775 (59.3%) | 533 (40.7%) |
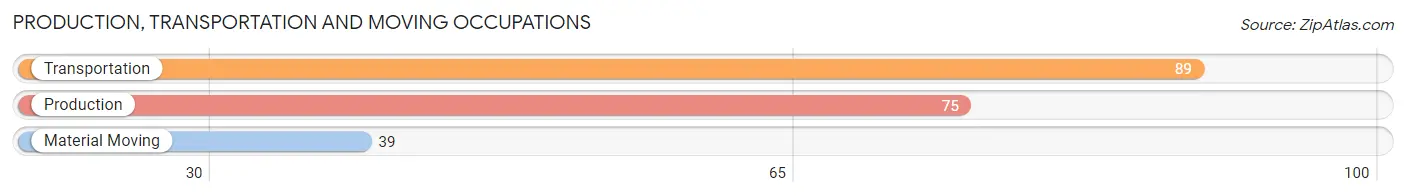
Production, Transportation and Moving Occupations
The most common Production, Transportation and Moving occupations in Brush Prairie are Transportation (89 | 6.8%), Production (75 | 5.7%), and Material Moving (39 | 3.0%).
Production, Transportation and Moving Occupations by Sex
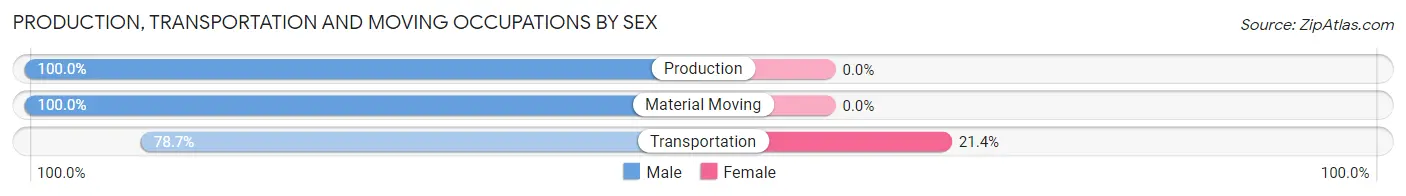
| Occupation | Male | Female |
| Production | 75 (100.0%) | 0 (0.0%) |
| Transportation | 70 (78.6%) | 19 (21.3%) |
| Material Moving | 39 (100.0%) | 0 (0.0%) |
| Total (Category) | 184 (90.6%) | 19 (9.4%) |
| Total (Overall) | 775 (59.3%) | 533 (40.7%) |
Employment Industries by Sex in Brush Prairie
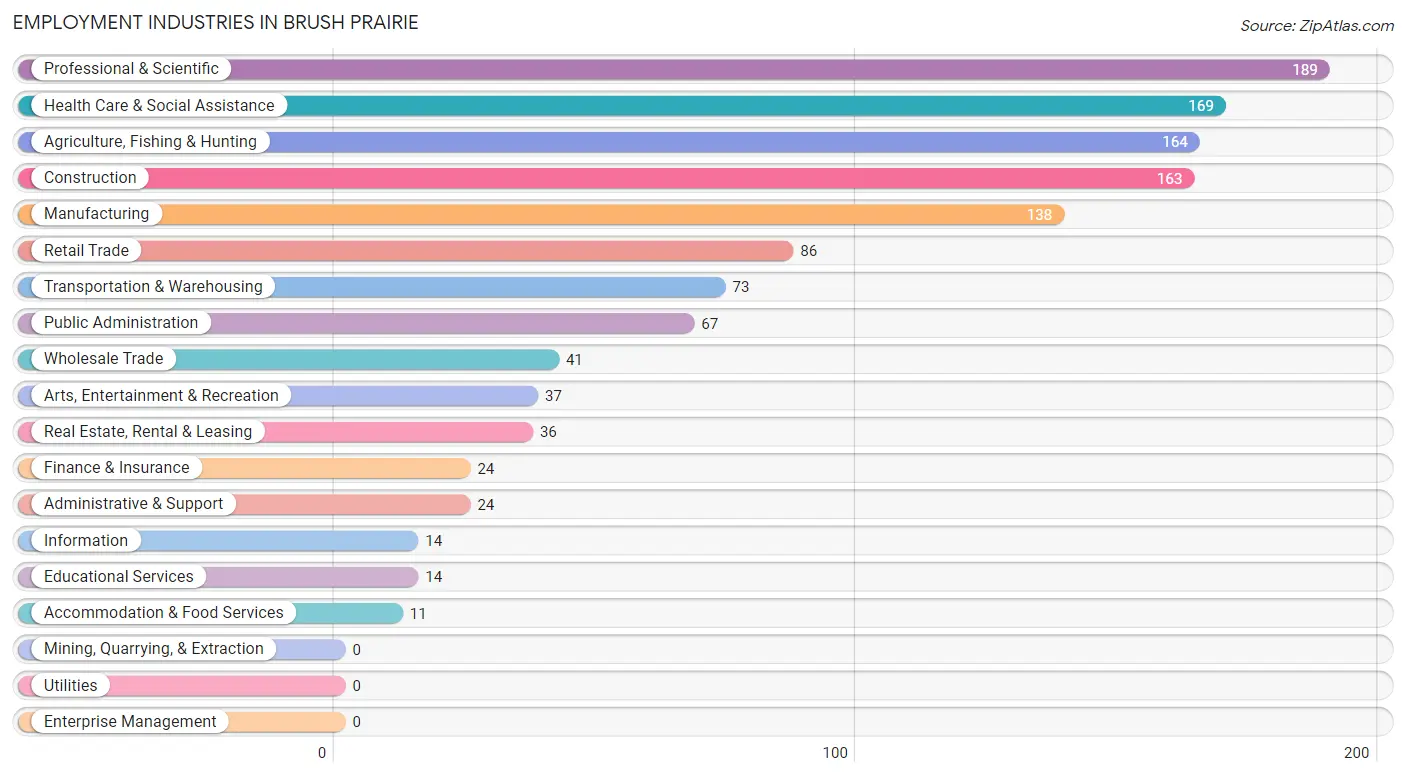
Employment Industries in Brush Prairie
The major employment industries in Brush Prairie include Professional & Scientific (189 | 14.4%), Health Care & Social Assistance (169 | 12.9%), Agriculture, Fishing & Hunting (164 | 12.5%), Construction (163 | 12.5%), and Manufacturing (138 | 10.5%).
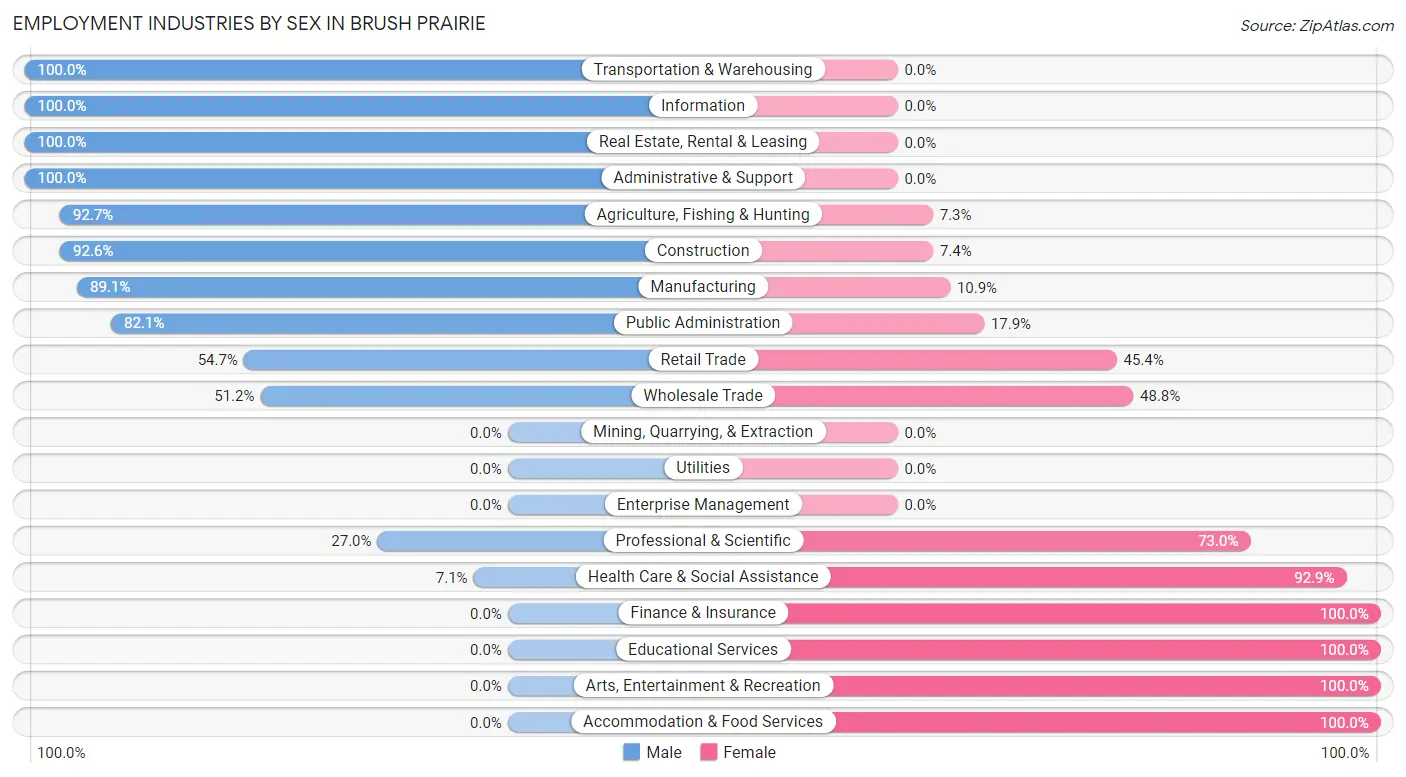
Employment Industries by Sex in Brush Prairie
The Brush Prairie industries that see more men than women are Transportation & Warehousing (100.0%), Information (100.0%), and Real Estate, Rental & Leasing (100.0%), whereas the industries that tend to have a higher number of women are Finance & Insurance (100.0%), Educational Services (100.0%), and Arts, Entertainment & Recreation (100.0%).
| Industry | Male | Female |
| Agriculture, Fishing & Hunting | 152 (92.7%) | 12 (7.3%) |
| Mining, Quarrying, & Extraction | 0 (0.0%) | 0 (0.0%) |
| Construction | 151 (92.6%) | 12 (7.4%) |
| Manufacturing | 123 (89.1%) | 15 (10.9%) |
| Wholesale Trade | 21 (51.2%) | 20 (48.8%) |
| Retail Trade | 47 (54.6%) | 39 (45.4%) |
| Transportation & Warehousing | 73 (100.0%) | 0 (0.0%) |
| Utilities | 0 (0.0%) | 0 (0.0%) |
| Information | 14 (100.0%) | 0 (0.0%) |
| Finance & Insurance | 0 (0.0%) | 24 (100.0%) |
| Real Estate, Rental & Leasing | 36 (100.0%) | 0 (0.0%) |
| Professional & Scientific | 51 (27.0%) | 138 (73.0%) |
| Enterprise Management | 0 (0.0%) | 0 (0.0%) |
| Administrative & Support | 24 (100.0%) | 0 (0.0%) |
| Educational Services | 0 (0.0%) | 14 (100.0%) |
| Health Care & Social Assistance | 12 (7.1%) | 157 (92.9%) |
| Arts, Entertainment & Recreation | 0 (0.0%) | 37 (100.0%) |
| Accommodation & Food Services | 0 (0.0%) | 11 (100.0%) |
| Public Administration | 55 (82.1%) | 12 (17.9%) |
| Total | 775 (59.3%) | 533 (40.7%) |
Education in Brush Prairie
School Enrollment in Brush Prairie
The most common levels of schooling among the 429 students in Brush Prairie are elementary school (113 | 26.3%), middle school (70 | 16.3%), and high school (65 | 15.1%).
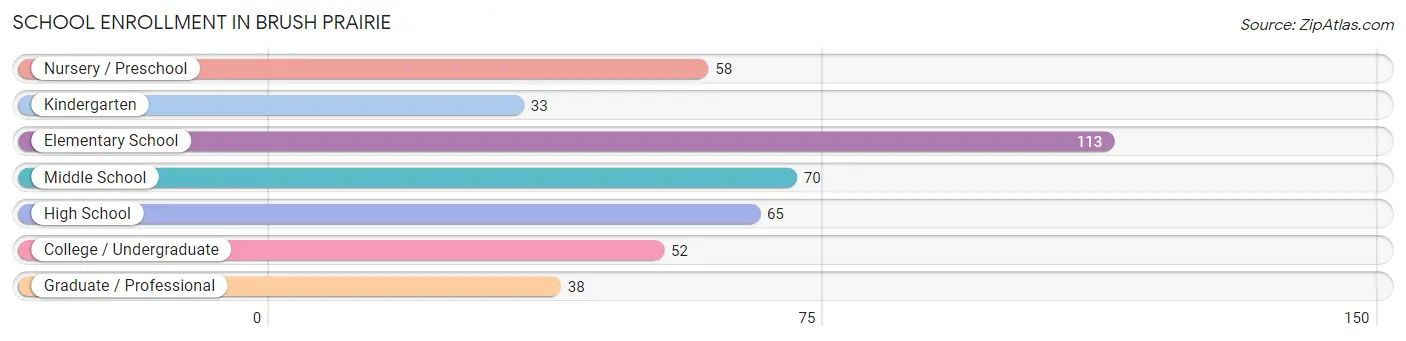
| School Level | # Students | % Students |
| Nursery / Preschool | 58 | 13.5% |
| Kindergarten | 33 | 7.7% |
| Elementary School | 113 | 26.3% |
| Middle School | 70 | 16.3% |
| High School | 65 | 15.1% |
| College / Undergraduate | 52 | 12.1% |
| Graduate / Professional | 38 | 8.9% |
| Total | 429 | 100.0% |
School Enrollment by Age by Funding Source in Brush Prairie
Out of a total of 429 students who are enrolled in schools in Brush Prairie, 61 (14.2%) attend a private institution, while the remaining 368 (85.8%) are enrolled in public schools. The age group of 35 years and over has the highest likelihood of being enrolled in private schools, with 11 (27.5% in the age bracket) enrolled. Conversely, the age group of 3 to 4 year olds has the lowest likelihood of being enrolled in a private school, with 37 (100.0% in the age bracket) attending a public institution.
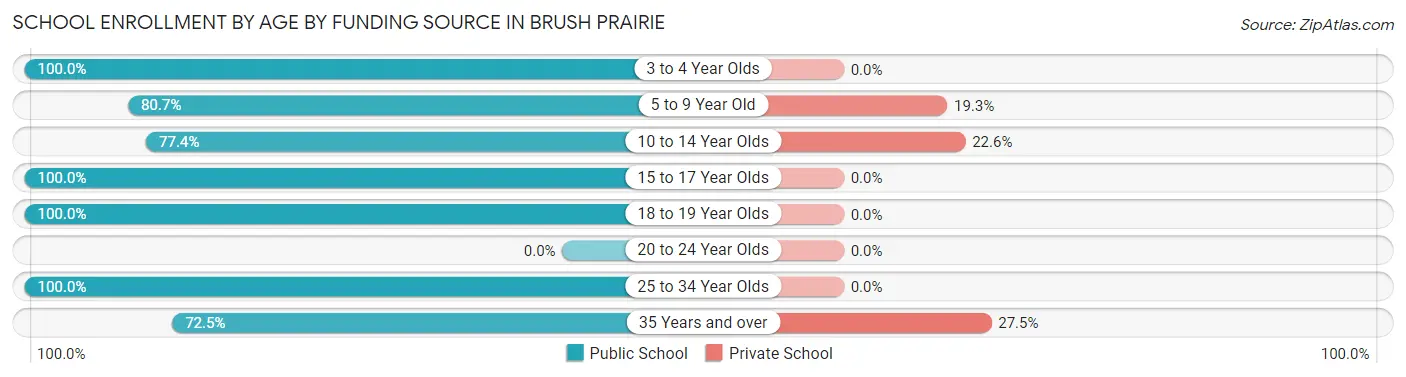
| Age Bracket | Public School | Private School |
| 3 to 4 Year Olds | 37 (100.0%) | 0 (0.0%) |
| 5 to 9 Year Old | 109 (80.7%) | 26 (19.3%) |
| 10 to 14 Year Olds | 82 (77.4%) | 24 (22.6%) |
| 15 to 17 Year Olds | 41 (100.0%) | 0 (0.0%) |
| 18 to 19 Year Olds | 20 (100.0%) | 0 (0.0%) |
| 20 to 24 Year Olds | 0 (0.0%) | 0 (0.0%) |
| 25 to 34 Year Olds | 50 (100.0%) | 0 (0.0%) |
| 35 Years and over | 29 (72.5%) | 11 (27.5%) |
| Total | 368 (85.8%) | 61 (14.2%) |
Educational Attainment by Field of Study in Brush Prairie
Bio, nature & agricultural (174 | 25.5%), social sciences (79 | 11.6%), engineering (66 | 9.7%), business (59 | 8.6%), and liberal arts & history (58 | 8.5%) are the most common fields of study among 682 individuals in Brush Prairie who have obtained a bachelor's degree or higher.
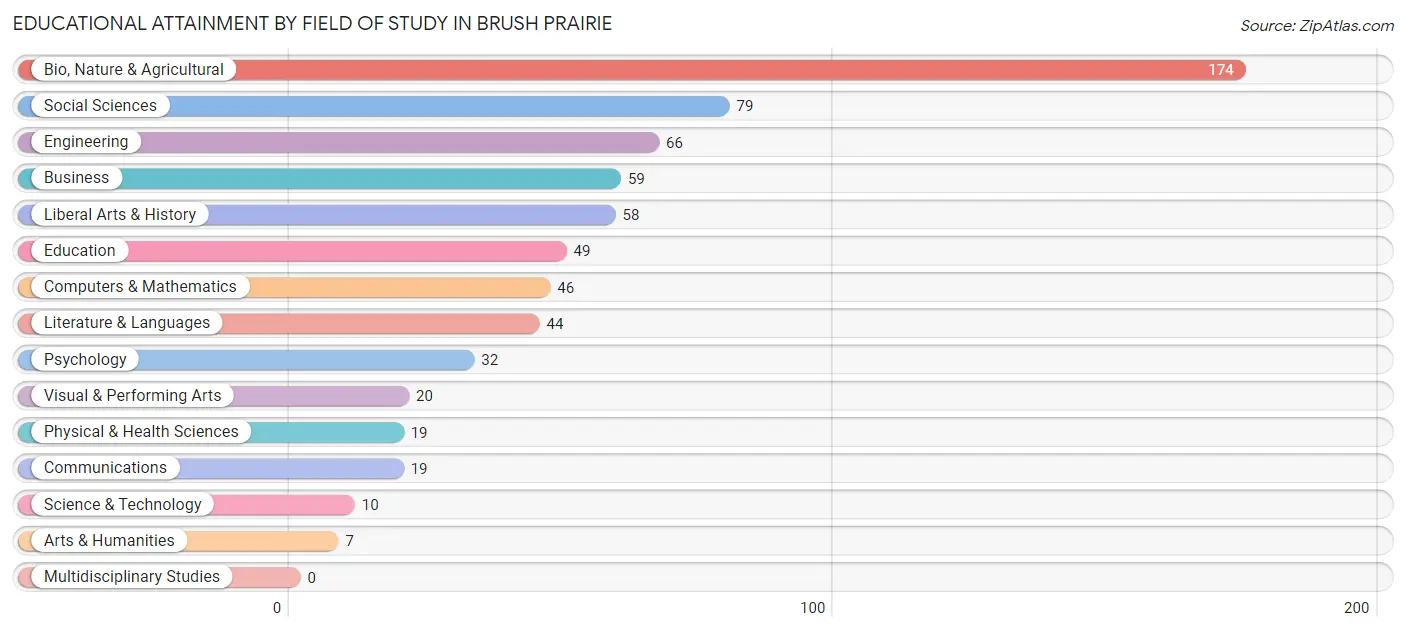
| Field of Study | # Graduates | % Graduates |
| Computers & Mathematics | 46 | 6.7% |
| Bio, Nature & Agricultural | 174 | 25.5% |
| Physical & Health Sciences | 19 | 2.8% |
| Psychology | 32 | 4.7% |
| Social Sciences | 79 | 11.6% |
| Engineering | 66 | 9.7% |
| Multidisciplinary Studies | 0 | 0.0% |
| Science & Technology | 10 | 1.5% |
| Business | 59 | 8.6% |
| Education | 49 | 7.2% |
| Literature & Languages | 44 | 6.5% |
| Liberal Arts & History | 58 | 8.5% |
| Visual & Performing Arts | 20 | 2.9% |
| Communications | 19 | 2.8% |
| Arts & Humanities | 7 | 1.0% |
| Total | 682 | 100.0% |
Transportation & Commute in Brush Prairie
Vehicle Availability by Sex in Brush Prairie
The most prevalent vehicle ownership categories in Brush Prairie are males with 3 vehicles (385, accounting for 50.1%) and females with 3 vehicles (137, making up 78.7%).
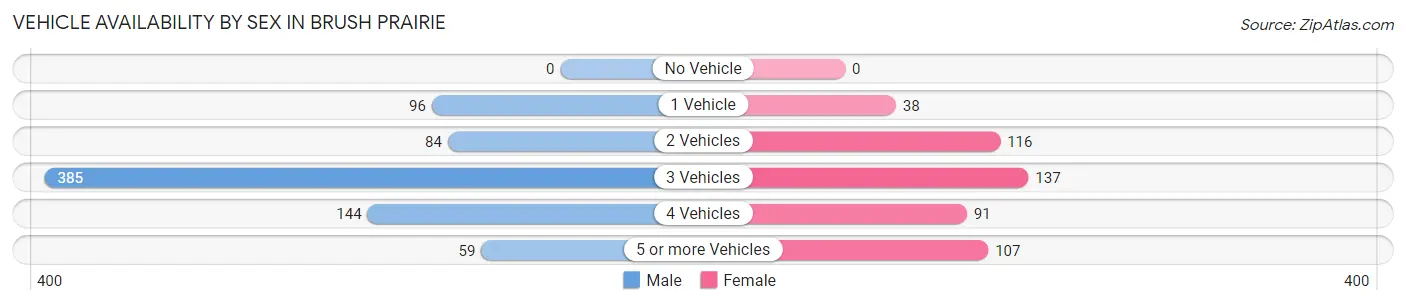
| Vehicles Available | Male | Female |
| No Vehicle | 0 (0.0%) | 0 (0.0%) |
| 1 Vehicle | 96 (12.5%) | 38 (7.8%) |
| 2 Vehicles | 84 (10.9%) | 116 (23.7%) |
| 3 Vehicles | 385 (50.1%) | 137 (28.0%) |
| 4 Vehicles | 144 (18.8%) | 91 (18.6%) |
| 5 or more Vehicles | 59 (7.7%) | 107 (21.9%) |
| Total | 768 (100.0%) | 489 (100.0%) |
Commute Time in Brush Prairie
The most frequently occuring commute durations in Brush Prairie are 20 to 24 minutes (215 commuters, 23.1%), 25 to 29 minutes (141 commuters, 15.1%), and 15 to 19 minutes (139 commuters, 14.9%).
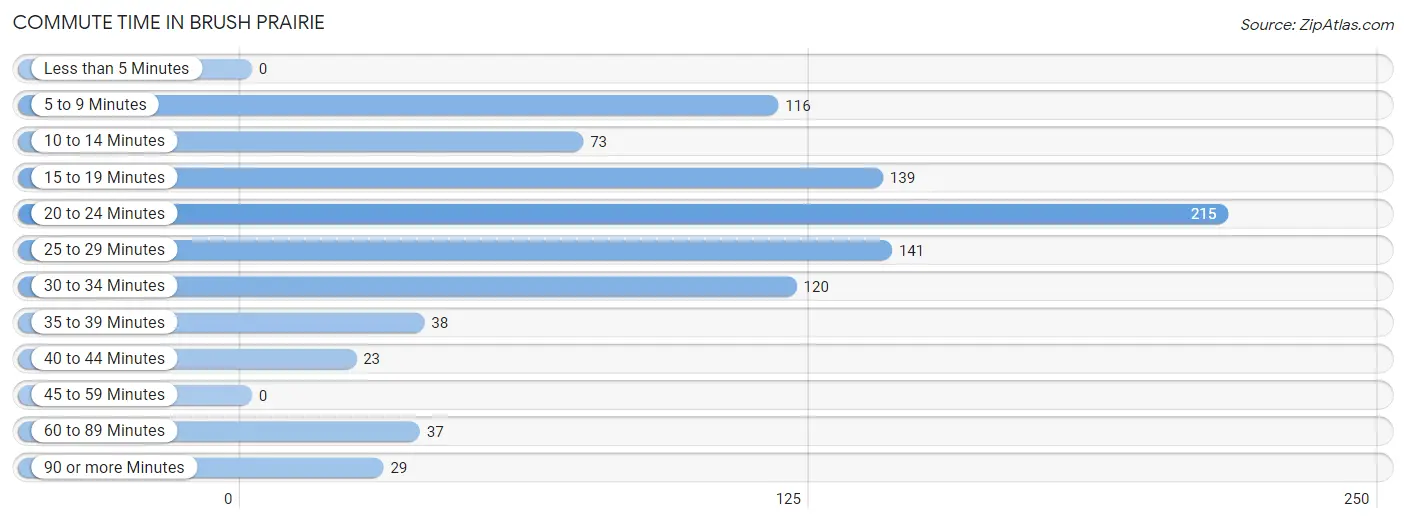
| Commute Time | # Commuters | % Commuters |
| Less than 5 Minutes | 0 | 0.0% |
| 5 to 9 Minutes | 116 | 12.5% |
| 10 to 14 Minutes | 73 | 7.8% |
| 15 to 19 Minutes | 139 | 14.9% |
| 20 to 24 Minutes | 215 | 23.1% |
| 25 to 29 Minutes | 141 | 15.1% |
| 30 to 34 Minutes | 120 | 12.9% |
| 35 to 39 Minutes | 38 | 4.1% |
| 40 to 44 Minutes | 23 | 2.5% |
| 45 to 59 Minutes | 0 | 0.0% |
| 60 to 89 Minutes | 37 | 4.0% |
| 90 or more Minutes | 29 | 3.1% |
Commute Time by Sex in Brush Prairie
The most common commute times in Brush Prairie are 30 to 34 minutes (95 commuters, 17.1%) for males and 20 to 24 minutes (122 commuters, 32.5%) for females.
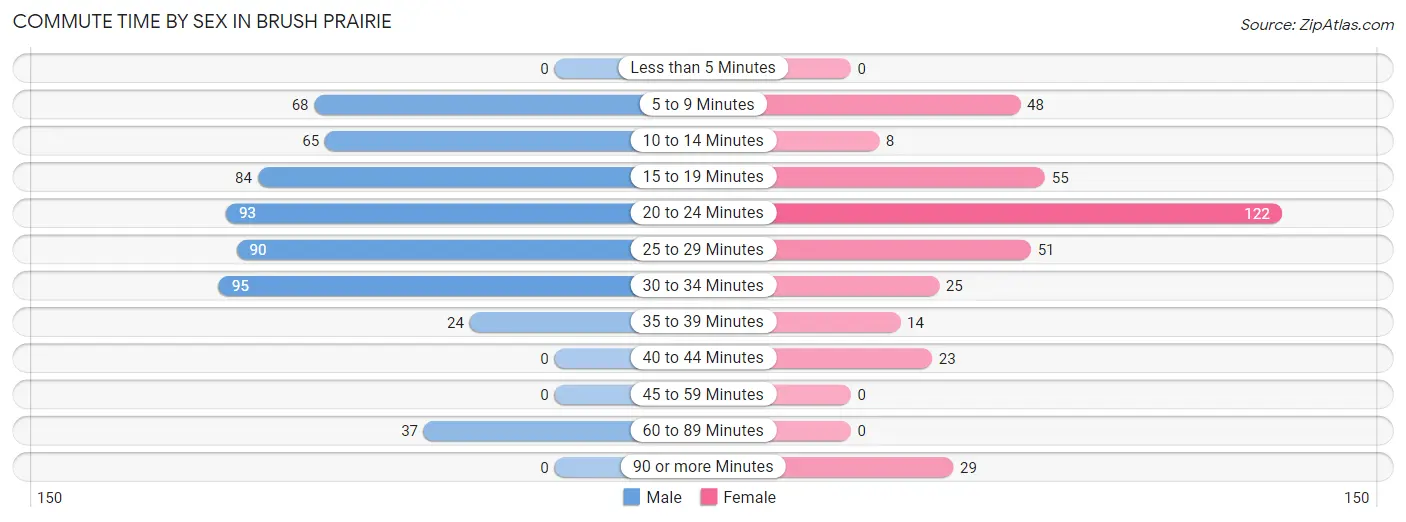
| Commute Time | Male | Female |
| Less than 5 Minutes | 0 (0.0%) | 0 (0.0%) |
| 5 to 9 Minutes | 68 (12.2%) | 48 (12.8%) |
| 10 to 14 Minutes | 65 (11.7%) | 8 (2.1%) |
| 15 to 19 Minutes | 84 (15.1%) | 55 (14.7%) |
| 20 to 24 Minutes | 93 (16.7%) | 122 (32.5%) |
| 25 to 29 Minutes | 90 (16.2%) | 51 (13.6%) |
| 30 to 34 Minutes | 95 (17.1%) | 25 (6.7%) |
| 35 to 39 Minutes | 24 (4.3%) | 14 (3.7%) |
| 40 to 44 Minutes | 0 (0.0%) | 23 (6.1%) |
| 45 to 59 Minutes | 0 (0.0%) | 0 (0.0%) |
| 60 to 89 Minutes | 37 (6.7%) | 0 (0.0%) |
| 90 or more Minutes | 0 (0.0%) | 29 (7.7%) |
Time of Departure to Work by Sex in Brush Prairie
The most frequent times of departure to work in Brush Prairie are 6:00 AM to 6:29 AM (120, 21.6%) for males and 7:00 AM to 7:29 AM (95, 25.3%) for females.
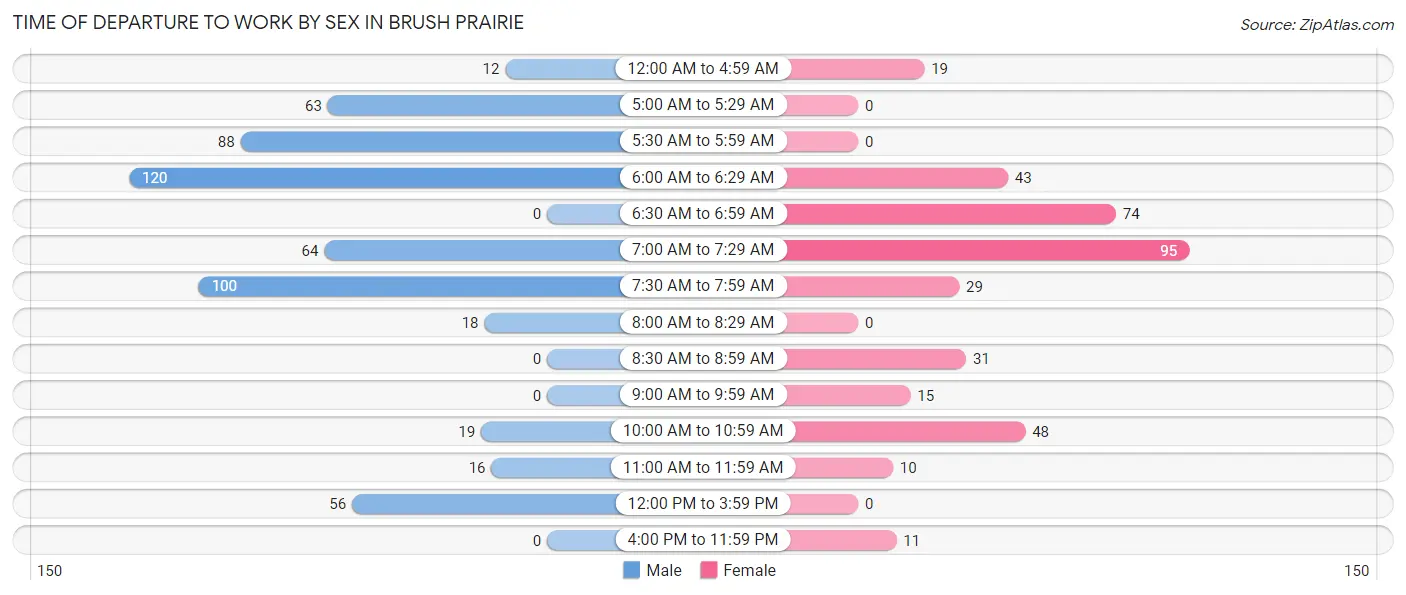
| Time of Departure | Male | Female |
| 12:00 AM to 4:59 AM | 12 (2.2%) | 19 (5.1%) |
| 5:00 AM to 5:29 AM | 63 (11.3%) | 0 (0.0%) |
| 5:30 AM to 5:59 AM | 88 (15.8%) | 0 (0.0%) |
| 6:00 AM to 6:29 AM | 120 (21.6%) | 43 (11.5%) |
| 6:30 AM to 6:59 AM | 0 (0.0%) | 74 (19.7%) |
| 7:00 AM to 7:29 AM | 64 (11.5%) | 95 (25.3%) |
| 7:30 AM to 7:59 AM | 100 (18.0%) | 29 (7.7%) |
| 8:00 AM to 8:29 AM | 18 (3.2%) | 0 (0.0%) |
| 8:30 AM to 8:59 AM | 0 (0.0%) | 31 (8.3%) |
| 9:00 AM to 9:59 AM | 0 (0.0%) | 15 (4.0%) |
| 10:00 AM to 10:59 AM | 19 (3.4%) | 48 (12.8%) |
| 11:00 AM to 11:59 AM | 16 (2.9%) | 10 (2.7%) |
| 12:00 PM to 3:59 PM | 56 (10.1%) | 0 (0.0%) |
| 4:00 PM to 11:59 PM | 0 (0.0%) | 11 (2.9%) |
| Total | 556 (100.0%) | 375 (100.0%) |
Housing Occupancy in Brush Prairie
Occupancy by Ownership in Brush Prairie
Of the total 1,041 dwellings in Brush Prairie, owner-occupied units account for 839 (80.6%), while renter-occupied units make up 202 (19.4%).
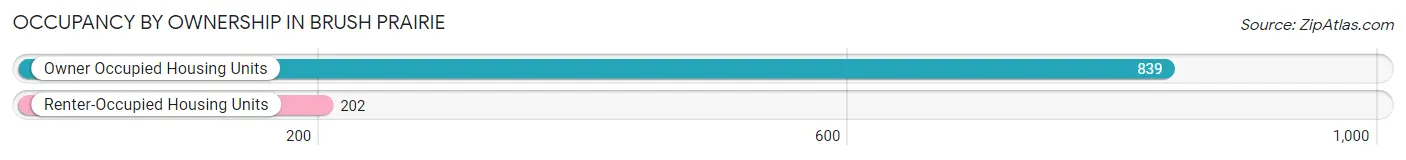
| Occupancy | # Housing Units | % Housing Units |
| Owner Occupied Housing Units | 839 | 80.6% |
| Renter-Occupied Housing Units | 202 | 19.4% |
| Total Occupied Housing Units | 1,041 | 100.0% |
Occupancy by Household Size in Brush Prairie
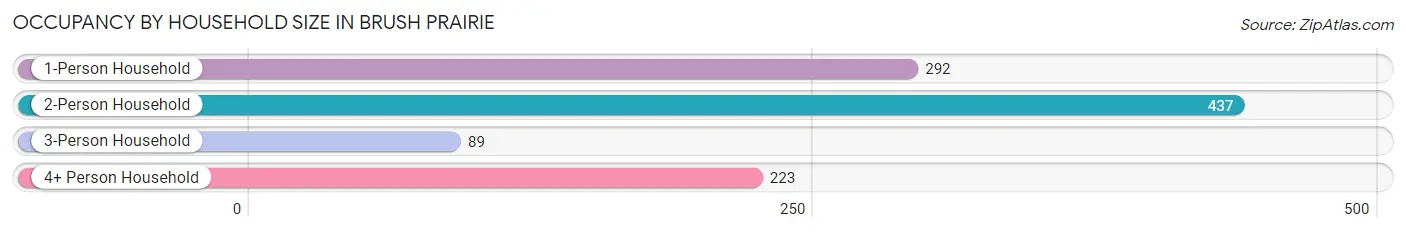
| Household Size | # Housing Units | % Housing Units |
| 1-Person Household | 292 | 28.1% |
| 2-Person Household | 437 | 42.0% |
| 3-Person Household | 89 | 8.6% |
| 4+ Person Household | 223 | 21.4% |
| Total Housing Units | 1,041 | 100.0% |
Occupancy by Ownership by Household Size in Brush Prairie
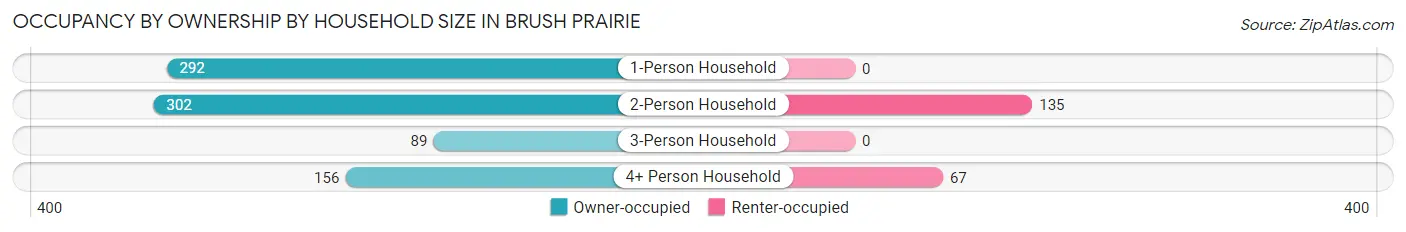
| Household Size | Owner-occupied | Renter-occupied |
| 1-Person Household | 292 (100.0%) | 0 (0.0%) |
| 2-Person Household | 302 (69.1%) | 135 (30.9%) |
| 3-Person Household | 89 (100.0%) | 0 (0.0%) |
| 4+ Person Household | 156 (70.0%) | 67 (30.0%) |
| Total Housing Units | 839 (80.6%) | 202 (19.4%) |
Occupancy by Educational Attainment in Brush Prairie
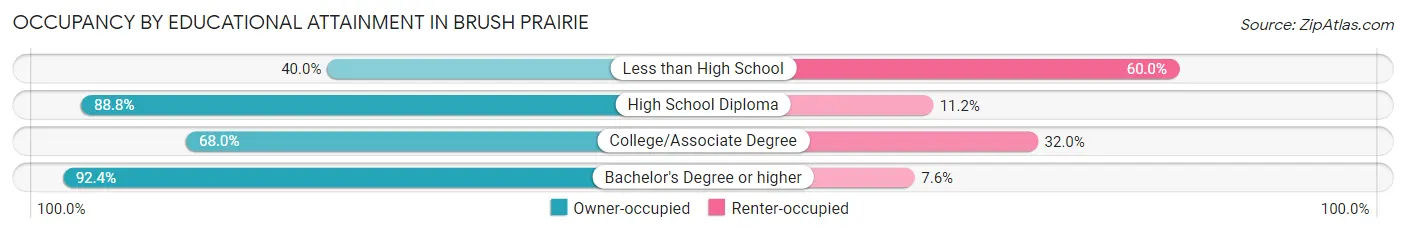
| Household Size | Owner-occupied | Renter-occupied |
| Less than High School | 8 (40.0%) | 12 (60.0%) |
| High School Diploma | 198 (88.8%) | 25 (11.2%) |
| College/Associate Degree | 291 (68.0%) | 137 (32.0%) |
| Bachelor's Degree or higher | 342 (92.4%) | 28 (7.6%) |
Occupancy by Age of Householder in Brush Prairie
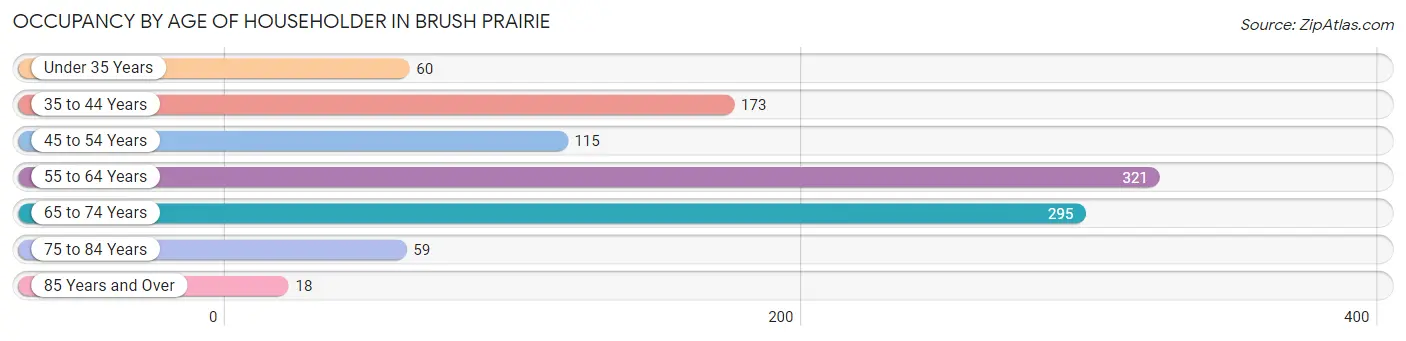
| Age Bracket | # Households | % Households |
| Under 35 Years | 60 | 5.8% |
| 35 to 44 Years | 173 | 16.6% |
| 45 to 54 Years | 115 | 11.1% |
| 55 to 64 Years | 321 | 30.8% |
| 65 to 74 Years | 295 | 28.3% |
| 75 to 84 Years | 59 | 5.7% |
| 85 Years and Over | 18 | 1.7% |
| Total | 1,041 | 100.0% |
Housing Finances in Brush Prairie
Median Income by Occupancy in Brush Prairie
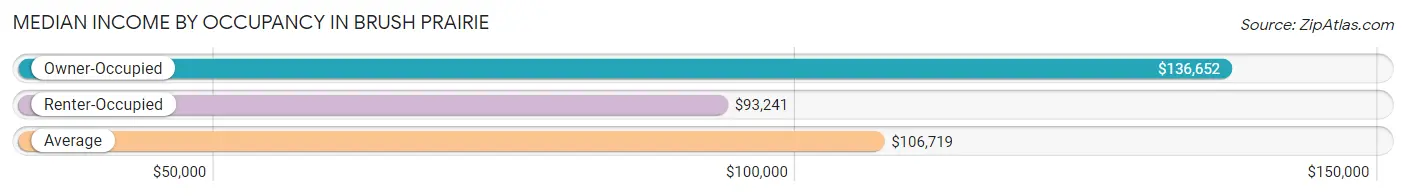
| Occupancy Type | # Households | Median Income |
| Owner-Occupied | 839 (80.6%) | $136,652 |
| Renter-Occupied | 202 (19.4%) | $93,241 |
| Average | 1,041 (100.0%) | $106,719 |
Occupancy by Householder Income Bracket in Brush Prairie
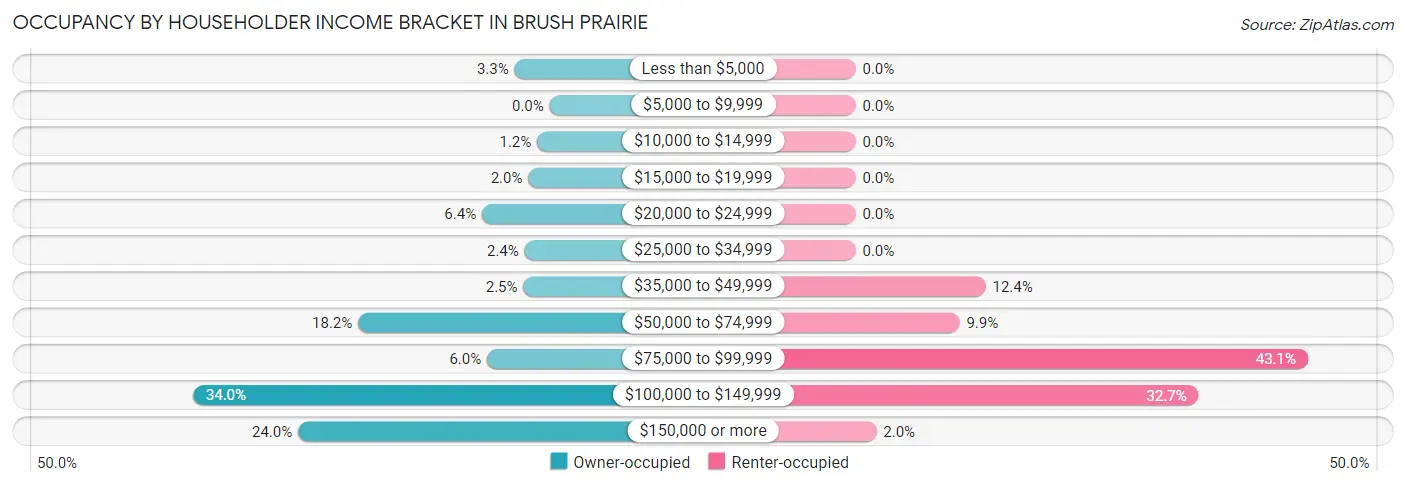
| Income Bracket | Owner-occupied | Renter-occupied |
| Less than $5,000 | 28 (3.3%) | 0 (0.0%) |
| $5,000 to $9,999 | 0 (0.0%) | 0 (0.0%) |
| $10,000 to $14,999 | 10 (1.2%) | 0 (0.0%) |
| $15,000 to $19,999 | 17 (2.0%) | 0 (0.0%) |
| $20,000 to $24,999 | 54 (6.4%) | 0 (0.0%) |
| $25,000 to $34,999 | 20 (2.4%) | 0 (0.0%) |
| $35,000 to $49,999 | 21 (2.5%) | 25 (12.4%) |
| $50,000 to $74,999 | 153 (18.2%) | 20 (9.9%) |
| $75,000 to $99,999 | 50 (6.0%) | 87 (43.1%) |
| $100,000 to $149,999 | 285 (34.0%) | 66 (32.7%) |
| $150,000 or more | 201 (24.0%) | 4 (2.0%) |
| Total | 839 (100.0%) | 202 (100.0%) |
Monthly Housing Cost Tiers in Brush Prairie
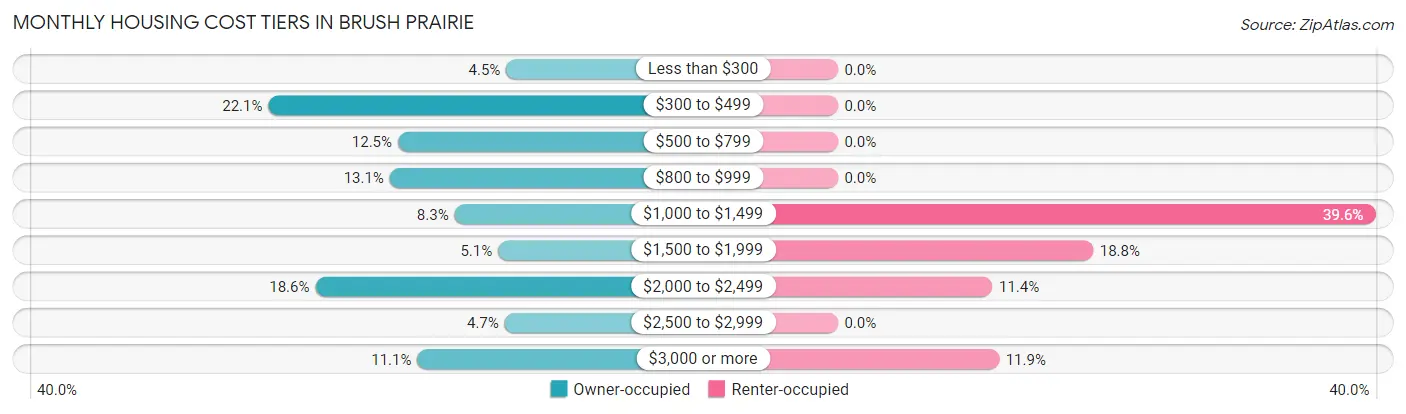
| Monthly Cost | Owner-occupied | Renter-occupied |
| Less than $300 | 38 (4.5%) | 0 (0.0%) |
| $300 to $499 | 185 (22.1%) | 0 (0.0%) |
| $500 to $799 | 105 (12.5%) | 0 (0.0%) |
| $800 to $999 | 110 (13.1%) | 0 (0.0%) |
| $1,000 to $1,499 | 70 (8.3%) | 80 (39.6%) |
| $1,500 to $1,999 | 43 (5.1%) | 38 (18.8%) |
| $2,000 to $2,499 | 156 (18.6%) | 23 (11.4%) |
| $2,500 to $2,999 | 39 (4.6%) | 0 (0.0%) |
| $3,000 or more | 93 (11.1%) | 24 (11.9%) |
| Total | 839 (100.0%) | 202 (100.0%) |
Physical Housing Characteristics in Brush Prairie
Housing Structures in Brush Prairie
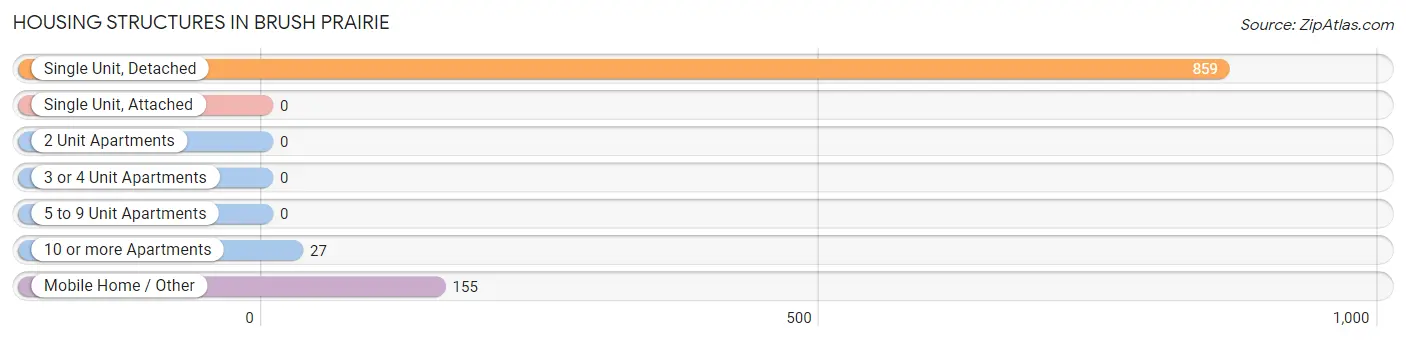
| Structure Type | # Housing Units | % Housing Units |
| Single Unit, Detached | 859 | 82.5% |
| Single Unit, Attached | 0 | 0.0% |
| 2 Unit Apartments | 0 | 0.0% |
| 3 or 4 Unit Apartments | 0 | 0.0% |
| 5 to 9 Unit Apartments | 0 | 0.0% |
| 10 or more Apartments | 27 | 2.6% |
| Mobile Home / Other | 155 | 14.9% |
| Total | 1,041 | 100.0% |
Housing Structures by Occupancy in Brush Prairie
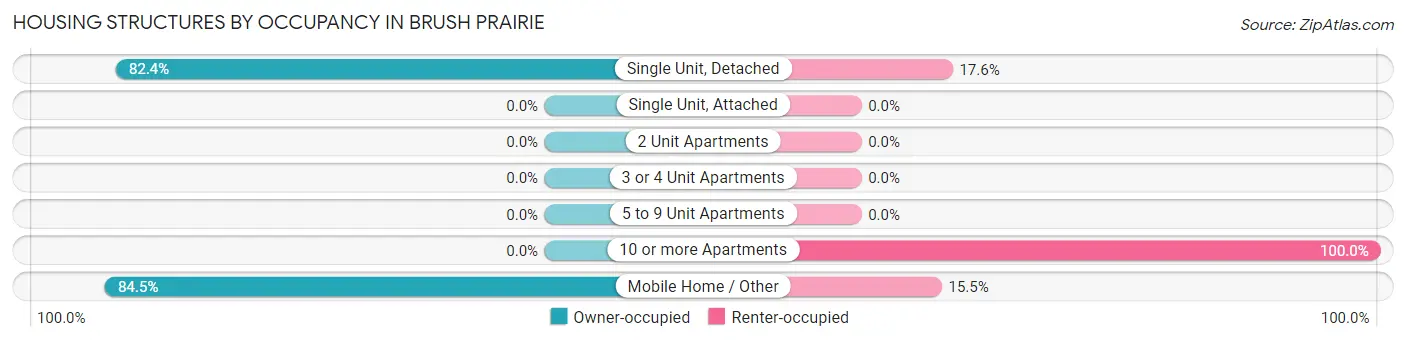
| Structure Type | Owner-occupied | Renter-occupied |
| Single Unit, Detached | 708 (82.4%) | 151 (17.6%) |
| Single Unit, Attached | 0 (0.0%) | 0 (0.0%) |
| 2 Unit Apartments | 0 (0.0%) | 0 (0.0%) |
| 3 or 4 Unit Apartments | 0 (0.0%) | 0 (0.0%) |
| 5 to 9 Unit Apartments | 0 (0.0%) | 0 (0.0%) |
| 10 or more Apartments | 0 (0.0%) | 27 (100.0%) |
| Mobile Home / Other | 131 (84.5%) | 24 (15.5%) |
| Total | 839 (80.6%) | 202 (19.4%) |
Housing Structures by Number of Rooms in Brush Prairie
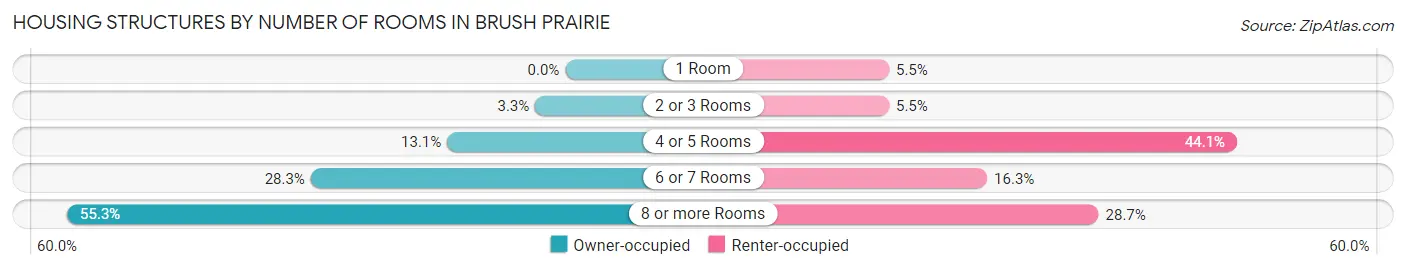
| Number of Rooms | Owner-occupied | Renter-occupied |
| 1 Room | 0 (0.0%) | 11 (5.4%) |
| 2 or 3 Rooms | 28 (3.3%) | 11 (5.4%) |
| 4 or 5 Rooms | 110 (13.1%) | 89 (44.1%) |
| 6 or 7 Rooms | 237 (28.2%) | 33 (16.3%) |
| 8 or more Rooms | 464 (55.3%) | 58 (28.7%) |
| Total | 839 (100.0%) | 202 (100.0%) |
Housing Structure by Heating Type in Brush Prairie
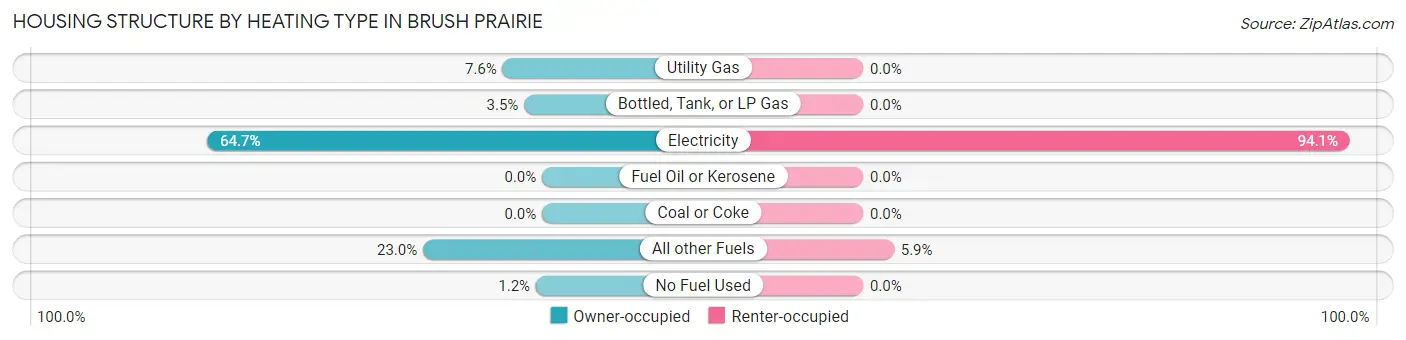
| Heating Type | Owner-occupied | Renter-occupied |
| Utility Gas | 64 (7.6%) | 0 (0.0%) |
| Bottled, Tank, or LP Gas | 29 (3.5%) | 0 (0.0%) |
| Electricity | 543 (64.7%) | 190 (94.1%) |
| Fuel Oil or Kerosene | 0 (0.0%) | 0 (0.0%) |
| Coal or Coke | 0 (0.0%) | 0 (0.0%) |
| All other Fuels | 193 (23.0%) | 12 (5.9%) |
| No Fuel Used | 10 (1.2%) | 0 (0.0%) |
| Total | 839 (100.0%) | 202 (100.0%) |
Household Vehicle Usage in Brush Prairie
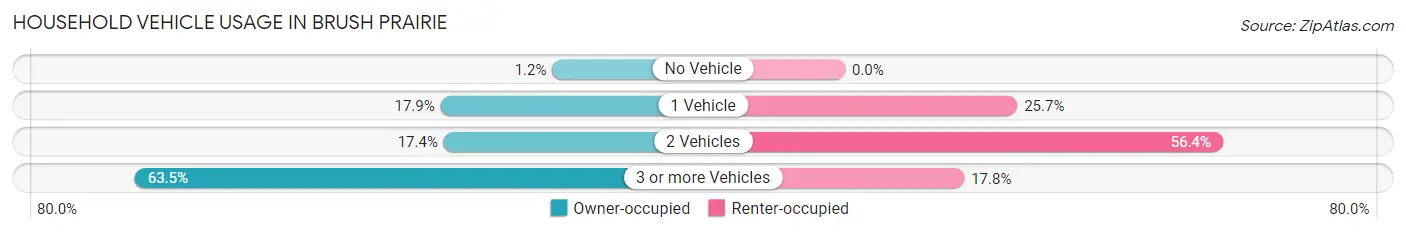
| Vehicles per Household | Owner-occupied | Renter-occupied |
| No Vehicle | 10 (1.2%) | 0 (0.0%) |
| 1 Vehicle | 150 (17.9%) | 52 (25.7%) |
| 2 Vehicles | 146 (17.4%) | 114 (56.4%) |
| 3 or more Vehicles | 533 (63.5%) | 36 (17.8%) |
| Total | 839 (100.0%) | 202 (100.0%) |
Real Estate & Mortgages in Brush Prairie
Real Estate and Mortgage Overview in Brush Prairie
| Characteristic | Without Mortgage | With Mortgage |
| Housing Units | 440 | 399 |
| Median Property Value | $295,600 | $599,500 |
| Median Household Income | $105,313 | $162 |
| Monthly Housing Costs | $513 | $93 |
| Real Estate Taxes | - | - |
Property Value by Mortgage Status in Brush Prairie
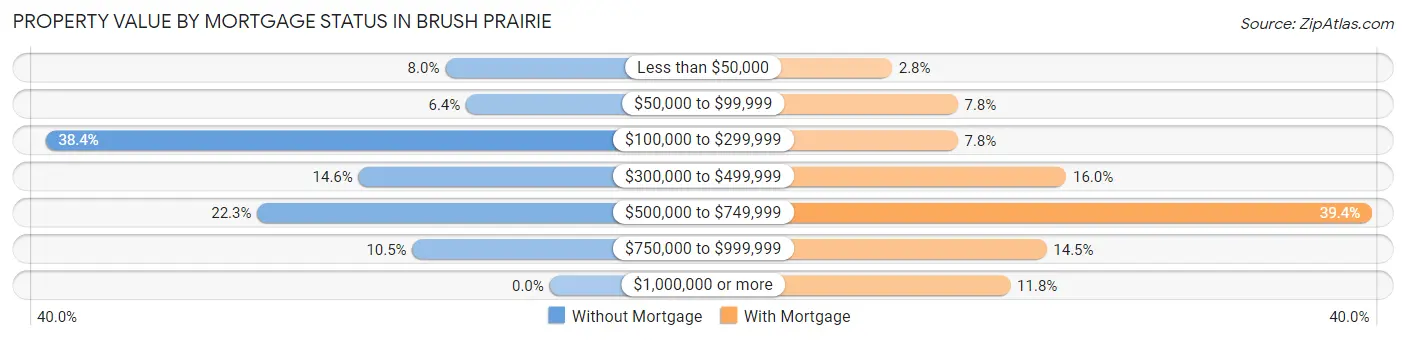
| Property Value | Without Mortgage | With Mortgage |
| Less than $50,000 | 35 (8.0%) | 11 (2.8%) |
| $50,000 to $99,999 | 28 (6.4%) | 31 (7.8%) |
| $100,000 to $299,999 | 169 (38.4%) | 31 (7.8%) |
| $300,000 to $499,999 | 64 (14.5%) | 64 (16.0%) |
| $500,000 to $749,999 | 98 (22.3%) | 157 (39.4%) |
| $750,000 to $999,999 | 46 (10.4%) | 58 (14.5%) |
| $1,000,000 or more | 0 (0.0%) | 47 (11.8%) |
| Total | 440 (100.0%) | 399 (100.0%) |
Household Income by Mortgage Status in Brush Prairie
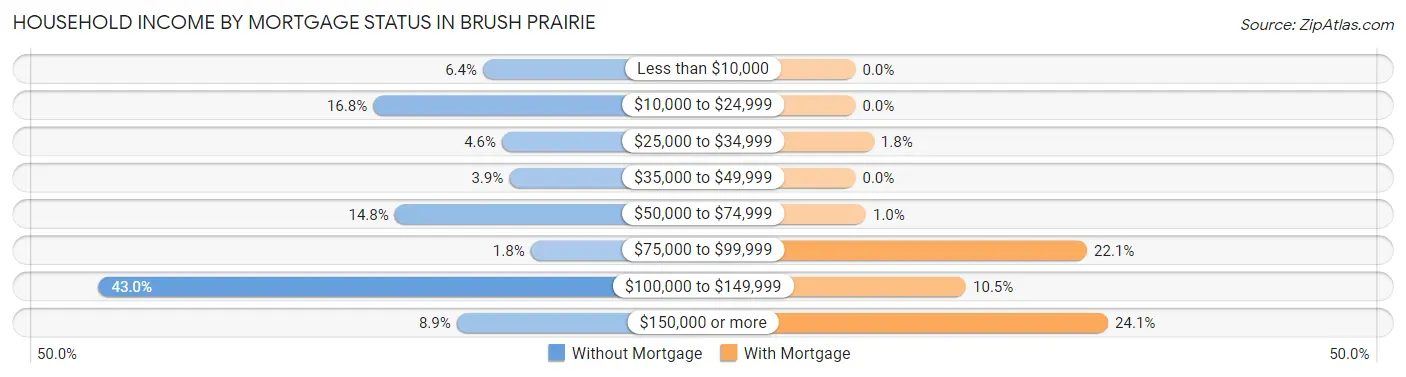
| Household Income | Without Mortgage | With Mortgage |
| Less than $10,000 | 28 (6.4%) | 0 (0.0%) |
| $10,000 to $24,999 | 74 (16.8%) | 0 (0.0%) |
| $25,000 to $34,999 | 20 (4.5%) | 7 (1.8%) |
| $35,000 to $49,999 | 17 (3.9%) | 0 (0.0%) |
| $50,000 to $74,999 | 65 (14.8%) | 4 (1.0%) |
| $75,000 to $99,999 | 8 (1.8%) | 88 (22.1%) |
| $100,000 to $149,999 | 189 (42.9%) | 42 (10.5%) |
| $150,000 or more | 39 (8.9%) | 96 (24.1%) |
| Total | 440 (100.0%) | 399 (100.0%) |
Property Value to Household Income Ratio in Brush Prairie
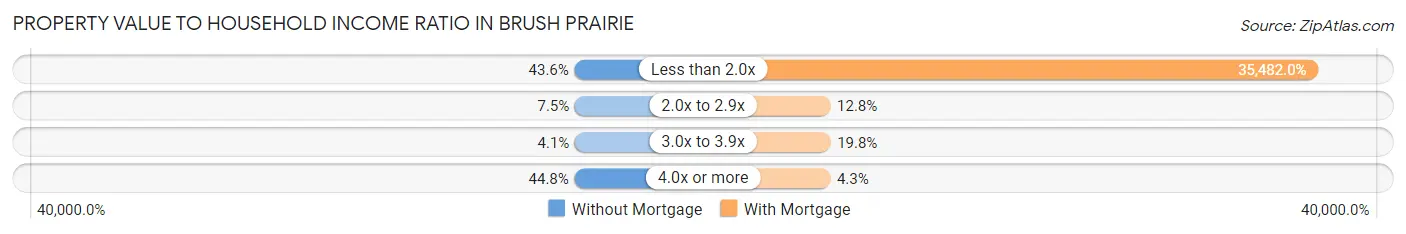
| Value-to-Income Ratio | Without Mortgage | With Mortgage |
| Less than 2.0x | 192 (43.6%) | 141,573 (35,482.0%) |
| 2.0x to 2.9x | 33 (7.5%) | 51 (12.8%) |
| 3.0x to 3.9x | 18 (4.1%) | 79 (19.8%) |
| 4.0x or more | 197 (44.8%) | 17 (4.3%) |
| Total | 440 (100.0%) | 399 (100.0%) |
Real Estate Taxes by Mortgage Status in Brush Prairie
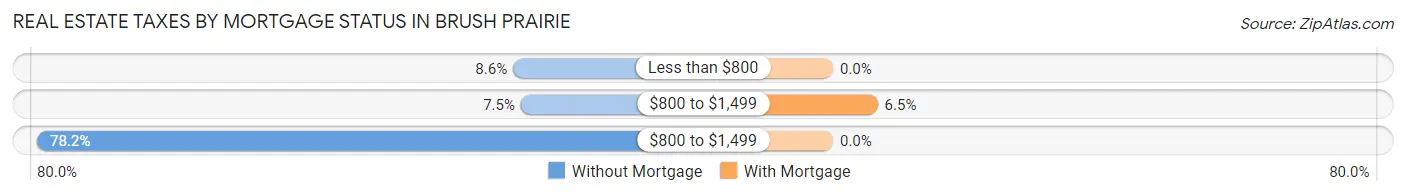
| Property Taxes | Without Mortgage | With Mortgage |
| Less than $800 | 38 (8.6%) | 0 (0.0%) |
| $800 to $1,499 | 33 (7.5%) | 26 (6.5%) |
| $800 to $1,499 | 344 (78.2%) | 0 (0.0%) |
| Total | 440 (100.0%) | 399 (100.0%) |
Health & Disability in Brush Prairie
Health Insurance Coverage by Age in Brush Prairie
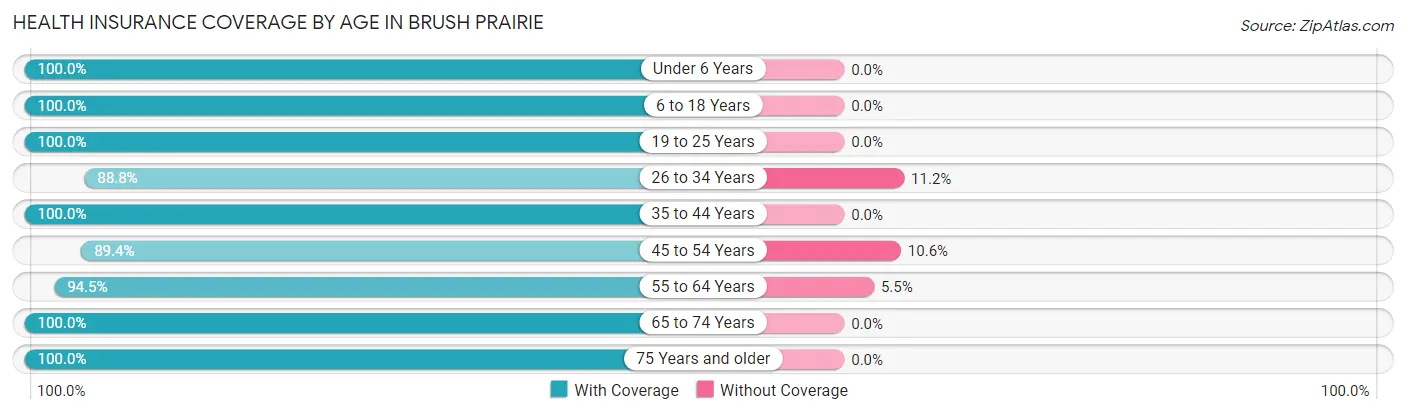
| Age Bracket | With Coverage | Without Coverage |
| Under 6 Years | 195 (100.0%) | 0 (0.0%) |
| 6 to 18 Years | 294 (100.0%) | 0 (0.0%) |
| 19 to 25 Years | 187 (100.0%) | 0 (0.0%) |
| 26 to 34 Years | 207 (88.8%) | 26 (11.2%) |
| 35 to 44 Years | 357 (100.0%) | 0 (0.0%) |
| 45 to 54 Years | 271 (89.4%) | 32 (10.6%) |
| 55 to 64 Years | 478 (94.5%) | 28 (5.5%) |
| 65 to 74 Years | 413 (100.0%) | 0 (0.0%) |
| 75 Years and older | 134 (100.0%) | 0 (0.0%) |
| Total | 2,536 (96.7%) | 86 (3.3%) |
Health Insurance Coverage by Citizenship Status in Brush Prairie
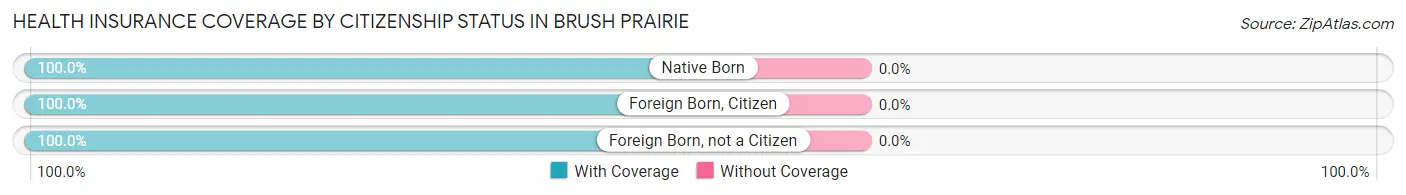
| Citizenship Status | With Coverage | Without Coverage |
| Native Born | 195 (100.0%) | 0 (0.0%) |
| Foreign Born, Citizen | 294 (100.0%) | 0 (0.0%) |
| Foreign Born, not a Citizen | 187 (100.0%) | 0 (0.0%) |
Health Insurance Coverage by Household Income in Brush Prairie
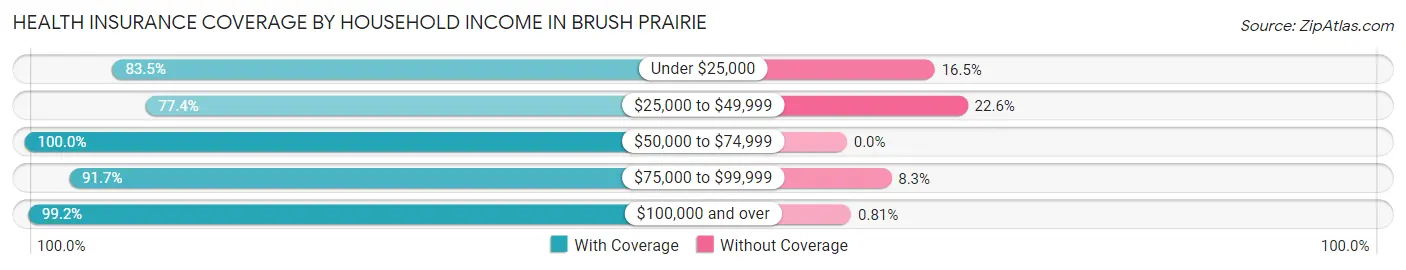
| Household Income | With Coverage | Without Coverage |
| Under $25,000 | 142 (83.5%) | 28 (16.5%) |
| $25,000 to $49,999 | 82 (77.4%) | 24 (22.6%) |
| $50,000 to $74,999 | 471 (100.0%) | 0 (0.0%) |
| $75,000 to $99,999 | 231 (91.7%) | 21 (8.3%) |
| $100,000 and over | 1,594 (99.2%) | 13 (0.8%) |
Public vs Private Health Insurance Coverage by Age in Brush Prairie
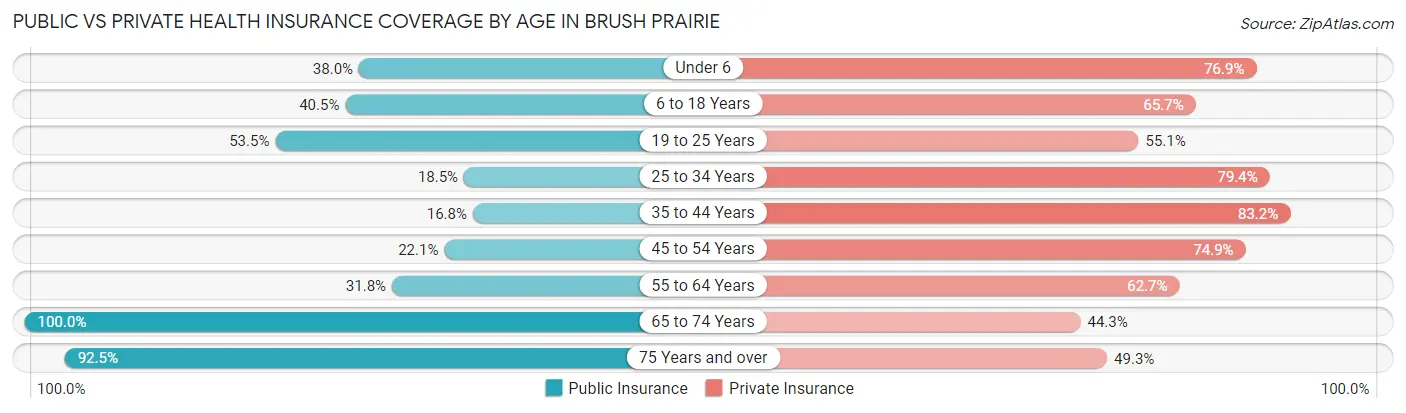
| Age Bracket | Public Insurance | Private Insurance |
| Under 6 | 74 (38.0%) | 150 (76.9%) |
| 6 to 18 Years | 119 (40.5%) | 193 (65.6%) |
| 19 to 25 Years | 100 (53.5%) | 103 (55.1%) |
| 25 to 34 Years | 43 (18.4%) | 185 (79.4%) |
| 35 to 44 Years | 60 (16.8%) | 297 (83.2%) |
| 45 to 54 Years | 67 (22.1%) | 227 (74.9%) |
| 55 to 64 Years | 161 (31.8%) | 317 (62.6%) |
| 65 to 74 Years | 413 (100.0%) | 183 (44.3%) |
| 75 Years and over | 124 (92.5%) | 66 (49.2%) |
| Total | 1,161 (44.3%) | 1,721 (65.6%) |
Disability Status by Sex by Age in Brush Prairie
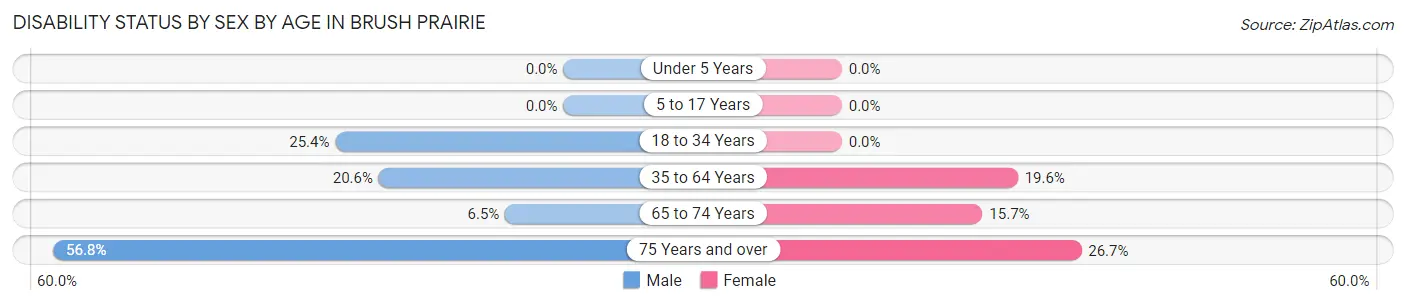
| Age Bracket | Male | Female |
| Under 5 Years | 0 (0.0%) | 0 (0.0%) |
| 5 to 17 Years | 0 (0.0%) | 0 (0.0%) |
| 18 to 34 Years | 48 (25.4%) | 0 (0.0%) |
| 35 to 64 Years | 120 (20.5%) | 114 (19.6%) |
| 65 to 74 Years | 16 (6.5%) | 26 (15.7%) |
| 75 Years and over | 25 (56.8%) | 24 (26.7%) |
Disability Class by Sex by Age in Brush Prairie
Disability Class: Hearing Difficulty
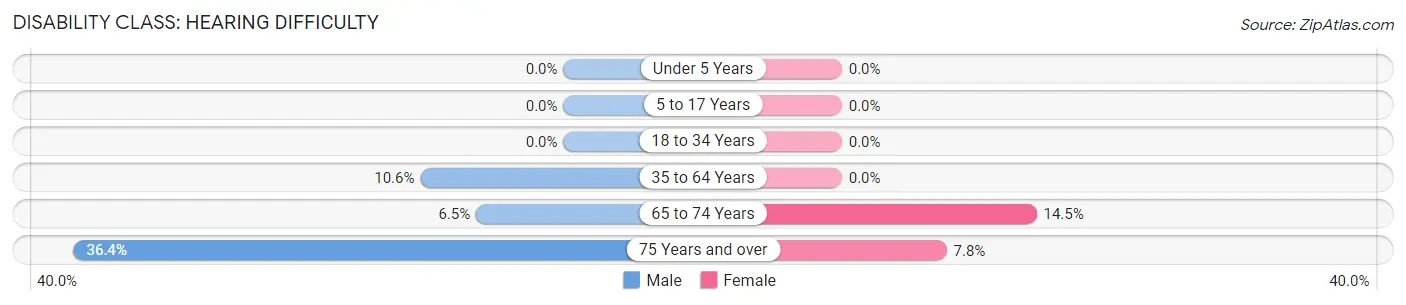
| Age Bracket | Male | Female |
| Under 5 Years | 0 (0.0%) | 0 (0.0%) |
| 5 to 17 Years | 0 (0.0%) | 0 (0.0%) |
| 18 to 34 Years | 0 (0.0%) | 0 (0.0%) |
| 35 to 64 Years | 62 (10.6%) | 0 (0.0%) |
| 65 to 74 Years | 16 (6.5%) | 24 (14.5%) |
| 75 Years and over | 16 (36.4%) | 7 (7.8%) |
Disability Class: Vision Difficulty
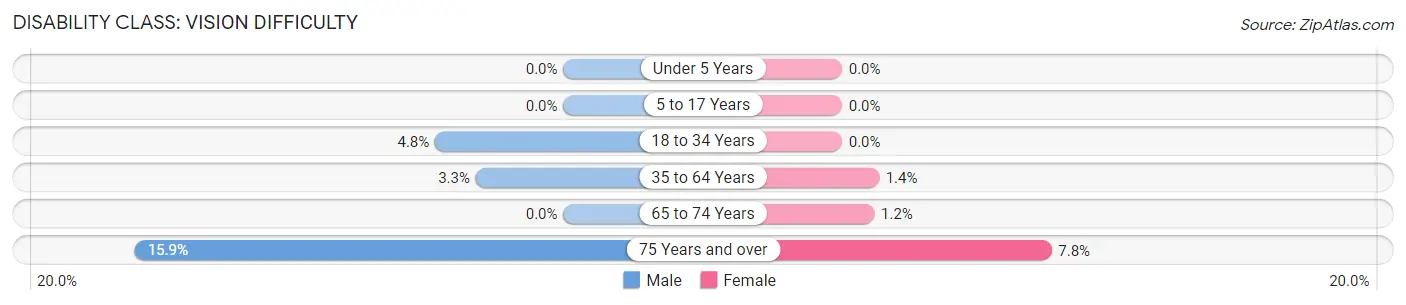
| Age Bracket | Male | Female |
| Under 5 Years | 0 (0.0%) | 0 (0.0%) |
| 5 to 17 Years | 0 (0.0%) | 0 (0.0%) |
| 18 to 34 Years | 9 (4.8%) | 0 (0.0%) |
| 35 to 64 Years | 19 (3.3%) | 8 (1.4%) |
| 65 to 74 Years | 0 (0.0%) | 2 (1.2%) |
| 75 Years and over | 7 (15.9%) | 7 (7.8%) |
Disability Class: Cognitive Difficulty
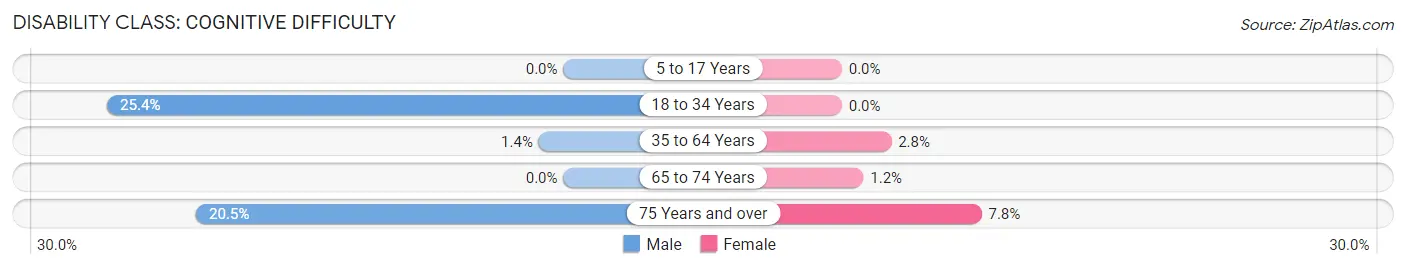
| Age Bracket | Male | Female |
| 5 to 17 Years | 0 (0.0%) | 0 (0.0%) |
| 18 to 34 Years | 48 (25.4%) | 0 (0.0%) |
| 35 to 64 Years | 8 (1.4%) | 16 (2.8%) |
| 65 to 74 Years | 0 (0.0%) | 2 (1.2%) |
| 75 Years and over | 9 (20.4%) | 7 (7.8%) |
Disability Class: Ambulatory Difficulty
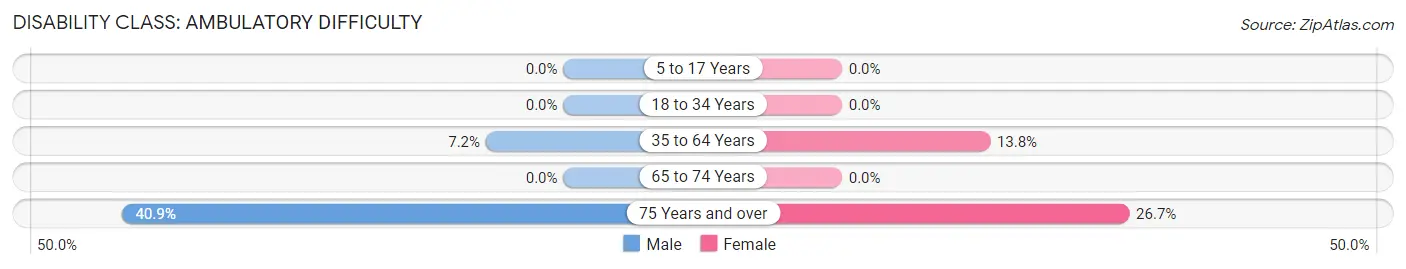
| Age Bracket | Male | Female |
| 5 to 17 Years | 0 (0.0%) | 0 (0.0%) |
| 18 to 34 Years | 0 (0.0%) | 0 (0.0%) |
| 35 to 64 Years | 42 (7.2%) | 80 (13.8%) |
| 65 to 74 Years | 0 (0.0%) | 0 (0.0%) |
| 75 Years and over | 18 (40.9%) | 24 (26.7%) |
Disability Class: Self-Care Difficulty
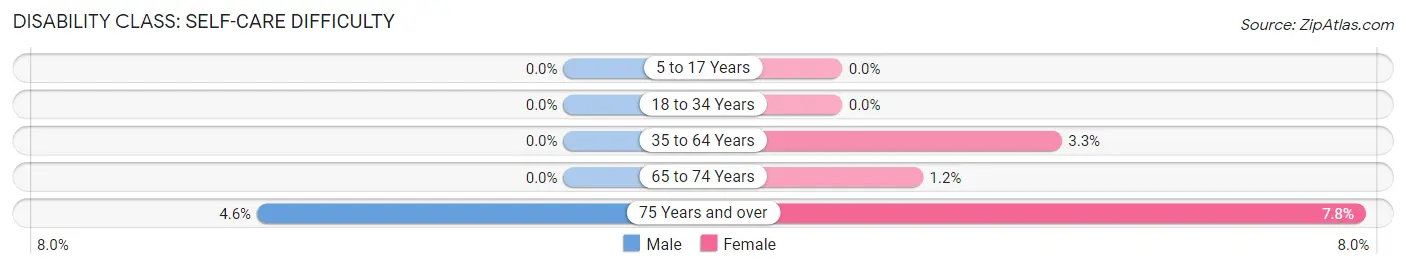
| Age Bracket | Male | Female |
| 5 to 17 Years | 0 (0.0%) | 0 (0.0%) |
| 18 to 34 Years | 0 (0.0%) | 0 (0.0%) |
| 35 to 64 Years | 0 (0.0%) | 19 (3.3%) |
| 65 to 74 Years | 0 (0.0%) | 2 (1.2%) |
| 75 Years and over | 2 (4.5%) | 7 (7.8%) |
Technology Access in Brush Prairie
Computing Device Access in Brush Prairie
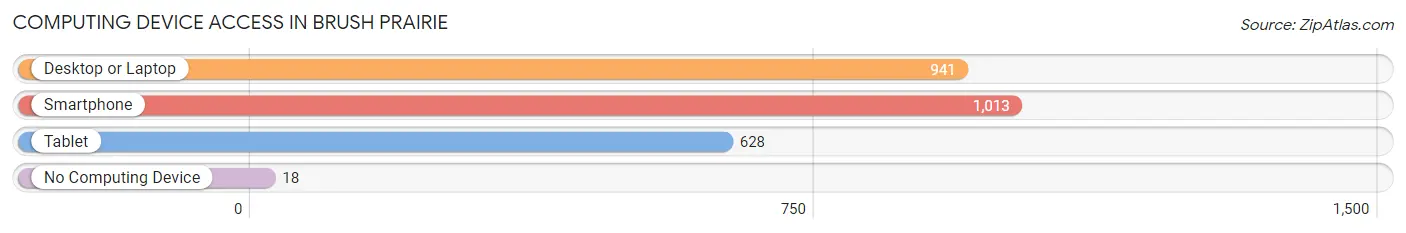
| Device Type | # Households | % Households |
| Desktop or Laptop | 941 | 90.4% |
| Smartphone | 1,013 | 97.3% |
| Tablet | 628 | 60.3% |
| No Computing Device | 18 | 1.7% |
| Total | 1,041 | 100.0% |
Internet Access in Brush Prairie
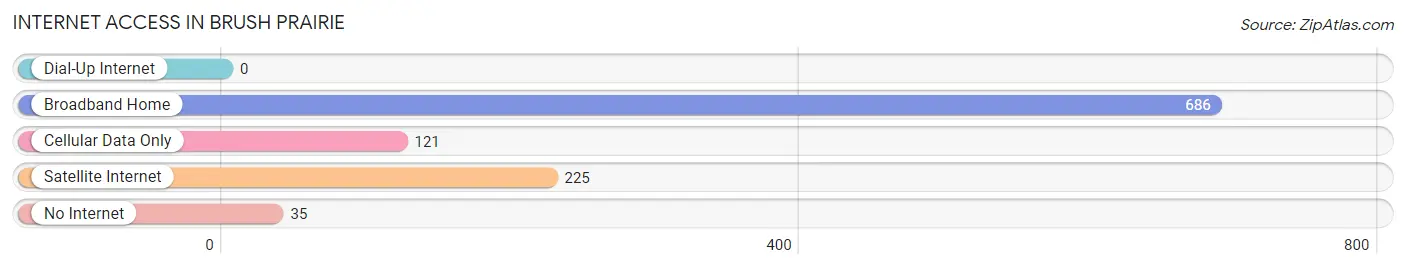
| Internet Type | # Households | % Households |
| Dial-Up Internet | 0 | 0.0% |
| Broadband Home | 686 | 65.9% |
| Cellular Data Only | 121 | 11.6% |
| Satellite Internet | 225 | 21.6% |
| No Internet | 35 | 3.4% |
| Total | 1,041 | 100.0% |
Brush Prairie Summary
Brush Prairie is a small unincorporated community located in Clark County, Washington, United States. It is situated in the foothills of the Cascade Mountains, approximately 20 miles northeast of Vancouver. The population of Brush Prairie was estimated to be 4,845 in 2019.
History
The area now known as Brush Prairie was first settled in the late 1800s by homesteaders. The first post office was established in 1891 and the community was named after the nearby Brush Prairie Creek. The creek was named by early settlers who noted the abundance of brush along its banks.
In the early 1900s, the area was primarily agricultural, with dairy farms and orchards being the main sources of income. The area was also home to several sawmills and logging operations.
In the 1950s, the area began to experience rapid growth as the population of Vancouver increased. This growth was fueled by the construction of Interstate 5, which connected Vancouver to Portland, Oregon.
Geography
Brush Prairie is located in the foothills of the Cascade Mountains, approximately 20 miles northeast of Vancouver. The area is characterized by rolling hills and lush forests. The climate is mild, with temperatures ranging from the mid-30s in the winter to the mid-80s in the summer.
The area is home to several parks and recreational areas, including Battle Ground Lake State Park, Moulton Falls State Park, and the Lewis River.
Economy
The economy of Brush Prairie is largely based on agriculture and tourism. The area is home to several dairy farms, orchards, and vineyards. The area is also home to several wineries, breweries, and distilleries.
Tourism is also an important part of the local economy. The area is home to several parks and recreational areas, as well as several golf courses.
Demographics
As of 2019, the population of Brush Prairie was estimated to be 4,845. The median age of the population is 43.7 years, with the majority of the population being white (90.2%). The median household income is $68,945, and the median home value is $346,400.
Conclusion
Brush Prairie is a small unincorporated community located in Clark County, Washington, United States. It is situated in the foothills of the Cascade Mountains, approximately 20 miles northeast of Vancouver. The population of Brush Prairie was estimated to be 4,845 in 2019. The economy of Brush Prairie is largely based on agriculture and tourism, with dairy farms, orchards, wineries, breweries, and distilleries being the main sources of income. The median age of the population is 43.7 years, with the majority of the population being white (90.2%). The median household income is $68,945, and the median home value is $346,400.
Common Questions
What is Per Capita Income in Brush Prairie?
Per Capita income in Brush Prairie is $50,436.
What is the Median Family Income in Brush Prairie?
Median Family Income in Brush Prairie is $112,813.
What is the Median Household income in Brush Prairie?
Median Household Income in Brush Prairie is $106,719.
What is Income or Wage Gap in Brush Prairie?
Income or Wage Gap in Brush Prairie is 60.2%.
Women in Brush Prairie earn 39.8 cents for every dollar earned by a man.
What is Inequality or Gini Index in Brush Prairie?
Inequality or Gini Index in Brush Prairie is 0.39.
What is the Total Population of Brush Prairie?
Total Population of Brush Prairie is 2,623.
What is the Total Male Population of Brush Prairie?
Total Male Population of Brush Prairie is 1,267.
What is the Total Female Population of Brush Prairie?
Total Female Population of Brush Prairie is 1,356.
What is the Ratio of Males per 100 Females in Brush Prairie?
There are 93.44 Males per 100 Females in Brush Prairie.
What is the Ratio of Females per 100 Males in Brush Prairie?
There are 107.02 Females per 100 Males in Brush Prairie.
What is the Median Population Age in Brush Prairie?
Median Population Age in Brush Prairie is 46.8 Years.
What is the Average Family Size in Brush Prairie
Average Family Size in Brush Prairie is 3.0 People.
What is the Average Household Size in Brush Prairie
Average Household Size in Brush Prairie is 2.5 People.
How Large is the Labor Force in Brush Prairie?
There are 1,361 People in the Labor Forcein in Brush Prairie.
What is the Percentage of People in the Labor Force in Brush Prairie?
61.5% of People are in the Labor Force in Brush Prairie.
What is the Unemployment Rate in Brush Prairie?
Unemployment Rate in Brush Prairie is 3.9%.