Zip Codes with the Highest Percentage of Population Employed in Architecture & Engineering in Lynnwood, WA
RELATED REPORTS & OPTIONS
Architecture & Engineering
Lynnwood
Compare Zip Codes
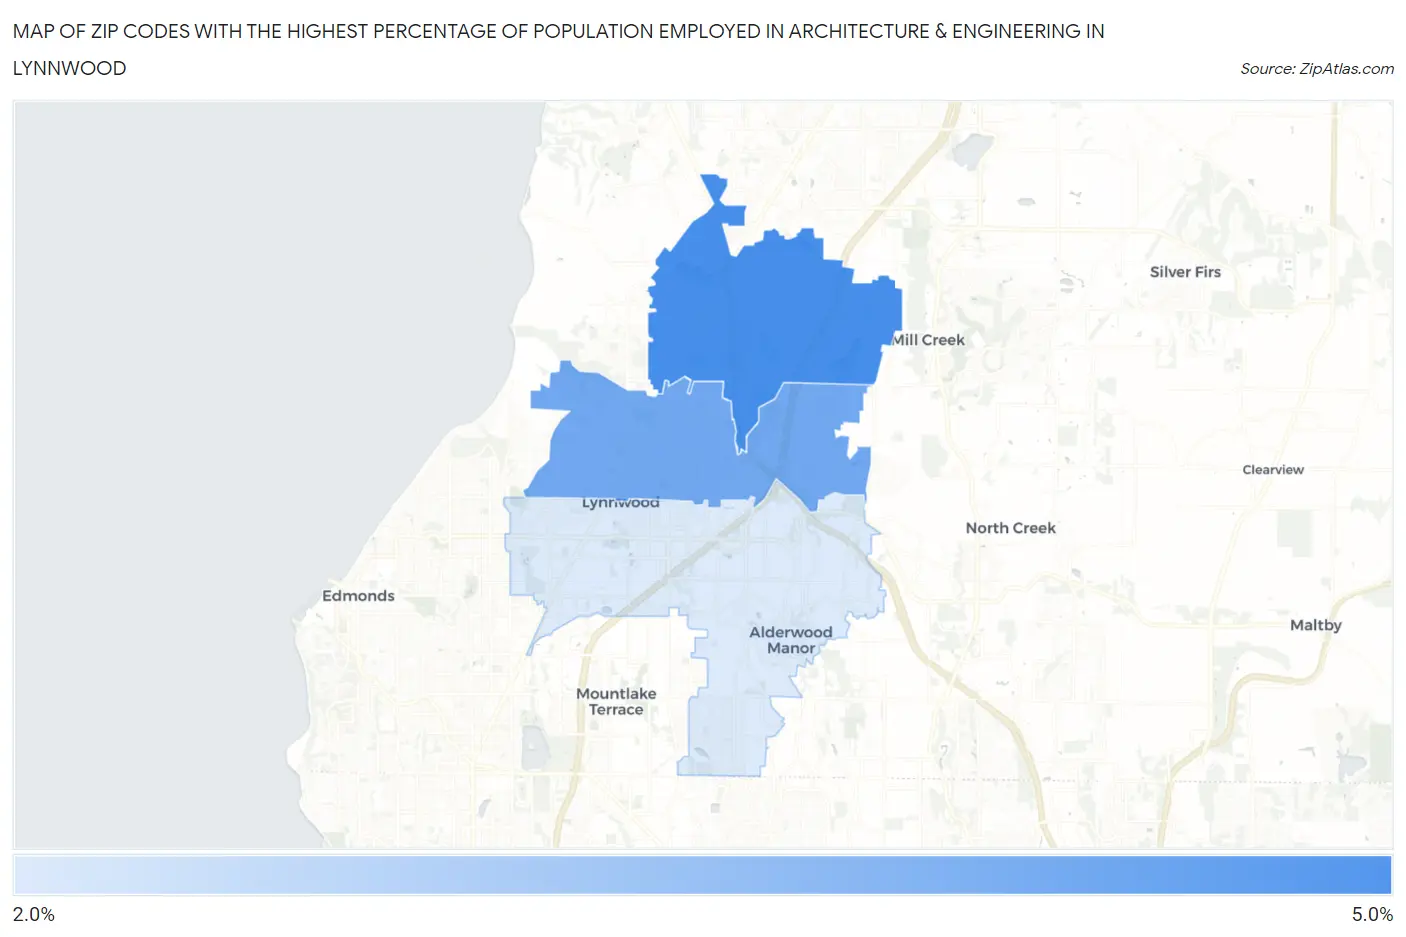
Map of Zip Codes with the Highest Percentage of Population Employed in Architecture & Engineering in Lynnwood
2.8%
4.7%
Zip Codes with the Highest Percentage of Population Employed in Architecture & Engineering in Lynnwood, WA
| Zip Code | % Employed | vs State | vs National | |
| 1. | 98087 | 4.7% | 2.8%(+1.94)#53 | 2.1%(+2.59)#1,893 |
| 2. | 98037 | 4.2% | 2.8%(+1.39)#74 | 2.1%(+2.03)#2,511 |
| 3. | 98036 | 2.8% | 2.8%(+0.014)#159 | 2.1%(+0.656)#5,772 |
1
Common Questions
What are the Top Zip Codes with the Highest Percentage of Population Employed in Architecture & Engineering in Lynnwood, WA?
Top Zip Codes with the Highest Percentage of Population Employed in Architecture & Engineering in Lynnwood, WA are:
What zip code has the Highest Percentage of Population Employed in Architecture & Engineering in Lynnwood, WA?
98087 has the Highest Percentage of Population Employed in Architecture & Engineering in Lynnwood, WA with 4.7%.
What is the Percentage of Population Employed in Architecture & Engineering in Lynnwood, WA?
Percentage of Population Employed in Architecture & Engineering in Lynnwood is 2.8%.
What is the Percentage of Population Employed in Architecture & Engineering in Washington?
Percentage of Population Employed in Architecture & Engineering in Washington is 2.8%.
What is the Percentage of Population Employed in Architecture & Engineering in the United States?
Percentage of Population Employed in Architecture & Engineering in the United States is 2.1%.