Camas, WA Map & Demographics
Camas Map
Camas Overview
$57,841
PER CAPITA INCOME
$146,125
AVG FAMILY INCOME
$133,829
AVG HOUSEHOLD INCOME
48.3%
WAGE / INCOME GAP [ % ]
51.7¢/ $1
WAGE / INCOME GAP [ $ ]
$12,706
FAMILY INCOME DEFICIT
0.42
INEQUALITY / GINI INDEX
26,387
TOTAL POPULATION
13,359
MALE POPULATION
13,028
FEMALE POPULATION
102.54
MALES / 100 FEMALES
97.52
FEMALES / 100 MALES
40.3
MEDIAN AGE
3.3
AVG FAMILY SIZE
3.0
AVG HOUSEHOLD SIZE
12,954
LABOR FORCE [ PEOPLE ]
64.8%
PERCENT IN LABOR FORCE
2.4%
UNEMPLOYMENT RATE
Camas Zip Codes
Camas Area Codes
Income in Camas
Income Overview in Camas
Per Capita Income in Camas is $57,841, while median incomes of families and households are $146,125 and $133,829 respectively.
| Characteristic | Number | Measure |
| Per Capita Income | 26,387 | $57,841 |
| Median Family Income | 7,271 | $146,125 |
| Mean Family Income | 7,271 | $180,500 |
| Median Household Income | 8,913 | $133,829 |
| Mean Household Income | 8,913 | $166,637 |
| Income Deficit | 7,271 | $12,706 |
| Wage / Income Gap (%) | 26,387 | 48.30% |
| Wage / Income Gap ($) | 26,387 | 51.70¢ per $1 |
| Gini / Inequality Index | 26,387 | 0.42 |
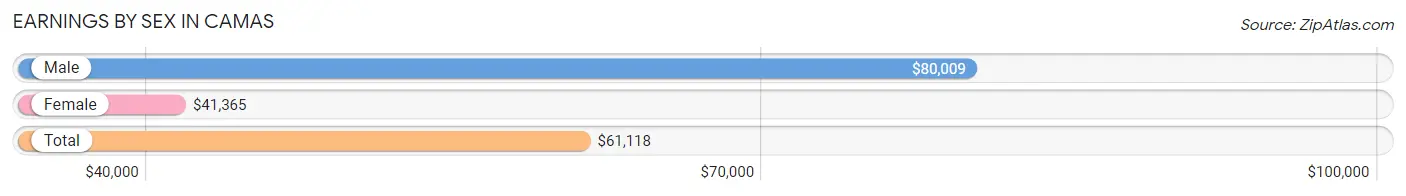
Earnings by Sex in Camas
Average Earnings in Camas are $61,118, $80,009 for men and $41,365 for women, a difference of 48.3%.
| Sex | Number | Average Earnings |
| Male | 7,623 (54.5%) | $80,009 |
| Female | 6,356 (45.5%) | $41,365 |
| Total | 13,979 (100.0%) | $61,118 |
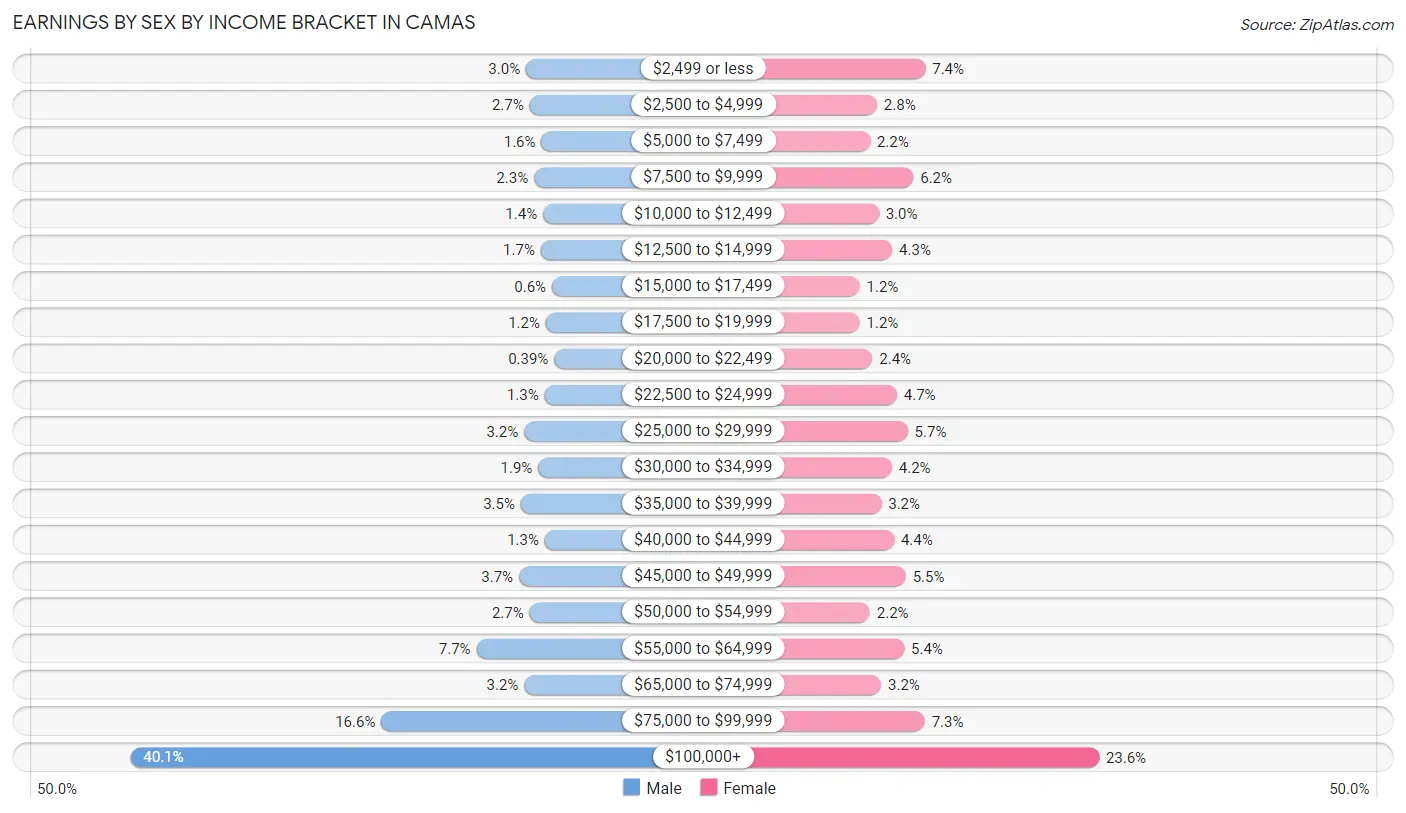
Earnings by Sex by Income Bracket in Camas
The most common earnings brackets in Camas are $100,000+ for men (3,056 | 40.1%) and $100,000+ for women (1,501 | 23.6%).
| Income | Male | Female |
| $2,499 or less | 231 (3.0%) | 467 (7.3%) |
| $2,500 to $4,999 | 206 (2.7%) | 179 (2.8%) |
| $5,000 to $7,499 | 121 (1.6%) | 138 (2.2%) |
| $7,500 to $9,999 | 174 (2.3%) | 396 (6.2%) |
| $10,000 to $12,499 | 110 (1.4%) | 190 (3.0%) |
| $12,500 to $14,999 | 126 (1.7%) | 270 (4.3%) |
| $15,000 to $17,499 | 46 (0.6%) | 76 (1.2%) |
| $17,500 to $19,999 | 90 (1.2%) | 76 (1.2%) |
| $20,000 to $22,499 | 30 (0.4%) | 152 (2.4%) |
| $22,500 to $24,999 | 98 (1.3%) | 298 (4.7%) |
| $25,000 to $29,999 | 245 (3.2%) | 362 (5.7%) |
| $30,000 to $34,999 | 144 (1.9%) | 268 (4.2%) |
| $35,000 to $39,999 | 268 (3.5%) | 205 (3.2%) |
| $40,000 to $44,999 | 97 (1.3%) | 281 (4.4%) |
| $45,000 to $49,999 | 281 (3.7%) | 351 (5.5%) |
| $50,000 to $54,999 | 206 (2.7%) | 137 (2.2%) |
| $55,000 to $64,999 | 585 (7.7%) | 341 (5.4%) |
| $65,000 to $74,999 | 244 (3.2%) | 204 (3.2%) |
| $75,000 to $99,999 | 1,265 (16.6%) | 464 (7.3%) |
| $100,000+ | 3,056 (40.1%) | 1,501 (23.6%) |
| Total | 7,623 (100.0%) | 6,356 (100.0%) |
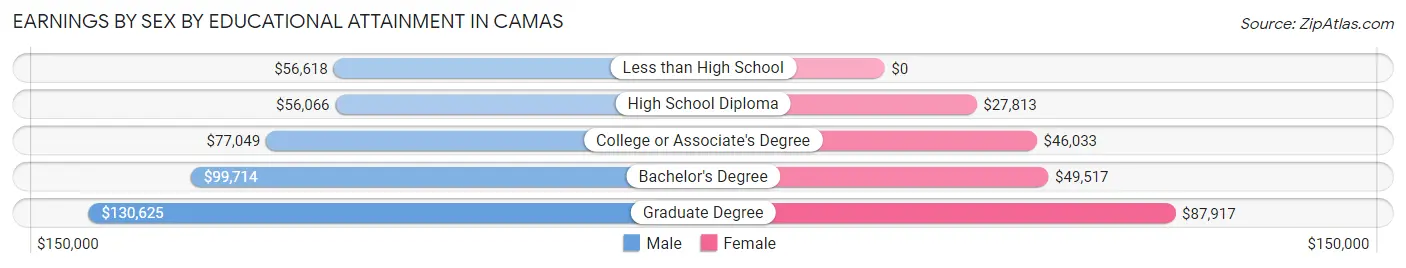
Earnings by Sex by Educational Attainment in Camas
Average earnings in Camas are $86,825 for men and $48,278 for women, a difference of 44.4%. Men with an educational attainment of graduate degree enjoy the highest average annual earnings of $130,625, while those with high school diploma education earn the least with $56,066. Women with an educational attainment of graduate degree earn the most with the average annual earnings of $87,917, while those with high school diploma education have the smallest earnings of $27,813.
| Educational Attainment | Male Income | Female Income |
| Less than High School | $56,618 | $0 |
| High School Diploma | $56,066 | $27,813 |
| College or Associate's Degree | $77,049 | $46,033 |
| Bachelor's Degree | $99,714 | $49,517 |
| Graduate Degree | $130,625 | $87,917 |
| Total | $86,825 | $48,278 |
Family Income in Camas
Family Income Brackets in Camas
According to the Camas family income data, there are 2,363 families falling into the $200,000+ income range, which is the most common income bracket and makes up 32.5% of all families. Conversely, the $10,000 to $14,999 income bracket is the least frequent group with only 44 families (0.6%) belonging to this category.
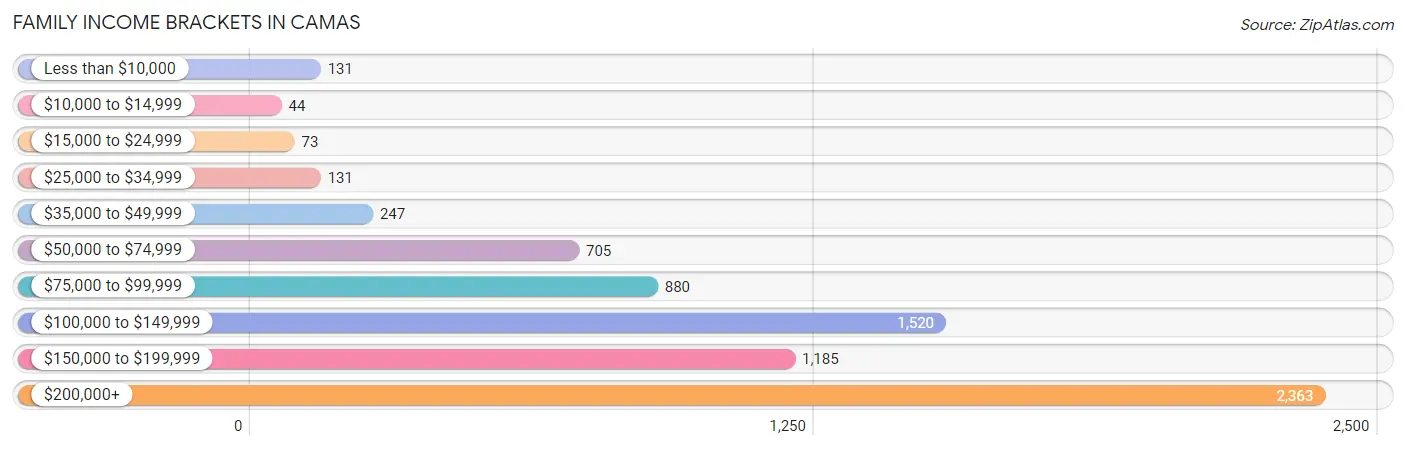
| Income Bracket | # Families | % Families |
| Less than $10,000 | 131 | 1.8% |
| $10,000 to $14,999 | 44 | 0.6% |
| $15,000 to $24,999 | 73 | 1.0% |
| $25,000 to $34,999 | 131 | 1.8% |
| $35,000 to $49,999 | 247 | 3.4% |
| $50,000 to $74,999 | 705 | 9.7% |
| $75,000 to $99,999 | 880 | 12.1% |
| $100,000 to $149,999 | 1,520 | 20.9% |
| $150,000 to $199,999 | 1,185 | 16.3% |
| $200,000+ | 2,363 | 32.5% |
Family Income by Famaliy Size in Camas
6-person families (259 | 3.6%) account for the highest median family income in Camas with $250,001 per family, while 2-person families (2,846 | 39.1%) have the highest median income of $64,166 per family member.
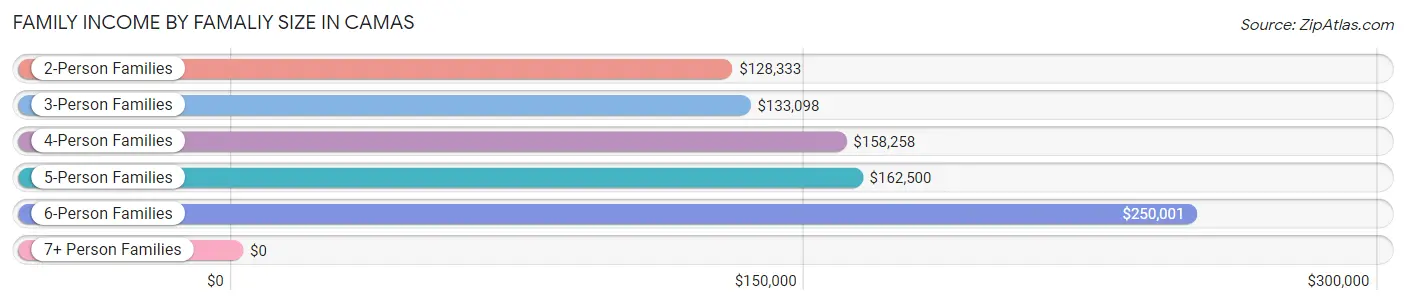
| Income Bracket | # Families | Median Income |
| 2-Person Families | 2,846 (39.1%) | $128,333 |
| 3-Person Families | 1,533 (21.1%) | $133,098 |
| 4-Person Families | 2,031 (27.9%) | $158,258 |
| 5-Person Families | 572 (7.9%) | $162,500 |
| 6-Person Families | 259 (3.6%) | $250,001 |
| 7+ Person Families | 30 (0.4%) | $0 |
| Total | 7,271 (100.0%) | $146,125 |
Family Income by Number of Earners in Camas
The median family income in Camas is $146,125, with families comprising 3+ earners (909) having the highest median family income of $184,293, while families with no earners (855) have the lowest median family income of $69,408, accounting for 12.5% and 11.8% of families, respectively.
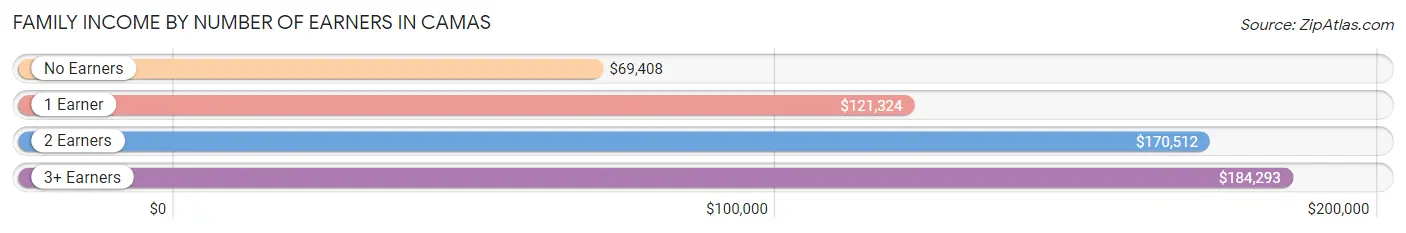
| Number of Earners | # Families | Median Income |
| No Earners | 855 (11.8%) | $69,408 |
| 1 Earner | 2,046 (28.1%) | $121,324 |
| 2 Earners | 3,461 (47.6%) | $170,512 |
| 3+ Earners | 909 (12.5%) | $184,293 |
| Total | 7,271 (100.0%) | $146,125 |
Household Income in Camas
Household Income Brackets in Camas
With 2,594 households falling in the category, the $200,000+ income range is the most frequent in Camas, accounting for 29.1% of all households. In contrast, only 89 households (1.0%) fall into the $10,000 to $14,999 income bracket, making it the least populous group.
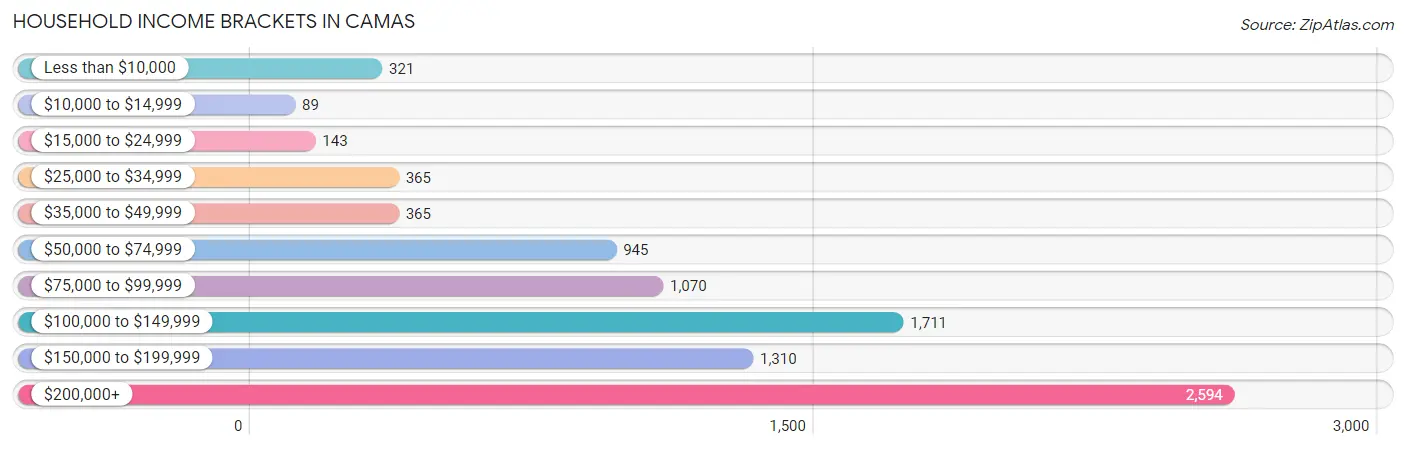
| Income Bracket | # Households | % Households |
| Less than $10,000 | 321 | 3.6% |
| $10,000 to $14,999 | 89 | 1.0% |
| $15,000 to $24,999 | 143 | 1.6% |
| $25,000 to $34,999 | 365 | 4.1% |
| $35,000 to $49,999 | 365 | 4.1% |
| $50,000 to $74,999 | 945 | 10.6% |
| $75,000 to $99,999 | 1,070 | 12.0% |
| $100,000 to $149,999 | 1,711 | 19.2% |
| $150,000 to $199,999 | 1,310 | 14.7% |
| $200,000+ | 2,594 | 29.1% |
Household Income by Householder Age in Camas
The median household income in Camas is $133,829, with the highest median household income of $156,956 found in the 45 to 64 years age bracket for the primary householder. A total of 4,007 households (45.0%) fall into this category. Meanwhile, the 15 to 24 years age bracket for the primary householder has the lowest median household income of $0, with 75 households (0.8%) in this group.
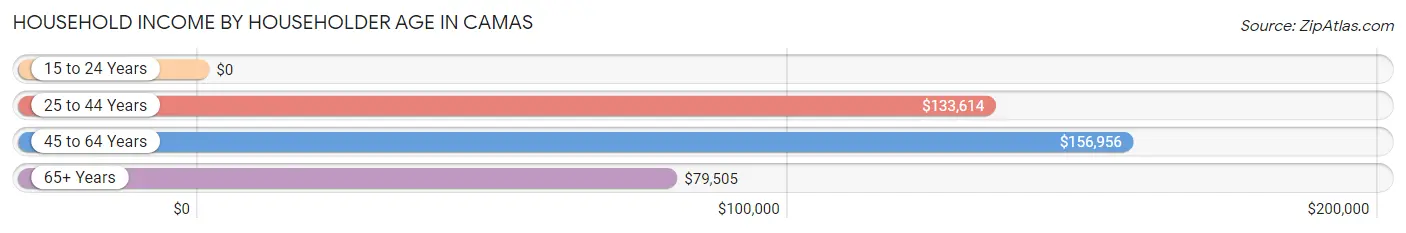
| Income Bracket | # Households | Median Income |
| 15 to 24 Years | 75 (0.8%) | $0 |
| 25 to 44 Years | 2,880 (32.3%) | $133,614 |
| 45 to 64 Years | 4,007 (45.0%) | $156,956 |
| 65+ Years | 1,951 (21.9%) | $79,505 |
| Total | 8,913 (100.0%) | $133,829 |
Poverty in Camas
Income Below Poverty by Sex and Age in Camas
With 3.3% poverty level for males and 5.5% for females among the residents of Camas, under 5 year old males and 75 year old and over females are the most vulnerable to poverty, with 97 males (13.8%) and 71 females (13.2%) in their respective age groups living below the poverty level.
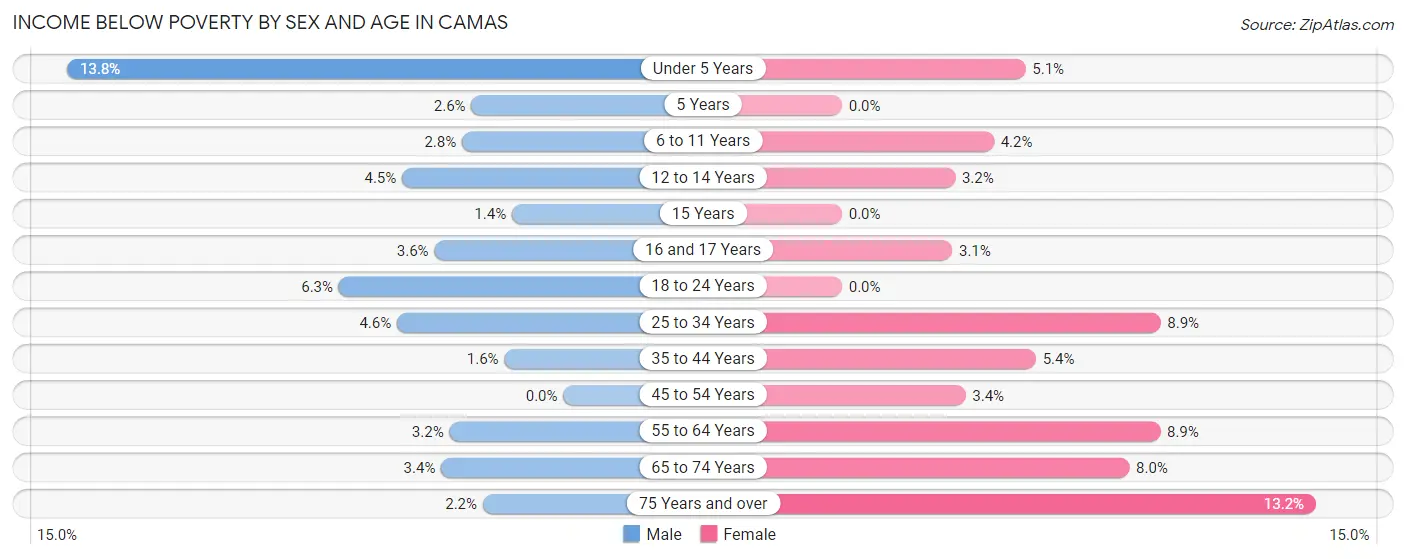
| Age Bracket | Male | Female |
| Under 5 Years | 97 (13.8%) | 33 (5.1%) |
| 5 Years | 5 (2.6%) | 0 (0.0%) |
| 6 to 11 Years | 37 (2.8%) | 47 (4.2%) |
| 12 to 14 Years | 33 (4.5%) | 22 (3.2%) |
| 15 Years | 7 (1.4%) | 0 (0.0%) |
| 16 and 17 Years | 15 (3.6%) | 16 (3.1%) |
| 18 to 24 Years | 42 (6.2%) | 0 (0.0%) |
| 25 to 34 Years | 64 (4.6%) | 118 (8.9%) |
| 35 to 44 Years | 26 (1.6%) | 106 (5.4%) |
| 45 to 54 Years | 0 (0.0%) | 71 (3.4%) |
| 55 to 64 Years | 58 (3.2%) | 137 (8.9%) |
| 65 to 74 Years | 40 (3.4%) | 96 (8.0%) |
| 75 Years and over | 9 (2.2%) | 71 (13.2%) |
| Total | 433 (3.3%) | 717 (5.5%) |
Income Above Poverty by Sex and Age in Camas
According to the poverty statistics in Camas, males aged 45 to 54 years and females aged 5 years are the age groups that are most secure financially, with 100.0% of males and 100.0% of females in these age groups living above the poverty line.
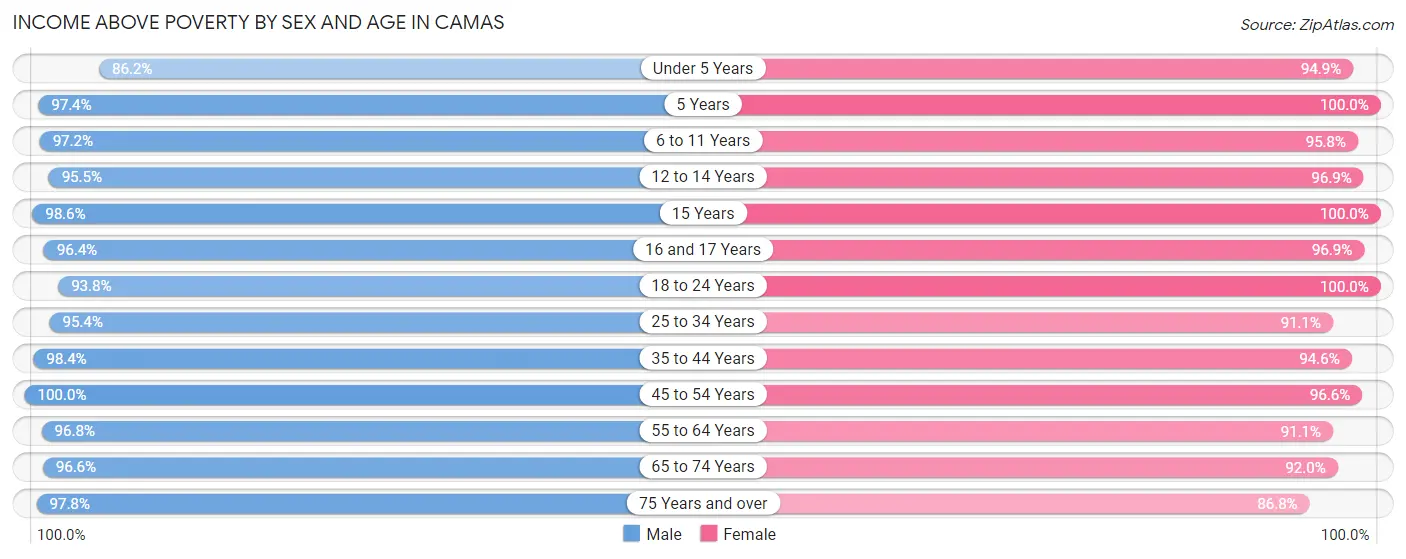
| Age Bracket | Male | Female |
| Under 5 Years | 605 (86.2%) | 613 (94.9%) |
| 5 Years | 190 (97.4%) | 237 (100.0%) |
| 6 to 11 Years | 1,274 (97.2%) | 1,063 (95.8%) |
| 12 to 14 Years | 702 (95.5%) | 677 (96.9%) |
| 15 Years | 481 (98.6%) | 219 (100.0%) |
| 16 and 17 Years | 403 (96.4%) | 505 (96.9%) |
| 18 to 24 Years | 630 (93.8%) | 908 (100.0%) |
| 25 to 34 Years | 1,318 (95.4%) | 1,212 (91.1%) |
| 35 to 44 Years | 1,558 (98.4%) | 1,857 (94.6%) |
| 45 to 54 Years | 2,392 (100.0%) | 1,990 (96.6%) |
| 55 to 64 Years | 1,769 (96.8%) | 1,410 (91.1%) |
| 65 to 74 Years | 1,138 (96.6%) | 1,104 (92.0%) |
| 75 Years and over | 392 (97.8%) | 467 (86.8%) |
| Total | 12,852 (96.7%) | 12,262 (94.5%) |
Income Below Poverty Among Married-Couple Families in Camas
The poverty statistics for married-couple families in Camas show that 2.2% or 140 of the total 6,401 families live below the poverty line. Families with 3 or 4 children have the highest poverty rate of 5.2%, comprising of 28 families. On the other hand, families with 5 or more children have the lowest poverty rate of 0.0%, which includes 0 families.
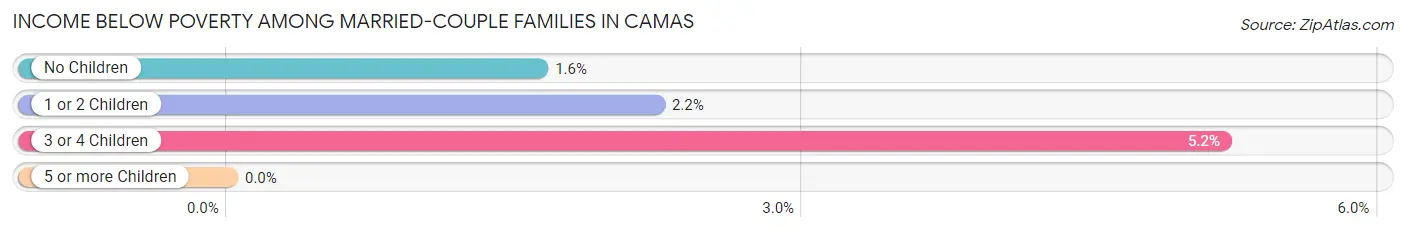
| Children | Above Poverty | Below Poverty |
| No Children | 2,973 (98.4%) | 49 (1.6%) |
| 1 or 2 Children | 2,761 (97.8%) | 63 (2.2%) |
| 3 or 4 Children | 511 (94.8%) | 28 (5.2%) |
| 5 or more Children | 16 (100.0%) | 0 (0.0%) |
| Total | 6,261 (97.8%) | 140 (2.2%) |
Income Below Poverty Among Single-Parent Households in Camas
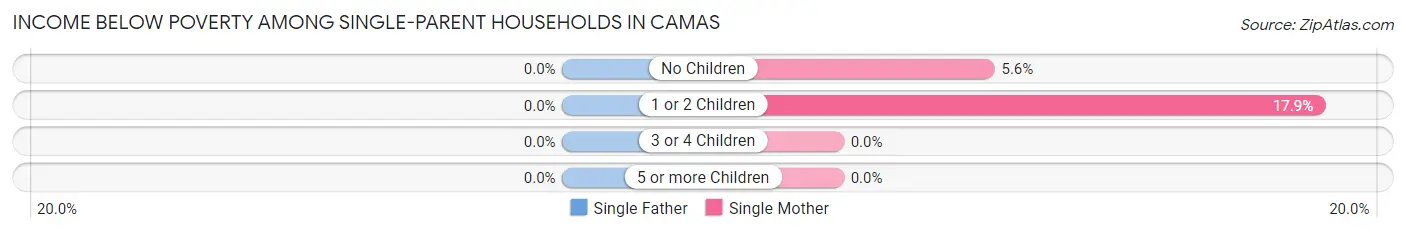
| Children | Single Father | Single Mother |
| No Children | 0 (0.0%) | 14 (5.6%) |
| 1 or 2 Children | 0 (0.0%) | 66 (17.9%) |
| 3 or 4 Children | 0 (0.0%) | 0 (0.0%) |
| 5 or more Children | 0 (0.0%) | 0 (0.0%) |
| Total | 0 (0.0%) | 80 (12.4%) |
Income Below Poverty Among Married-Couple vs Single-Parent Households in Camas
The poverty data for Camas shows that 140 of the married-couple family households (2.2%) and 80 of the single-parent households (9.2%) are living below the poverty level. Within the married-couple family households, those with 3 or 4 children have the highest poverty rate, with 28 households (5.2%) falling below the poverty line. Among the single-parent households, those with 1 or 2 children have the highest poverty rate, with 66 household (14.1%) living below poverty.
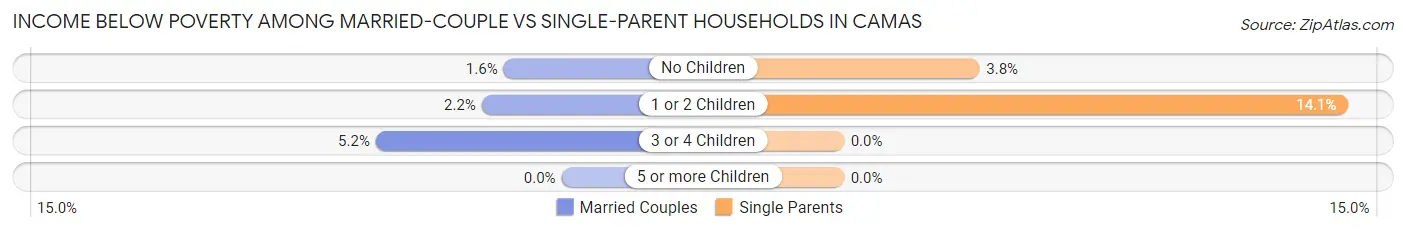
| Children | Married-Couple Families | Single-Parent Households |
| No Children | 49 (1.6%) | 14 (3.8%) |
| 1 or 2 Children | 63 (2.2%) | 66 (14.1%) |
| 3 or 4 Children | 28 (5.2%) | 0 (0.0%) |
| 5 or more Children | 0 (0.0%) | 0 (0.0%) |
| Total | 140 (2.2%) | 80 (9.2%) |
Race in Camas
The most populous races in Camas are White / Caucasian (19,970 | 75.7%), Asian (2,856 | 10.8%), and Two or more Races (2,555 | 9.7%).
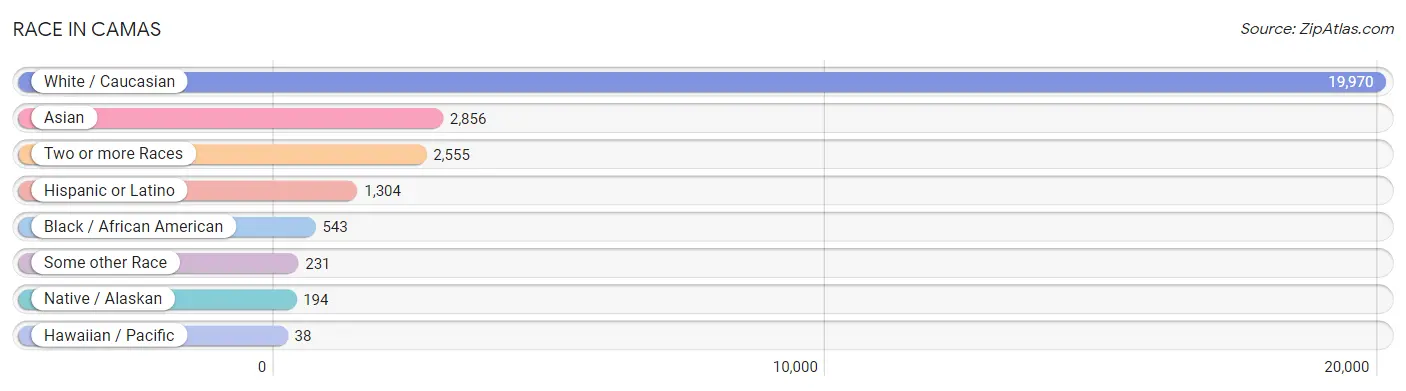
| Race | # Population | % Population |
| Asian | 2,856 | 10.8% |
| Black / African American | 543 | 2.1% |
| Hawaiian / Pacific | 38 | 0.1% |
| Hispanic or Latino | 1,304 | 4.9% |
| Native / Alaskan | 194 | 0.7% |
| White / Caucasian | 19,970 | 75.7% |
| Two or more Races | 2,555 | 9.7% |
| Some other Race | 231 | 0.9% |
| Total | 26,387 | 100.0% |
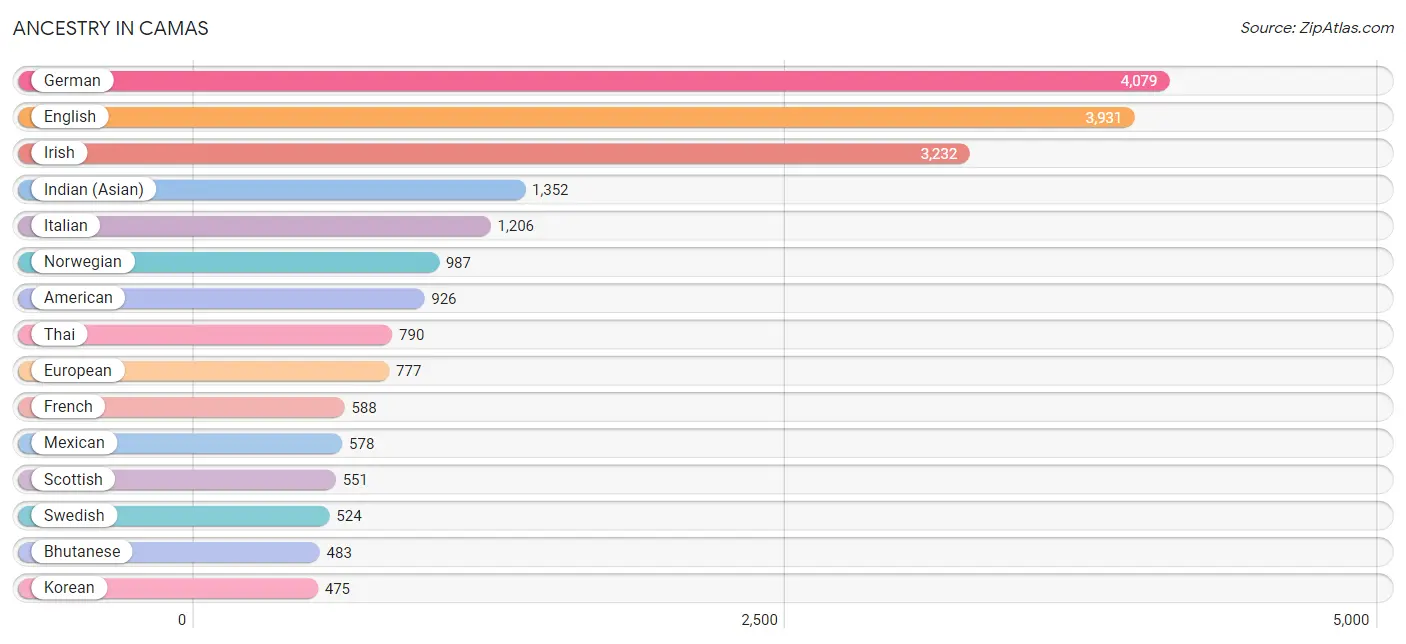
Ancestry in Camas
The most populous ancestries reported in Camas are German (4,079 | 15.5%), English (3,931 | 14.9%), Irish (3,232 | 12.2%), Indian (Asian) (1,352 | 5.1%), and Italian (1,206 | 4.6%), together accounting for 52.3% of all Camas residents.
| Ancestry | # Population | % Population |
| African | 166 | 0.6% |
| Alaskan Athabascan | 11 | 0.0% |
| American | 926 | 3.5% |
| Arab | 140 | 0.5% |
| Austrian | 197 | 0.7% |
| Belgian | 18 | 0.1% |
| Bhutanese | 483 | 1.8% |
| Blackfeet | 5 | 0.0% |
| British | 138 | 0.5% |
| Bulgarian | 18 | 0.1% |
| Burmese | 164 | 0.6% |
| Canadian | 60 | 0.2% |
| Central American | 226 | 0.9% |
| Cherokee | 93 | 0.4% |
| Chilean | 24 | 0.1% |
| Choctaw | 74 | 0.3% |
| Colombian | 42 | 0.2% |
| Costa Rican | 12 | 0.1% |
| Croatian | 73 | 0.3% |
| Czech | 80 | 0.3% |
| Danish | 197 | 0.7% |
| Dominican | 22 | 0.1% |
| Dutch | 393 | 1.5% |
| Eastern European | 200 | 0.8% |
| English | 3,931 | 14.9% |
| Ethiopian | 14 | 0.1% |
| European | 777 | 2.9% |
| Filipino | 140 | 0.5% |
| Finnish | 223 | 0.9% |
| French | 588 | 2.2% |
| French Canadian | 183 | 0.7% |
| German | 4,079 | 15.5% |
| Greek | 403 | 1.5% |
| Guamanian / Chamorro | 64 | 0.2% |
| Hungarian | 55 | 0.2% |
| Icelander | 15 | 0.1% |
| Indian (Asian) | 1,352 | 5.1% |
| Indonesian | 49 | 0.2% |
| Iranian | 24 | 0.1% |
| Irish | 3,232 | 12.2% |
| Israeli | 43 | 0.2% |
| Italian | 1,206 | 4.6% |
| Jordanian | 23 | 0.1% |
| Korean | 475 | 1.8% |
| Latvian | 23 | 0.1% |
| Lebanese | 44 | 0.2% |
| Lithuanian | 64 | 0.2% |
| Luxembourger | 8 | 0.0% |
| Maltese | 24 | 0.1% |
| Mexican | 578 | 2.2% |
| Mexican American Indian | 35 | 0.1% |
| Mongolian | 40 | 0.2% |
| Moroccan | 34 | 0.1% |
| Native Hawaiian | 75 | 0.3% |
| Navajo | 20 | 0.1% |
| Nicaraguan | 34 | 0.1% |
| Northern European | 94 | 0.4% |
| Norwegian | 987 | 3.7% |
| Okinawan | 15 | 0.1% |
| Pakistani | 43 | 0.2% |
| Palestinian | 7 | 0.0% |
| Panamanian | 56 | 0.2% |
| Peruvian | 48 | 0.2% |
| Polish | 381 | 1.4% |
| Portuguese | 268 | 1.0% |
| Puerto Rican | 188 | 0.7% |
| Romanian | 54 | 0.2% |
| Russian | 445 | 1.7% |
| Salvadoran | 124 | 0.5% |
| Samoan | 62 | 0.2% |
| Scandinavian | 230 | 0.9% |
| Scotch-Irish | 225 | 0.9% |
| Scottish | 551 | 2.1% |
| Serbian | 24 | 0.1% |
| Sioux | 15 | 0.1% |
| Slavic | 62 | 0.2% |
| Slovak | 11 | 0.0% |
| South African | 45 | 0.2% |
| South American | 114 | 0.4% |
| Spaniard | 93 | 0.4% |
| Spanish | 83 | 0.3% |
| Sri Lankan | 291 | 1.1% |
| Subsaharan African | 418 | 1.6% |
| Swedish | 524 | 2.0% |
| Swiss | 95 | 0.4% |
| Syrian | 32 | 0.1% |
| Thai | 790 | 3.0% |
| Tlingit-Haida | 35 | 0.1% |
| Turkish | 4 | 0.0% |
| Ukrainian | 304 | 1.1% |
| Ute | 32 | 0.1% |
| Welsh | 223 | 0.9% |
| Yaqui | 19 | 0.1% |
| Yugoslavian | 136 | 0.5% | View All 94 Rows |
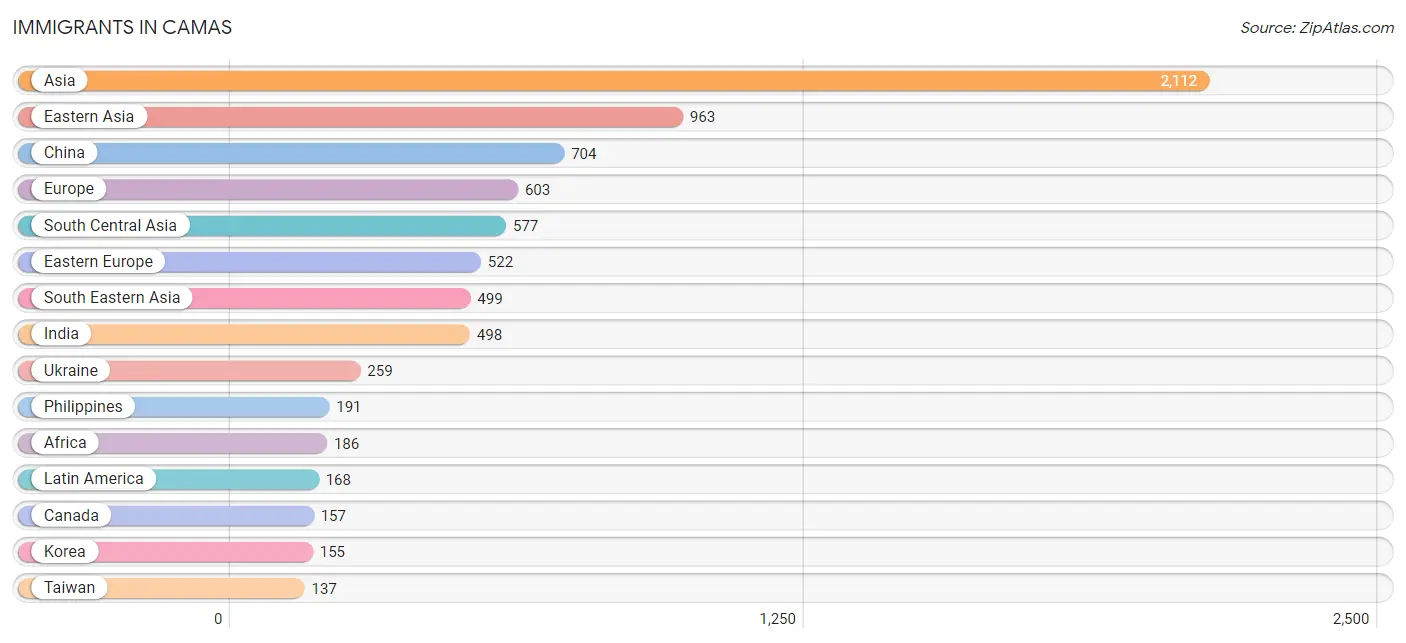
Immigrants in Camas
The most numerous immigrant groups reported in Camas came from Asia (2,112 | 8.0%), Eastern Asia (963 | 3.6%), China (704 | 2.7%), Europe (603 | 2.3%), and South Central Asia (577 | 2.2%), together accounting for 18.8% of all Camas residents.
| Immigration Origin | # Population | % Population |
| Africa | 186 | 0.7% |
| Asia | 2,112 | 8.0% |
| Bosnia and Herzegovina | 55 | 0.2% |
| Brazil | 41 | 0.2% |
| Canada | 157 | 0.6% |
| Central America | 121 | 0.5% |
| China | 704 | 2.7% |
| Czechoslovakia | 8 | 0.0% |
| Eastern Africa | 116 | 0.4% |
| Eastern Asia | 963 | 3.6% |
| Eastern Europe | 522 | 2.0% |
| El Salvador | 12 | 0.1% |
| England | 18 | 0.1% |
| Ethiopia | 7 | 0.0% |
| Europe | 603 | 2.3% |
| France | 9 | 0.0% |
| Germany | 9 | 0.0% |
| Guyana | 6 | 0.0% |
| Hong Kong | 15 | 0.1% |
| India | 498 | 1.9% |
| Indonesia | 40 | 0.2% |
| Iran | 24 | 0.1% |
| Israel | 43 | 0.2% |
| Japan | 104 | 0.4% |
| Jordan | 15 | 0.1% |
| Korea | 155 | 0.6% |
| Latin America | 168 | 0.6% |
| Lithuania | 27 | 0.1% |
| Malaysia | 66 | 0.3% |
| Mexico | 109 | 0.4% |
| Moldova | 12 | 0.1% |
| Morocco | 10 | 0.0% |
| Nepal | 55 | 0.2% |
| Netherlands | 16 | 0.1% |
| Nigeria | 8 | 0.0% |
| Northern Africa | 10 | 0.0% |
| Northern Europe | 31 | 0.1% |
| Philippines | 191 | 0.7% |
| Romania | 26 | 0.1% |
| Russia | 115 | 0.4% |
| Singapore | 21 | 0.1% |
| South Africa | 45 | 0.2% |
| South America | 47 | 0.2% |
| South Central Asia | 577 | 2.2% |
| South Eastern Asia | 499 | 1.9% |
| Southern Europe | 16 | 0.1% |
| Spain | 16 | 0.1% |
| Syria | 15 | 0.1% |
| Taiwan | 137 | 0.5% |
| Thailand | 19 | 0.1% |
| Ukraine | 259 | 1.0% |
| Vietnam | 113 | 0.4% |
| Western Africa | 8 | 0.0% |
| Western Asia | 73 | 0.3% |
| Western Europe | 34 | 0.1% | View All 55 Rows |
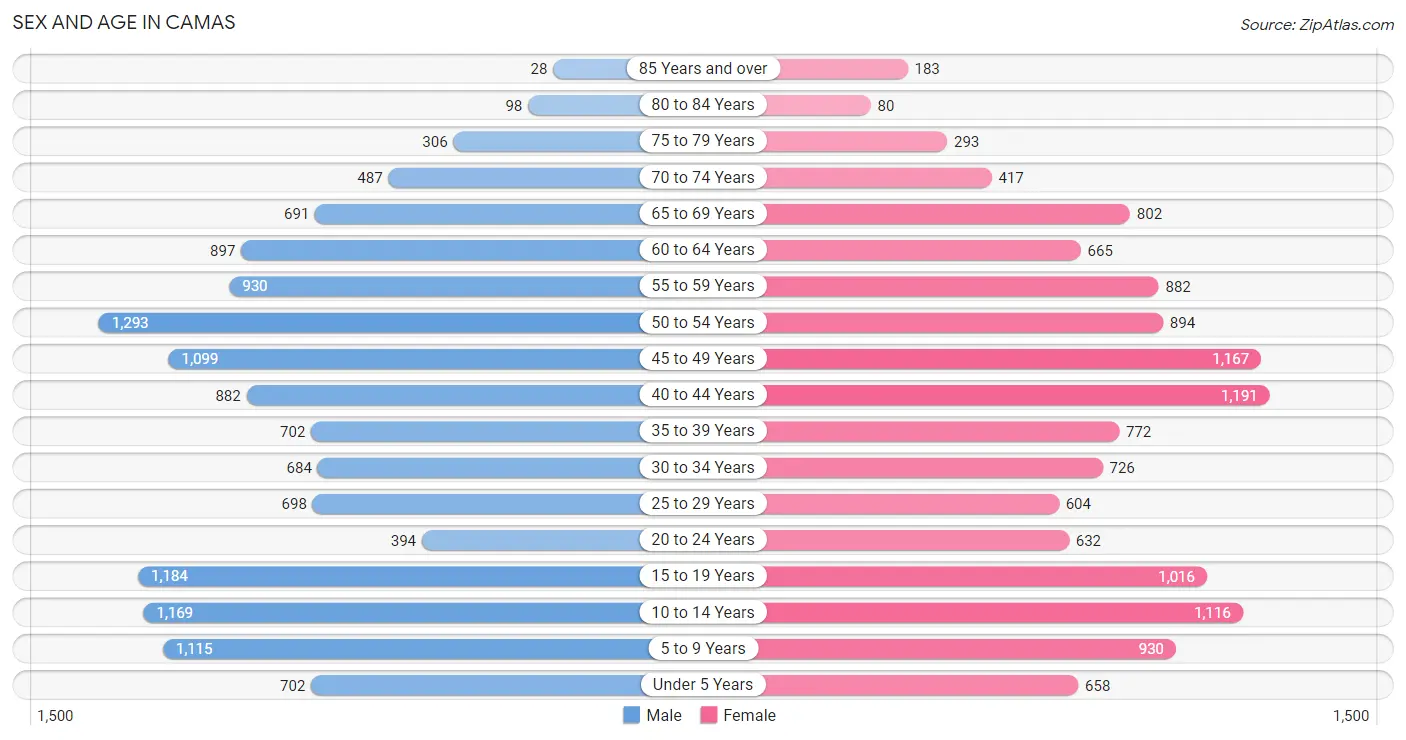
Sex and Age in Camas
Sex and Age in Camas
The most populous age groups in Camas are 50 to 54 Years (1,293 | 9.7%) for men and 40 to 44 Years (1,191 | 9.1%) for women.
| Age Bracket | Male | Female |
| Under 5 Years | 702 (5.2%) | 658 (5.1%) |
| 5 to 9 Years | 1,115 (8.4%) | 930 (7.1%) |
| 10 to 14 Years | 1,169 (8.7%) | 1,116 (8.6%) |
| 15 to 19 Years | 1,184 (8.9%) | 1,016 (7.8%) |
| 20 to 24 Years | 394 (2.9%) | 632 (4.9%) |
| 25 to 29 Years | 698 (5.2%) | 604 (4.6%) |
| 30 to 34 Years | 684 (5.1%) | 726 (5.6%) |
| 35 to 39 Years | 702 (5.2%) | 772 (5.9%) |
| 40 to 44 Years | 882 (6.6%) | 1,191 (9.1%) |
| 45 to 49 Years | 1,099 (8.2%) | 1,167 (9.0%) |
| 50 to 54 Years | 1,293 (9.7%) | 894 (6.9%) |
| 55 to 59 Years | 930 (7.0%) | 882 (6.8%) |
| 60 to 64 Years | 897 (6.7%) | 665 (5.1%) |
| 65 to 69 Years | 691 (5.2%) | 802 (6.2%) |
| 70 to 74 Years | 487 (3.6%) | 417 (3.2%) |
| 75 to 79 Years | 306 (2.3%) | 293 (2.2%) |
| 80 to 84 Years | 98 (0.7%) | 80 (0.6%) |
| 85 Years and over | 28 (0.2%) | 183 (1.4%) |
| Total | 13,359 (100.0%) | 13,028 (100.0%) |
Families and Households in Camas
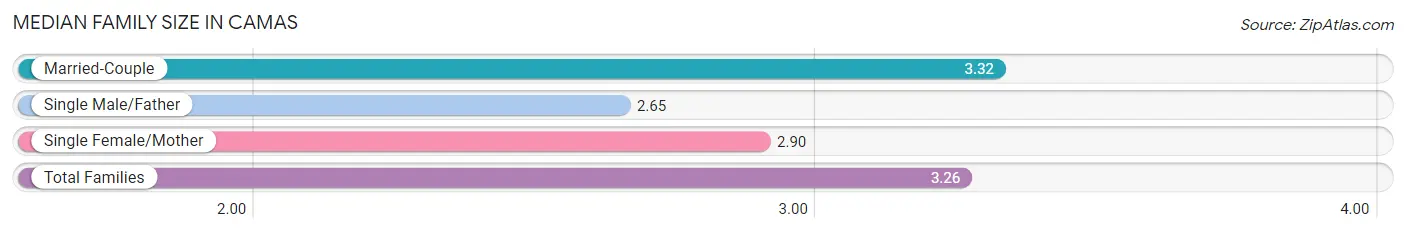
Median Family Size in Camas
The median family size in Camas is 3.26 persons per family, with married-couple families (6,401 | 88.0%) accounting for the largest median family size of 3.32 persons per family. On the other hand, single male/father families (224 | 3.1%) represent the smallest median family size with 2.65 persons per family.
| Family Type | # Families | Family Size |
| Married-Couple | 6,401 (88.0%) | 3.32 |
| Single Male/Father | 224 (3.1%) | 2.65 |
| Single Female/Mother | 646 (8.9%) | 2.90 |
| Total Families | 7,271 (100.0%) | 3.26 |
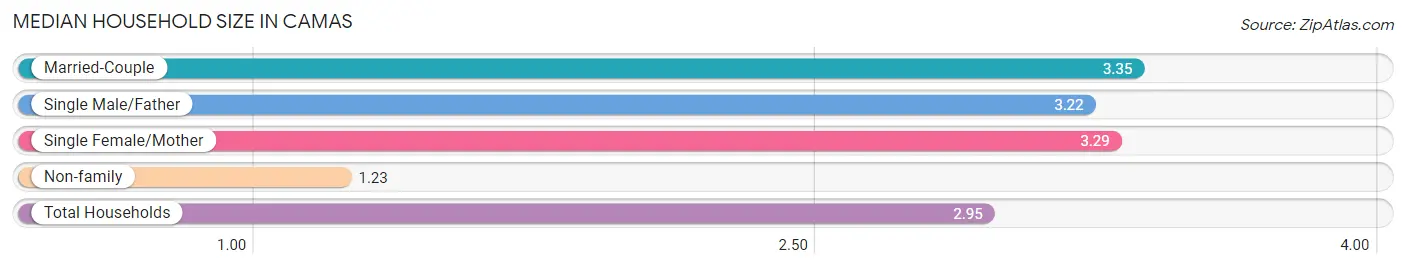
Median Household Size in Camas
The median household size in Camas is 2.95 persons per household, with married-couple households (6,401 | 71.8%) accounting for the largest median household size of 3.35 persons per household. non-family households (1,642 | 18.4%) represent the smallest median household size with 1.23 persons per household.
| Household Type | # Households | Household Size |
| Married-Couple | 6,401 (71.8%) | 3.35 |
| Single Male/Father | 224 (2.5%) | 3.22 |
| Single Female/Mother | 646 (7.2%) | 3.29 |
| Non-family | 1,642 (18.4%) | 1.23 |
| Total Households | 8,913 (100.0%) | 2.95 |
Household Size by Marriage Status in Camas
Out of a total of 8,913 households in Camas, 7,271 (81.6%) are family households, while 1,642 (18.4%) are nonfamily households. The most numerous type of family households are 2-person households, comprising 2,627, and the most common type of nonfamily households are 1-person households, comprising 1,332.
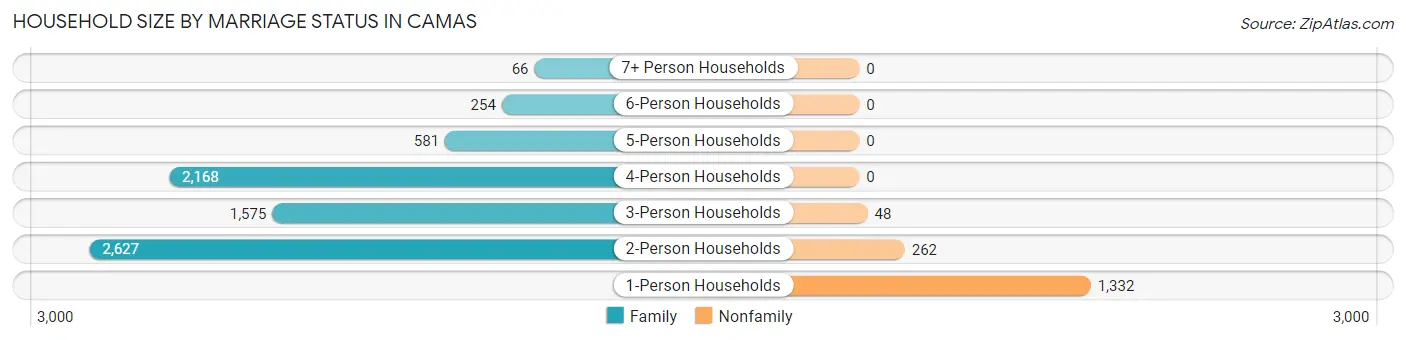
| Household Size | Family Households | Nonfamily Households |
| 1-Person Households | - | 1,332 (14.9%) |
| 2-Person Households | 2,627 (29.5%) | 262 (2.9%) |
| 3-Person Households | 1,575 (17.7%) | 48 (0.5%) |
| 4-Person Households | 2,168 (24.3%) | 0 (0.0%) |
| 5-Person Households | 581 (6.5%) | 0 (0.0%) |
| 6-Person Households | 254 (2.9%) | 0 (0.0%) |
| 7+ Person Households | 66 (0.7%) | 0 (0.0%) |
| Total | 7,271 (81.6%) | 1,642 (18.4%) |
Female Fertility in Camas
Fertility by Age in Camas
Average fertility rate in Camas is 62.0 births per 1,000 women. Women in the age bracket of 20 to 34 years have the highest fertility rate with 147.0 births per 1,000 women. Women in the age bracket of 20 to 34 years acount for 74.0% of all women with births.
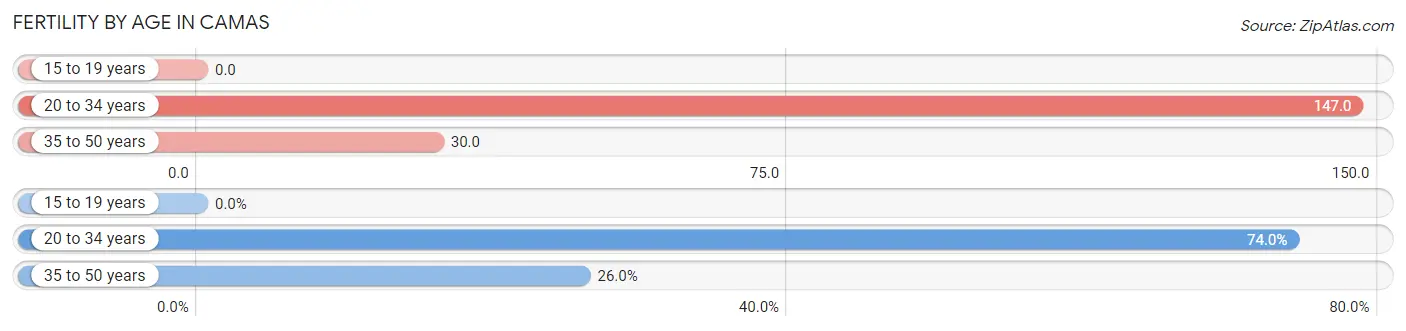
| Age Bracket | Women with Births | Births / 1,000 Women |
| 15 to 19 years | 0 (0.0%) | 0.0 |
| 20 to 34 years | 288 (74.0%) | 147.0 |
| 35 to 50 years | 101 (26.0%) | 30.0 |
| Total | 389 (100.0%) | 62.0 |
Fertility by Age by Marriage Status in Camas
97.7% of women with births (389) in Camas are married. The highest percentage of unmarried women with births falls into 20 to 34 years age bracket with 3.1% of them unmarried at the time of birth, while the lowest percentage of unmarried women with births belong to 35 to 50 years age bracket with 0.0% of them unmarried.
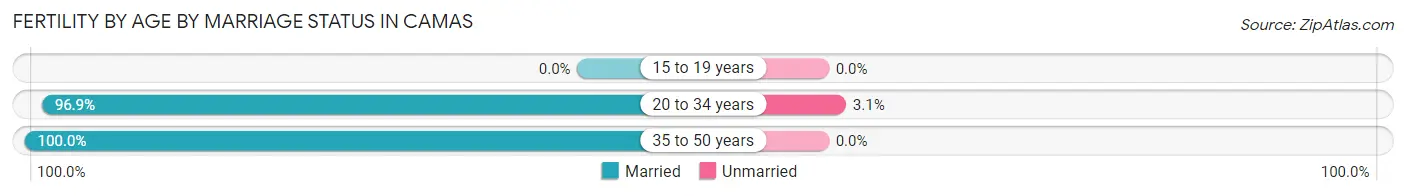
| Age Bracket | Married | Unmarried |
| 15 to 19 years | 0 (0.0%) | 0 (0.0%) |
| 20 to 34 years | 279 (96.9%) | 9 (3.1%) |
| 35 to 50 years | 101 (100.0%) | 0 (0.0%) |
| Total | 380 (97.7%) | 9 (2.3%) |
Fertility by Education in Camas
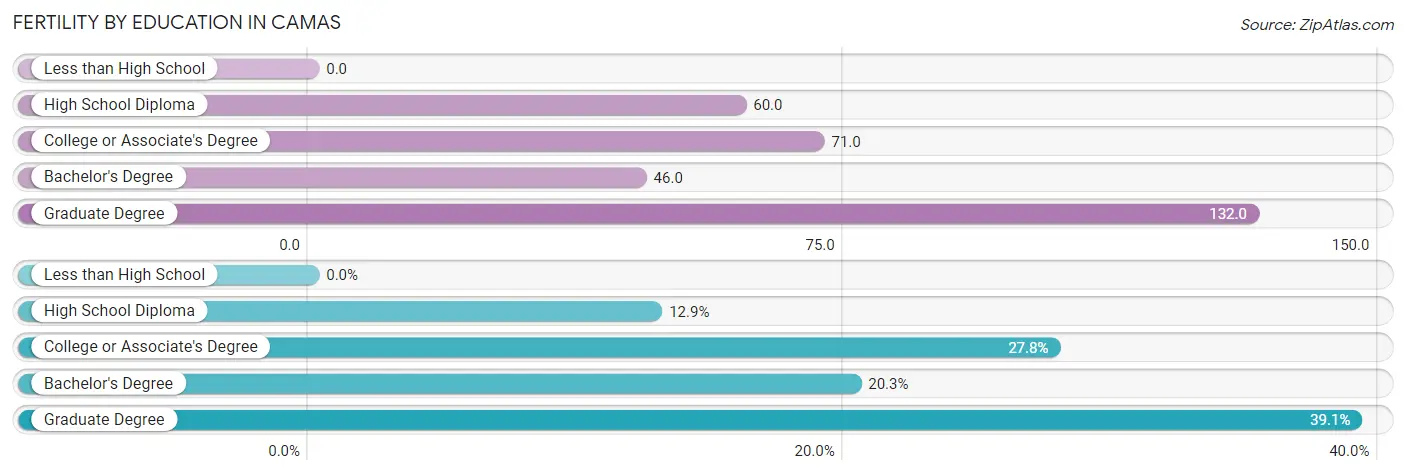
| Educational Attainment | Women with Births | Births / 1,000 Women |
| Less than High School | 0 (0.0%) | 0.0 |
| High School Diploma | 50 (12.9%) | 60.0 |
| College or Associate's Degree | 108 (27.8%) | 71.0 |
| Bachelor's Degree | 79 (20.3%) | 46.0 |
| Graduate Degree | 152 (39.1%) | 132.0 |
| Total | 389 (100.0%) | 62.0 |
Fertility by Education by Marriage Status in Camas
2.3% of women with births in Camas are unmarried. Women with the educational attainment of college or associate's degree are most likely to be married with 100.0% of them married at childbirth, while women with the educational attainment of high school diploma are least likely to be married with 18.0% of them unmarried at childbirth.
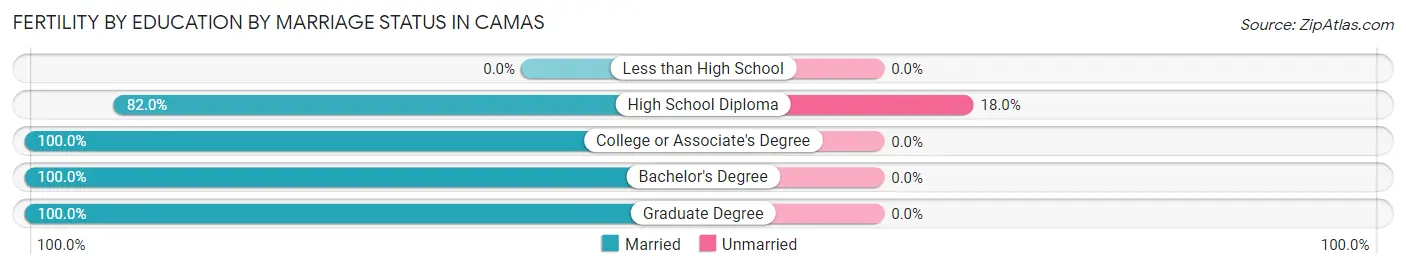
| Educational Attainment | Married | Unmarried |
| Less than High School | 0 (0.0%) | 0 (0.0%) |
| High School Diploma | 41 (82.0%) | 9 (18.0%) |
| College or Associate's Degree | 108 (100.0%) | 0 (0.0%) |
| Bachelor's Degree | 79 (100.0%) | 0 (0.0%) |
| Graduate Degree | 152 (100.0%) | 0 (0.0%) |
| Total | 380 (97.7%) | 9 (2.3%) |
Employment Characteristics in Camas
Employment by Class of Employer in Camas
Among the 12,303 employed individuals in Camas, private company employees (7,882 | 64.1%), local government employees (998 | 8.1%), and self-employed (incorporated) (935 | 7.6%) make up the most common classes of employment.
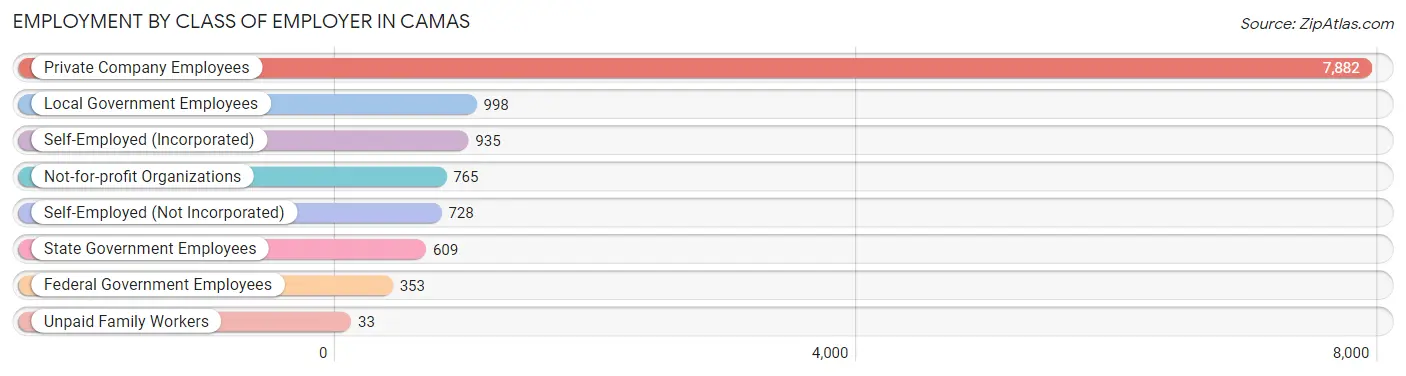
| Employer Class | # Employees | % Employees |
| Private Company Employees | 7,882 | 64.1% |
| Self-Employed (Incorporated) | 935 | 7.6% |
| Self-Employed (Not Incorporated) | 728 | 5.9% |
| Not-for-profit Organizations | 765 | 6.2% |
| Local Government Employees | 998 | 8.1% |
| State Government Employees | 609 | 5.0% |
| Federal Government Employees | 353 | 2.9% |
| Unpaid Family Workers | 33 | 0.3% |
| Total | 12,303 | 100.0% |
Employment Status by Age in Camas
According to the labor force statistics for Camas, out of the total population over 16 years of age (19,990), 64.8% or 12,954 individuals are in the labor force, with 2.4% or 311 of them unemployed. The age group with the highest labor force participation rate is 45 to 54 years, with 87.9% or 3,914 individuals in the labor force. Within the labor force, the 65 to 74 years age range has the highest percentage of unemployed individuals, with 15.5% or 80 of them being unemployed.
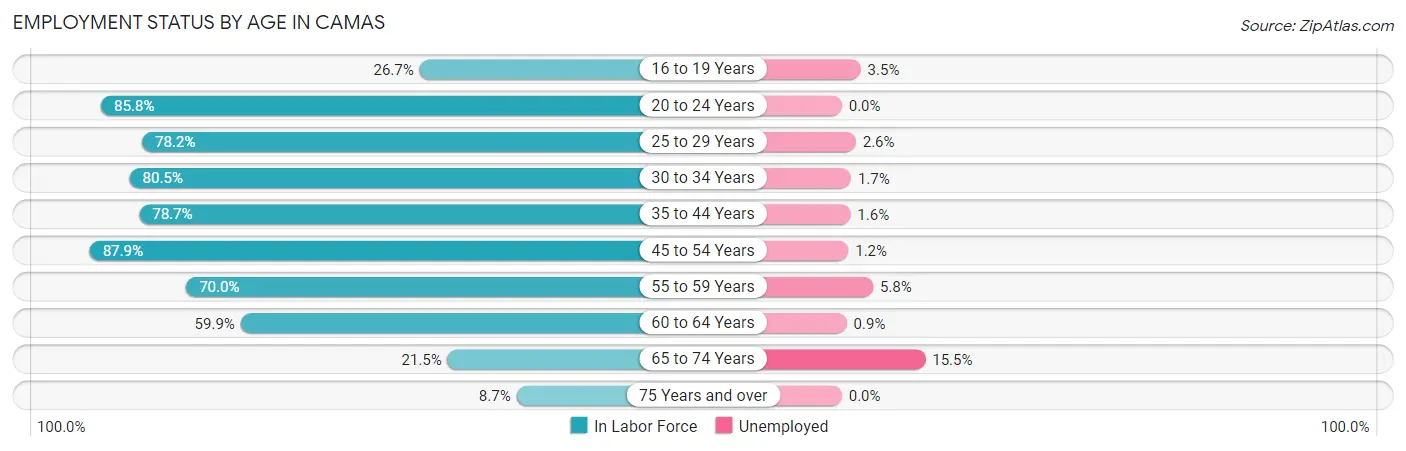
| Age Bracket | In Labor Force | Unemployed |
| 16 to 19 Years | 399 (26.7%) | 14 (3.5%) |
| 20 to 24 Years | 880 (85.8%) | 0 (0.0%) |
| 25 to 29 Years | 1,018 (78.2%) | 26 (2.6%) |
| 30 to 34 Years | 1,135 (80.5%) | 19 (1.7%) |
| 35 to 44 Years | 2,791 (78.7%) | 45 (1.6%) |
| 45 to 54 Years | 3,914 (87.9%) | 47 (1.2%) |
| 55 to 59 Years | 1,268 (70.0%) | 74 (5.8%) |
| 60 to 64 Years | 936 (59.9%) | 8 (0.9%) |
| 65 to 74 Years | 515 (21.5%) | 80 (15.5%) |
| 75 Years and over | 86 (8.7%) | 0 (0.0%) |
| Total | 12,954 (64.8%) | 311 (2.4%) |
Employment Status by Educational Attainment in Camas
According to labor force statistics for Camas, 78.6% of individuals (11,072) out of the total population between 25 and 64 years of age (14,086) are in the labor force, with 2.0% or 221 of them being unemployed. The group with the highest labor force participation rate are those with the educational attainment of bachelor's degree or higher, with 82.9% or 6,357 individuals in the labor force. Within the labor force, individuals with less than high school education have the highest percentage of unemployment, with 13.7% or 32 of them being unemployed.
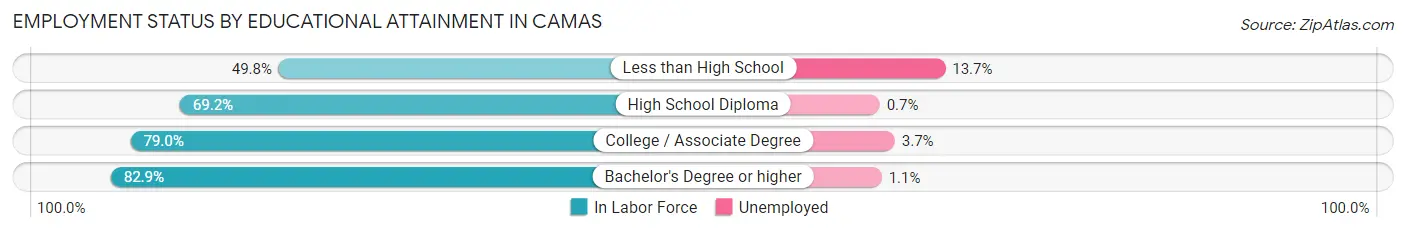
| Educational Attainment | In Labor Force | Unemployed |
| Less than High School | 233 (49.8%) | 64 (13.7%) |
| High School Diploma | 1,573 (69.2%) | 16 (0.7%) |
| College / Associate Degree | 2,905 (79.0%) | 136 (3.7%) |
| Bachelor's Degree or higher | 6,357 (82.9%) | 84 (1.1%) |
| Total | 11,072 (78.6%) | 282 (2.0%) |
Employment Occupations by Sex in Camas
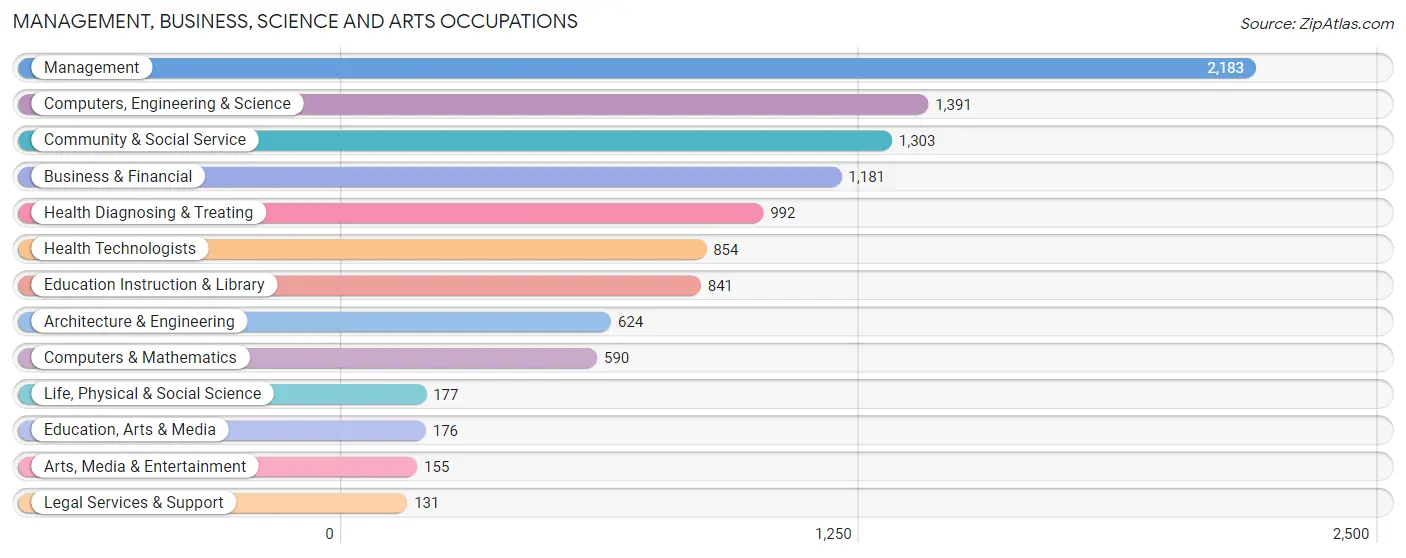
Management, Business, Science and Arts Occupations
The most common Management, Business, Science and Arts occupations in Camas are Management (2,183 | 17.3%), Computers, Engineering & Science (1,391 | 11.0%), Community & Social Service (1,303 | 10.3%), Business & Financial (1,181 | 9.4%), and Health Diagnosing & Treating (992 | 7.9%).
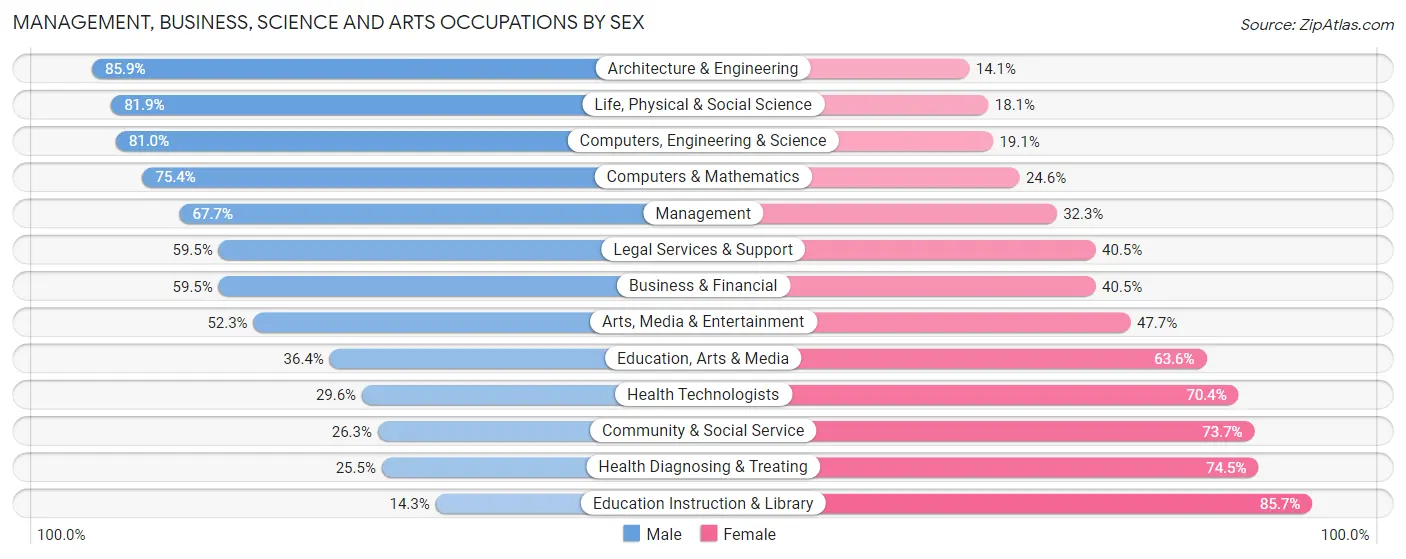
Management, Business, Science and Arts Occupations by Sex
Within the Management, Business, Science and Arts occupations in Camas, the most male-oriented occupations are Architecture & Engineering (85.9%), Life, Physical & Social Science (81.9%), and Computers, Engineering & Science (80.9%), while the most female-oriented occupations are Education Instruction & Library (85.7%), Health Diagnosing & Treating (74.5%), and Community & Social Service (73.7%).
| Occupation | Male | Female |
| Management | 1,477 (67.7%) | 706 (32.3%) |
| Business & Financial | 703 (59.5%) | 478 (40.5%) |
| Computers, Engineering & Science | 1,126 (80.9%) | 265 (19.1%) |
| Computers & Mathematics | 445 (75.4%) | 145 (24.6%) |
| Architecture & Engineering | 536 (85.9%) | 88 (14.1%) |
| Life, Physical & Social Science | 145 (81.9%) | 32 (18.1%) |
| Community & Social Service | 343 (26.3%) | 960 (73.7%) |
| Education, Arts & Media | 64 (36.4%) | 112 (63.6%) |
| Legal Services & Support | 78 (59.5%) | 53 (40.5%) |
| Education Instruction & Library | 120 (14.3%) | 721 (85.7%) |
| Arts, Media & Entertainment | 81 (52.3%) | 74 (47.7%) |
| Health Diagnosing & Treating | 253 (25.5%) | 739 (74.5%) |
| Health Technologists | 253 (29.6%) | 601 (70.4%) |
| Total (Category) | 3,902 (55.3%) | 3,148 (44.7%) |
| Total (Overall) | 6,883 (54.6%) | 5,718 (45.4%) |
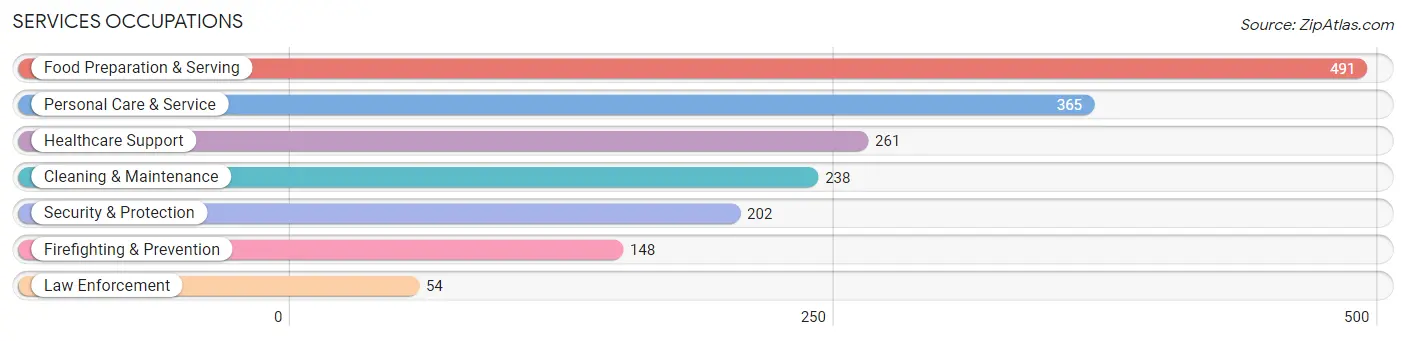
Services Occupations
The most common Services occupations in Camas are Food Preparation & Serving (491 | 3.9%), Personal Care & Service (365 | 2.9%), Healthcare Support (261 | 2.1%), Cleaning & Maintenance (238 | 1.9%), and Security & Protection (202 | 1.6%).
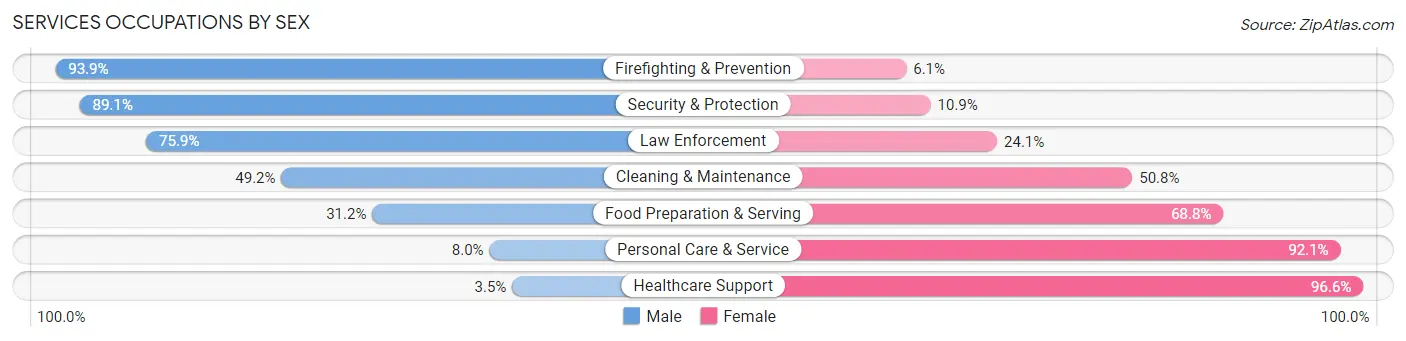
Services Occupations by Sex
Within the Services occupations in Camas, the most male-oriented occupations are Firefighting & Prevention (93.9%), Security & Protection (89.1%), and Law Enforcement (75.9%), while the most female-oriented occupations are Healthcare Support (96.6%), Personal Care & Service (92.0%), and Food Preparation & Serving (68.8%).
| Occupation | Male | Female |
| Healthcare Support | 9 (3.5%) | 252 (96.6%) |
| Security & Protection | 180 (89.1%) | 22 (10.9%) |
| Firefighting & Prevention | 139 (93.9%) | 9 (6.1%) |
| Law Enforcement | 41 (75.9%) | 13 (24.1%) |
| Food Preparation & Serving | 153 (31.2%) | 338 (68.8%) |
| Cleaning & Maintenance | 117 (49.2%) | 121 (50.8%) |
| Personal Care & Service | 29 (8.0%) | 336 (92.0%) |
| Total (Category) | 488 (31.3%) | 1,069 (68.7%) |
| Total (Overall) | 6,883 (54.6%) | 5,718 (45.4%) |
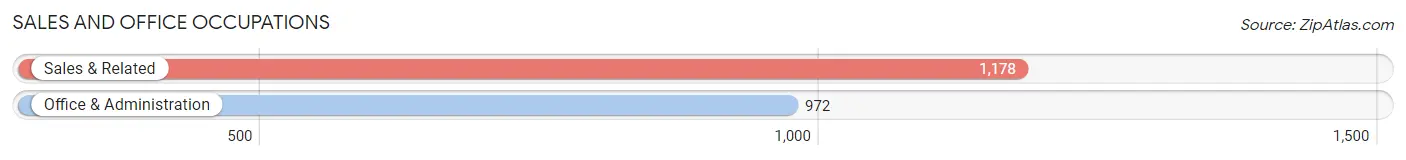
Sales and Office Occupations
The most common Sales and Office occupations in Camas are Sales & Related (1,178 | 9.3%), and Office & Administration (972 | 7.7%).
Sales and Office Occupations by Sex
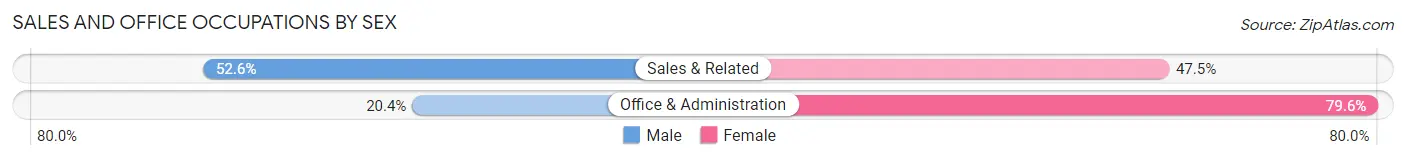
| Occupation | Male | Female |
| Sales & Related | 619 (52.5%) | 559 (47.4%) |
| Office & Administration | 198 (20.4%) | 774 (79.6%) |
| Total (Category) | 817 (38.0%) | 1,333 (62.0%) |
| Total (Overall) | 6,883 (54.6%) | 5,718 (45.4%) |
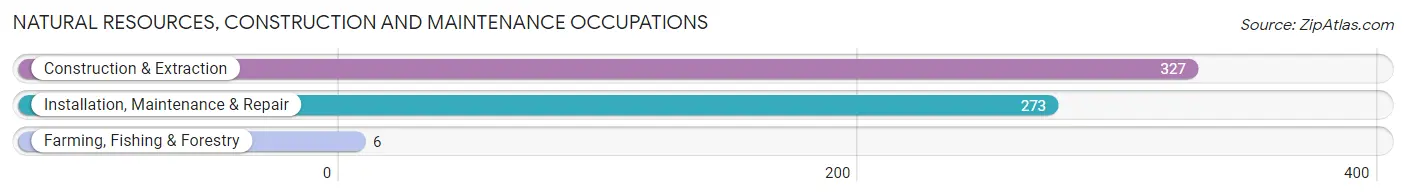
Natural Resources, Construction and Maintenance Occupations
The most common Natural Resources, Construction and Maintenance occupations in Camas are Construction & Extraction (327 | 2.6%), Installation, Maintenance & Repair (273 | 2.2%), and Farming, Fishing & Forestry (6 | 0.1%).
Natural Resources, Construction and Maintenance Occupations by Sex
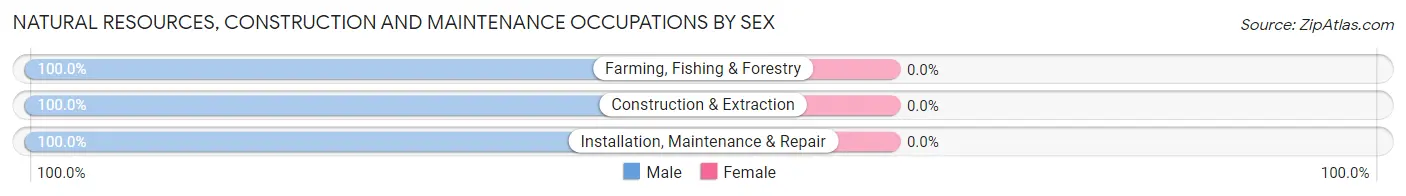
| Occupation | Male | Female |
| Farming, Fishing & Forestry | 6 (100.0%) | 0 (0.0%) |
| Construction & Extraction | 327 (100.0%) | 0 (0.0%) |
| Installation, Maintenance & Repair | 273 (100.0%) | 0 (0.0%) |
| Total (Category) | 606 (100.0%) | 0 (0.0%) |
| Total (Overall) | 6,883 (54.6%) | 5,718 (45.4%) |
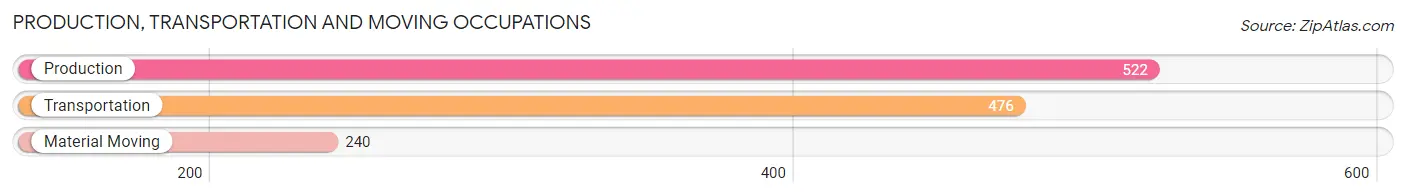
Production, Transportation and Moving Occupations
The most common Production, Transportation and Moving occupations in Camas are Production (522 | 4.1%), Transportation (476 | 3.8%), and Material Moving (240 | 1.9%).
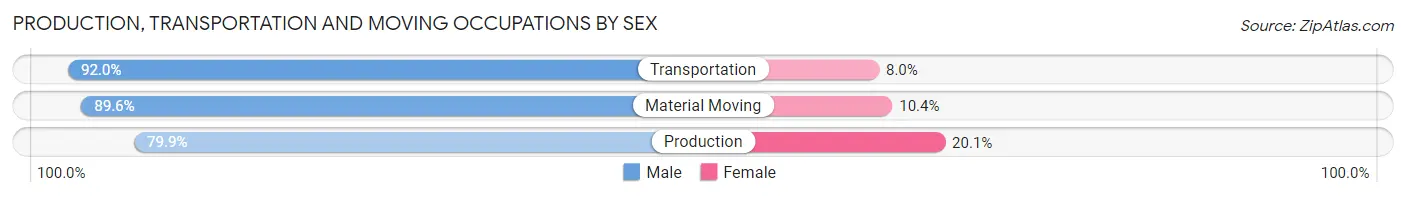
Production, Transportation and Moving Occupations by Sex
| Occupation | Male | Female |
| Production | 417 (79.9%) | 105 (20.1%) |
| Transportation | 438 (92.0%) | 38 (8.0%) |
| Material Moving | 215 (89.6%) | 25 (10.4%) |
| Total (Category) | 1,070 (86.4%) | 168 (13.6%) |
| Total (Overall) | 6,883 (54.6%) | 5,718 (45.4%) |
Employment Industries by Sex in Camas
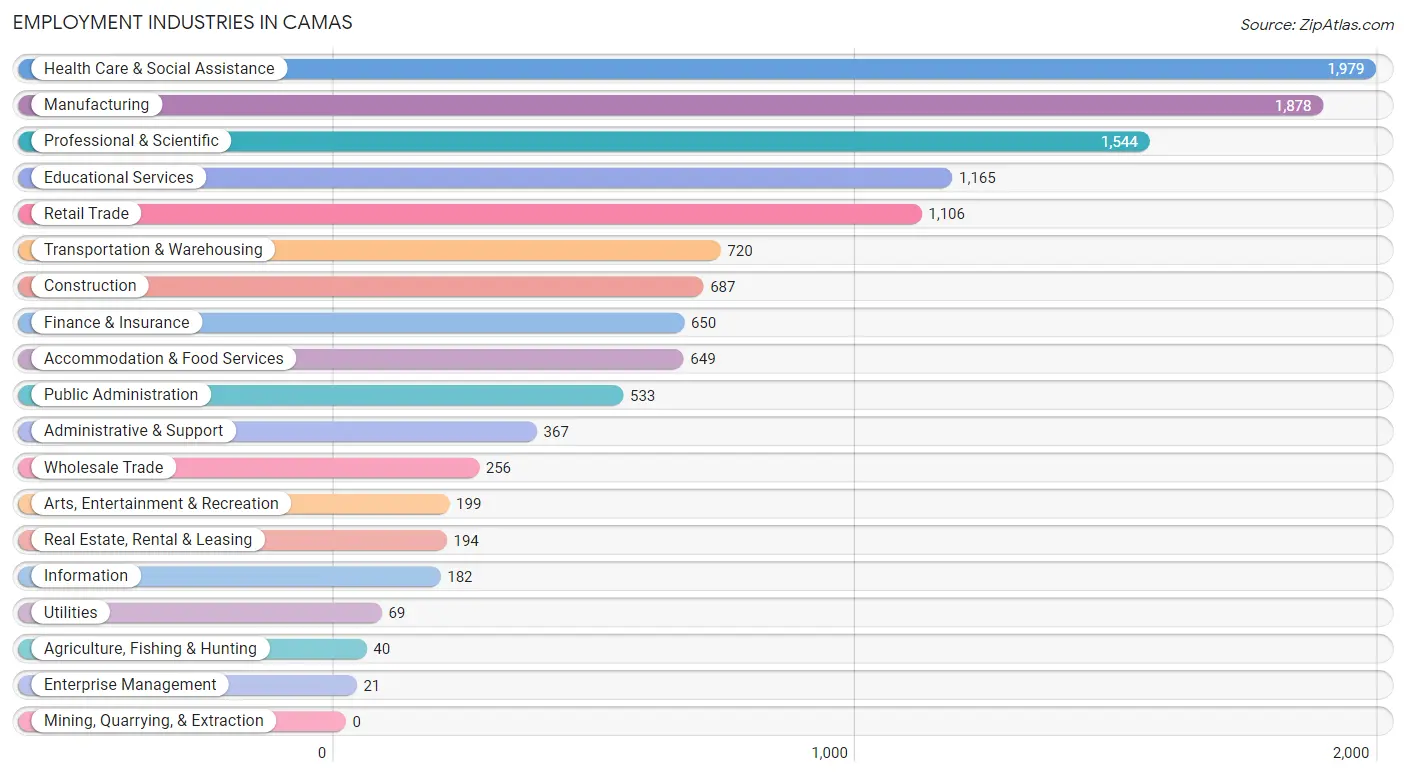
Employment Industries in Camas
The major employment industries in Camas include Health Care & Social Assistance (1,979 | 15.7%), Manufacturing (1,878 | 14.9%), Professional & Scientific (1,544 | 12.2%), Educational Services (1,165 | 9.2%), and Retail Trade (1,106 | 8.8%).
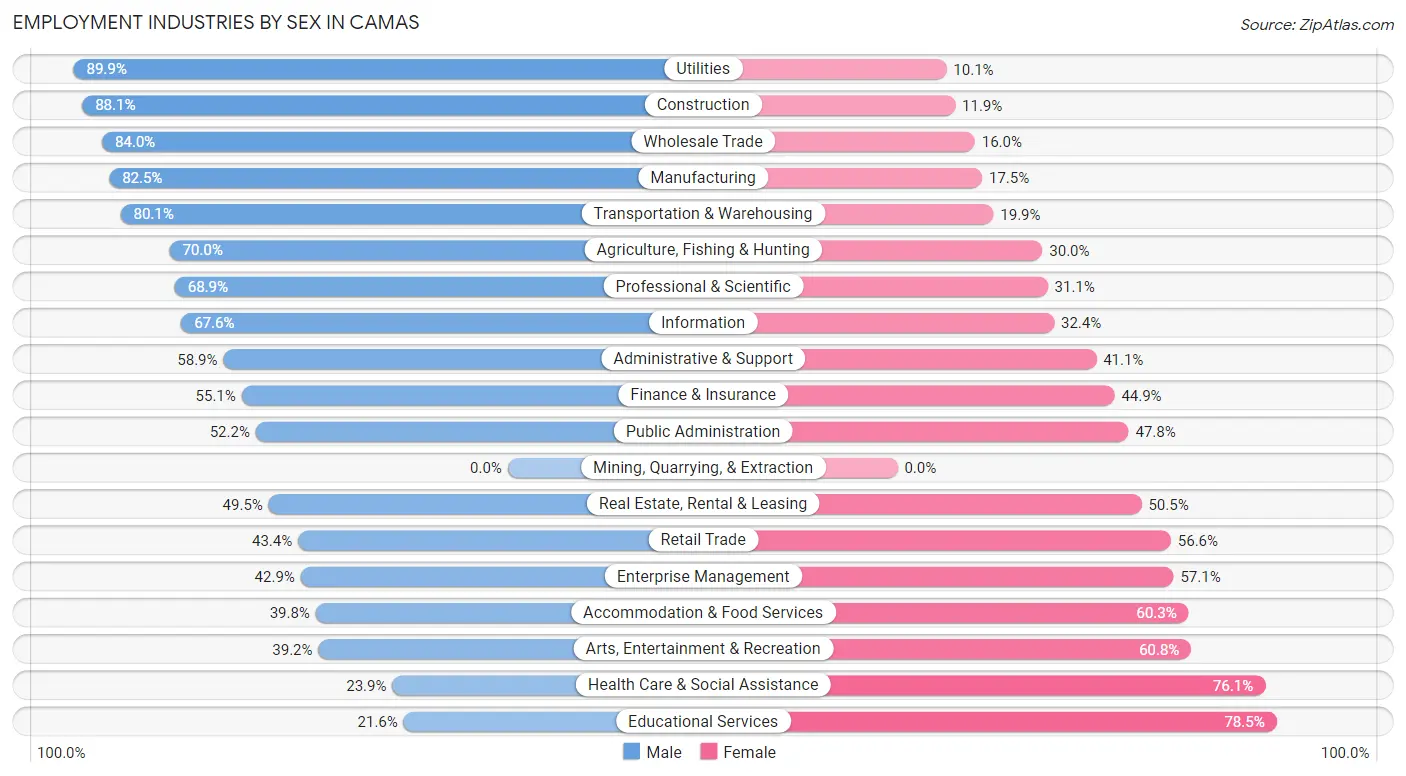
Employment Industries by Sex in Camas
The Camas industries that see more men than women are Utilities (89.9%), Construction (88.1%), and Wholesale Trade (84.0%), whereas the industries that tend to have a higher number of women are Educational Services (78.4%), Health Care & Social Assistance (76.1%), and Arts, Entertainment & Recreation (60.8%).
| Industry | Male | Female |
| Agriculture, Fishing & Hunting | 28 (70.0%) | 12 (30.0%) |
| Mining, Quarrying, & Extraction | 0 (0.0%) | 0 (0.0%) |
| Construction | 605 (88.1%) | 82 (11.9%) |
| Manufacturing | 1,549 (82.5%) | 329 (17.5%) |
| Wholesale Trade | 215 (84.0%) | 41 (16.0%) |
| Retail Trade | 480 (43.4%) | 626 (56.6%) |
| Transportation & Warehousing | 577 (80.1%) | 143 (19.9%) |
| Utilities | 62 (89.9%) | 7 (10.1%) |
| Information | 123 (67.6%) | 59 (32.4%) |
| Finance & Insurance | 358 (55.1%) | 292 (44.9%) |
| Real Estate, Rental & Leasing | 96 (49.5%) | 98 (50.5%) |
| Professional & Scientific | 1,064 (68.9%) | 480 (31.1%) |
| Enterprise Management | 9 (42.9%) | 12 (57.1%) |
| Administrative & Support | 216 (58.9%) | 151 (41.1%) |
| Educational Services | 251 (21.5%) | 914 (78.4%) |
| Health Care & Social Assistance | 473 (23.9%) | 1,506 (76.1%) |
| Arts, Entertainment & Recreation | 78 (39.2%) | 121 (60.8%) |
| Accommodation & Food Services | 258 (39.8%) | 391 (60.3%) |
| Public Administration | 278 (52.2%) | 255 (47.8%) |
| Total | 6,883 (54.6%) | 5,718 (45.4%) |
Education in Camas
School Enrollment in Camas
The most common levels of schooling among the 7,477 students in Camas are high school (2,040 | 27.3%), middle school (1,835 | 24.5%), and elementary school (1,601 | 21.4%).
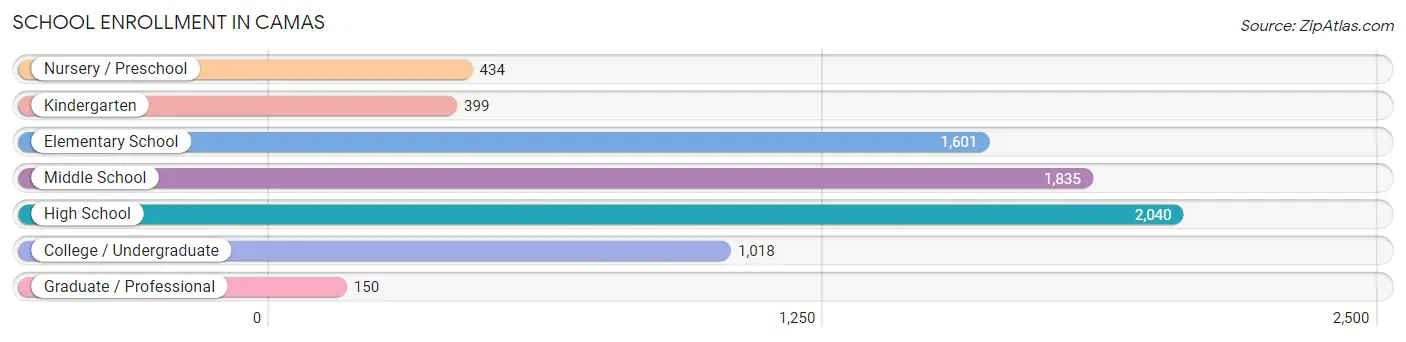
| School Level | # Students | % Students |
| Nursery / Preschool | 434 | 5.8% |
| Kindergarten | 399 | 5.3% |
| Elementary School | 1,601 | 21.4% |
| Middle School | 1,835 | 24.5% |
| High School | 2,040 | 27.3% |
| College / Undergraduate | 1,018 | 13.6% |
| Graduate / Professional | 150 | 2.0% |
| Total | 7,477 | 100.0% |
School Enrollment by Age by Funding Source in Camas
Out of a total of 7,477 students who are enrolled in schools in Camas, 935 (12.5%) attend a private institution, while the remaining 6,542 (87.5%) are enrolled in public schools. The age group of 3 to 4 year olds has the highest likelihood of being enrolled in private schools, with 216 (78.5% in the age bracket) enrolled. Conversely, the age group of 18 to 19 year olds has the lowest likelihood of being enrolled in a private school, with 414 (97.0% in the age bracket) attending a public institution.
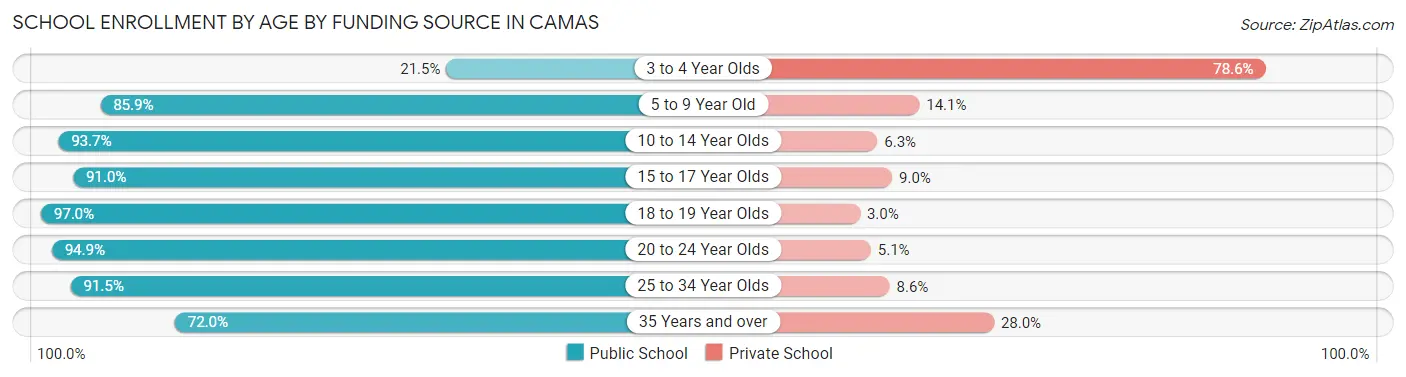
| Age Bracket | Public School | Private School |
| 3 to 4 Year Olds | 59 (21.4%) | 216 (78.5%) |
| 5 to 9 Year Old | 1,665 (85.9%) | 273 (14.1%) |
| 10 to 14 Year Olds | 2,107 (93.7%) | 141 (6.3%) |
| 15 to 17 Year Olds | 1,482 (91.0%) | 147 (9.0%) |
| 18 to 19 Year Olds | 414 (97.0%) | 13 (3.0%) |
| 20 to 24 Year Olds | 394 (94.9%) | 21 (5.1%) |
| 25 to 34 Year Olds | 139 (91.4%) | 13 (8.6%) |
| 35 Years and over | 283 (72.0%) | 110 (28.0%) |
| Total | 6,542 (87.5%) | 935 (12.5%) |
Educational Attainment by Field of Study in Camas
Business (1,941 | 19.6%), engineering (1,278 | 12.9%), science & technology (973 | 9.8%), social sciences (786 | 8.0%), and bio, nature & agricultural (750 | 7.6%) are the most common fields of study among 9,889 individuals in Camas who have obtained a bachelor's degree or higher.
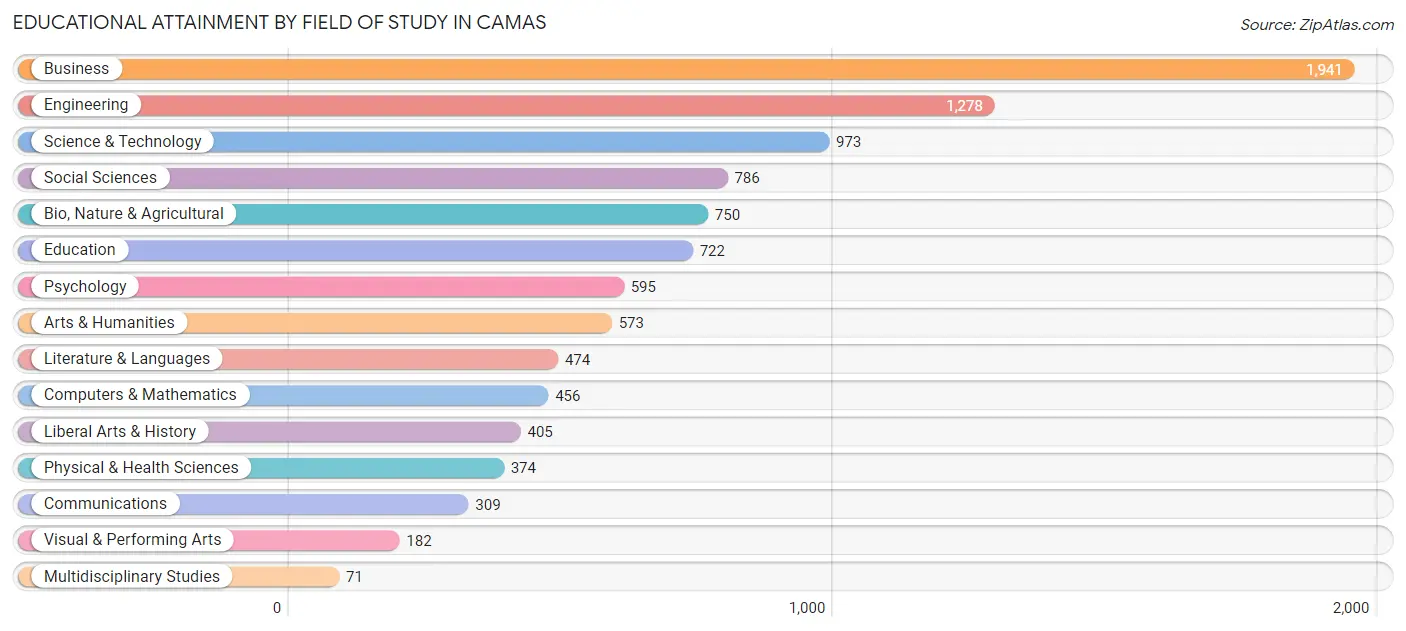
| Field of Study | # Graduates | % Graduates |
| Computers & Mathematics | 456 | 4.6% |
| Bio, Nature & Agricultural | 750 | 7.6% |
| Physical & Health Sciences | 374 | 3.8% |
| Psychology | 595 | 6.0% |
| Social Sciences | 786 | 8.0% |
| Engineering | 1,278 | 12.9% |
| Multidisciplinary Studies | 71 | 0.7% |
| Science & Technology | 973 | 9.8% |
| Business | 1,941 | 19.6% |
| Education | 722 | 7.3% |
| Literature & Languages | 474 | 4.8% |
| Liberal Arts & History | 405 | 4.1% |
| Visual & Performing Arts | 182 | 1.8% |
| Communications | 309 | 3.1% |
| Arts & Humanities | 573 | 5.8% |
| Total | 9,889 | 100.0% |
Transportation & Commute in Camas
Vehicle Availability by Sex in Camas
The most prevalent vehicle ownership categories in Camas are males with 2 vehicles (3,110, accounting for 46.1%) and females with 2 vehicles (2,517, making up 55.9%).
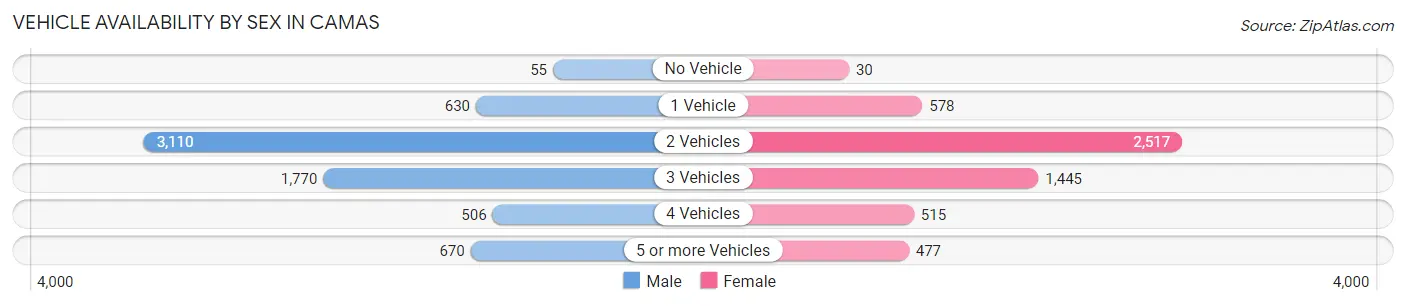
| Vehicles Available | Male | Female |
| No Vehicle | 55 (0.8%) | 30 (0.5%) |
| 1 Vehicle | 630 (9.3%) | 578 (10.4%) |
| 2 Vehicles | 3,110 (46.1%) | 2,517 (45.3%) |
| 3 Vehicles | 1,770 (26.3%) | 1,445 (26.0%) |
| 4 Vehicles | 506 (7.5%) | 515 (9.3%) |
| 5 or more Vehicles | 670 (9.9%) | 477 (8.6%) |
| Total | 6,741 (100.0%) | 5,562 (100.0%) |
Commute Time in Camas
The most frequently occuring commute durations in Camas are 20 to 24 minutes (1,692 commuters, 18.0%), 15 to 19 minutes (1,357 commuters, 14.5%), and 10 to 14 minutes (1,145 commuters, 12.2%).
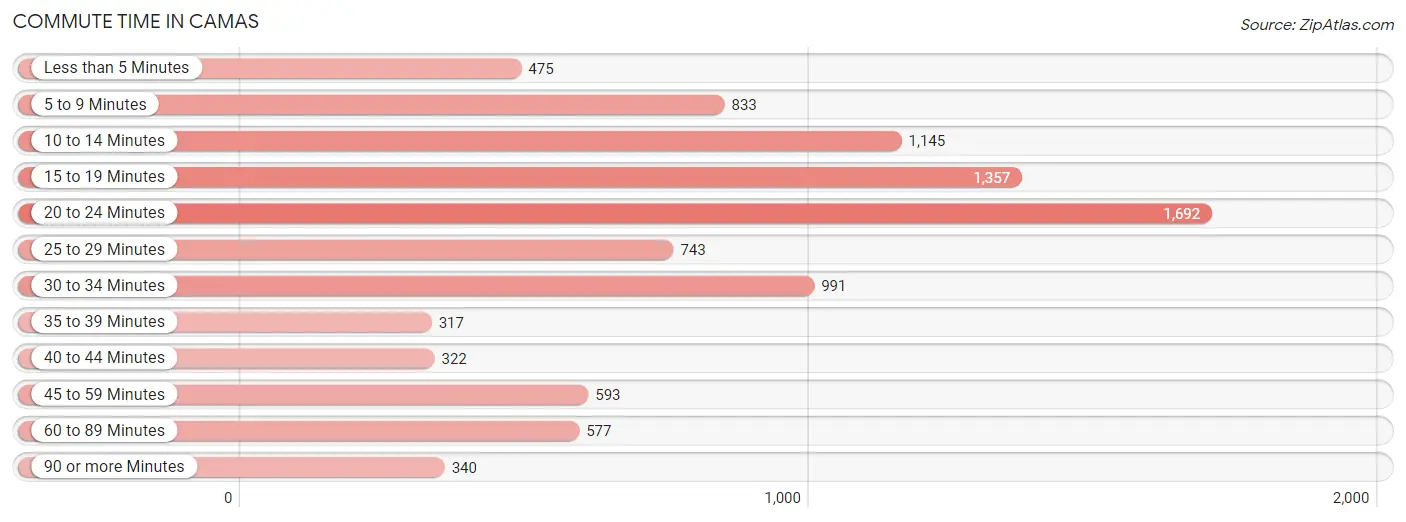
| Commute Time | # Commuters | % Commuters |
| Less than 5 Minutes | 475 | 5.1% |
| 5 to 9 Minutes | 833 | 8.9% |
| 10 to 14 Minutes | 1,145 | 12.2% |
| 15 to 19 Minutes | 1,357 | 14.5% |
| 20 to 24 Minutes | 1,692 | 18.0% |
| 25 to 29 Minutes | 743 | 7.9% |
| 30 to 34 Minutes | 991 | 10.6% |
| 35 to 39 Minutes | 317 | 3.4% |
| 40 to 44 Minutes | 322 | 3.4% |
| 45 to 59 Minutes | 593 | 6.3% |
| 60 to 89 Minutes | 577 | 6.1% |
| 90 or more Minutes | 340 | 3.6% |
Commute Time by Sex in Camas
The most common commute times in Camas are 20 to 24 minutes (959 commuters, 19.1%) for males and 15 to 19 minutes (773 commuters, 17.7%) for females.
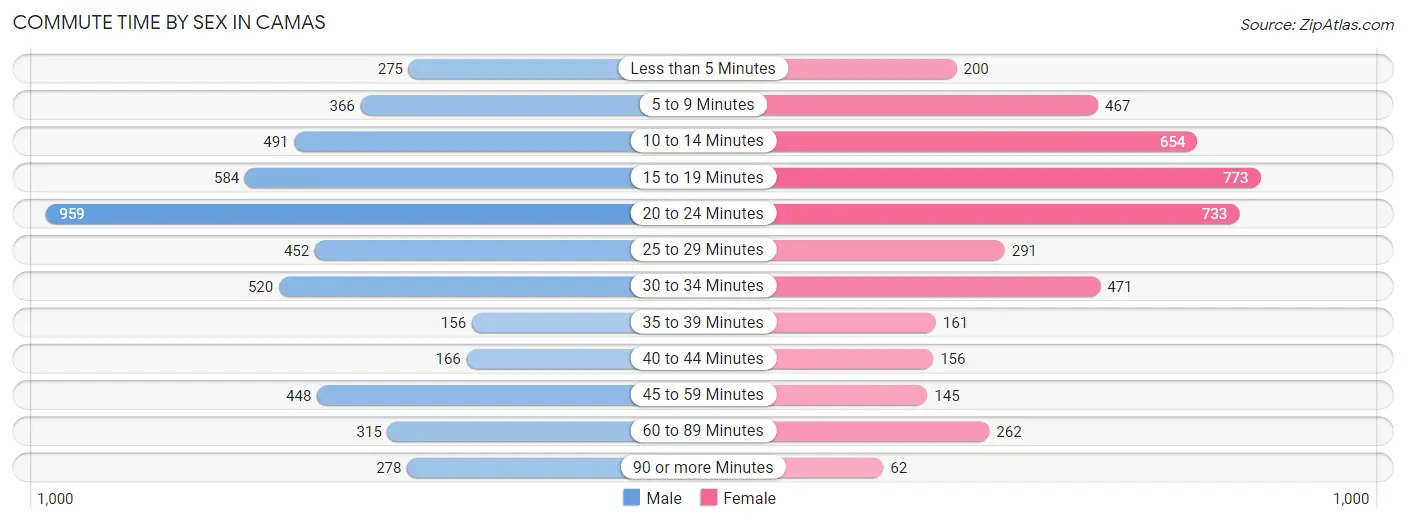
| Commute Time | Male | Female |
| Less than 5 Minutes | 275 (5.5%) | 200 (4.6%) |
| 5 to 9 Minutes | 366 (7.3%) | 467 (10.7%) |
| 10 to 14 Minutes | 491 (9.8%) | 654 (14.9%) |
| 15 to 19 Minutes | 584 (11.7%) | 773 (17.7%) |
| 20 to 24 Minutes | 959 (19.1%) | 733 (16.8%) |
| 25 to 29 Minutes | 452 (9.0%) | 291 (6.7%) |
| 30 to 34 Minutes | 520 (10.4%) | 471 (10.8%) |
| 35 to 39 Minutes | 156 (3.1%) | 161 (3.7%) |
| 40 to 44 Minutes | 166 (3.3%) | 156 (3.6%) |
| 45 to 59 Minutes | 448 (8.9%) | 145 (3.3%) |
| 60 to 89 Minutes | 315 (6.3%) | 262 (6.0%) |
| 90 or more Minutes | 278 (5.6%) | 62 (1.4%) |
Time of Departure to Work by Sex in Camas
The most frequent times of departure to work in Camas are 7:00 AM to 7:29 AM (895, 17.9%) for males and 8:00 AM to 8:29 AM (625, 14.3%) for females.
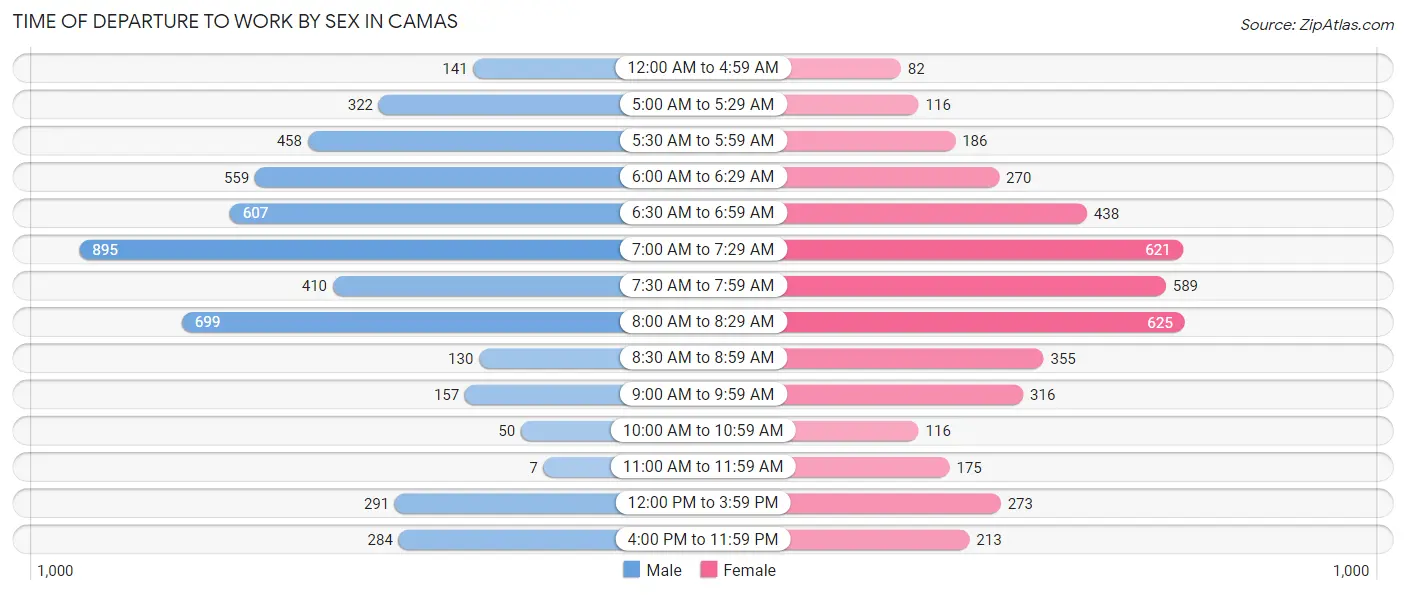
| Time of Departure | Male | Female |
| 12:00 AM to 4:59 AM | 141 (2.8%) | 82 (1.9%) |
| 5:00 AM to 5:29 AM | 322 (6.4%) | 116 (2.6%) |
| 5:30 AM to 5:59 AM | 458 (9.1%) | 186 (4.3%) |
| 6:00 AM to 6:29 AM | 559 (11.2%) | 270 (6.2%) |
| 6:30 AM to 6:59 AM | 607 (12.1%) | 438 (10.0%) |
| 7:00 AM to 7:29 AM | 895 (17.9%) | 621 (14.2%) |
| 7:30 AM to 7:59 AM | 410 (8.2%) | 589 (13.5%) |
| 8:00 AM to 8:29 AM | 699 (14.0%) | 625 (14.3%) |
| 8:30 AM to 8:59 AM | 130 (2.6%) | 355 (8.1%) |
| 9:00 AM to 9:59 AM | 157 (3.1%) | 316 (7.2%) |
| 10:00 AM to 10:59 AM | 50 (1.0%) | 116 (2.6%) |
| 11:00 AM to 11:59 AM | 7 (0.1%) | 175 (4.0%) |
| 12:00 PM to 3:59 PM | 291 (5.8%) | 273 (6.2%) |
| 4:00 PM to 11:59 PM | 284 (5.7%) | 213 (4.9%) |
| Total | 5,010 (100.0%) | 4,375 (100.0%) |
Housing Occupancy in Camas
Occupancy by Ownership in Camas
Of the total 8,913 dwellings in Camas, owner-occupied units account for 7,124 (79.9%), while renter-occupied units make up 1,789 (20.1%).
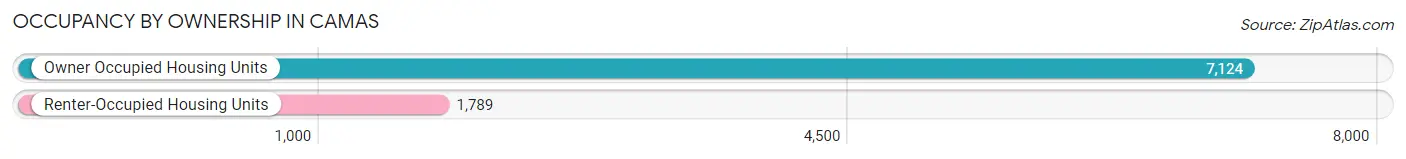
| Occupancy | # Housing Units | % Housing Units |
| Owner Occupied Housing Units | 7,124 | 79.9% |
| Renter-Occupied Housing Units | 1,789 | 20.1% |
| Total Occupied Housing Units | 8,913 | 100.0% |
Occupancy by Household Size in Camas
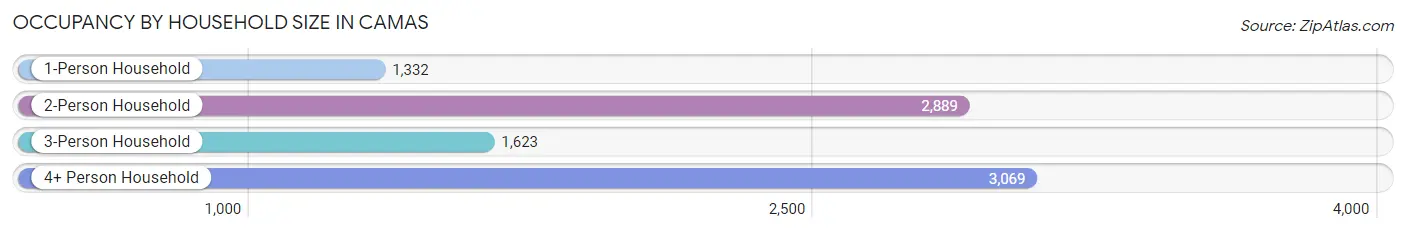
| Household Size | # Housing Units | % Housing Units |
| 1-Person Household | 1,332 | 14.9% |
| 2-Person Household | 2,889 | 32.4% |
| 3-Person Household | 1,623 | 18.2% |
| 4+ Person Household | 3,069 | 34.4% |
| Total Housing Units | 8,913 | 100.0% |
Occupancy by Ownership by Household Size in Camas
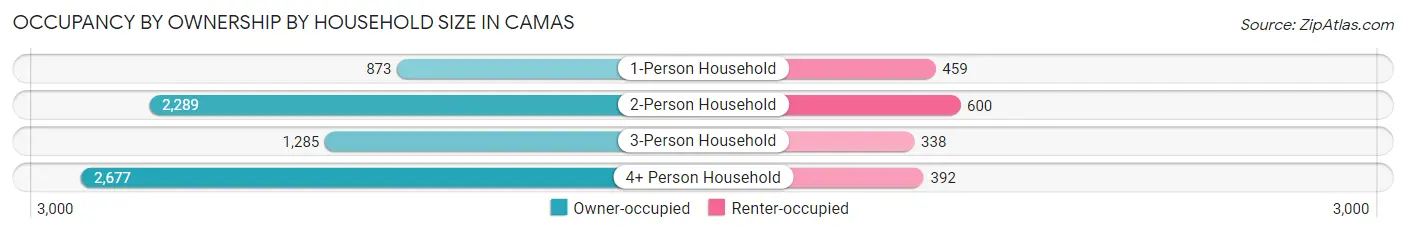
| Household Size | Owner-occupied | Renter-occupied |
| 1-Person Household | 873 (65.5%) | 459 (34.5%) |
| 2-Person Household | 2,289 (79.2%) | 600 (20.8%) |
| 3-Person Household | 1,285 (79.2%) | 338 (20.8%) |
| 4+ Person Household | 2,677 (87.2%) | 392 (12.8%) |
| Total Housing Units | 7,124 (79.9%) | 1,789 (20.1%) |
Occupancy by Educational Attainment in Camas
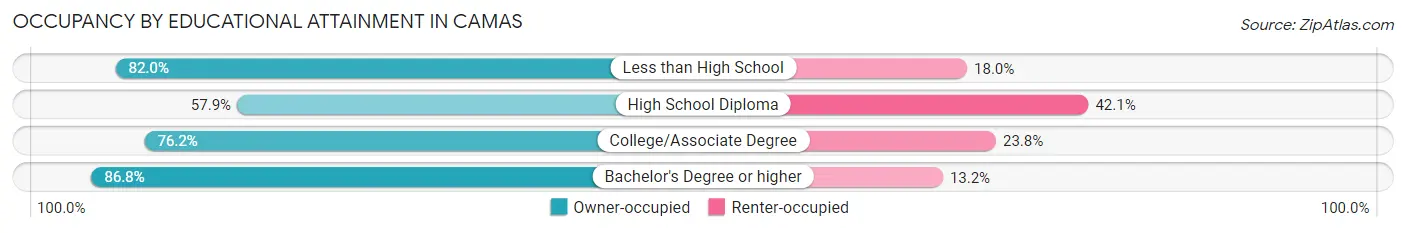
| Household Size | Owner-occupied | Renter-occupied |
| Less than High School | 241 (82.0%) | 53 (18.0%) |
| High School Diploma | 714 (57.9%) | 519 (42.1%) |
| College/Associate Degree | 1,732 (76.2%) | 540 (23.8%) |
| Bachelor's Degree or higher | 4,437 (86.8%) | 677 (13.2%) |
Occupancy by Age of Householder in Camas
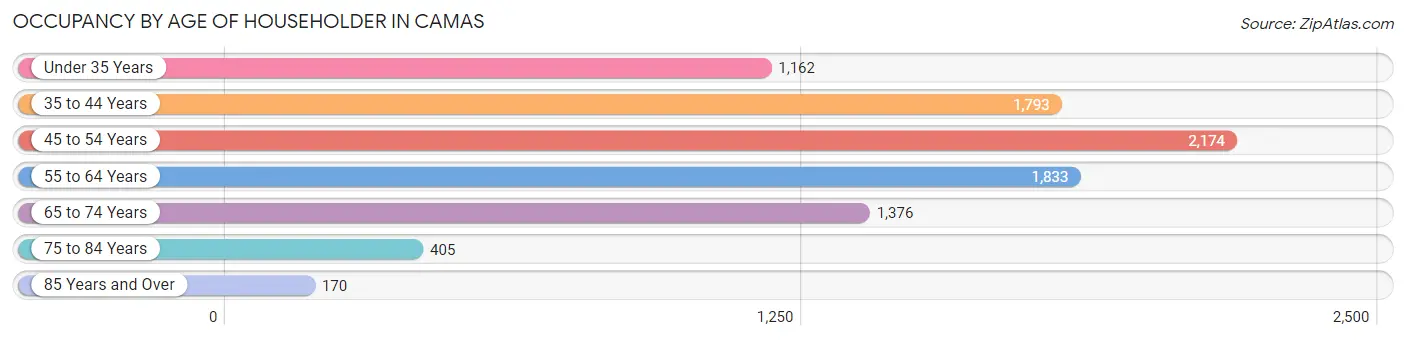
| Age Bracket | # Households | % Households |
| Under 35 Years | 1,162 | 13.0% |
| 35 to 44 Years | 1,793 | 20.1% |
| 45 to 54 Years | 2,174 | 24.4% |
| 55 to 64 Years | 1,833 | 20.6% |
| 65 to 74 Years | 1,376 | 15.4% |
| 75 to 84 Years | 405 | 4.5% |
| 85 Years and Over | 170 | 1.9% |
| Total | 8,913 | 100.0% |
Housing Finances in Camas
Median Income by Occupancy in Camas
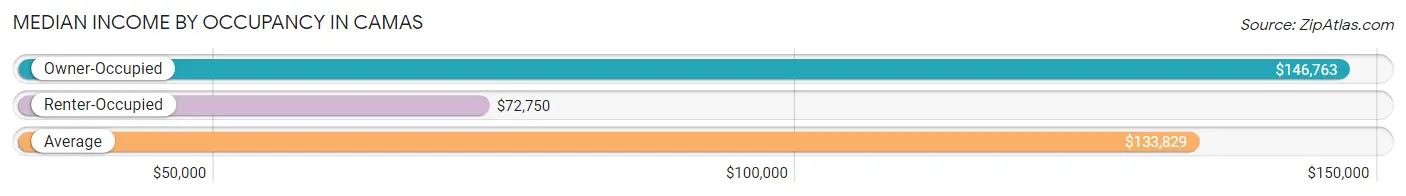
| Occupancy Type | # Households | Median Income |
| Owner-Occupied | 7,124 (79.9%) | $146,763 |
| Renter-Occupied | 1,789 (20.1%) | $72,750 |
| Average | 8,913 (100.0%) | $133,829 |
Occupancy by Householder Income Bracket in Camas
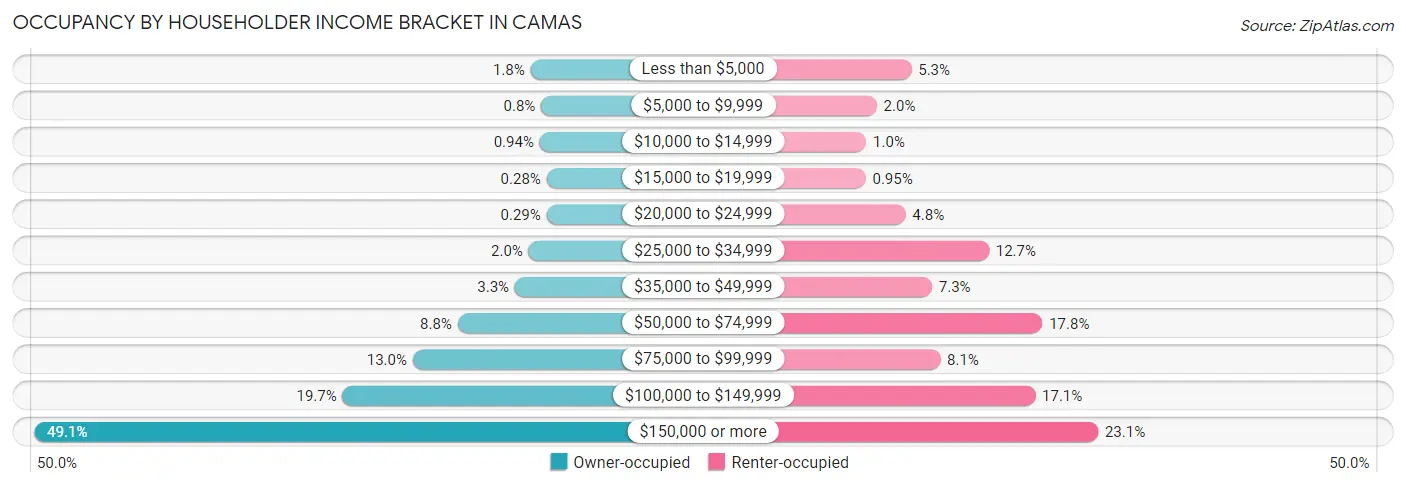
| Income Bracket | Owner-occupied | Renter-occupied |
| Less than $5,000 | 129 (1.8%) | 95 (5.3%) |
| $5,000 to $9,999 | 57 (0.8%) | 36 (2.0%) |
| $10,000 to $14,999 | 67 (0.9%) | 18 (1.0%) |
| $15,000 to $19,999 | 20 (0.3%) | 17 (0.9%) |
| $20,000 to $24,999 | 21 (0.3%) | 85 (4.8%) |
| $25,000 to $34,999 | 142 (2.0%) | 227 (12.7%) |
| $35,000 to $49,999 | 235 (3.3%) | 130 (7.3%) |
| $50,000 to $74,999 | 623 (8.7%) | 318 (17.8%) |
| $75,000 to $99,999 | 928 (13.0%) | 144 (8.1%) |
| $100,000 to $149,999 | 1,405 (19.7%) | 306 (17.1%) |
| $150,000 or more | 3,497 (49.1%) | 413 (23.1%) |
| Total | 7,124 (100.0%) | 1,789 (100.0%) |
Monthly Housing Cost Tiers in Camas
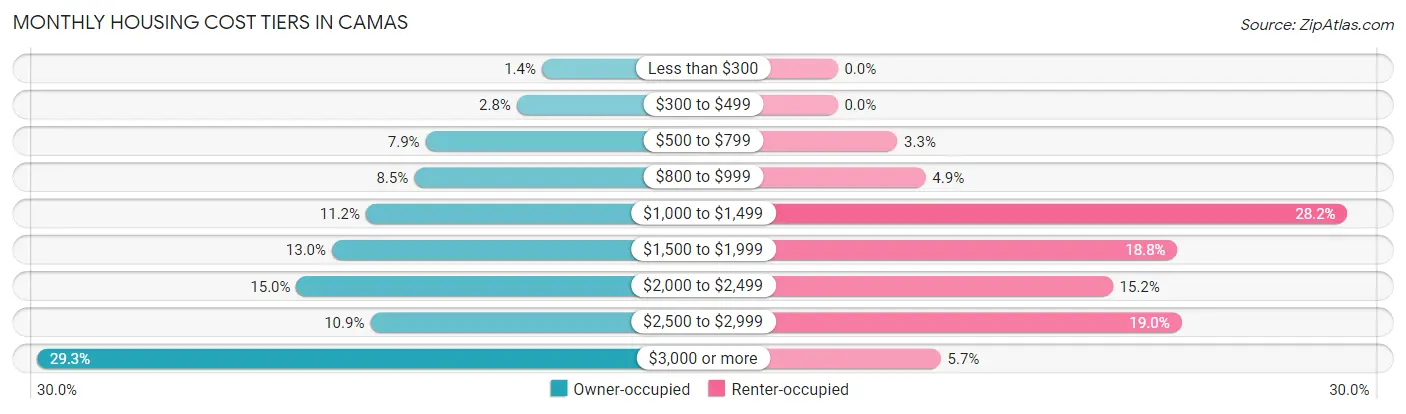
| Monthly Cost | Owner-occupied | Renter-occupied |
| Less than $300 | 102 (1.4%) | 0 (0.0%) |
| $300 to $499 | 201 (2.8%) | 0 (0.0%) |
| $500 to $799 | 560 (7.9%) | 59 (3.3%) |
| $800 to $999 | 605 (8.5%) | 87 (4.9%) |
| $1,000 to $1,499 | 794 (11.2%) | 504 (28.2%) |
| $1,500 to $1,999 | 928 (13.0%) | 336 (18.8%) |
| $2,000 to $2,499 | 1,068 (15.0%) | 272 (15.2%) |
| $2,500 to $2,999 | 777 (10.9%) | 340 (19.0%) |
| $3,000 or more | 2,089 (29.3%) | 102 (5.7%) |
| Total | 7,124 (100.0%) | 1,789 (100.0%) |
Physical Housing Characteristics in Camas
Housing Structures in Camas
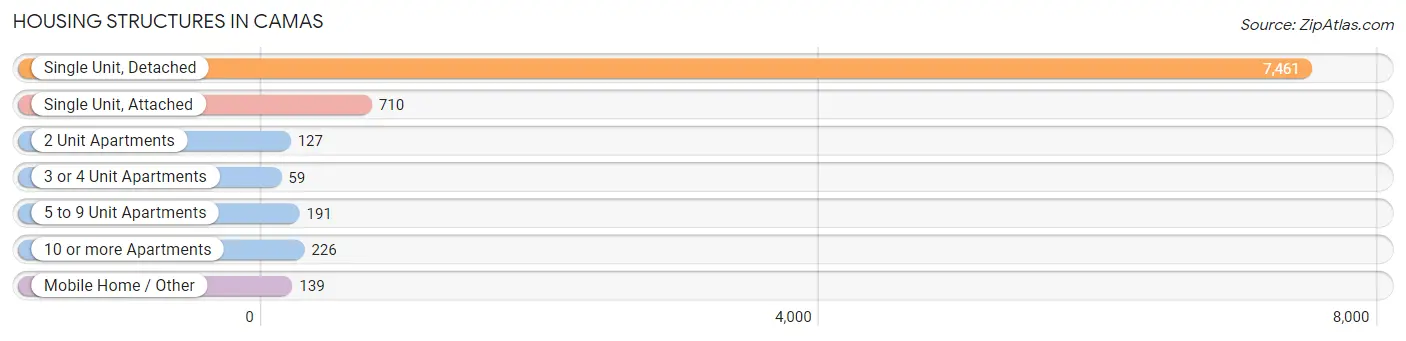
| Structure Type | # Housing Units | % Housing Units |
| Single Unit, Detached | 7,461 | 83.7% |
| Single Unit, Attached | 710 | 8.0% |
| 2 Unit Apartments | 127 | 1.4% |
| 3 or 4 Unit Apartments | 59 | 0.7% |
| 5 to 9 Unit Apartments | 191 | 2.1% |
| 10 or more Apartments | 226 | 2.5% |
| Mobile Home / Other | 139 | 1.6% |
| Total | 8,913 | 100.0% |
Housing Structures by Occupancy in Camas
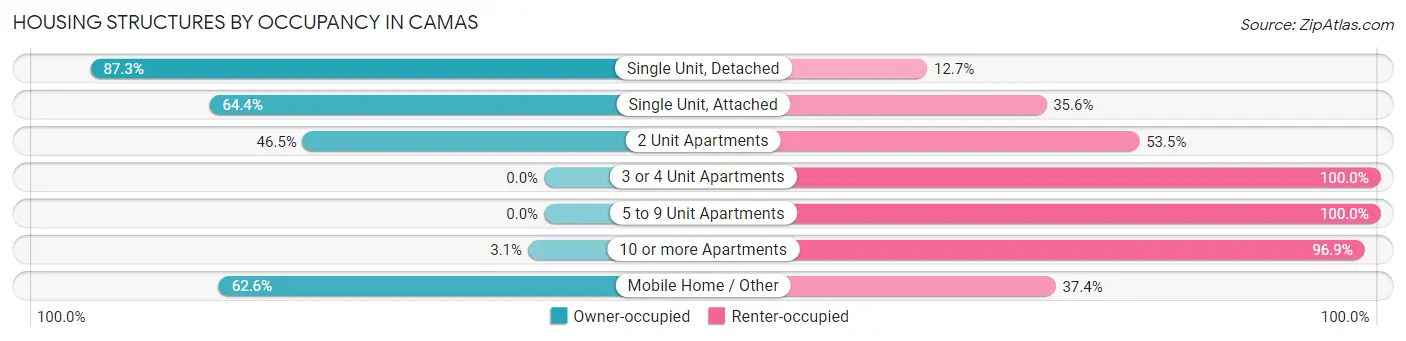
| Structure Type | Owner-occupied | Renter-occupied |
| Single Unit, Detached | 6,514 (87.3%) | 947 (12.7%) |
| Single Unit, Attached | 457 (64.4%) | 253 (35.6%) |
| 2 Unit Apartments | 59 (46.5%) | 68 (53.5%) |
| 3 or 4 Unit Apartments | 0 (0.0%) | 59 (100.0%) |
| 5 to 9 Unit Apartments | 0 (0.0%) | 191 (100.0%) |
| 10 or more Apartments | 7 (3.1%) | 219 (96.9%) |
| Mobile Home / Other | 87 (62.6%) | 52 (37.4%) |
| Total | 7,124 (79.9%) | 1,789 (20.1%) |
Housing Structures by Number of Rooms in Camas
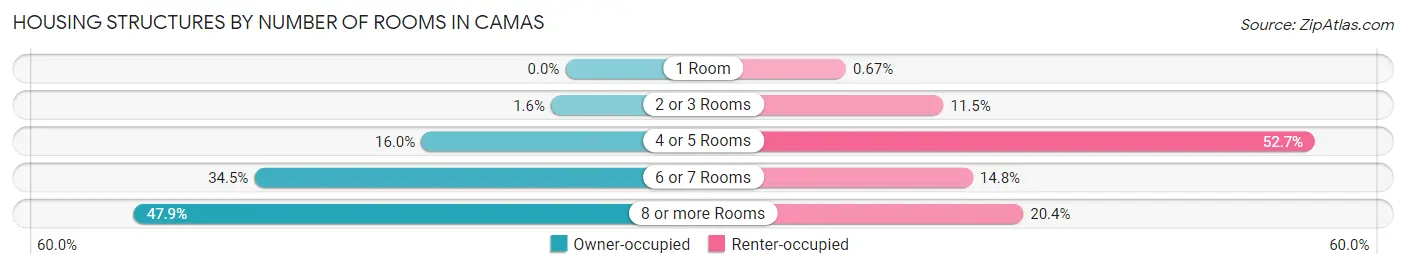
| Number of Rooms | Owner-occupied | Renter-occupied |
| 1 Room | 0 (0.0%) | 12 (0.7%) |
| 2 or 3 Rooms | 114 (1.6%) | 206 (11.5%) |
| 4 or 5 Rooms | 1,140 (16.0%) | 943 (52.7%) |
| 6 or 7 Rooms | 2,459 (34.5%) | 264 (14.8%) |
| 8 or more Rooms | 3,411 (47.9%) | 364 (20.3%) |
| Total | 7,124 (100.0%) | 1,789 (100.0%) |
Housing Structure by Heating Type in Camas
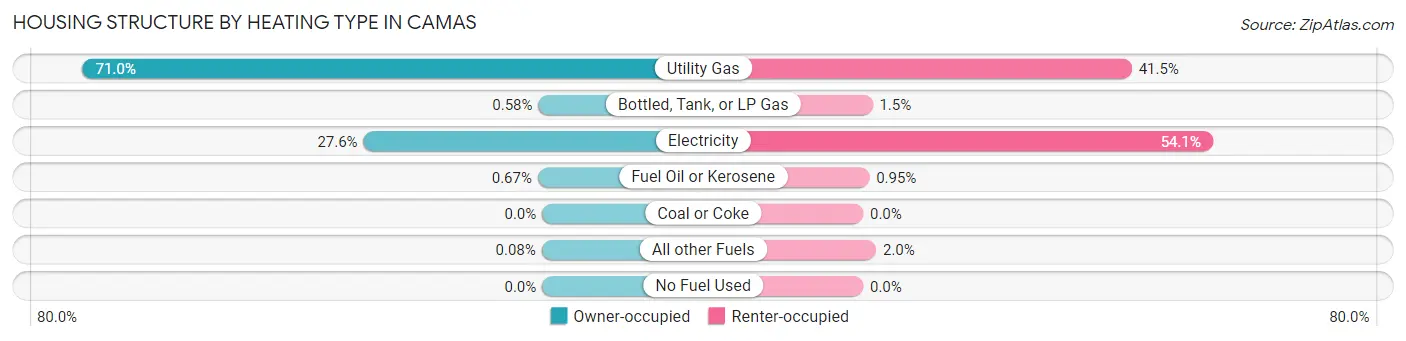
| Heating Type | Owner-occupied | Renter-occupied |
| Utility Gas | 5,061 (71.0%) | 743 (41.5%) |
| Bottled, Tank, or LP Gas | 41 (0.6%) | 26 (1.5%) |
| Electricity | 1,968 (27.6%) | 967 (54.0%) |
| Fuel Oil or Kerosene | 48 (0.7%) | 17 (0.9%) |
| Coal or Coke | 0 (0.0%) | 0 (0.0%) |
| All other Fuels | 6 (0.1%) | 36 (2.0%) |
| No Fuel Used | 0 (0.0%) | 0 (0.0%) |
| Total | 7,124 (100.0%) | 1,789 (100.0%) |
Household Vehicle Usage in Camas
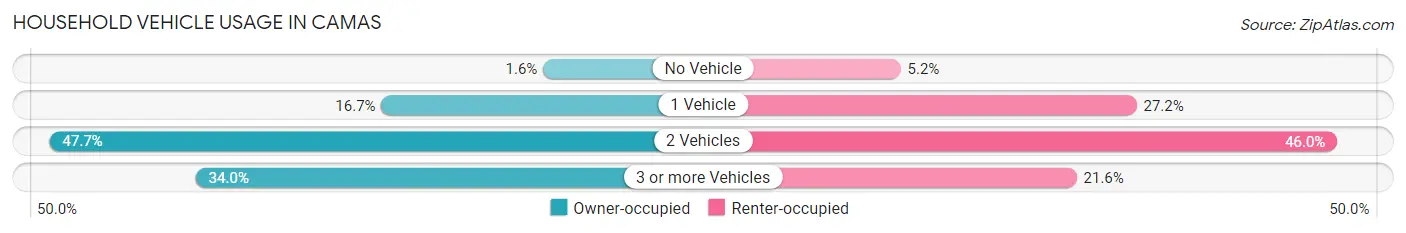
| Vehicles per Household | Owner-occupied | Renter-occupied |
| No Vehicle | 113 (1.6%) | 93 (5.2%) |
| 1 Vehicle | 1,189 (16.7%) | 487 (27.2%) |
| 2 Vehicles | 3,397 (47.7%) | 822 (46.0%) |
| 3 or more Vehicles | 2,425 (34.0%) | 387 (21.6%) |
| Total | 7,124 (100.0%) | 1,789 (100.0%) |
Real Estate & Mortgages in Camas
Real Estate and Mortgage Overview in Camas
| Characteristic | Without Mortgage | With Mortgage |
| Housing Units | 1,984 | 5,140 |
| Median Property Value | $610,400 | $600,200 |
| Median Household Income | $118,953 | $2,671 |
| Monthly Housing Costs | $866 | $2,076 |
| Real Estate Taxes | $6,370 | $87 |
Property Value by Mortgage Status in Camas
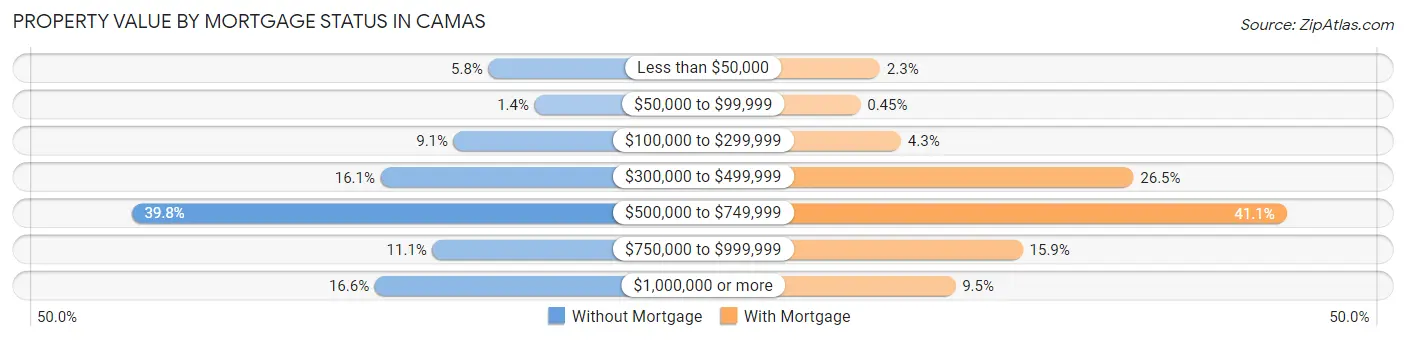
| Property Value | Without Mortgage | With Mortgage |
| Less than $50,000 | 115 (5.8%) | 119 (2.3%) |
| $50,000 to $99,999 | 28 (1.4%) | 23 (0.4%) |
| $100,000 to $299,999 | 181 (9.1%) | 222 (4.3%) |
| $300,000 to $499,999 | 319 (16.1%) | 1,360 (26.5%) |
| $500,000 to $749,999 | 790 (39.8%) | 2,110 (41.0%) |
| $750,000 to $999,999 | 221 (11.1%) | 818 (15.9%) |
| $1,000,000 or more | 330 (16.6%) | 488 (9.5%) |
| Total | 1,984 (100.0%) | 5,140 (100.0%) |
Household Income by Mortgage Status in Camas
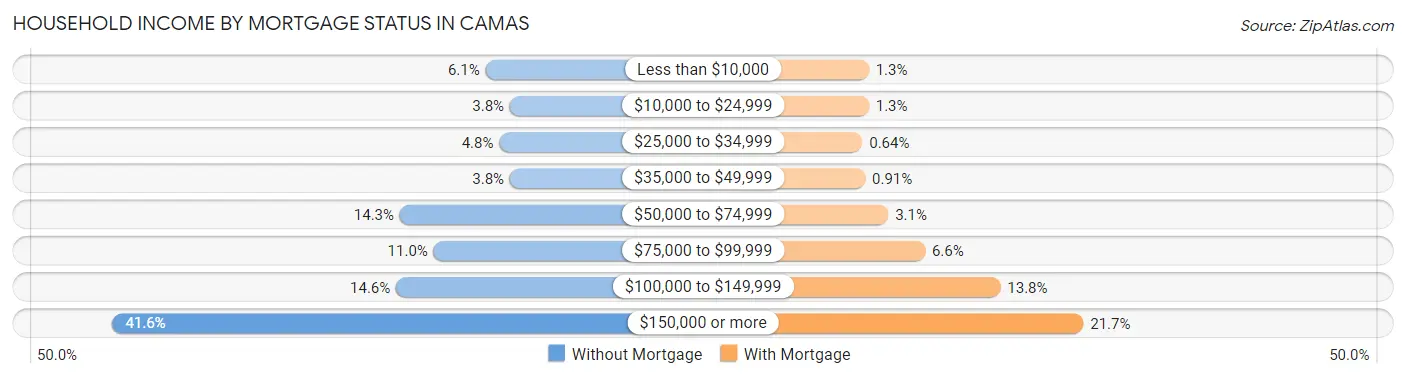
| Household Income | Without Mortgage | With Mortgage |
| Less than $10,000 | 121 (6.1%) | 64 (1.3%) |
| $10,000 to $24,999 | 75 (3.8%) | 65 (1.3%) |
| $25,000 to $34,999 | 95 (4.8%) | 33 (0.6%) |
| $35,000 to $49,999 | 75 (3.8%) | 47 (0.9%) |
| $50,000 to $74,999 | 283 (14.3%) | 160 (3.1%) |
| $75,000 to $99,999 | 219 (11.0%) | 340 (6.6%) |
| $100,000 to $149,999 | 290 (14.6%) | 709 (13.8%) |
| $150,000 or more | 826 (41.6%) | 1,115 (21.7%) |
| Total | 1,984 (100.0%) | 5,140 (100.0%) |
Property Value to Household Income Ratio in Camas
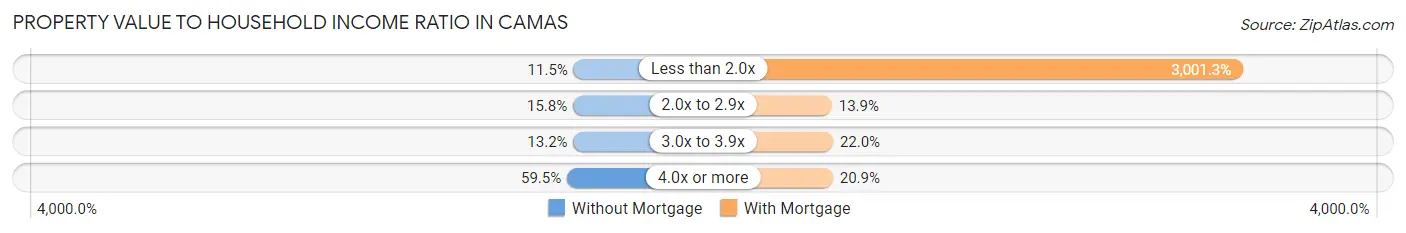
| Value-to-Income Ratio | Without Mortgage | With Mortgage |
| Less than 2.0x | 228 (11.5%) | 154,268 (3,001.3%) |
| 2.0x to 2.9x | 313 (15.8%) | 712 (13.9%) |
| 3.0x to 3.9x | 262 (13.2%) | 1,133 (22.0%) |
| 4.0x or more | 1,181 (59.5%) | 1,074 (20.9%) |
| Total | 1,984 (100.0%) | 5,140 (100.0%) |
Real Estate Taxes by Mortgage Status in Camas
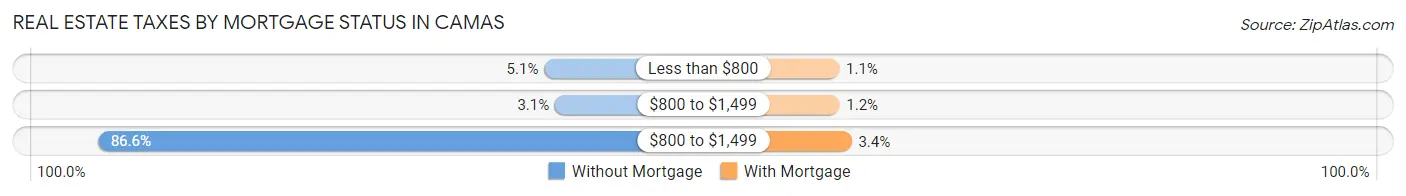
| Property Taxes | Without Mortgage | With Mortgage |
| Less than $800 | 101 (5.1%) | 57 (1.1%) |
| $800 to $1,499 | 62 (3.1%) | 59 (1.1%) |
| $800 to $1,499 | 1,719 (86.6%) | 173 (3.4%) |
| Total | 1,984 (100.0%) | 5,140 (100.0%) |
Health & Disability in Camas
Health Insurance Coverage by Age in Camas
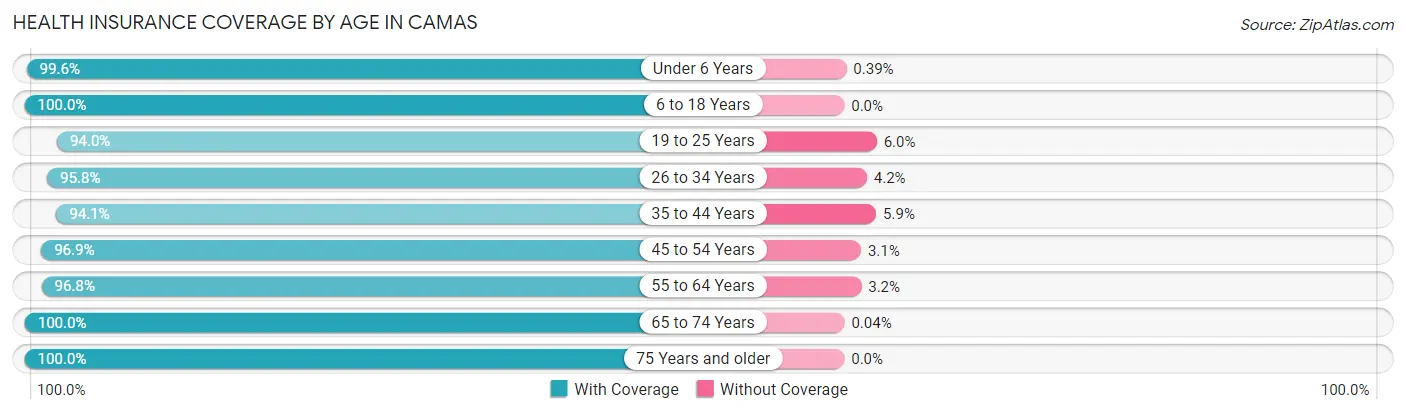
| Age Bracket | With Coverage | Without Coverage |
| Under 6 Years | 1,785 (99.6%) | 7 (0.4%) |
| 6 to 18 Years | 5,862 (100.0%) | 0 (0.0%) |
| 19 to 25 Years | 1,353 (94.0%) | 87 (6.0%) |
| 26 to 34 Years | 2,415 (95.8%) | 106 (4.2%) |
| 35 to 44 Years | 3,328 (94.1%) | 210 (5.9%) |
| 45 to 54 Years | 4,305 (96.9%) | 138 (3.1%) |
| 55 to 64 Years | 3,267 (96.8%) | 107 (3.2%) |
| 65 to 74 Years | 2,377 (100.0%) | 1 (0.0%) |
| 75 Years and older | 939 (100.0%) | 0 (0.0%) |
| Total | 25,631 (97.5%) | 656 (2.5%) |
Health Insurance Coverage by Citizenship Status in Camas
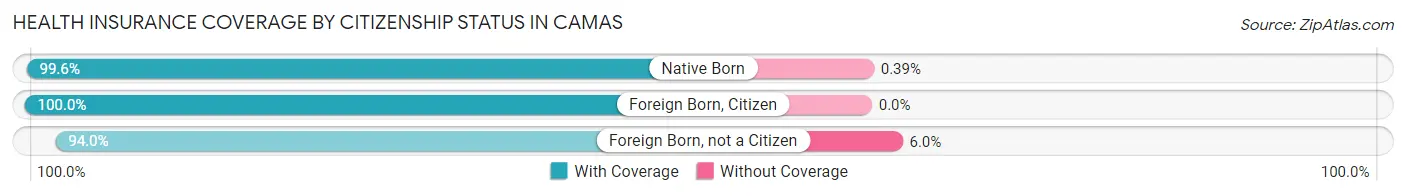
| Citizenship Status | With Coverage | Without Coverage |
| Native Born | 1,785 (99.6%) | 7 (0.4%) |
| Foreign Born, Citizen | 5,862 (100.0%) | 0 (0.0%) |
| Foreign Born, not a Citizen | 1,353 (94.0%) | 87 (6.0%) |
Health Insurance Coverage by Household Income in Camas
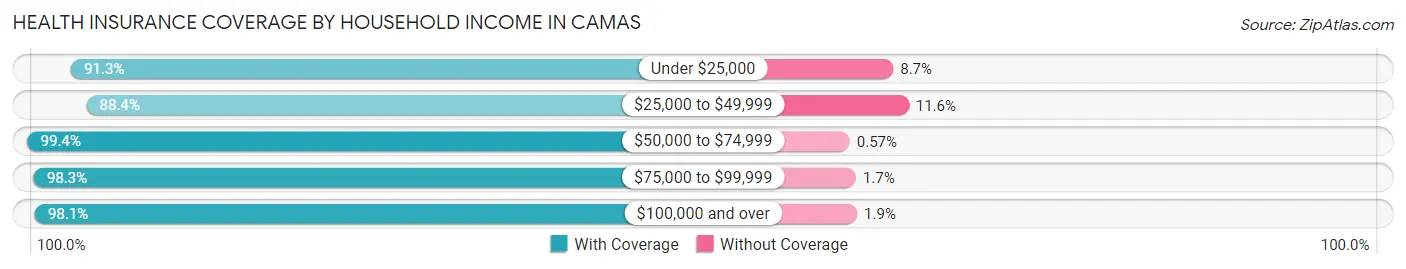
| Household Income | With Coverage | Without Coverage |
| Under $25,000 | 797 (91.3%) | 76 (8.7%) |
| $25,000 to $49,999 | 1,149 (88.4%) | 151 (11.6%) |
| $50,000 to $74,999 | 2,275 (99.4%) | 13 (0.6%) |
| $75,000 to $99,999 | 3,133 (98.3%) | 55 (1.7%) |
| $100,000 and over | 18,272 (98.1%) | 361 (1.9%) |
Public vs Private Health Insurance Coverage by Age in Camas
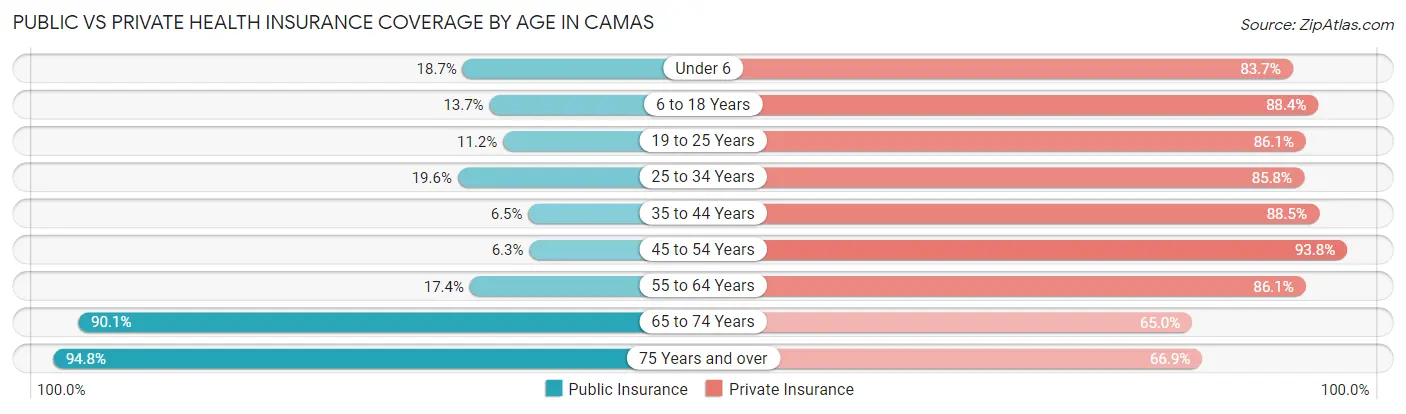
| Age Bracket | Public Insurance | Private Insurance |
| Under 6 | 335 (18.7%) | 1,499 (83.7%) |
| 6 to 18 Years | 804 (13.7%) | 5,183 (88.4%) |
| 19 to 25 Years | 161 (11.2%) | 1,240 (86.1%) |
| 25 to 34 Years | 494 (19.6%) | 2,162 (85.8%) |
| 35 to 44 Years | 230 (6.5%) | 3,132 (88.5%) |
| 45 to 54 Years | 281 (6.3%) | 4,166 (93.8%) |
| 55 to 64 Years | 586 (17.4%) | 2,904 (86.1%) |
| 65 to 74 Years | 2,142 (90.1%) | 1,546 (65.0%) |
| 75 Years and over | 890 (94.8%) | 628 (66.9%) |
| Total | 5,923 (22.5%) | 22,460 (85.4%) |
Disability Status by Sex by Age in Camas
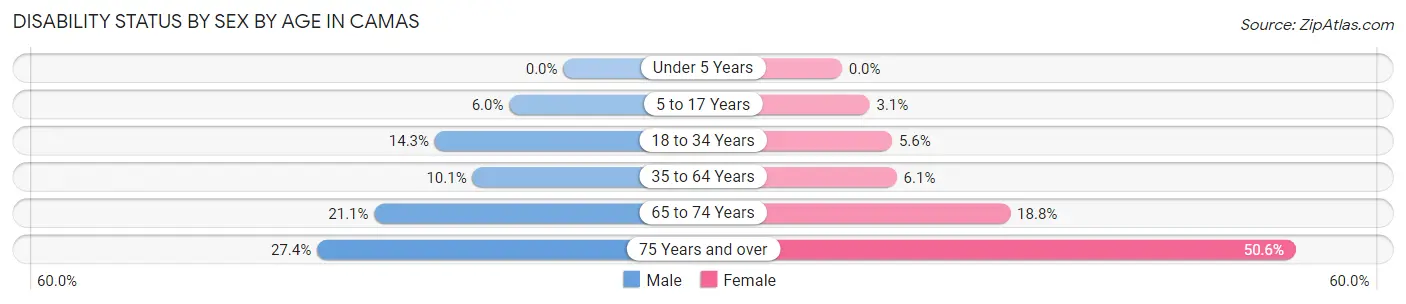
| Age Bracket | Male | Female |
| Under 5 Years | 0 (0.0%) | 0 (0.0%) |
| 5 to 17 Years | 192 (6.0%) | 86 (3.1%) |
| 18 to 34 Years | 292 (14.3%) | 125 (5.6%) |
| 35 to 64 Years | 586 (10.1%) | 340 (6.1%) |
| 65 to 74 Years | 248 (21.0%) | 225 (18.8%) |
| 75 Years and over | 110 (27.4%) | 272 (50.6%) |
Disability Class by Sex by Age in Camas
Disability Class: Hearing Difficulty
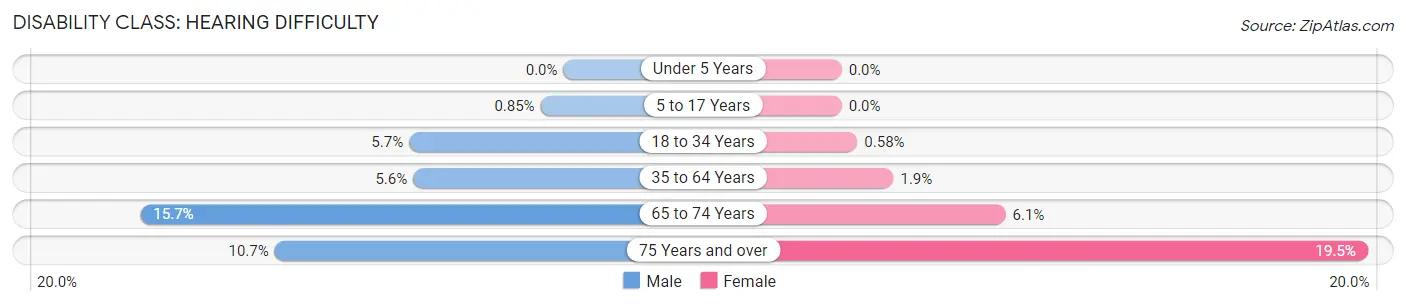
| Age Bracket | Male | Female |
| Under 5 Years | 0 (0.0%) | 0 (0.0%) |
| 5 to 17 Years | 27 (0.9%) | 0 (0.0%) |
| 18 to 34 Years | 117 (5.7%) | 13 (0.6%) |
| 35 to 64 Years | 323 (5.6%) | 107 (1.9%) |
| 65 to 74 Years | 185 (15.7%) | 73 (6.1%) |
| 75 Years and over | 43 (10.7%) | 105 (19.5%) |
Disability Class: Vision Difficulty
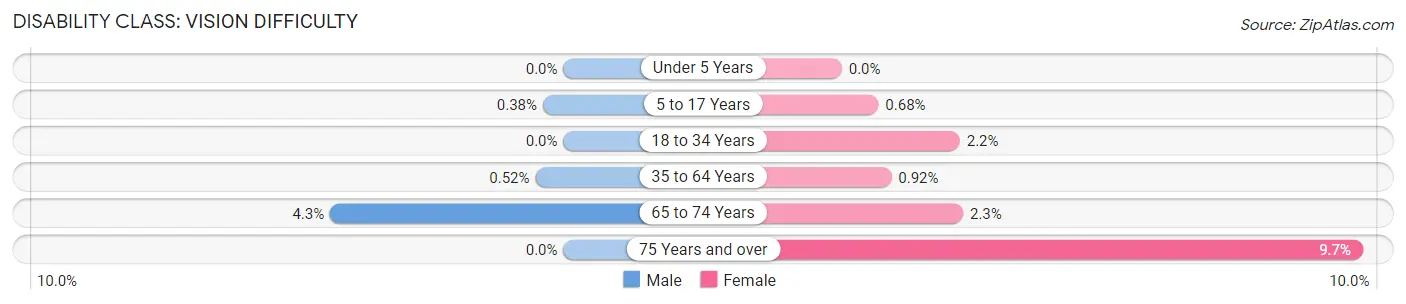
| Age Bracket | Male | Female |
| Under 5 Years | 0 (0.0%) | 0 (0.0%) |
| 5 to 17 Years | 12 (0.4%) | 19 (0.7%) |
| 18 to 34 Years | 0 (0.0%) | 49 (2.2%) |
| 35 to 64 Years | 30 (0.5%) | 51 (0.9%) |
| 65 to 74 Years | 51 (4.3%) | 27 (2.2%) |
| 75 Years and over | 0 (0.0%) | 52 (9.7%) |
Disability Class: Cognitive Difficulty

| Age Bracket | Male | Female |
| 5 to 17 Years | 192 (6.0%) | 67 (2.4%) |
| 18 to 34 Years | 213 (10.4%) | 48 (2.1%) |
| 35 to 64 Years | 122 (2.1%) | 67 (1.2%) |
| 65 to 74 Years | 72 (6.1%) | 19 (1.6%) |
| 75 Years and over | 36 (9.0%) | 144 (26.8%) |
Disability Class: Ambulatory Difficulty
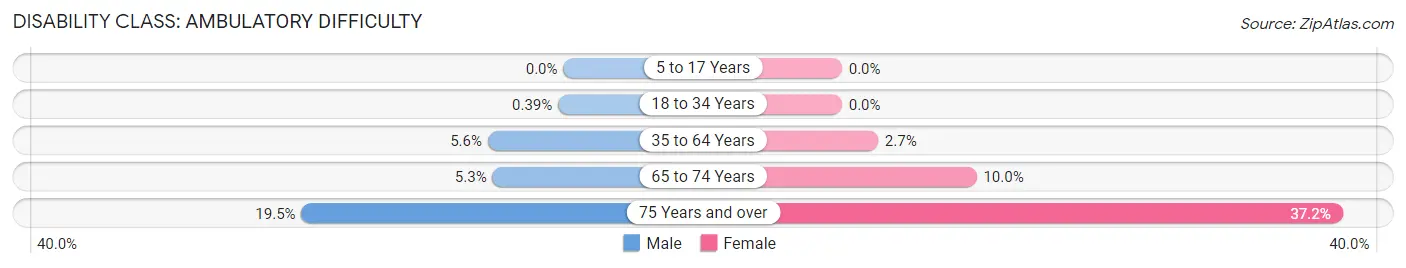
| Age Bracket | Male | Female |
| 5 to 17 Years | 0 (0.0%) | 0 (0.0%) |
| 18 to 34 Years | 8 (0.4%) | 0 (0.0%) |
| 35 to 64 Years | 325 (5.6%) | 149 (2.7%) |
| 65 to 74 Years | 62 (5.3%) | 120 (10.0%) |
| 75 Years and over | 78 (19.5%) | 200 (37.2%) |
Disability Class: Self-Care Difficulty
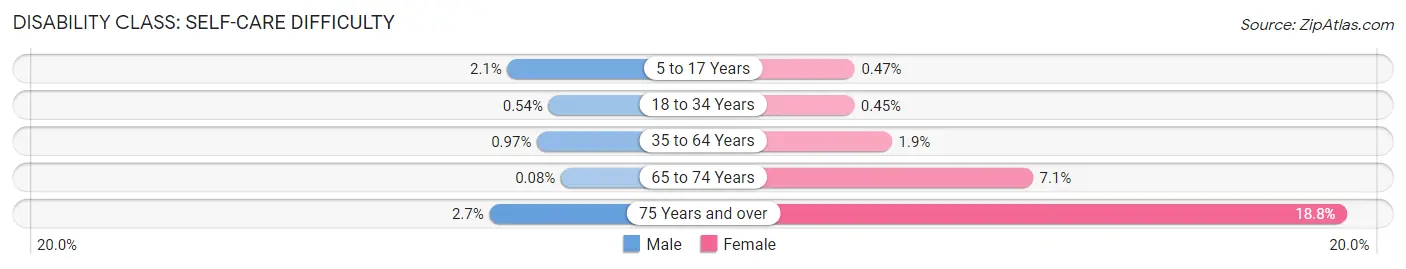
| Age Bracket | Male | Female |
| 5 to 17 Years | 66 (2.1%) | 13 (0.5%) |
| 18 to 34 Years | 11 (0.5%) | 10 (0.4%) |
| 35 to 64 Years | 56 (1.0%) | 103 (1.8%) |
| 65 to 74 Years | 1 (0.1%) | 85 (7.1%) |
| 75 Years and over | 11 (2.7%) | 101 (18.8%) |
Technology Access in Camas
Computing Device Access in Camas
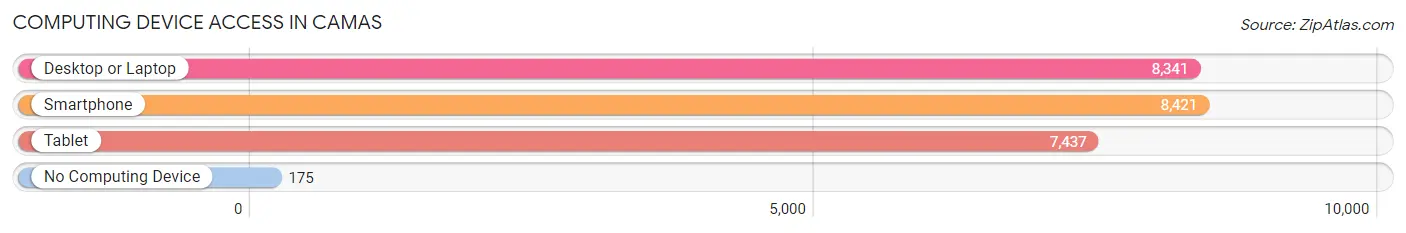
| Device Type | # Households | % Households |
| Desktop or Laptop | 8,341 | 93.6% |
| Smartphone | 8,421 | 94.5% |
| Tablet | 7,437 | 83.4% |
| No Computing Device | 175 | 2.0% |
| Total | 8,913 | 100.0% |
Internet Access in Camas
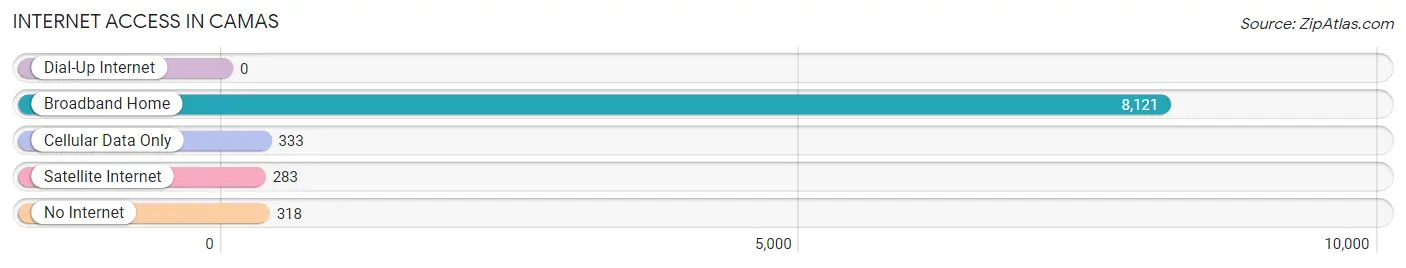
| Internet Type | # Households | % Households |
| Dial-Up Internet | 0 | 0.0% |
| Broadband Home | 8,121 | 91.1% |
| Cellular Data Only | 333 | 3.7% |
| Satellite Internet | 283 | 3.2% |
| No Internet | 318 | 3.6% |
| Total | 8,913 | 100.0% |
Camas Summary
Camas, Washington is a city located in Clark County, Washington, United States. It is situated on the north bank of the Columbia River, just east of Vancouver, Washington. The population was 19,355 at the 2010 census, making it the fifth largest city in the county.
History
The area that is now Camas was first inhabited by the Chinook and Klickitat tribes. The first white settlers arrived in the area in the early 1800s, and the town was officially founded in 1883. The town was named after the camas lily, a wildflower that grows in the area.
The town grew rapidly in the late 19th and early 20th centuries, due to the abundance of timber in the area. The town was home to several sawmills and paper mills, and the economy was largely based on the timber industry. The town was also home to a number of other industries, including a brickyard, a cannery, and a flour mill.
In the late 20th century, the timber industry began to decline, and the town began to diversify its economy. Today, the town is home to a variety of businesses, including technology companies, medical offices, and retail stores.
Geography
Camas is located in Clark County, Washington, on the north bank of the Columbia River. The city is situated at the base of the Cascade Mountains, and is surrounded by forests and rolling hills. The city covers an area of 8.3 square miles, and has a population density of 2,323 people per square mile.
The climate in Camas is mild and temperate, with warm summers and cool winters. The average annual temperature is 52 degrees Fahrenheit, and the average annual precipitation is 37 inches.
Economy
The economy of Camas is largely based on the service industry. The city is home to a variety of businesses, including technology companies, medical offices, and retail stores. The city is also home to a number of manufacturing companies, including a paper mill and a wood products plant.
The city is also home to a number of educational institutions, including Camas High School, Camas Middle School, and several elementary schools. The city is also home to a number of parks and recreational facilities, including Lacamas Lake Park and Round Lake Park.
Demographics
As of the 2010 census, the population of Camas was 19,355. The racial makeup of the city was 87.3% White, 4.2% Asian, 2.7% Hispanic or Latino, 1.7% African American, 0.5% Native American, and 0.2% Pacific Islander.
The median household income in Camas was $68,845, and the median family income was $77,945. The per capita income in Camas was $30,945. The unemployment rate in Camas was 4.2%.
Conclusion
Camas, Washington is a city located in Clark County, Washington, United States. It is situated on the north bank of the Columbia River, just east of Vancouver, Washington. The population was 19,355 at the 2010 census, making it the fifth largest city in the county. The economy of Camas is largely based on the service industry, and the city is home to a variety of businesses, including technology companies, medical offices, and retail stores. The racial makeup of the city was 87.3% White, 4.2% Asian, 2.7% Hispanic or Latino, 1.7% African American, 0.5% Native American, and 0.2% Pacific Islander. The median household income in Camas was $68,845, and the median family income was $77,945. The per capita income in Camas was $30,945. The unemployment rate in Camas was 4.2%.
Common Questions
What is Per Capita Income in Camas?
Per Capita income in Camas is $57,841.
What is the Median Family Income in Camas?
Median Family Income in Camas is $146,125.
What is the Median Household income in Camas?
Median Household Income in Camas is $133,829.
What is Income or Wage Gap in Camas?
Income or Wage Gap in Camas is 48.3%.
Women in Camas earn 51.7 cents for every dollar earned by a man.
What is Family Income Deficit in Camas?
Family Income Deficit in Camas is $12,706.
Families that are below poverty line in Camas earn $12,706 less on average than the poverty threshold level.
What is Inequality or Gini Index in Camas?
Inequality or Gini Index in Camas is 0.42.
What is the Total Population of Camas?
Total Population of Camas is 26,387.
What is the Total Male Population of Camas?
Total Male Population of Camas is 13,359.
What is the Total Female Population of Camas?
Total Female Population of Camas is 13,028.
What is the Ratio of Males per 100 Females in Camas?
There are 102.54 Males per 100 Females in Camas.
What is the Ratio of Females per 100 Males in Camas?
There are 97.52 Females per 100 Males in Camas.
What is the Median Population Age in Camas?
Median Population Age in Camas is 40.3 Years.
What is the Average Family Size in Camas
Average Family Size in Camas is 3.3 People.
What is the Average Household Size in Camas
Average Household Size in Camas is 3.0 People.
How Large is the Labor Force in Camas?
There are 12,954 People in the Labor Forcein in Camas.
What is the Percentage of People in the Labor Force in Camas?
64.8% of People are in the Labor Force in Camas.
What is the Unemployment Rate in Camas?
Unemployment Rate in Camas is 2.4%.