Richland, WA Map & Demographics
Richland Map
Richland Overview
$48,028
PER CAPITA INCOME
$113,189
AVG FAMILY INCOME
$89,283
AVG HOUSEHOLD INCOME
39.4%
WAGE / INCOME GAP [ % ]
60.6¢/ $1
WAGE / INCOME GAP [ $ ]
$11,402
FAMILY INCOME DEFICIT
0.42
INEQUALITY / GINI INDEX
60,867
TOTAL POPULATION
31,411
MALE POPULATION
29,456
FEMALE POPULATION
106.64
MALES / 100 FEMALES
93.78
FEMALES / 100 MALES
36.6
MEDIAN AGE
3.1
AVG FAMILY SIZE
2.5
AVG HOUSEHOLD SIZE
30,377
LABOR FORCE [ PEOPLE ]
63.6%
PERCENT IN LABOR FORCE
5.1%
UNEMPLOYMENT RATE
Richland Area Codes
Income in Richland
Income Overview in Richland
Per Capita Income in Richland is $48,028, while median incomes of families and households are $113,189 and $89,283 respectively.
| Characteristic | Number | Measure |
| Per Capita Income | 60,867 | $48,028 |
| Median Family Income | 14,894 | $113,189 |
| Mean Family Income | 14,894 | $138,325 |
| Median Household Income | 24,088 | $89,283 |
| Mean Household Income | 24,088 | $118,706 |
| Income Deficit | 14,894 | $11,402 |
| Wage / Income Gap (%) | 60,867 | 39.44% |
| Wage / Income Gap ($) | 60,867 | 60.56¢ per $1 |
| Gini / Inequality Index | 60,867 | 0.42 |
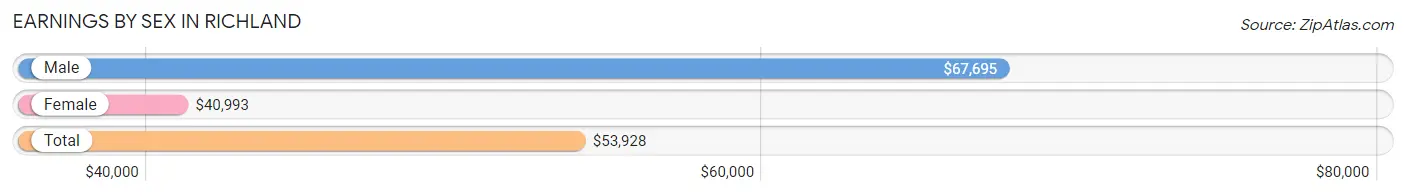
Earnings by Sex in Richland
Average Earnings in Richland are $53,928, $67,695 for men and $40,993 for women, a difference of 39.4%.
| Sex | Number | Average Earnings |
| Male | 16,957 (53.9%) | $67,695 |
| Female | 14,480 (46.1%) | $40,993 |
| Total | 31,437 (100.0%) | $53,928 |
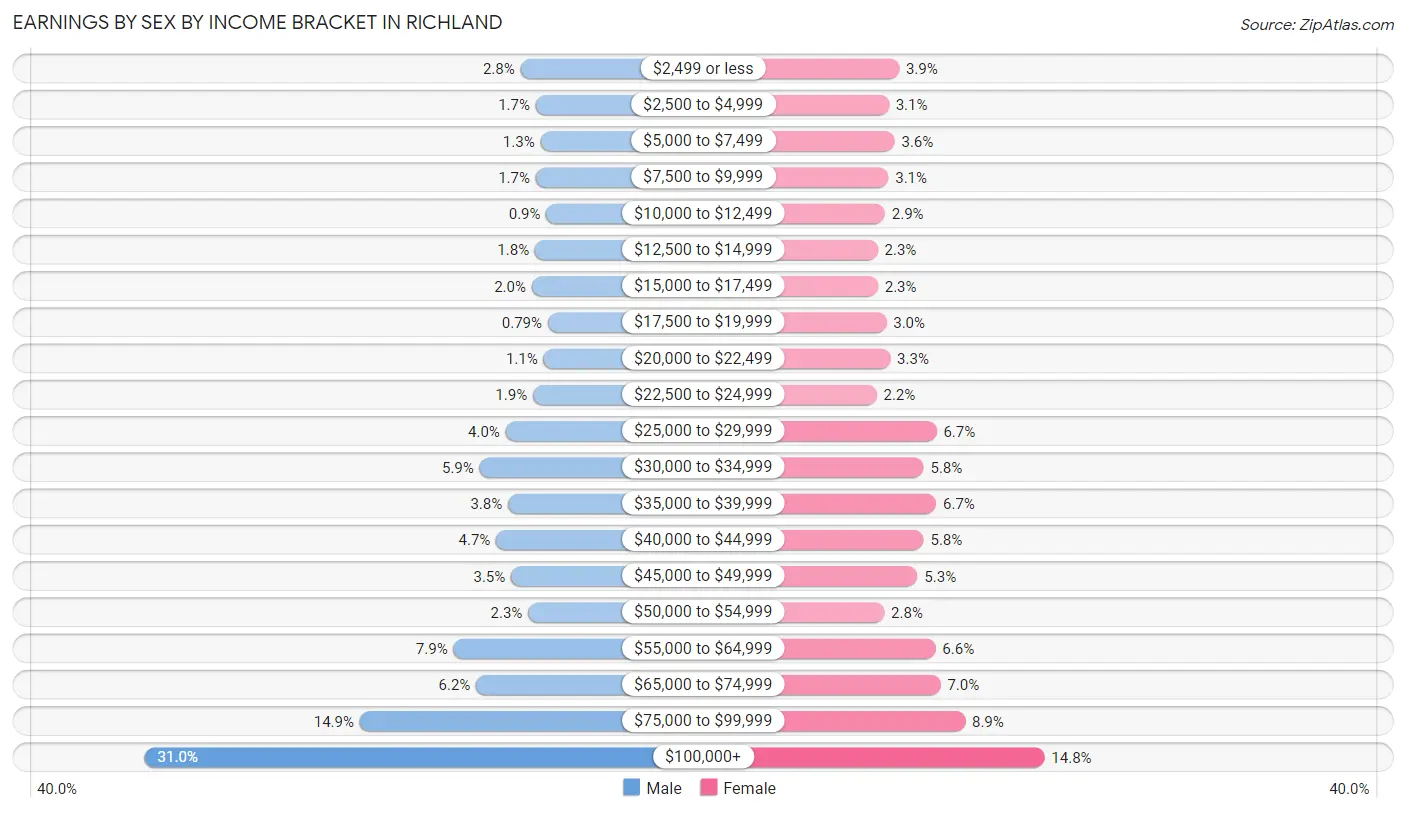
Earnings by Sex by Income Bracket in Richland
The most common earnings brackets in Richland are $100,000+ for men (5,257 | 31.0%) and $100,000+ for women (2,145 | 14.8%).
| Income | Male | Female |
| $2,499 or less | 480 (2.8%) | 566 (3.9%) |
| $2,500 to $4,999 | 287 (1.7%) | 455 (3.1%) |
| $5,000 to $7,499 | 228 (1.3%) | 518 (3.6%) |
| $7,500 to $9,999 | 287 (1.7%) | 450 (3.1%) |
| $10,000 to $12,499 | 152 (0.9%) | 412 (2.9%) |
| $12,500 to $14,999 | 297 (1.8%) | 334 (2.3%) |
| $15,000 to $17,499 | 337 (2.0%) | 336 (2.3%) |
| $17,500 to $19,999 | 134 (0.8%) | 428 (3.0%) |
| $20,000 to $22,499 | 189 (1.1%) | 471 (3.3%) |
| $22,500 to $24,999 | 323 (1.9%) | 323 (2.2%) |
| $25,000 to $29,999 | 670 (4.0%) | 973 (6.7%) |
| $30,000 to $34,999 | 1,000 (5.9%) | 833 (5.8%) |
| $35,000 to $39,999 | 640 (3.8%) | 969 (6.7%) |
| $40,000 to $44,999 | 791 (4.7%) | 833 (5.8%) |
| $45,000 to $49,999 | 601 (3.5%) | 766 (5.3%) |
| $50,000 to $54,999 | 383 (2.3%) | 406 (2.8%) |
| $55,000 to $64,999 | 1,333 (7.9%) | 962 (6.6%) |
| $65,000 to $74,999 | 1,044 (6.2%) | 1,017 (7.0%) |
| $75,000 to $99,999 | 2,524 (14.9%) | 1,283 (8.9%) |
| $100,000+ | 5,257 (31.0%) | 2,145 (14.8%) |
| Total | 16,957 (100.0%) | 14,480 (100.0%) |
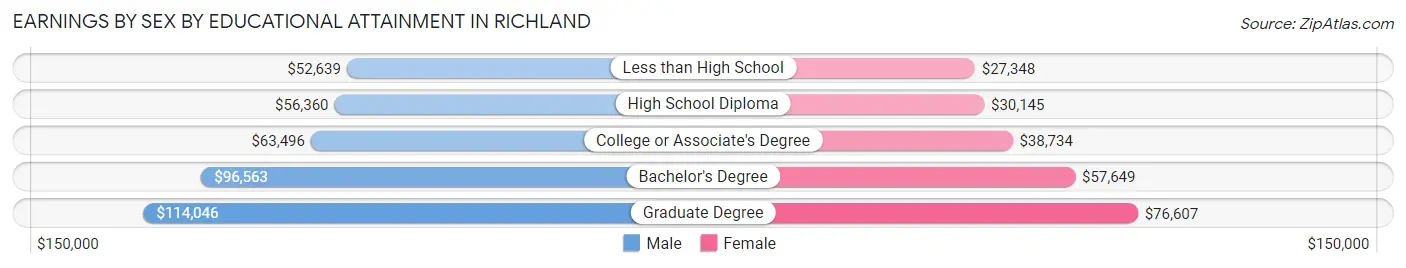
Earnings by Sex by Educational Attainment in Richland
Average earnings in Richland are $80,488 for men and $46,406 for women, a difference of 42.3%. Men with an educational attainment of graduate degree enjoy the highest average annual earnings of $114,046, while those with less than high school education earn the least with $52,639. Women with an educational attainment of graduate degree earn the most with the average annual earnings of $76,607, while those with less than high school education have the smallest earnings of $27,348.
| Educational Attainment | Male Income | Female Income |
| Less than High School | $52,639 | $27,348 |
| High School Diploma | $56,360 | $30,145 |
| College or Associate's Degree | $63,496 | $38,734 |
| Bachelor's Degree | $96,563 | $57,649 |
| Graduate Degree | $114,046 | $76,607 |
| Total | $80,488 | $46,406 |
Family Income in Richland
Family Income Brackets in Richland
According to the Richland family income data, there are 3,575 families falling into the $100,000 to $149,999 income range, which is the most common income bracket and makes up 24.0% of all families. Conversely, the $10,000 to $14,999 income bracket is the least frequent group with only 74 families (0.5%) belonging to this category.
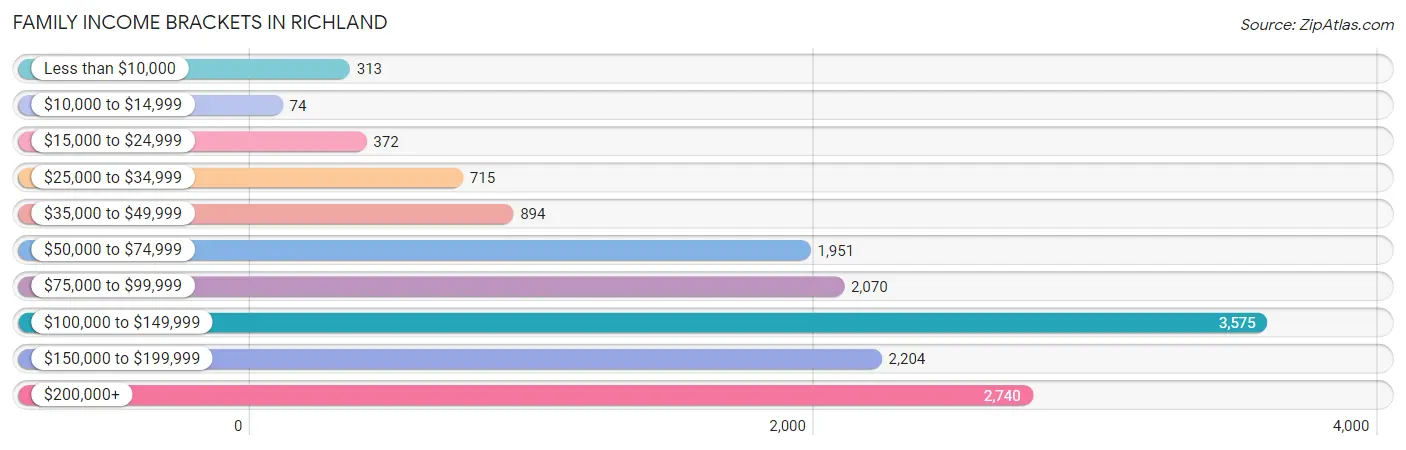
| Income Bracket | # Families | % Families |
| Less than $10,000 | 313 | 2.1% |
| $10,000 to $14,999 | 74 | 0.5% |
| $15,000 to $24,999 | 372 | 2.5% |
| $25,000 to $34,999 | 715 | 4.8% |
| $35,000 to $49,999 | 894 | 6.0% |
| $50,000 to $74,999 | 1,951 | 13.1% |
| $75,000 to $99,999 | 2,070 | 13.9% |
| $100,000 to $149,999 | 3,575 | 24.0% |
| $150,000 to $199,999 | 2,204 | 14.8% |
| $200,000+ | 2,740 | 18.4% |
Family Income by Famaliy Size in Richland
7+ person families (317 | 2.1%) account for the highest median family income in Richland with $170,740 per family, while 2-person families (7,569 | 50.8%) have the highest median income of $52,324 per family member.
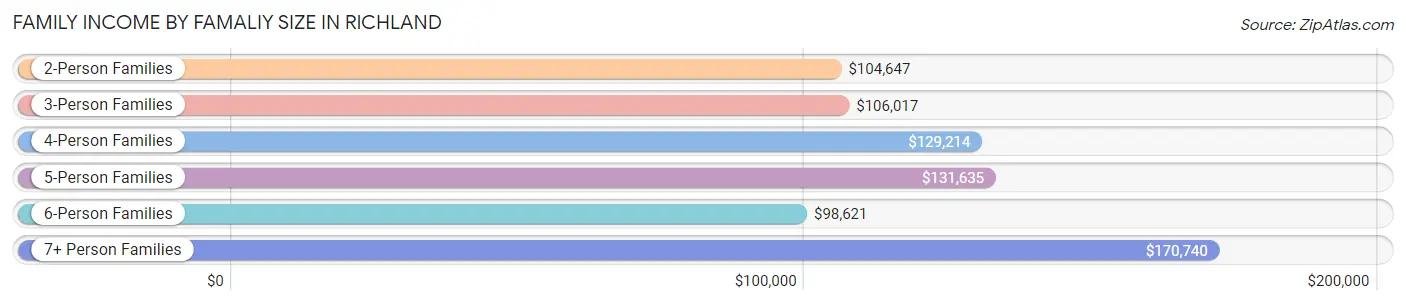
| Income Bracket | # Families | Median Income |
| 2-Person Families | 7,569 (50.8%) | $104,647 |
| 3-Person Families | 3,343 (22.5%) | $106,017 |
| 4-Person Families | 2,248 (15.1%) | $129,214 |
| 5-Person Families | 957 (6.4%) | $131,635 |
| 6-Person Families | 460 (3.1%) | $98,621 |
| 7+ Person Families | 317 (2.1%) | $170,740 |
| Total | 14,894 (100.0%) | $113,189 |
Family Income by Number of Earners in Richland
The median family income in Richland is $113,189, with families comprising 3+ earners (1,340) having the highest median family income of $163,026, while families with no earners (2,449) have the lowest median family income of $75,681, accounting for 9.0% and 16.4% of families, respectively.
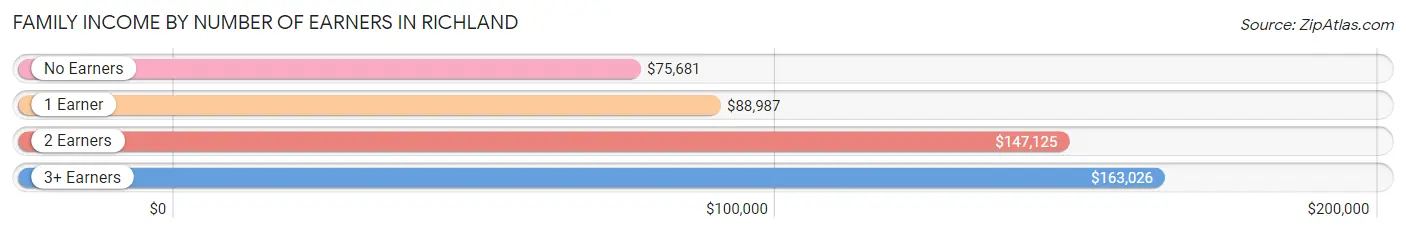
| Number of Earners | # Families | Median Income |
| No Earners | 2,449 (16.4%) | $75,681 |
| 1 Earner | 5,345 (35.9%) | $88,987 |
| 2 Earners | 5,760 (38.7%) | $147,125 |
| 3+ Earners | 1,340 (9.0%) | $163,026 |
| Total | 14,894 (100.0%) | $113,189 |
Household Income in Richland
Household Income Brackets in Richland
With 4,432 households falling in the category, the $100,000 to $149,999 income range is the most frequent in Richland, accounting for 18.4% of all households. In contrast, only 409 households (1.7%) fall into the less than $10,000 income bracket, making it the least populous group.
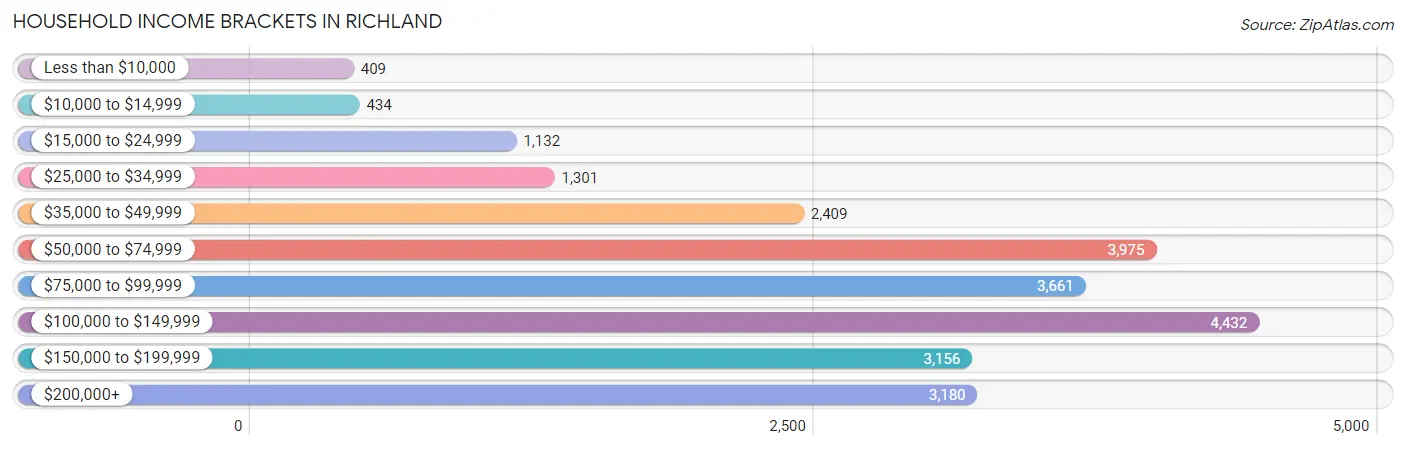
| Income Bracket | # Households | % Households |
| Less than $10,000 | 409 | 1.7% |
| $10,000 to $14,999 | 434 | 1.8% |
| $15,000 to $24,999 | 1,132 | 4.7% |
| $25,000 to $34,999 | 1,301 | 5.4% |
| $35,000 to $49,999 | 2,409 | 10.0% |
| $50,000 to $74,999 | 3,975 | 16.5% |
| $75,000 to $99,999 | 3,661 | 15.2% |
| $100,000 to $149,999 | 4,432 | 18.4% |
| $150,000 to $199,999 | 3,156 | 13.1% |
| $200,000+ | 3,180 | 13.2% |
Household Income by Householder Age in Richland
The median household income in Richland is $89,283, with the highest median household income of $117,380 found in the 45 to 64 years age bracket for the primary householder. A total of 8,185 households (34.0%) fall into this category. Meanwhile, the 15 to 24 years age bracket for the primary householder has the lowest median household income of $60,036, with 1,057 households (4.4%) in this group.
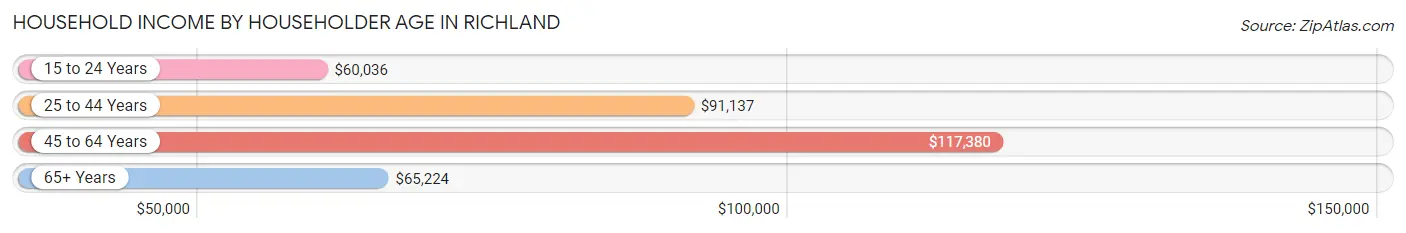
| Income Bracket | # Households | Median Income |
| 15 to 24 Years | 1,057 (4.4%) | $60,036 |
| 25 to 44 Years | 8,623 (35.8%) | $91,137 |
| 45 to 64 Years | 8,185 (34.0%) | $117,380 |
| 65+ Years | 6,223 (25.8%) | $65,224 |
| Total | 24,088 (100.0%) | $89,283 |
Poverty in Richland
Income Below Poverty by Sex and Age in Richland
With 7.0% poverty level for males and 8.0% for females among the residents of Richland, 5 year old males and 6 to 11 year old females are the most vulnerable to poverty, with 166 males (35.7%) and 317 females (14.3%) in their respective age groups living below the poverty level.
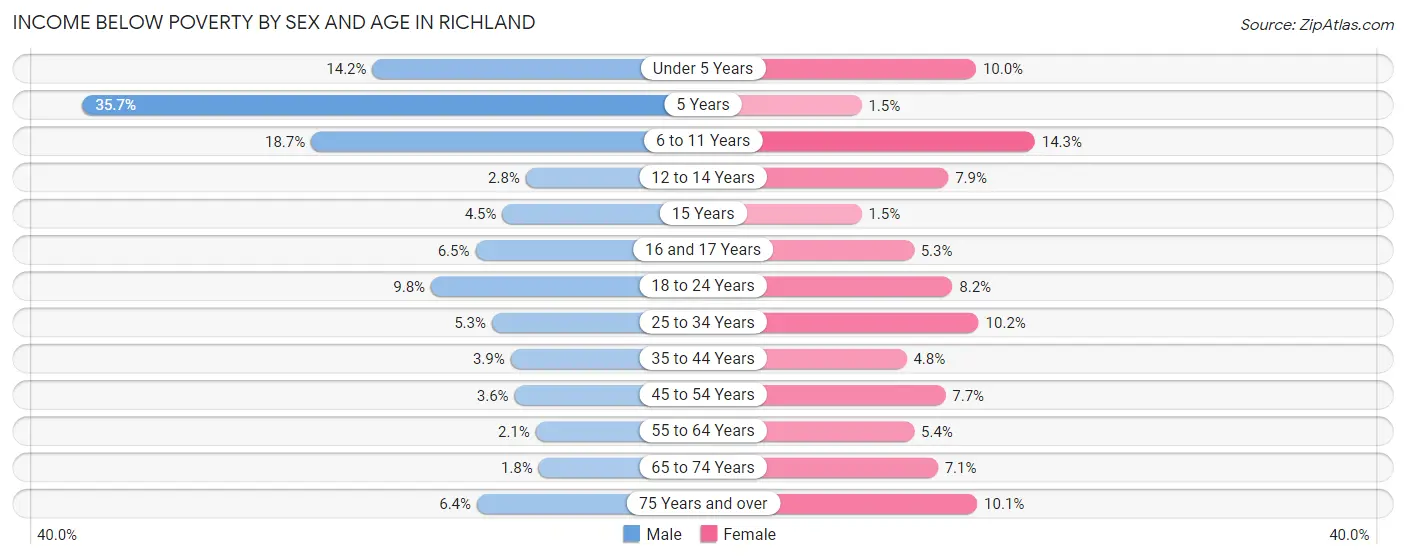
| Age Bracket | Male | Female |
| Under 5 Years | 313 (14.2%) | 140 (10.0%) |
| 5 Years | 166 (35.7%) | 6 (1.5%) |
| 6 to 11 Years | 521 (18.7%) | 317 (14.3%) |
| 12 to 14 Years | 39 (2.8%) | 82 (7.9%) |
| 15 Years | 16 (4.5%) | 6 (1.5%) |
| 16 and 17 Years | 68 (6.5%) | 40 (5.3%) |
| 18 to 24 Years | 299 (9.8%) | 189 (8.2%) |
| 25 to 34 Years | 227 (5.3%) | 461 (10.2%) |
| 35 to 44 Years | 161 (3.9%) | 177 (4.8%) |
| 45 to 54 Years | 108 (3.6%) | 257 (7.7%) |
| 55 to 64 Years | 83 (2.1%) | 196 (5.4%) |
| 65 to 74 Years | 47 (1.8%) | 212 (7.1%) |
| 75 Years and over | 128 (6.4%) | 236 (10.1%) |
| Total | 2,176 (7.0%) | 2,319 (8.0%) |
Income Above Poverty by Sex and Age in Richland
According to the poverty statistics in Richland, males aged 65 to 74 years and females aged 5 years are the age groups that are most secure financially, with 98.2% of males and 98.5% of females in these age groups living above the poverty line.
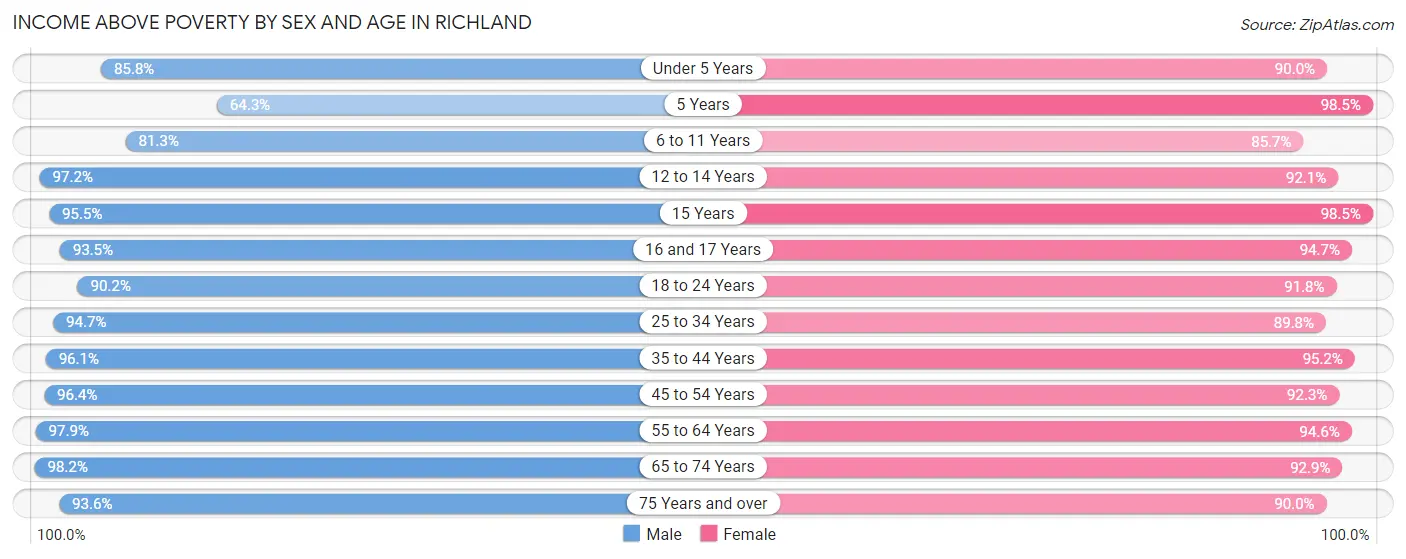
| Age Bracket | Male | Female |
| Under 5 Years | 1,895 (85.8%) | 1,266 (90.0%) |
| 5 Years | 299 (64.3%) | 404 (98.5%) |
| 6 to 11 Years | 2,260 (81.3%) | 1,895 (85.7%) |
| 12 to 14 Years | 1,354 (97.2%) | 956 (92.1%) |
| 15 Years | 337 (95.5%) | 405 (98.5%) |
| 16 and 17 Years | 972 (93.5%) | 709 (94.7%) |
| 18 to 24 Years | 2,744 (90.2%) | 2,113 (91.8%) |
| 25 to 34 Years | 4,051 (94.7%) | 4,077 (89.8%) |
| 35 to 44 Years | 3,951 (96.1%) | 3,514 (95.2%) |
| 45 to 54 Years | 2,864 (96.4%) | 3,087 (92.3%) |
| 55 to 64 Years | 3,954 (97.9%) | 3,454 (94.6%) |
| 65 to 74 Years | 2,507 (98.2%) | 2,766 (92.9%) |
| 75 Years and over | 1,867 (93.6%) | 2,113 (89.9%) |
| Total | 29,055 (93.0%) | 26,759 (92.0%) |
Income Below Poverty Among Married-Couple Families in Richland
The poverty statistics for married-couple families in Richland show that 2.1% or 234 of the total 11,289 families live below the poverty line. Families with 5 or more children have the highest poverty rate of 12.3%, comprising of 10 families. On the other hand, families with 3 or 4 children have the lowest poverty rate of 1.4%, which includes 14 families.
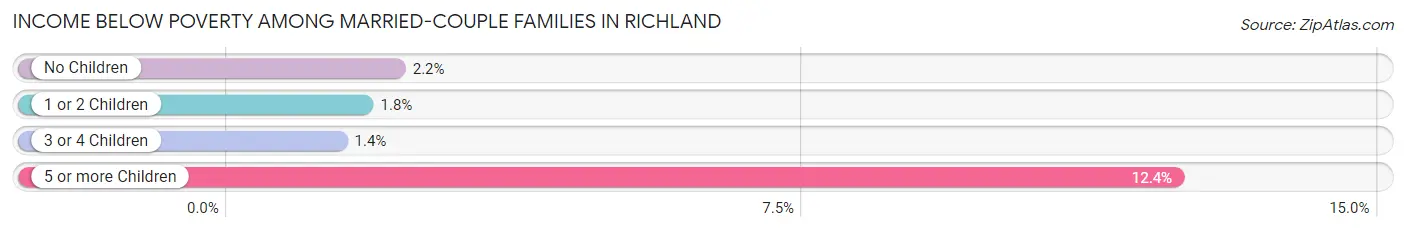
| Children | Above Poverty | Below Poverty |
| No Children | 6,643 (97.8%) | 149 (2.2%) |
| 1 or 2 Children | 3,378 (98.2%) | 61 (1.8%) |
| 3 or 4 Children | 963 (98.6%) | 14 (1.4%) |
| 5 or more Children | 71 (87.6%) | 10 (12.3%) |
| Total | 11,055 (97.9%) | 234 (2.1%) |
Income Below Poverty Among Single-Parent Households in Richland
According to the poverty data in Richland, 3.8% or 41 single-father households and 19.2% or 486 single-mother households are living below the poverty line. Among single-father households, those with 3 or 4 children have the highest poverty rate, with 12 households (14.6%) experiencing poverty. Likewise, among single-mother households, those with 5 or more children have the highest poverty rate, with 57 households (100.0%) falling below the poverty line.
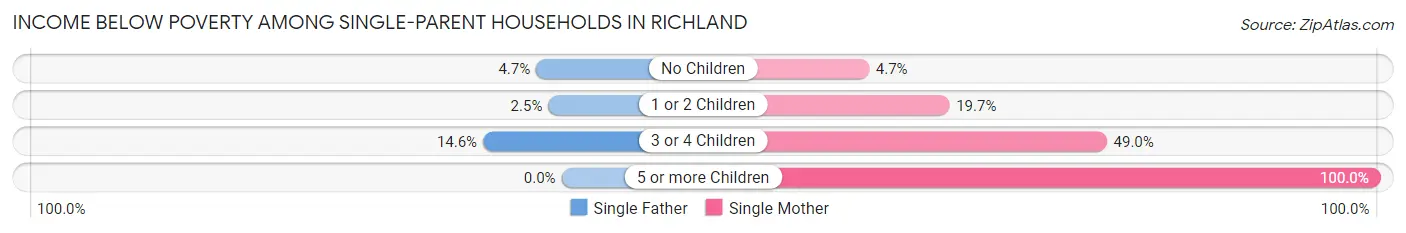
| Children | Single Father | Single Mother |
| No Children | 11 (4.7%) | 45 (4.7%) |
| 1 or 2 Children | 18 (2.5%) | 240 (19.7%) |
| 3 or 4 Children | 12 (14.6%) | 144 (49.0%) |
| 5 or more Children | 0 (0.0%) | 57 (100.0%) |
| Total | 41 (3.8%) | 486 (19.2%) |
Income Below Poverty Among Married-Couple vs Single-Parent Households in Richland
The poverty data for Richland shows that 234 of the married-couple family households (2.1%) and 527 of the single-parent households (14.6%) are living below the poverty level. Within the married-couple family households, those with 5 or more children have the highest poverty rate, with 10 households (12.3%) falling below the poverty line. Among the single-parent households, those with 5 or more children have the highest poverty rate, with 57 household (64.8%) living below poverty.
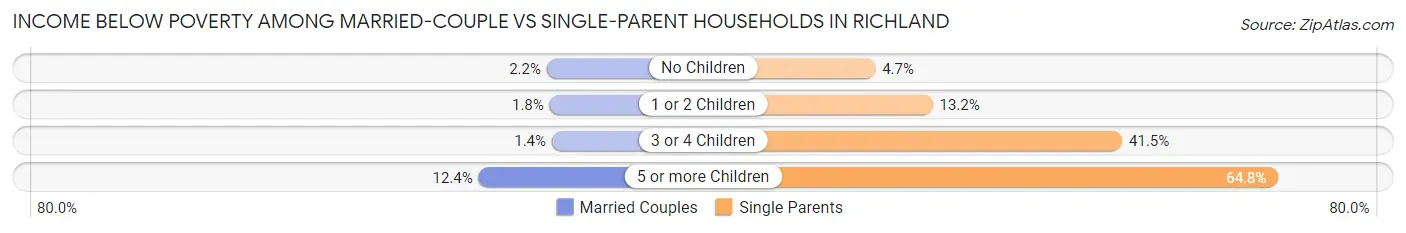
| Children | Married-Couple Families | Single-Parent Households |
| No Children | 149 (2.2%) | 56 (4.7%) |
| 1 or 2 Children | 61 (1.8%) | 258 (13.2%) |
| 3 or 4 Children | 14 (1.4%) | 156 (41.5%) |
| 5 or more Children | 10 (12.3%) | 57 (64.8%) |
| Total | 234 (2.1%) | 527 (14.6%) |
Race in Richland
The most populous races in Richland are White / Caucasian (49,007 | 80.5%), Hispanic or Latino (8,224 | 13.5%), and Two or more Races (5,219 | 8.6%).
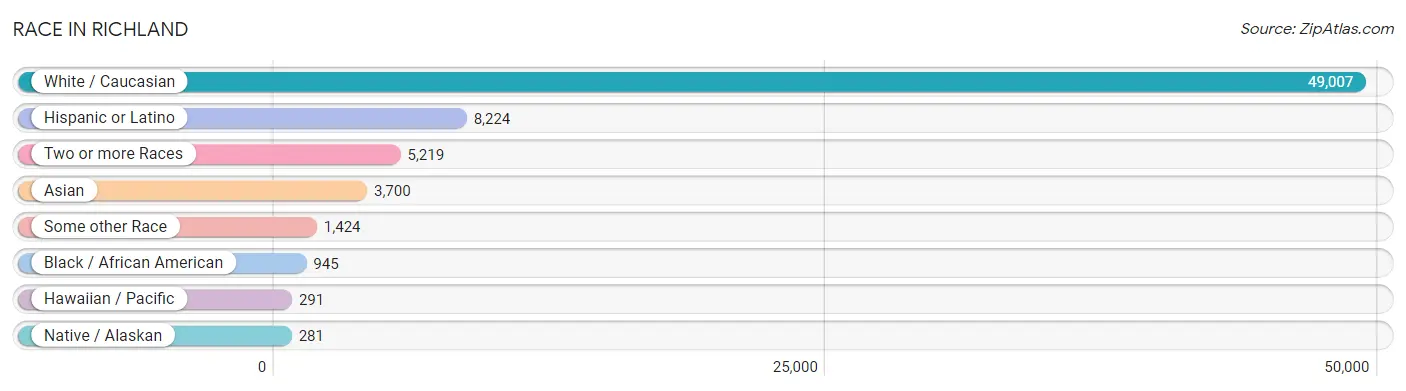
| Race | # Population | % Population |
| Asian | 3,700 | 6.1% |
| Black / African American | 945 | 1.5% |
| Hawaiian / Pacific | 291 | 0.5% |
| Hispanic or Latino | 8,224 | 13.5% |
| Native / Alaskan | 281 | 0.5% |
| White / Caucasian | 49,007 | 80.5% |
| Two or more Races | 5,219 | 8.6% |
| Some other Race | 1,424 | 2.3% |
| Total | 60,867 | 100.0% |
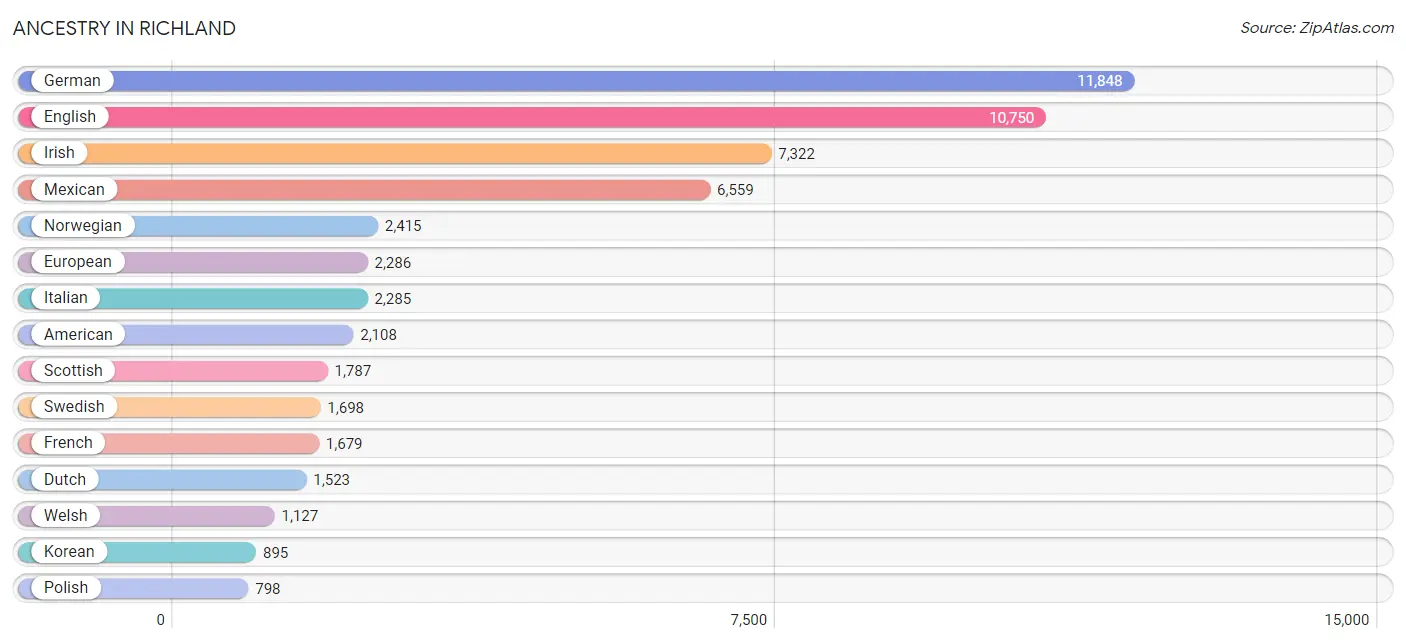
Ancestry in Richland
The most populous ancestries reported in Richland are German (11,848 | 19.5%), English (10,750 | 17.7%), Irish (7,322 | 12.0%), Mexican (6,559 | 10.8%), and Norwegian (2,415 | 4.0%), together accounting for 63.9% of all Richland residents.
| Ancestry | # Population | % Population |
| Afghan | 85 | 0.1% |
| African | 68 | 0.1% |
| Alaska Native | 30 | 0.1% |
| Albanian | 86 | 0.1% |
| Aleut | 9 | 0.0% |
| American | 2,108 | 3.5% |
| Apache | 5 | 0.0% |
| Arab | 549 | 0.9% |
| Argentinean | 26 | 0.0% |
| Armenian | 74 | 0.1% |
| Austrian | 110 | 0.2% |
| Barbadian | 11 | 0.0% |
| Basque | 41 | 0.1% |
| Belgian | 124 | 0.2% |
| Bhutanese | 295 | 0.5% |
| Bolivian | 16 | 0.0% |
| Brazilian | 27 | 0.0% |
| British | 531 | 0.9% |
| Bulgarian | 227 | 0.4% |
| Burmese | 486 | 0.8% |
| Canadian | 167 | 0.3% |
| Central American | 88 | 0.1% |
| Central American Indian | 184 | 0.3% |
| Cherokee | 144 | 0.2% |
| Chickasaw | 10 | 0.0% |
| Chilean | 16 | 0.0% |
| Chippewa | 16 | 0.0% |
| Choctaw | 27 | 0.0% |
| Colombian | 95 | 0.2% |
| Colville | 17 | 0.0% |
| Comanche | 12 | 0.0% |
| Costa Rican | 32 | 0.1% |
| Cree | 11 | 0.0% |
| Croatian | 135 | 0.2% |
| Crow | 28 | 0.1% |
| Cuban | 170 | 0.3% |
| Czech | 291 | 0.5% |
| Danish | 614 | 1.0% |
| Dominican | 62 | 0.1% |
| Dutch | 1,523 | 2.5% |
| Eastern European | 37 | 0.1% |
| Ecuadorian | 14 | 0.0% |
| Egyptian | 70 | 0.1% |
| English | 10,750 | 17.7% |
| Estonian | 20 | 0.0% |
| European | 2,286 | 3.8% |
| Filipino | 85 | 0.1% |
| Finnish | 230 | 0.4% |
| French | 1,679 | 2.8% |
| French Canadian | 266 | 0.4% |
| German | 11,848 | 19.5% |
| Ghanaian | 4 | 0.0% |
| Greek | 66 | 0.1% |
| Guamanian / Chamorro | 85 | 0.1% |
| Guatemalan | 36 | 0.1% |
| Hopi | 7 | 0.0% |
| Hungarian | 216 | 0.4% |
| Icelander | 8 | 0.0% |
| Indian (Asian) | 797 | 1.3% |
| Inupiat | 5 | 0.0% |
| Iraqi | 122 | 0.2% |
| Irish | 7,322 | 12.0% |
| Iroquois | 21 | 0.0% |
| Israeli | 35 | 0.1% |
| Italian | 2,285 | 3.7% |
| Korean | 895 | 1.5% |
| Laotian | 38 | 0.1% |
| Latvian | 11 | 0.0% |
| Lebanese | 27 | 0.0% |
| Malaysian | 24 | 0.0% |
| Mexican | 6,559 | 10.8% |
| Mexican American Indian | 86 | 0.1% |
| Moroccan | 81 | 0.1% |
| Native Hawaiian | 238 | 0.4% |
| Nigerian | 63 | 0.1% |
| Northern European | 312 | 0.5% |
| Norwegian | 2,415 | 4.0% |
| Pakistani | 89 | 0.2% |
| Palestinian | 84 | 0.1% |
| Pennsylvania German | 12 | 0.0% |
| Peruvian | 9 | 0.0% |
| Polish | 798 | 1.3% |
| Portuguese | 161 | 0.3% |
| Puerto Rican | 293 | 0.5% |
| Puget Sound Salish | 10 | 0.0% |
| Romanian | 106 | 0.2% |
| Russian | 597 | 1.0% |
| Samoan | 165 | 0.3% |
| Scandinavian | 395 | 0.6% |
| Scotch-Irish | 513 | 0.8% |
| Scottish | 1,787 | 2.9% |
| Serbian | 21 | 0.0% |
| Slavic | 22 | 0.0% |
| Slovak | 101 | 0.2% |
| Slovene | 14 | 0.0% |
| South American | 200 | 0.3% |
| South American Indian | 16 | 0.0% |
| Spaniard | 259 | 0.4% |
| Spanish | 242 | 0.4% |
| Sri Lankan | 482 | 0.8% |
| Subsaharan African | 203 | 0.3% |
| Swedish | 1,698 | 2.8% |
| Swiss | 239 | 0.4% |
| Syrian | 24 | 0.0% |
| Thai | 641 | 1.1% |
| Trinidadian and Tobagonian | 17 | 0.0% |
| Turkish | 10 | 0.0% |
| Ugandan | 56 | 0.1% |
| Ukrainian | 237 | 0.4% |
| Venezuelan | 24 | 0.0% |
| Vietnamese | 112 | 0.2% |
| Welsh | 1,127 | 1.8% |
| Yaqui | 33 | 0.1% |
| Yugoslavian | 203 | 0.3% | View All 114 Rows |
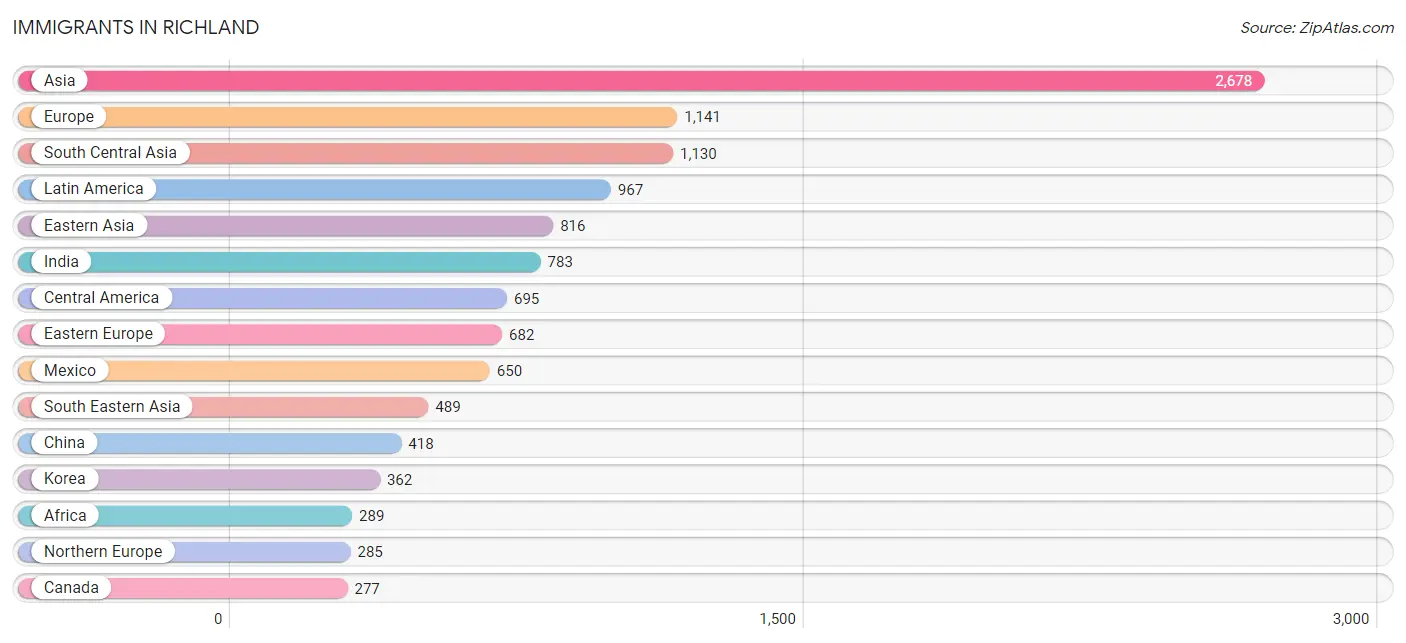
Immigrants in Richland
The most numerous immigrant groups reported in Richland came from Asia (2,678 | 4.4%), Europe (1,141 | 1.9%), South Central Asia (1,130 | 1.9%), Latin America (967 | 1.6%), and Eastern Asia (816 | 1.3%), together accounting for 11.1% of all Richland residents.
| Immigration Origin | # Population | % Population |
| Afghanistan | 85 | 0.1% |
| Africa | 289 | 0.5% |
| Argentina | 19 | 0.0% |
| Asia | 2,678 | 4.4% |
| Australia | 29 | 0.1% |
| Bangladesh | 115 | 0.2% |
| Barbados | 11 | 0.0% |
| Bosnia and Herzegovina | 88 | 0.1% |
| Brazil | 27 | 0.0% |
| Bulgaria | 164 | 0.3% |
| Canada | 277 | 0.5% |
| Caribbean | 96 | 0.2% |
| Central America | 695 | 1.1% |
| Chile | 16 | 0.0% |
| China | 418 | 0.7% |
| Colombia | 67 | 0.1% |
| Costa Rica | 11 | 0.0% |
| Cuba | 40 | 0.1% |
| Czechoslovakia | 8 | 0.0% |
| Denmark | 12 | 0.0% |
| Eastern Africa | 101 | 0.2% |
| Eastern Asia | 816 | 1.3% |
| Eastern Europe | 682 | 1.1% |
| Ecuador | 14 | 0.0% |
| England | 92 | 0.2% |
| Europe | 1,141 | 1.9% |
| France | 15 | 0.0% |
| Germany | 94 | 0.2% |
| Ghana | 69 | 0.1% |
| Guatemala | 34 | 0.1% |
| Hong Kong | 6 | 0.0% |
| India | 783 | 1.3% |
| Indonesia | 13 | 0.0% |
| Iran | 45 | 0.1% |
| Iraq | 99 | 0.2% |
| Ireland | 25 | 0.0% |
| Israel | 14 | 0.0% |
| Italy | 4 | 0.0% |
| Jamaica | 24 | 0.0% |
| Japan | 36 | 0.1% |
| Kenya | 6 | 0.0% |
| Korea | 362 | 0.6% |
| Kuwait | 19 | 0.0% |
| Latin America | 967 | 1.6% |
| Lebanon | 23 | 0.0% |
| Malaysia | 12 | 0.0% |
| Mexico | 650 | 1.1% |
| Middle Africa | 58 | 0.1% |
| Moldova | 45 | 0.1% |
| Morocco | 18 | 0.0% |
| Nepal | 39 | 0.1% |
| Netherlands | 15 | 0.0% |
| Nigeria | 15 | 0.0% |
| Northern Africa | 46 | 0.1% |
| Northern Europe | 285 | 0.5% |
| Norway | 11 | 0.0% |
| Oceania | 45 | 0.1% |
| Pakistan | 22 | 0.0% |
| Peru | 9 | 0.0% |
| Philippines | 187 | 0.3% |
| Poland | 87 | 0.1% |
| Romania | 23 | 0.0% |
| Russia | 92 | 0.2% |
| South America | 176 | 0.3% |
| South Central Asia | 1,130 | 1.9% |
| South Eastern Asia | 489 | 0.8% |
| Southern Europe | 33 | 0.1% |
| Spain | 29 | 0.1% |
| Sri Lanka | 41 | 0.1% |
| Sweden | 45 | 0.1% |
| Switzerland | 17 | 0.0% |
| Syria | 38 | 0.1% |
| Taiwan | 78 | 0.1% |
| Thailand | 43 | 0.1% |
| Trinidad and Tobago | 21 | 0.0% |
| Turkey | 17 | 0.0% |
| Uganda | 62 | 0.1% |
| Ukraine | 75 | 0.1% |
| Venezuela | 24 | 0.0% |
| Vietnam | 234 | 0.4% |
| Western Africa | 84 | 0.1% |
| Western Asia | 243 | 0.4% |
| Western Europe | 141 | 0.2% |
| Zimbabwe | 21 | 0.0% | View All 84 Rows |
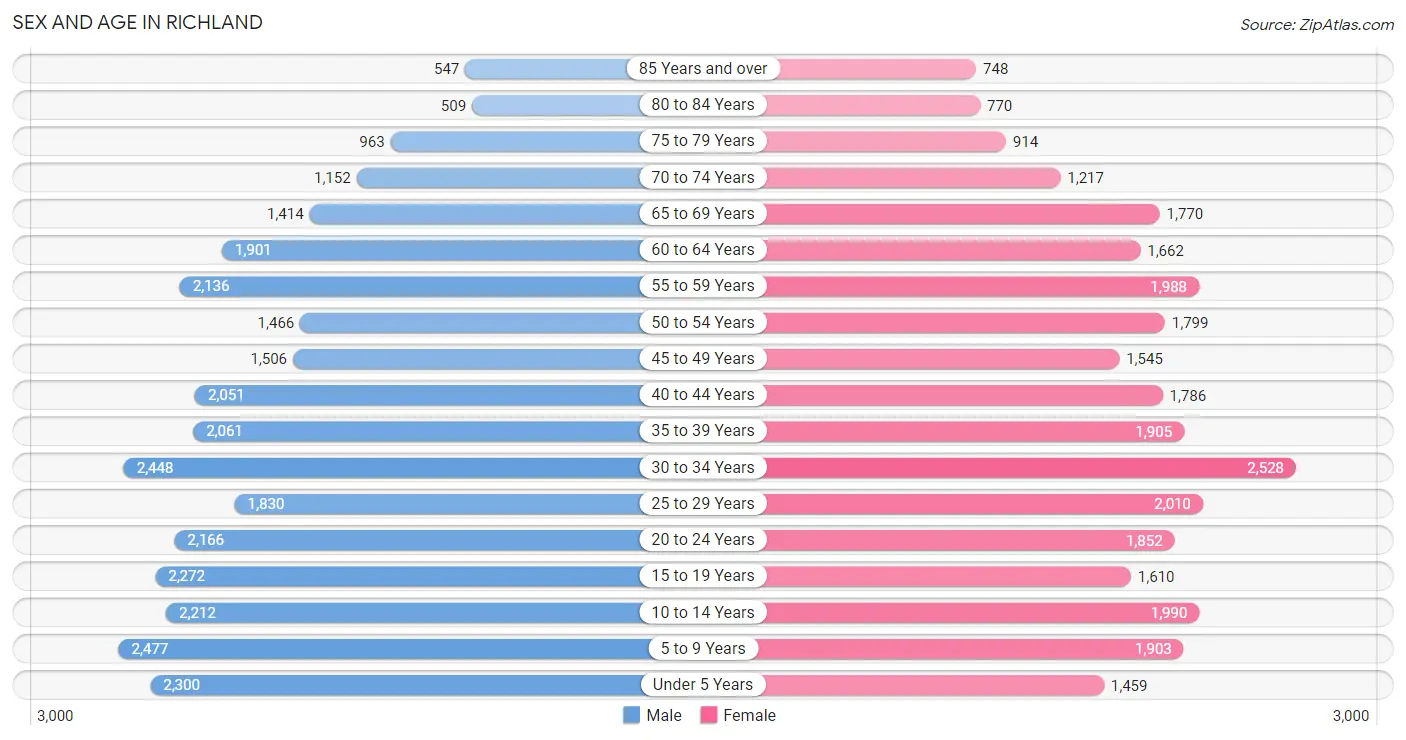
Sex and Age in Richland
Sex and Age in Richland
The most populous age groups in Richland are 5 to 9 Years (2,477 | 7.9%) for men and 30 to 34 Years (2,528 | 8.6%) for women.
| Age Bracket | Male | Female |
| Under 5 Years | 2,300 (7.3%) | 1,459 (5.0%) |
| 5 to 9 Years | 2,477 (7.9%) | 1,903 (6.5%) |
| 10 to 14 Years | 2,212 (7.0%) | 1,990 (6.8%) |
| 15 to 19 Years | 2,272 (7.2%) | 1,610 (5.5%) |
| 20 to 24 Years | 2,166 (6.9%) | 1,852 (6.3%) |
| 25 to 29 Years | 1,830 (5.8%) | 2,010 (6.8%) |
| 30 to 34 Years | 2,448 (7.8%) | 2,528 (8.6%) |
| 35 to 39 Years | 2,061 (6.6%) | 1,905 (6.5%) |
| 40 to 44 Years | 2,051 (6.5%) | 1,786 (6.1%) |
| 45 to 49 Years | 1,506 (4.8%) | 1,545 (5.2%) |
| 50 to 54 Years | 1,466 (4.7%) | 1,799 (6.1%) |
| 55 to 59 Years | 2,136 (6.8%) | 1,988 (6.8%) |
| 60 to 64 Years | 1,901 (6.0%) | 1,662 (5.6%) |
| 65 to 69 Years | 1,414 (4.5%) | 1,770 (6.0%) |
| 70 to 74 Years | 1,152 (3.7%) | 1,217 (4.1%) |
| 75 to 79 Years | 963 (3.1%) | 914 (3.1%) |
| 80 to 84 Years | 509 (1.6%) | 770 (2.6%) |
| 85 Years and over | 547 (1.7%) | 748 (2.5%) |
| Total | 31,411 (100.0%) | 29,456 (100.0%) |
Families and Households in Richland
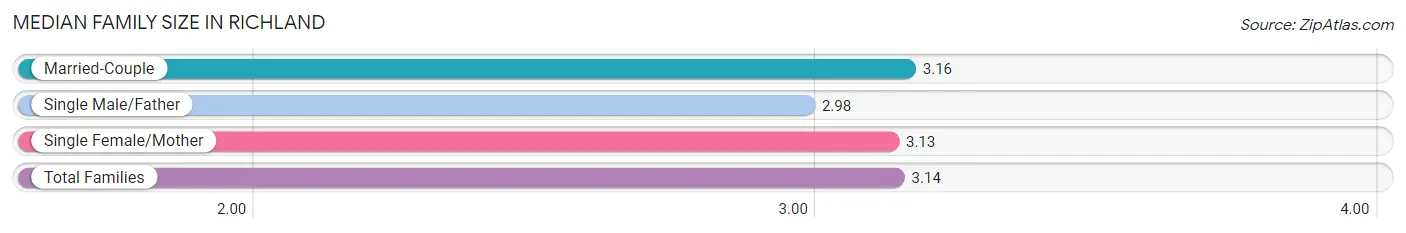
Median Family Size in Richland
The median family size in Richland is 3.14 persons per family, with married-couple families (11,289 | 75.8%) accounting for the largest median family size of 3.16 persons per family. On the other hand, single male/father families (1,073 | 7.2%) represent the smallest median family size with 2.98 persons per family.
| Family Type | # Families | Family Size |
| Married-Couple | 11,289 (75.8%) | 3.16 |
| Single Male/Father | 1,073 (7.2%) | 2.98 |
| Single Female/Mother | 2,532 (17.0%) | 3.13 |
| Total Families | 14,894 (100.0%) | 3.14 |
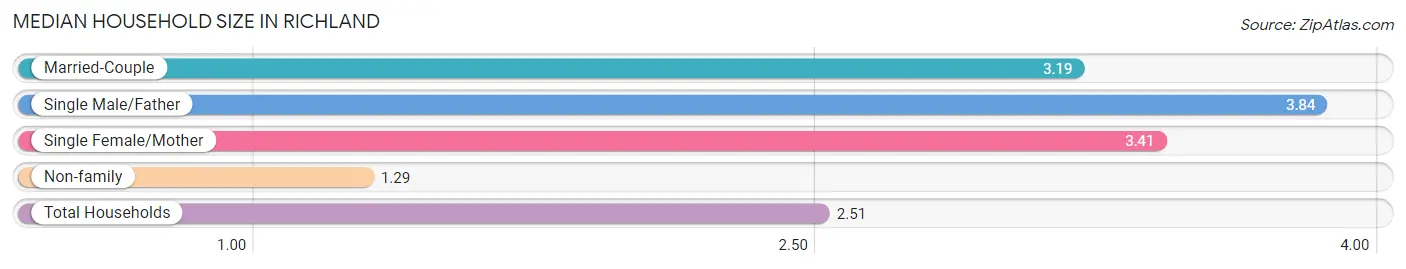
Median Household Size in Richland
The median household size in Richland is 2.51 persons per household, with single male/father households (1,073 | 4.4%) accounting for the largest median household size of 3.84 persons per household. non-family households (9,194 | 38.2%) represent the smallest median household size with 1.29 persons per household.
| Household Type | # Households | Household Size |
| Married-Couple | 11,289 (46.9%) | 3.19 |
| Single Male/Father | 1,073 (4.4%) | 3.84 |
| Single Female/Mother | 2,532 (10.5%) | 3.41 |
| Non-family | 9,194 (38.2%) | 1.29 |
| Total Households | 24,088 (100.0%) | 2.51 |
Household Size by Marriage Status in Richland
Out of a total of 24,088 households in Richland, 14,894 (61.8%) are family households, while 9,194 (38.2%) are nonfamily households. The most numerous type of family households are 2-person households, comprising 6,875, and the most common type of nonfamily households are 1-person households, comprising 7,299.
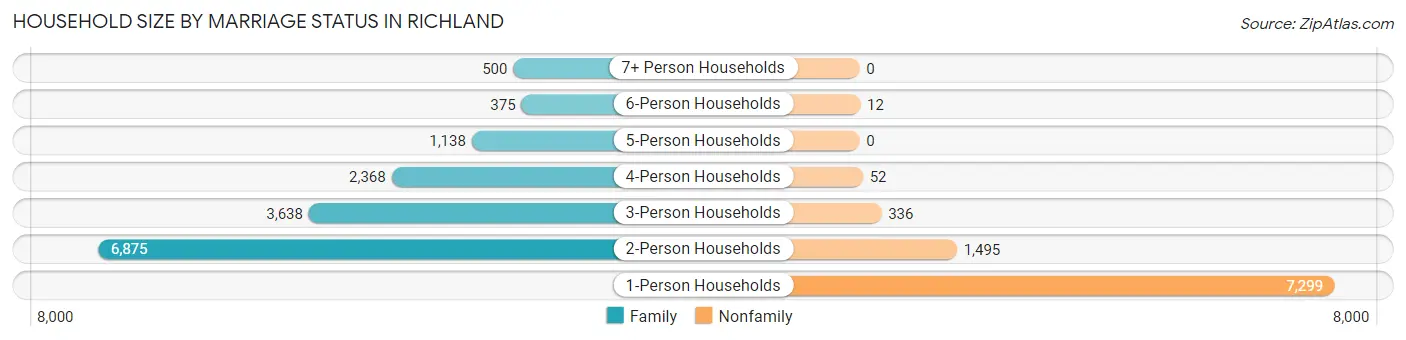
| Household Size | Family Households | Nonfamily Households |
| 1-Person Households | - | 7,299 (30.3%) |
| 2-Person Households | 6,875 (28.5%) | 1,495 (6.2%) |
| 3-Person Households | 3,638 (15.1%) | 336 (1.4%) |
| 4-Person Households | 2,368 (9.8%) | 52 (0.2%) |
| 5-Person Households | 1,138 (4.7%) | 0 (0.0%) |
| 6-Person Households | 375 (1.6%) | 12 (0.1%) |
| 7+ Person Households | 500 (2.1%) | 0 (0.0%) |
| Total | 14,894 (61.8%) | 9,194 (38.2%) |
Female Fertility in Richland
Fertility by Age in Richland
Average fertility rate in Richland is 42.0 births per 1,000 women. Women in the age bracket of 20 to 34 years have the highest fertility rate with 70.0 births per 1,000 women. Women in the age bracket of 20 to 34 years acount for 77.0% of all women with births.
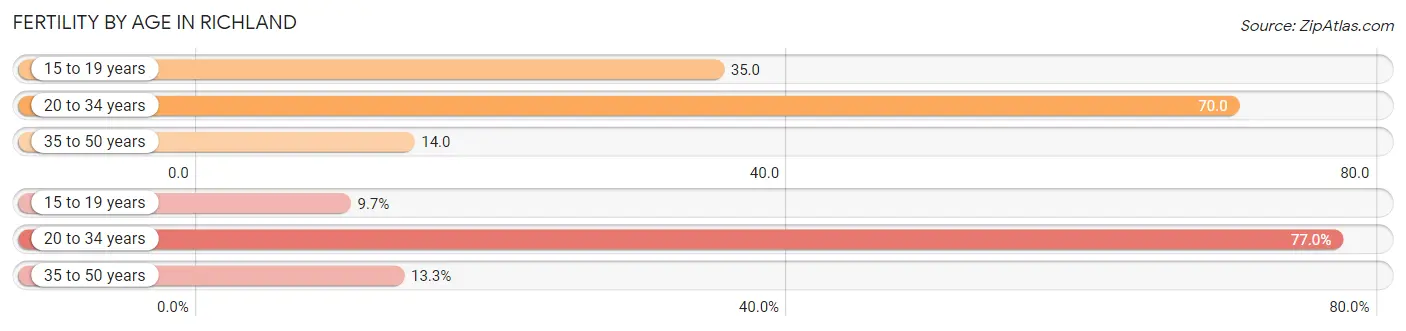
| Age Bracket | Women with Births | Births / 1,000 Women |
| 15 to 19 years | 56 (9.7%) | 35.0 |
| 20 to 34 years | 446 (77.0%) | 70.0 |
| 35 to 50 years | 77 (13.3%) | 14.0 |
| Total | 579 (100.0%) | 42.0 |
Fertility by Age by Marriage Status in Richland
69.8% of women with births (579) in Richland are married. The highest percentage of unmarried women with births falls into 15 to 19 years age bracket with 33.9% of them unmarried at the time of birth, while the lowest percentage of unmarried women with births belong to 35 to 50 years age bracket with 20.8% of them unmarried.
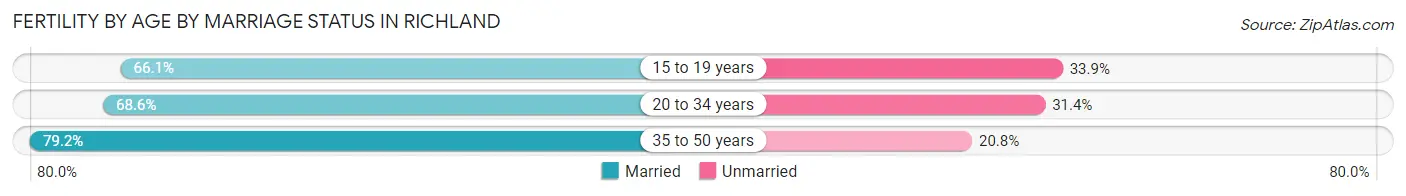
| Age Bracket | Married | Unmarried |
| 15 to 19 years | 37 (66.1%) | 19 (33.9%) |
| 20 to 34 years | 306 (68.6%) | 140 (31.4%) |
| 35 to 50 years | 61 (79.2%) | 16 (20.8%) |
| Total | 404 (69.8%) | 175 (30.2%) |
Fertility by Education in Richland
Average fertility rate in Richland is 42.0 births per 1,000 women. Women with the education attainment of high school diploma have the highest fertility rate of 76.0 births per 1,000 women, while women with the education attainment of less than high school have the lowest fertility at 18.0 births per 1,000 women. Women with the education attainment of college or associate's degree represent 31.6% of all women with births.
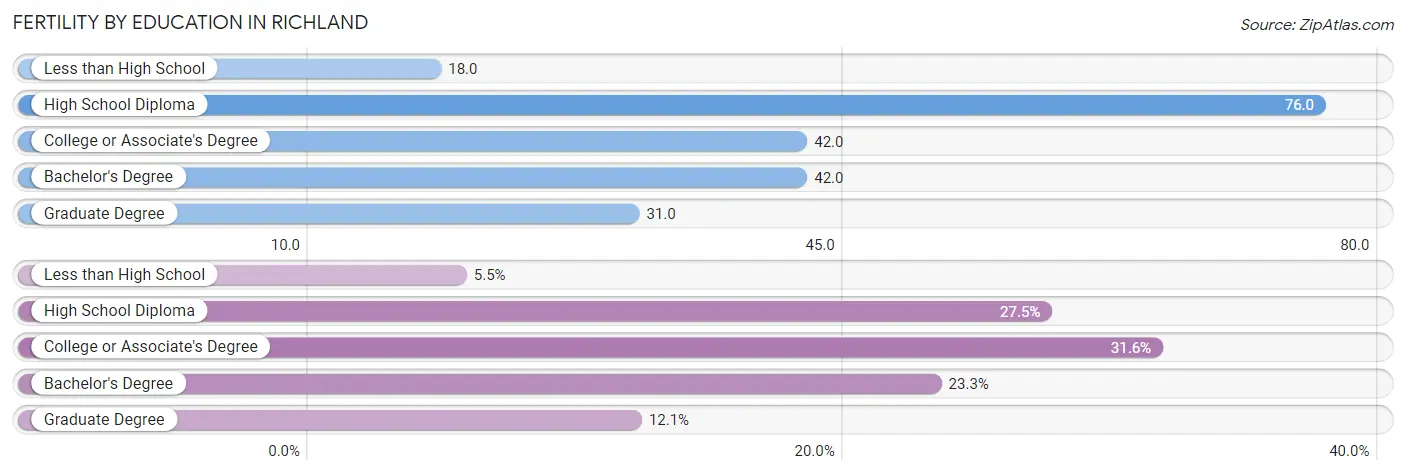
| Educational Attainment | Women with Births | Births / 1,000 Women |
| Less than High School | 32 (5.5%) | 18.0 |
| High School Diploma | 159 (27.5%) | 76.0 |
| College or Associate's Degree | 183 (31.6%) | 42.0 |
| Bachelor's Degree | 135 (23.3%) | 42.0 |
| Graduate Degree | 70 (12.1%) | 31.0 |
| Total | 579 (100.0%) | 42.0 |
Fertility by Education by Marriage Status in Richland
30.2% of women with births in Richland are unmarried. Women with the educational attainment of bachelor's degree are most likely to be married with 100.0% of them married at childbirth, while women with the educational attainment of high school diploma are least likely to be married with 78.6% of them unmarried at childbirth.
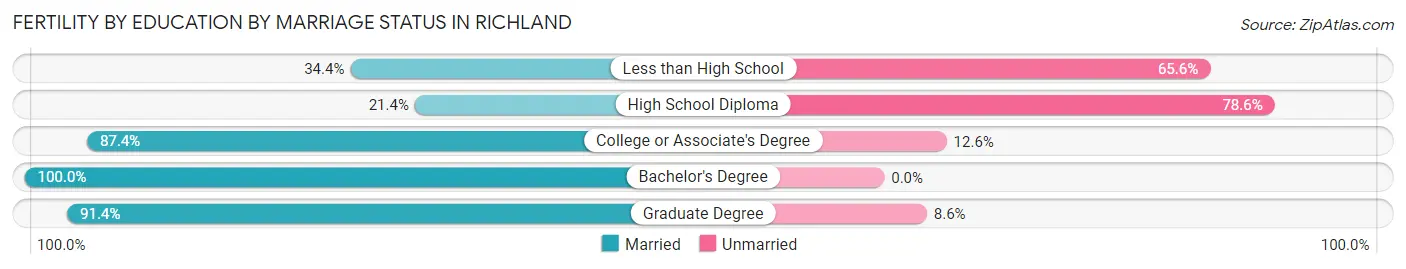
| Educational Attainment | Married | Unmarried |
| Less than High School | 11 (34.4%) | 21 (65.6%) |
| High School Diploma | 34 (21.4%) | 125 (78.6%) |
| College or Associate's Degree | 160 (87.4%) | 23 (12.6%) |
| Bachelor's Degree | 135 (100.0%) | 0 (0.0%) |
| Graduate Degree | 64 (91.4%) | 6 (8.6%) |
| Total | 404 (69.8%) | 175 (30.2%) |
Employment Characteristics in Richland
Employment by Class of Employer in Richland
Among the 28,462 employed individuals in Richland, private company employees (17,698 | 62.2%), not-for-profit organizations (3,262 | 11.5%), and local government employees (1,963 | 6.9%) make up the most common classes of employment.
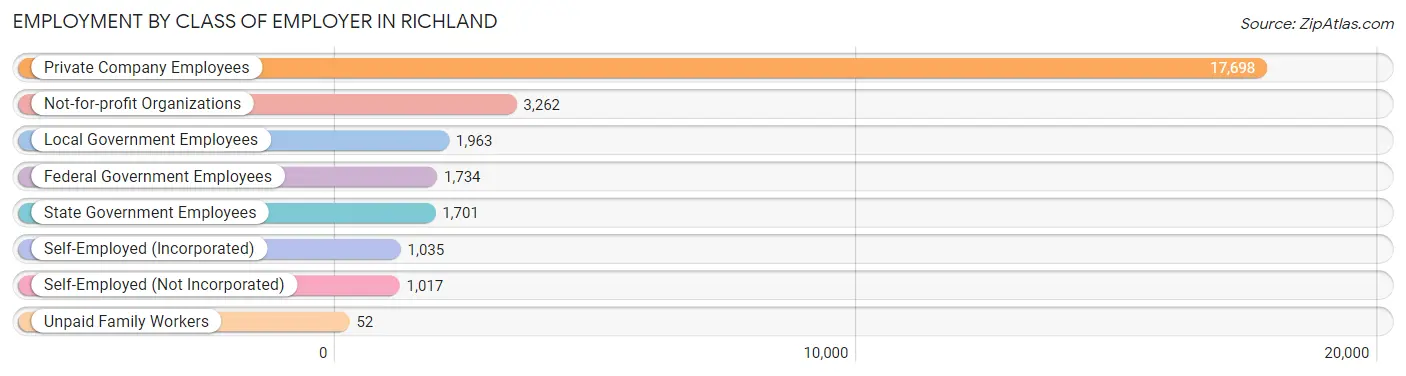
| Employer Class | # Employees | % Employees |
| Private Company Employees | 17,698 | 62.2% |
| Self-Employed (Incorporated) | 1,035 | 3.6% |
| Self-Employed (Not Incorporated) | 1,017 | 3.6% |
| Not-for-profit Organizations | 3,262 | 11.5% |
| Local Government Employees | 1,963 | 6.9% |
| State Government Employees | 1,701 | 6.0% |
| Federal Government Employees | 1,734 | 6.1% |
| Unpaid Family Workers | 52 | 0.2% |
| Total | 28,462 | 100.0% |
Employment Status by Age in Richland
According to the labor force statistics for Richland, out of the total population over 16 years of age (47,762), 63.6% or 30,377 individuals are in the labor force, with 5.1% or 1,549 of them unemployed. The age group with the highest labor force participation rate is 30 to 34 years, with 87.2% or 4,339 individuals in the labor force. Within the labor force, the 16 to 19 years age range has the highest percentage of unemployed individuals, with 20.7% or 248 of them being unemployed.
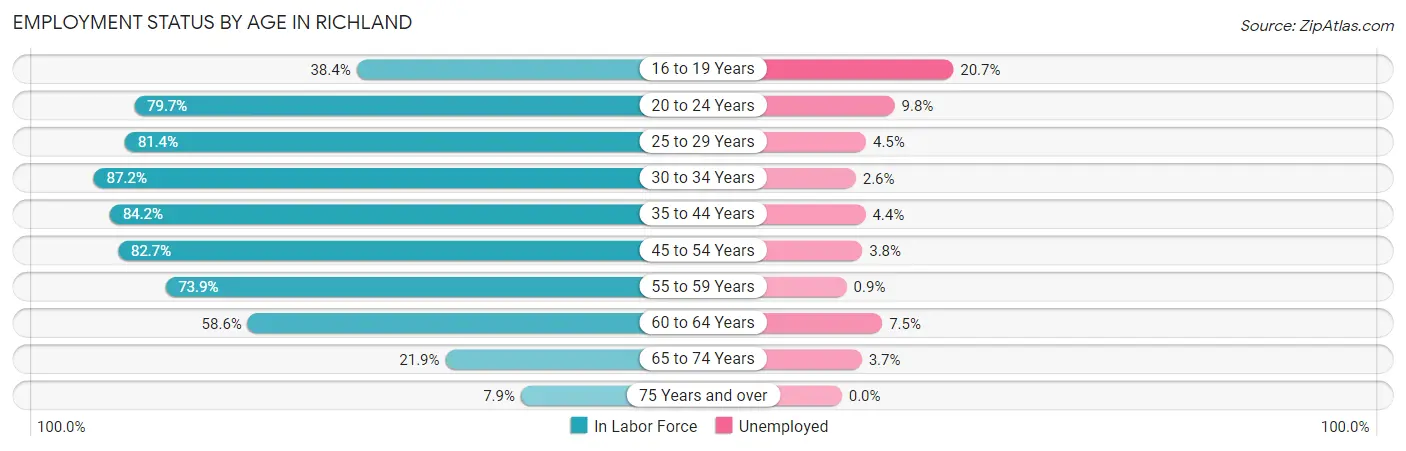
| Age Bracket | In Labor Force | Unemployed |
| 16 to 19 Years | 1,197 (38.4%) | 248 (20.7%) |
| 20 to 24 Years | 3,202 (79.7%) | 314 (9.8%) |
| 25 to 29 Years | 3,126 (81.4%) | 141 (4.5%) |
| 30 to 34 Years | 4,339 (87.2%) | 113 (2.6%) |
| 35 to 44 Years | 6,570 (84.2%) | 289 (4.4%) |
| 45 to 54 Years | 5,223 (82.7%) | 198 (3.8%) |
| 55 to 59 Years | 3,048 (73.9%) | 27 (0.9%) |
| 60 to 64 Years | 2,088 (58.6%) | 157 (7.5%) |
| 65 to 74 Years | 1,216 (21.9%) | 45 (3.7%) |
| 75 Years and over | 352 (7.9%) | 0 (0.0%) |
| Total | 30,377 (63.6%) | 1,549 (5.1%) |
Employment Status by Educational Attainment in Richland
According to labor force statistics for Richland, 79.7% of individuals (24,406) out of the total population between 25 and 64 years of age (30,622) are in the labor force, with 3.8% or 927 of them being unemployed. The group with the highest labor force participation rate are those with the educational attainment of bachelor's degree or higher, with 83.6% or 11,888 individuals in the labor force. Within the labor force, individuals with less than high school education have the highest percentage of unemployment, with 17.3% or 124 of them being unemployed.
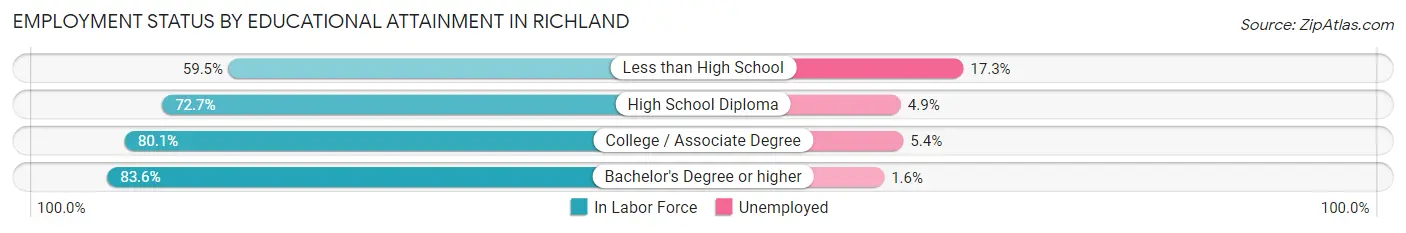
| Educational Attainment | In Labor Force | Unemployed |
| Less than High School | 716 (59.5%) | 208 (17.3%) |
| High School Diploma | 3,786 (72.7%) | 255 (4.9%) |
| College / Associate Degree | 8,002 (80.1%) | 539 (5.4%) |
| Bachelor's Degree or higher | 11,888 (83.6%) | 228 (1.6%) |
| Total | 24,406 (79.7%) | 1,164 (3.8%) |
Employment Occupations by Sex in Richland
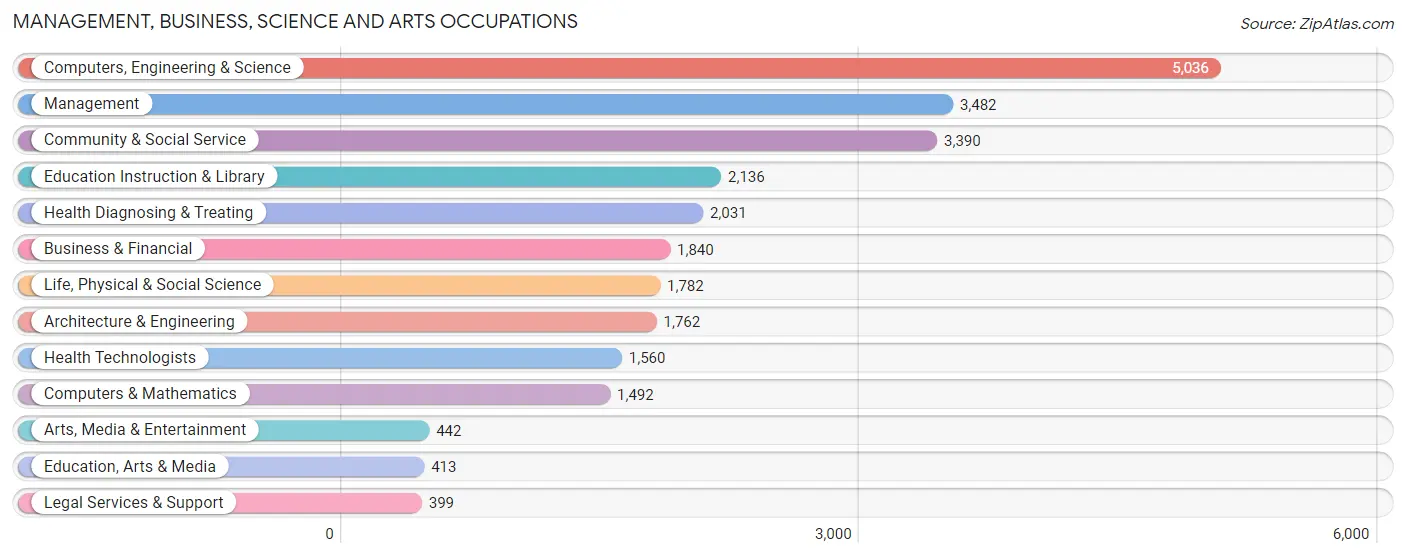
Management, Business, Science and Arts Occupations
The most common Management, Business, Science and Arts occupations in Richland are Computers, Engineering & Science (5,036 | 17.5%), Management (3,482 | 12.1%), Community & Social Service (3,390 | 11.8%), Education Instruction & Library (2,136 | 7.4%), and Health Diagnosing & Treating (2,031 | 7.0%).
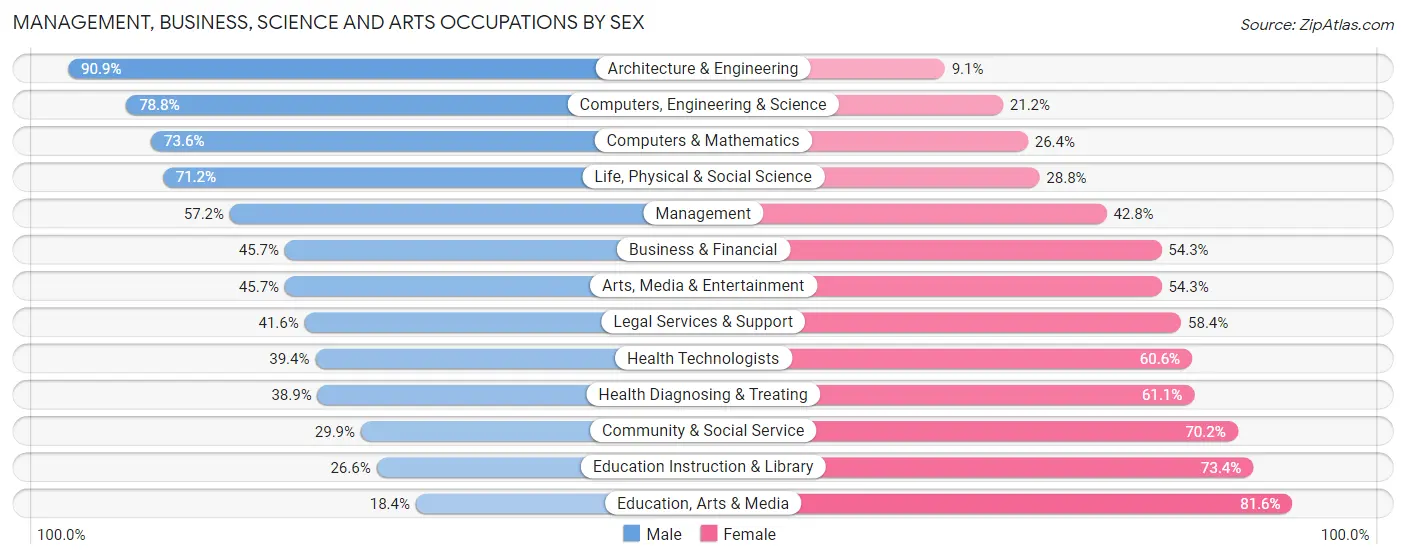
Management, Business, Science and Arts Occupations by Sex
Within the Management, Business, Science and Arts occupations in Richland, the most male-oriented occupations are Architecture & Engineering (90.9%), Computers, Engineering & Science (78.8%), and Computers & Mathematics (73.6%), while the most female-oriented occupations are Education, Arts & Media (81.6%), Education Instruction & Library (73.4%), and Community & Social Service (70.2%).
| Occupation | Male | Female |
| Management | 1,991 (57.2%) | 1,491 (42.8%) |
| Business & Financial | 841 (45.7%) | 999 (54.3%) |
| Computers, Engineering & Science | 3,968 (78.8%) | 1,068 (21.2%) |
| Computers & Mathematics | 1,098 (73.6%) | 394 (26.4%) |
| Architecture & Engineering | 1,602 (90.9%) | 160 (9.1%) |
| Life, Physical & Social Science | 1,268 (71.2%) | 514 (28.8%) |
| Community & Social Service | 1,012 (29.8%) | 2,378 (70.2%) |
| Education, Arts & Media | 76 (18.4%) | 337 (81.6%) |
| Legal Services & Support | 166 (41.6%) | 233 (58.4%) |
| Education Instruction & Library | 568 (26.6%) | 1,568 (73.4%) |
| Arts, Media & Entertainment | 202 (45.7%) | 240 (54.3%) |
| Health Diagnosing & Treating | 790 (38.9%) | 1,241 (61.1%) |
| Health Technologists | 614 (39.4%) | 946 (60.6%) |
| Total (Category) | 8,602 (54.5%) | 7,177 (45.5%) |
| Total (Overall) | 15,737 (54.6%) | 13,065 (45.4%) |
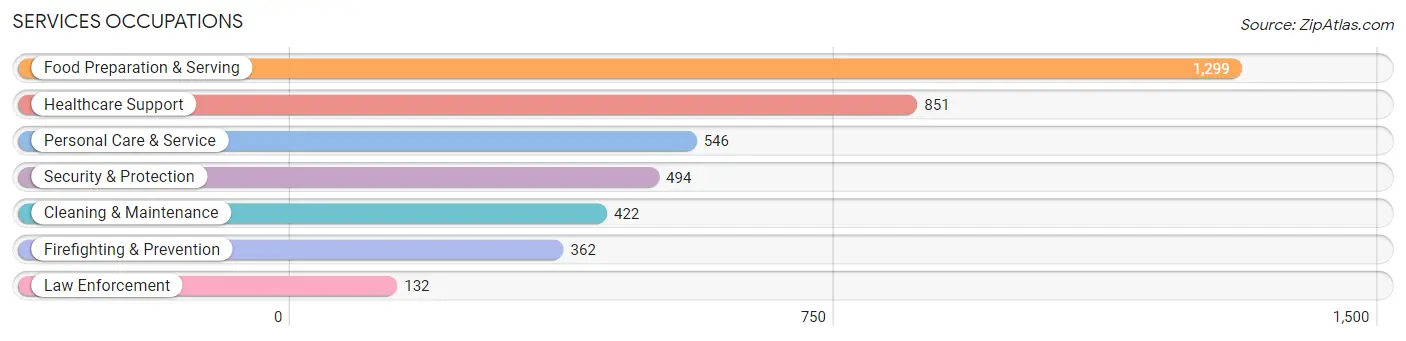
Services Occupations
The most common Services occupations in Richland are Food Preparation & Serving (1,299 | 4.5%), Healthcare Support (851 | 2.9%), Personal Care & Service (546 | 1.9%), Security & Protection (494 | 1.7%), and Cleaning & Maintenance (422 | 1.5%).
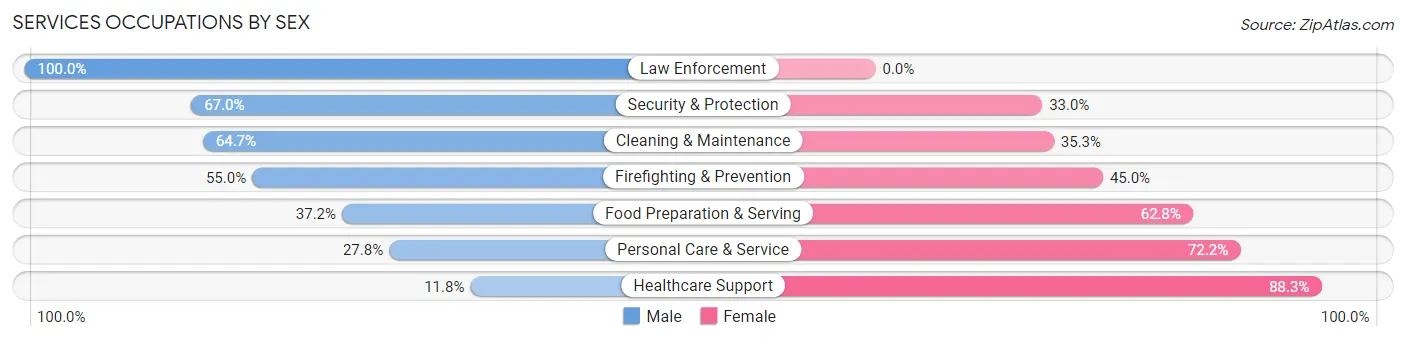
Services Occupations by Sex
Within the Services occupations in Richland, the most male-oriented occupations are Law Enforcement (100.0%), Security & Protection (67.0%), and Cleaning & Maintenance (64.7%), while the most female-oriented occupations are Healthcare Support (88.2%), Personal Care & Service (72.2%), and Food Preparation & Serving (62.8%).
| Occupation | Male | Female |
| Healthcare Support | 100 (11.7%) | 751 (88.2%) |
| Security & Protection | 331 (67.0%) | 163 (33.0%) |
| Firefighting & Prevention | 199 (55.0%) | 163 (45.0%) |
| Law Enforcement | 132 (100.0%) | 0 (0.0%) |
| Food Preparation & Serving | 483 (37.2%) | 816 (62.8%) |
| Cleaning & Maintenance | 273 (64.7%) | 149 (35.3%) |
| Personal Care & Service | 152 (27.8%) | 394 (72.2%) |
| Total (Category) | 1,339 (37.1%) | 2,273 (62.9%) |
| Total (Overall) | 15,737 (54.6%) | 13,065 (45.4%) |
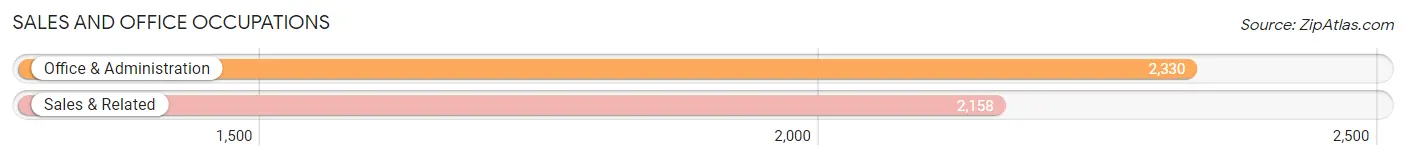
Sales and Office Occupations
The most common Sales and Office occupations in Richland are Office & Administration (2,330 | 8.1%), and Sales & Related (2,158 | 7.5%).
Sales and Office Occupations by Sex
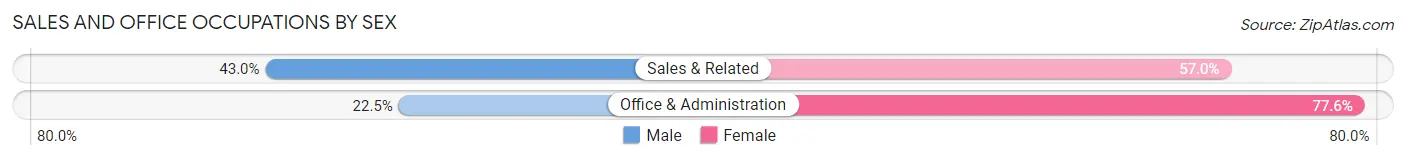
| Occupation | Male | Female |
| Sales & Related | 927 (43.0%) | 1,231 (57.0%) |
| Office & Administration | 523 (22.5%) | 1,807 (77.5%) |
| Total (Category) | 1,450 (32.3%) | 3,038 (67.7%) |
| Total (Overall) | 15,737 (54.6%) | 13,065 (45.4%) |
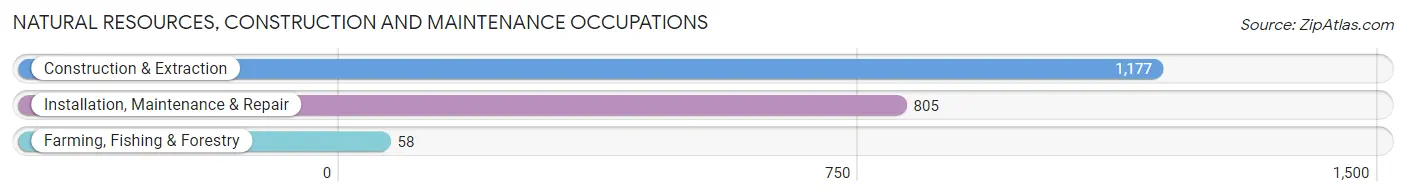
Natural Resources, Construction and Maintenance Occupations
The most common Natural Resources, Construction and Maintenance occupations in Richland are Construction & Extraction (1,177 | 4.1%), Installation, Maintenance & Repair (805 | 2.8%), and Farming, Fishing & Forestry (58 | 0.2%).
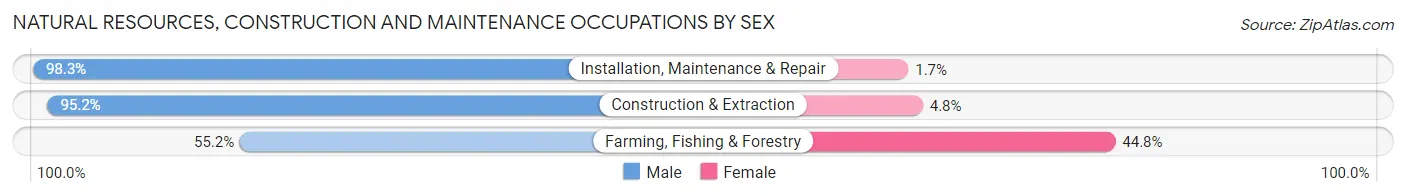
Natural Resources, Construction and Maintenance Occupations by Sex
| Occupation | Male | Female |
| Farming, Fishing & Forestry | 32 (55.2%) | 26 (44.8%) |
| Construction & Extraction | 1,121 (95.2%) | 56 (4.8%) |
| Installation, Maintenance & Repair | 791 (98.3%) | 14 (1.7%) |
| Total (Category) | 1,944 (95.3%) | 96 (4.7%) |
| Total (Overall) | 15,737 (54.6%) | 13,065 (45.4%) |
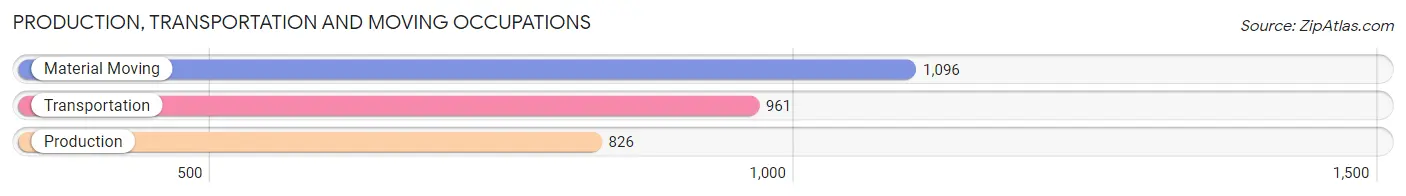
Production, Transportation and Moving Occupations
The most common Production, Transportation and Moving occupations in Richland are Material Moving (1,096 | 3.8%), Transportation (961 | 3.3%), and Production (826 | 2.9%).
Production, Transportation and Moving Occupations by Sex
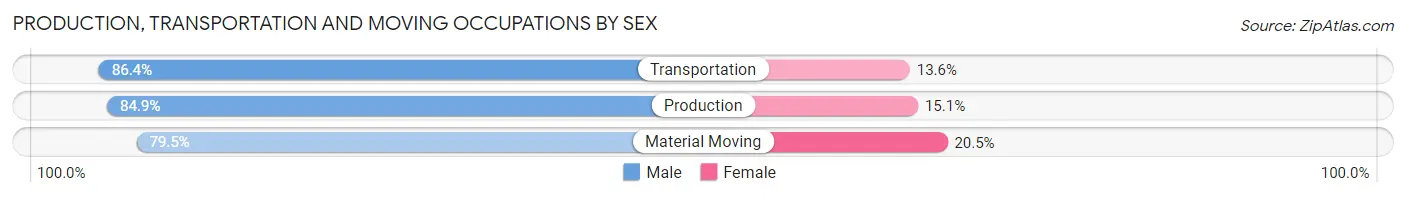
| Occupation | Male | Female |
| Production | 701 (84.9%) | 125 (15.1%) |
| Transportation | 830 (86.4%) | 131 (13.6%) |
| Material Moving | 871 (79.5%) | 225 (20.5%) |
| Total (Category) | 2,402 (83.3%) | 481 (16.7%) |
| Total (Overall) | 15,737 (54.6%) | 13,065 (45.4%) |
Employment Industries by Sex in Richland
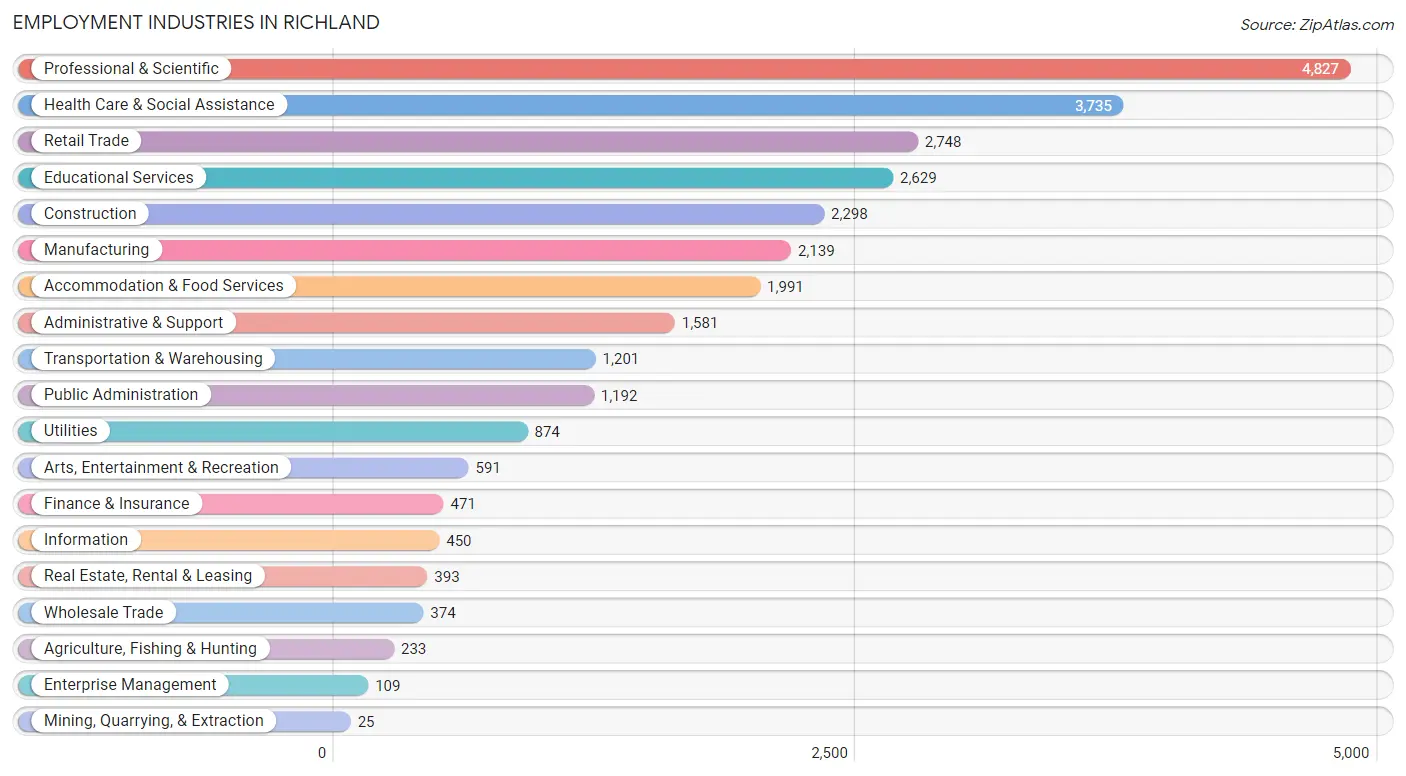
Employment Industries in Richland
The major employment industries in Richland include Professional & Scientific (4,827 | 16.8%), Health Care & Social Assistance (3,735 | 13.0%), Retail Trade (2,748 | 9.5%), Educational Services (2,629 | 9.1%), and Construction (2,298 | 8.0%).
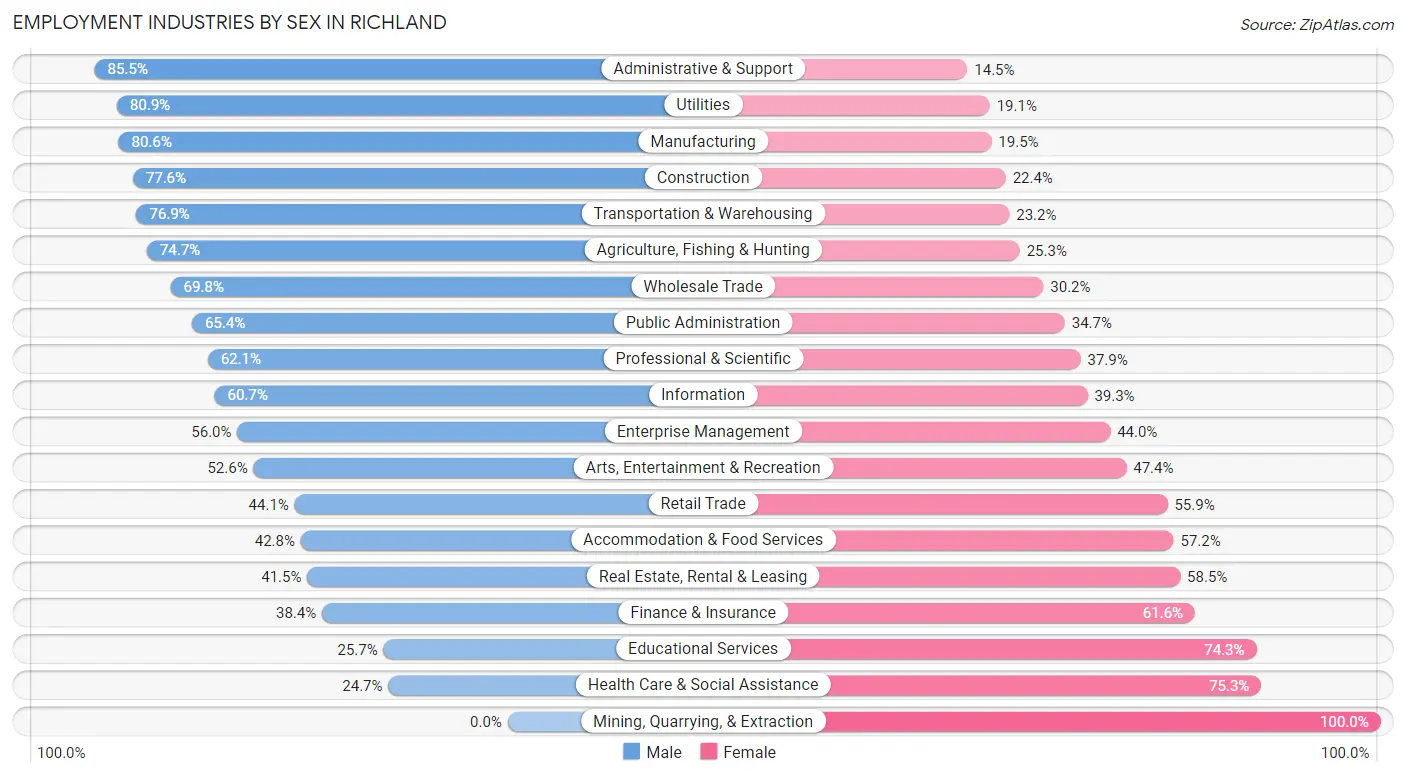
Employment Industries by Sex in Richland
The Richland industries that see more men than women are Administrative & Support (85.5%), Utilities (80.9%), and Manufacturing (80.5%), whereas the industries that tend to have a higher number of women are Mining, Quarrying, & Extraction (100.0%), Health Care & Social Assistance (75.3%), and Educational Services (74.3%).
| Industry | Male | Female |
| Agriculture, Fishing & Hunting | 174 (74.7%) | 59 (25.3%) |
| Mining, Quarrying, & Extraction | 0 (0.0%) | 25 (100.0%) |
| Construction | 1,783 (77.6%) | 515 (22.4%) |
| Manufacturing | 1,723 (80.5%) | 416 (19.5%) |
| Wholesale Trade | 261 (69.8%) | 113 (30.2%) |
| Retail Trade | 1,212 (44.1%) | 1,536 (55.9%) |
| Transportation & Warehousing | 923 (76.8%) | 278 (23.2%) |
| Utilities | 707 (80.9%) | 167 (19.1%) |
| Information | 273 (60.7%) | 177 (39.3%) |
| Finance & Insurance | 181 (38.4%) | 290 (61.6%) |
| Real Estate, Rental & Leasing | 163 (41.5%) | 230 (58.5%) |
| Professional & Scientific | 2,997 (62.1%) | 1,830 (37.9%) |
| Enterprise Management | 61 (56.0%) | 48 (44.0%) |
| Administrative & Support | 1,352 (85.5%) | 229 (14.5%) |
| Educational Services | 676 (25.7%) | 1,953 (74.3%) |
| Health Care & Social Assistance | 923 (24.7%) | 2,812 (75.3%) |
| Arts, Entertainment & Recreation | 311 (52.6%) | 280 (47.4%) |
| Accommodation & Food Services | 853 (42.8%) | 1,138 (57.2%) |
| Public Administration | 779 (65.3%) | 413 (34.6%) |
| Total | 15,737 (54.6%) | 13,065 (45.4%) |
Education in Richland
School Enrollment in Richland
The most common levels of schooling among the 15,273 students in Richland are high school (3,582 | 23.4%), middle school (3,449 | 22.6%), and elementary school (3,308 | 21.7%).
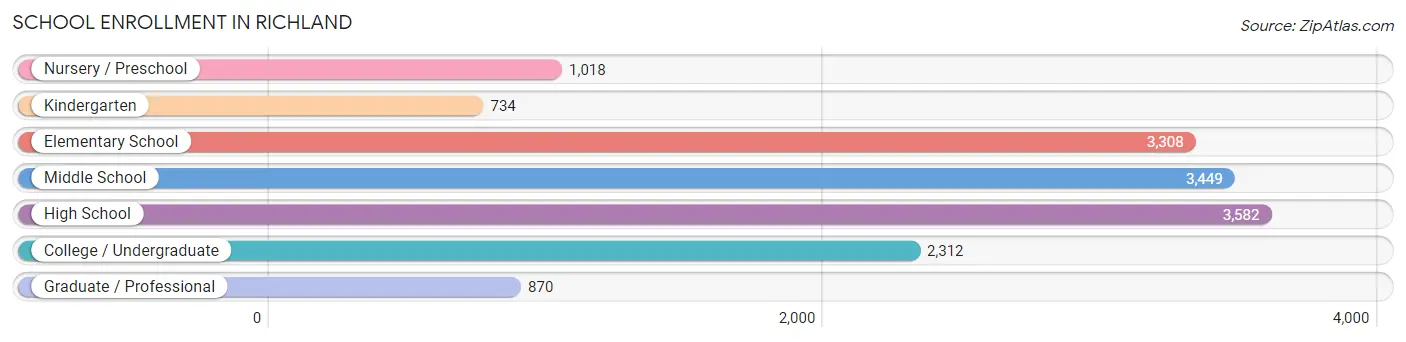
| School Level | # Students | % Students |
| Nursery / Preschool | 1,018 | 6.7% |
| Kindergarten | 734 | 4.8% |
| Elementary School | 3,308 | 21.7% |
| Middle School | 3,449 | 22.6% |
| High School | 3,582 | 23.4% |
| College / Undergraduate | 2,312 | 15.1% |
| Graduate / Professional | 870 | 5.7% |
| Total | 15,273 | 100.0% |
School Enrollment by Age by Funding Source in Richland
Out of a total of 15,273 students who are enrolled in schools in Richland, 2,077 (13.6%) attend a private institution, while the remaining 13,196 (86.4%) are enrolled in public schools. The age group of 3 to 4 year olds has the highest likelihood of being enrolled in private schools, with 347 (51.0% in the age bracket) enrolled. Conversely, the age group of 15 to 17 year olds has the lowest likelihood of being enrolled in a private school, with 2,417 (97.6% in the age bracket) attending a public institution.
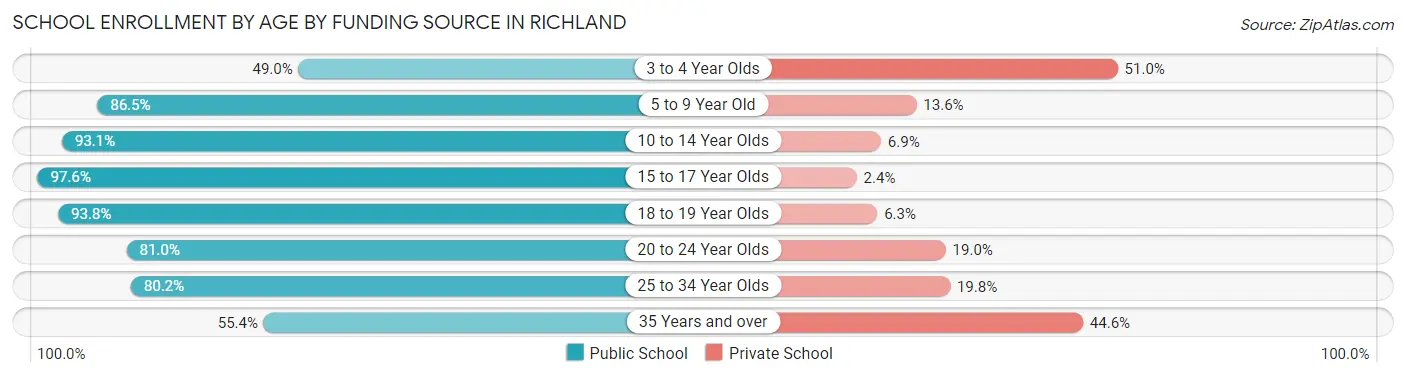
| Age Bracket | Public School | Private School |
| 3 to 4 Year Olds | 333 (49.0%) | 347 (51.0%) |
| 5 to 9 Year Old | 3,540 (86.5%) | 555 (13.6%) |
| 10 to 14 Year Olds | 3,859 (93.1%) | 288 (6.9%) |
| 15 to 17 Year Olds | 2,417 (97.6%) | 60 (2.4%) |
| 18 to 19 Year Olds | 855 (93.8%) | 57 (6.2%) |
| 20 to 24 Year Olds | 938 (81.0%) | 220 (19.0%) |
| 25 to 34 Year Olds | 806 (80.2%) | 199 (19.8%) |
| 35 Years and over | 443 (55.4%) | 356 (44.6%) |
| Total | 13,196 (86.4%) | 2,077 (13.6%) |
Educational Attainment by Field of Study in Richland
Engineering (3,148 | 15.5%), business (3,018 | 14.9%), education (1,942 | 9.6%), physical & health sciences (1,826 | 9.0%), and science & technology (1,719 | 8.5%) are the most common fields of study among 20,275 individuals in Richland who have obtained a bachelor's degree or higher.
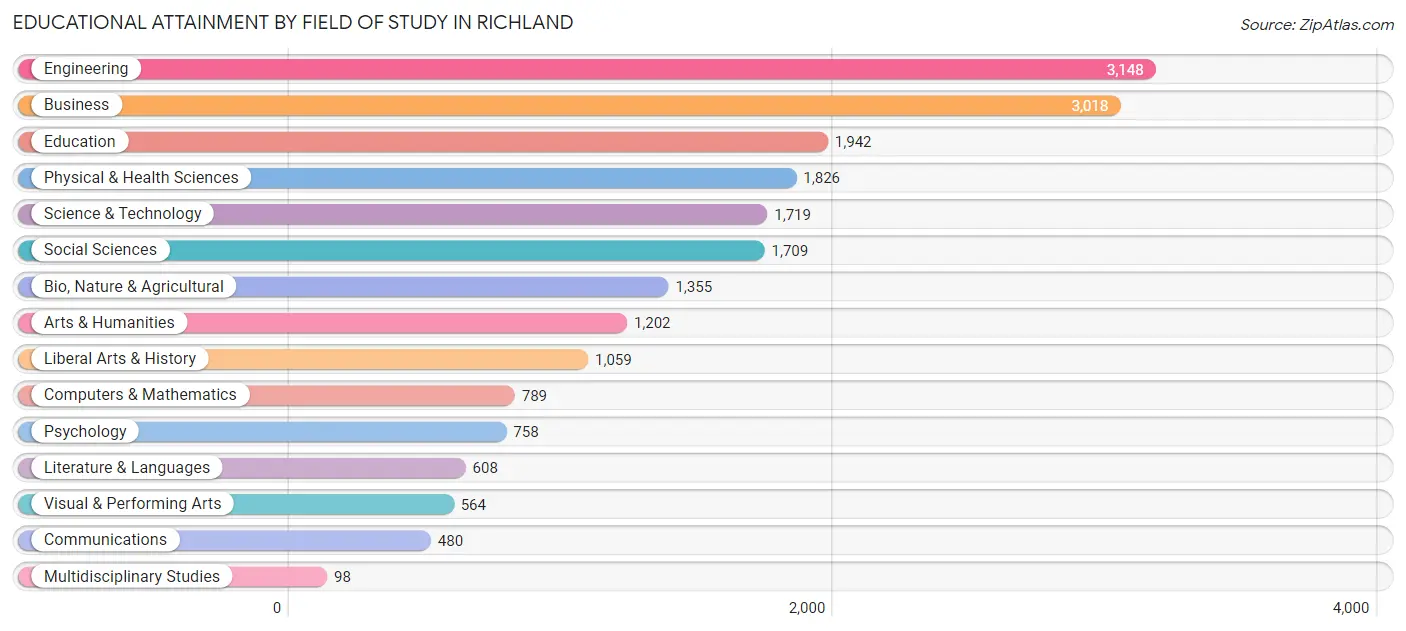
| Field of Study | # Graduates | % Graduates |
| Computers & Mathematics | 789 | 3.9% |
| Bio, Nature & Agricultural | 1,355 | 6.7% |
| Physical & Health Sciences | 1,826 | 9.0% |
| Psychology | 758 | 3.7% |
| Social Sciences | 1,709 | 8.4% |
| Engineering | 3,148 | 15.5% |
| Multidisciplinary Studies | 98 | 0.5% |
| Science & Technology | 1,719 | 8.5% |
| Business | 3,018 | 14.9% |
| Education | 1,942 | 9.6% |
| Literature & Languages | 608 | 3.0% |
| Liberal Arts & History | 1,059 | 5.2% |
| Visual & Performing Arts | 564 | 2.8% |
| Communications | 480 | 2.4% |
| Arts & Humanities | 1,202 | 5.9% |
| Total | 20,275 | 100.0% |
Transportation & Commute in Richland
Vehicle Availability by Sex in Richland
The most prevalent vehicle ownership categories in Richland are males with 2 vehicles (6,496, accounting for 41.6%) and females with 2 vehicles (5,217, making up 50.6%).
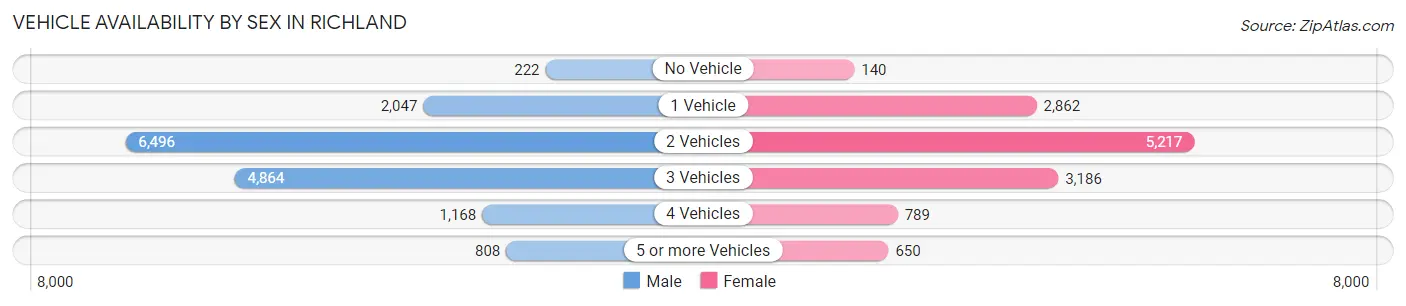
| Vehicles Available | Male | Female |
| No Vehicle | 222 (1.4%) | 140 (1.1%) |
| 1 Vehicle | 2,047 (13.1%) | 2,862 (22.3%) |
| 2 Vehicles | 6,496 (41.6%) | 5,217 (40.6%) |
| 3 Vehicles | 4,864 (31.2%) | 3,186 (24.8%) |
| 4 Vehicles | 1,168 (7.5%) | 789 (6.1%) |
| 5 or more Vehicles | 808 (5.2%) | 650 (5.1%) |
| Total | 15,605 (100.0%) | 12,844 (100.0%) |
Commute Time in Richland
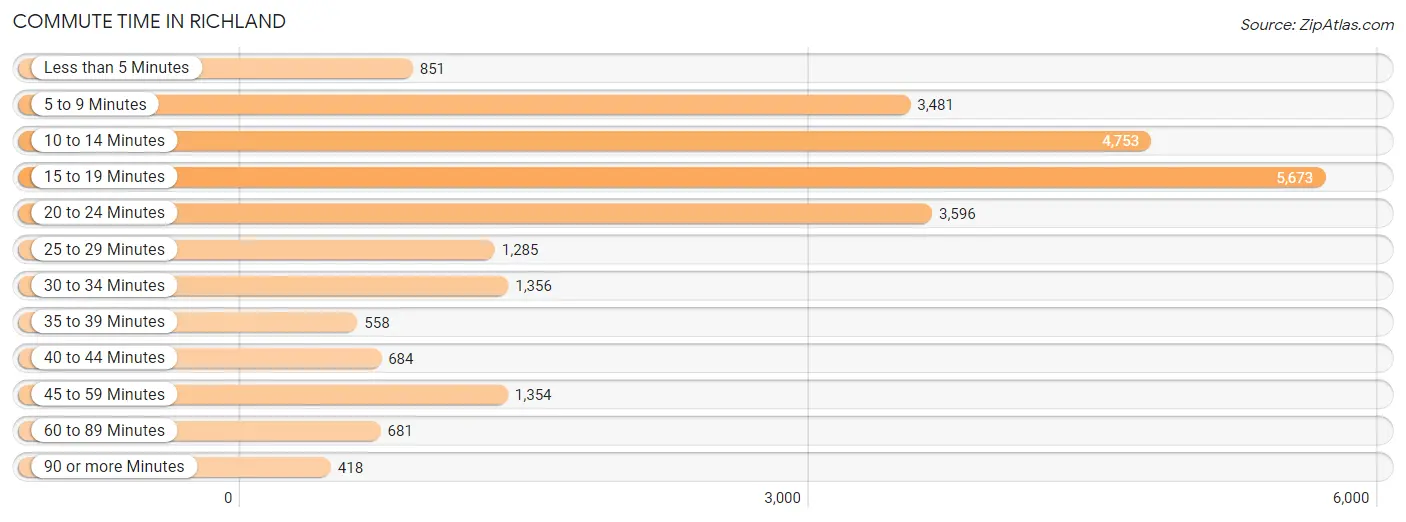
The most frequently occuring commute durations in Richland are 15 to 19 minutes (5,673 commuters, 23.0%), 10 to 14 minutes (4,753 commuters, 19.3%), and 20 to 24 minutes (3,596 commuters, 14.6%).
| Commute Time | # Commuters | % Commuters |
| Less than 5 Minutes | 851 | 3.5% |
| 5 to 9 Minutes | 3,481 | 14.1% |
| 10 to 14 Minutes | 4,753 | 19.3% |
| 15 to 19 Minutes | 5,673 | 23.0% |
| 20 to 24 Minutes | 3,596 | 14.6% |
| 25 to 29 Minutes | 1,285 | 5.2% |
| 30 to 34 Minutes | 1,356 | 5.5% |
| 35 to 39 Minutes | 558 | 2.3% |
| 40 to 44 Minutes | 684 | 2.8% |
| 45 to 59 Minutes | 1,354 | 5.5% |
| 60 to 89 Minutes | 681 | 2.8% |
| 90 or more Minutes | 418 | 1.7% |
Commute Time by Sex in Richland
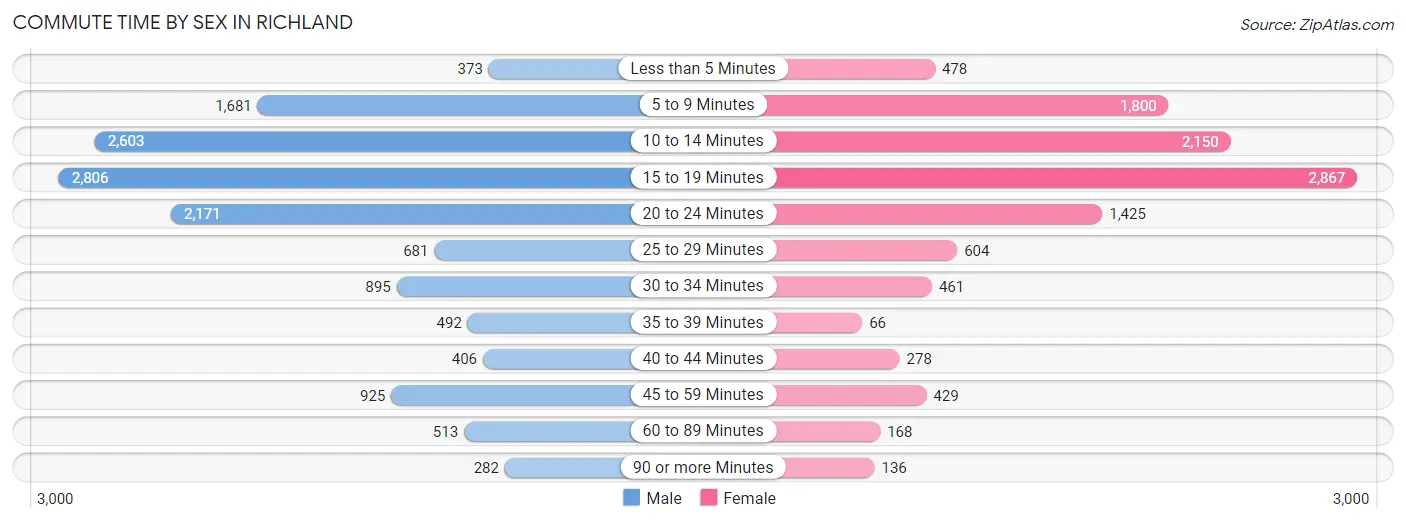
The most common commute times in Richland are 15 to 19 minutes (2,806 commuters, 20.3%) for males and 15 to 19 minutes (2,867 commuters, 26.4%) for females.
| Commute Time | Male | Female |
| Less than 5 Minutes | 373 (2.7%) | 478 (4.4%) |
| 5 to 9 Minutes | 1,681 (12.2%) | 1,800 (16.6%) |
| 10 to 14 Minutes | 2,603 (18.8%) | 2,150 (19.8%) |
| 15 to 19 Minutes | 2,806 (20.3%) | 2,867 (26.4%) |
| 20 to 24 Minutes | 2,171 (15.7%) | 1,425 (13.1%) |
| 25 to 29 Minutes | 681 (4.9%) | 604 (5.6%) |
| 30 to 34 Minutes | 895 (6.5%) | 461 (4.2%) |
| 35 to 39 Minutes | 492 (3.6%) | 66 (0.6%) |
| 40 to 44 Minutes | 406 (2.9%) | 278 (2.6%) |
| 45 to 59 Minutes | 925 (6.7%) | 429 (4.0%) |
| 60 to 89 Minutes | 513 (3.7%) | 168 (1.5%) |
| 90 or more Minutes | 282 (2.0%) | 136 (1.3%) |
Time of Departure to Work by Sex in Richland
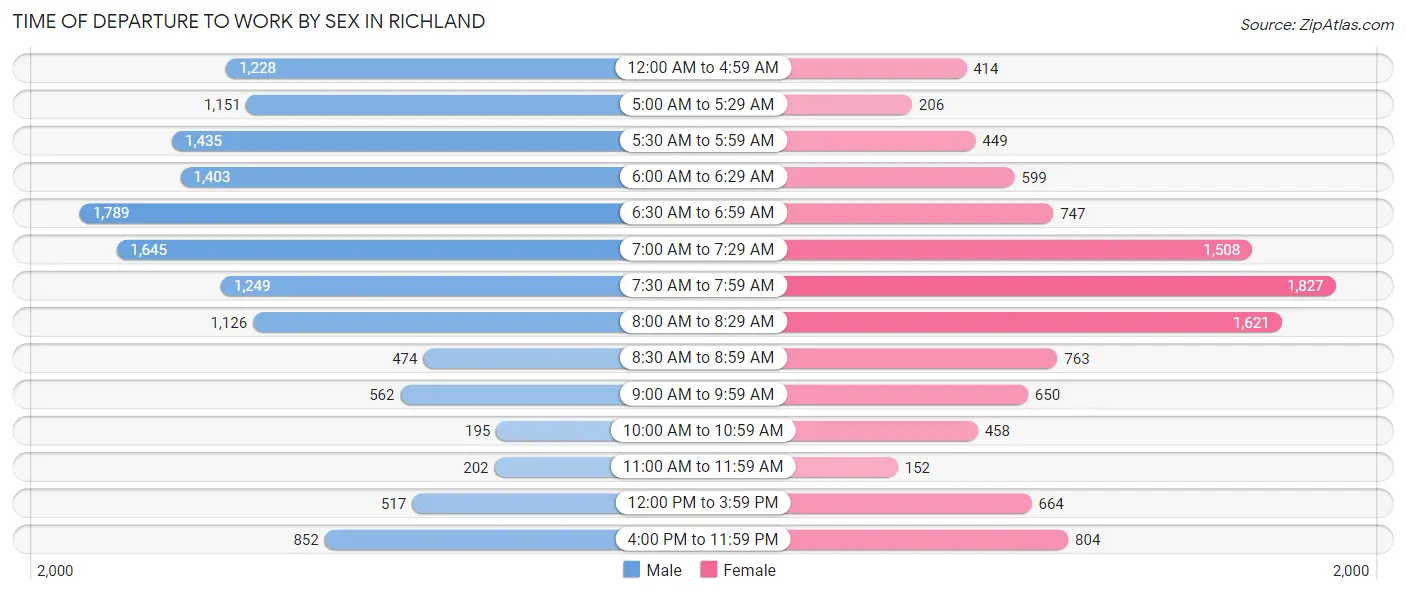
The most frequent times of departure to work in Richland are 6:30 AM to 6:59 AM (1,789, 12.9%) for males and 7:30 AM to 7:59 AM (1,827, 16.8%) for females.
| Time of Departure | Male | Female |
| 12:00 AM to 4:59 AM | 1,228 (8.9%) | 414 (3.8%) |
| 5:00 AM to 5:29 AM | 1,151 (8.3%) | 206 (1.9%) |
| 5:30 AM to 5:59 AM | 1,435 (10.4%) | 449 (4.1%) |
| 6:00 AM to 6:29 AM | 1,403 (10.2%) | 599 (5.5%) |
| 6:30 AM to 6:59 AM | 1,789 (12.9%) | 747 (6.9%) |
| 7:00 AM to 7:29 AM | 1,645 (11.9%) | 1,508 (13.9%) |
| 7:30 AM to 7:59 AM | 1,249 (9.0%) | 1,827 (16.8%) |
| 8:00 AM to 8:29 AM | 1,126 (8.1%) | 1,621 (14.9%) |
| 8:30 AM to 8:59 AM | 474 (3.4%) | 763 (7.0%) |
| 9:00 AM to 9:59 AM | 562 (4.1%) | 650 (6.0%) |
| 10:00 AM to 10:59 AM | 195 (1.4%) | 458 (4.2%) |
| 11:00 AM to 11:59 AM | 202 (1.5%) | 152 (1.4%) |
| 12:00 PM to 3:59 PM | 517 (3.7%) | 664 (6.1%) |
| 4:00 PM to 11:59 PM | 852 (6.2%) | 804 (7.4%) |
| Total | 13,828 (100.0%) | 10,862 (100.0%) |
Housing Occupancy in Richland
Occupancy by Ownership in Richland
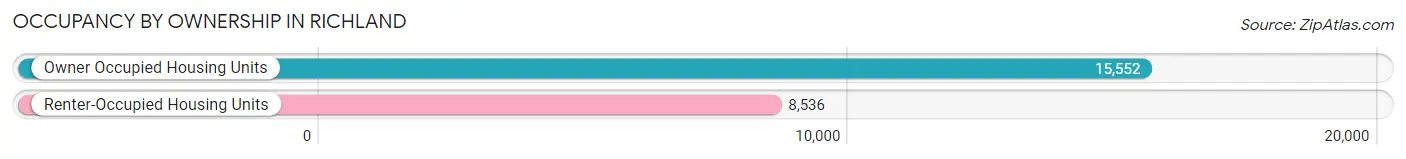
Of the total 24,088 dwellings in Richland, owner-occupied units account for 15,552 (64.6%), while renter-occupied units make up 8,536 (35.4%).
| Occupancy | # Housing Units | % Housing Units |
| Owner Occupied Housing Units | 15,552 | 64.6% |
| Renter-Occupied Housing Units | 8,536 | 35.4% |
| Total Occupied Housing Units | 24,088 | 100.0% |
Occupancy by Household Size in Richland
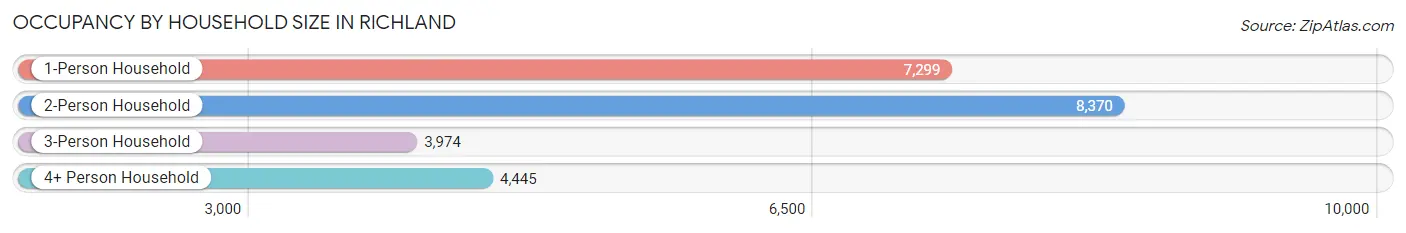
| Household Size | # Housing Units | % Housing Units |
| 1-Person Household | 7,299 | 30.3% |
| 2-Person Household | 8,370 | 34.7% |
| 3-Person Household | 3,974 | 16.5% |
| 4+ Person Household | 4,445 | 18.4% |
| Total Housing Units | 24,088 | 100.0% |
Occupancy by Ownership by Household Size in Richland
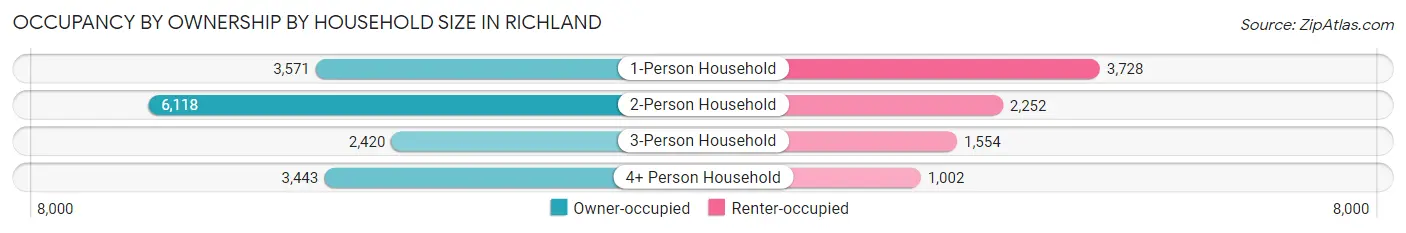
| Household Size | Owner-occupied | Renter-occupied |
| 1-Person Household | 3,571 (48.9%) | 3,728 (51.1%) |
| 2-Person Household | 6,118 (73.1%) | 2,252 (26.9%) |
| 3-Person Household | 2,420 (60.9%) | 1,554 (39.1%) |
| 4+ Person Household | 3,443 (77.5%) | 1,002 (22.5%) |
| Total Housing Units | 15,552 (64.6%) | 8,536 (35.4%) |
Occupancy by Educational Attainment in Richland
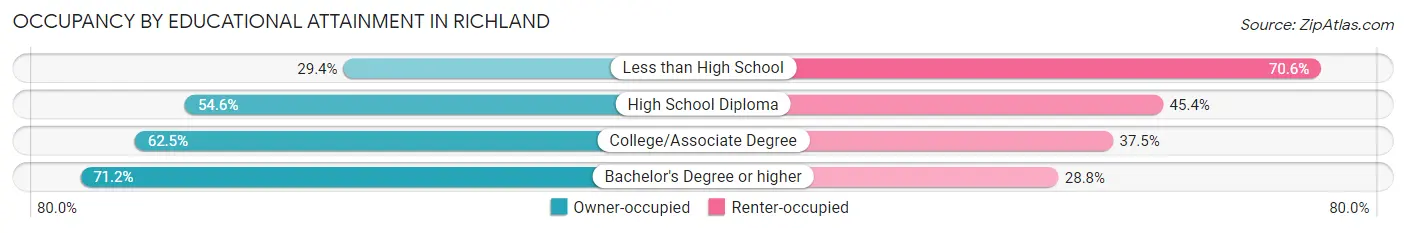
| Household Size | Owner-occupied | Renter-occupied |
| Less than High School | 214 (29.4%) | 513 (70.6%) |
| High School Diploma | 1,902 (54.6%) | 1,584 (45.4%) |
| College/Associate Degree | 5,131 (62.5%) | 3,077 (37.5%) |
| Bachelor's Degree or higher | 8,305 (71.2%) | 3,362 (28.8%) |
Occupancy by Age of Householder in Richland
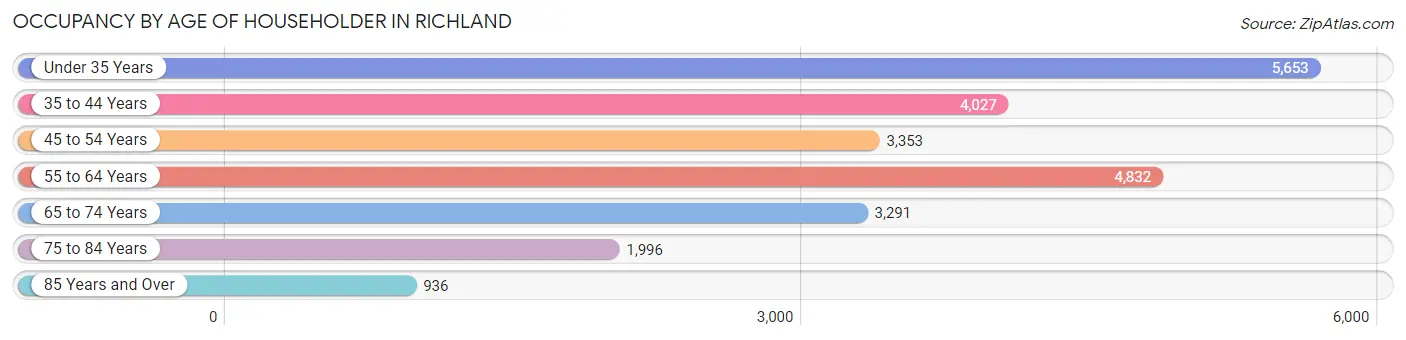
| Age Bracket | # Households | % Households |
| Under 35 Years | 5,653 | 23.5% |
| 35 to 44 Years | 4,027 | 16.7% |
| 45 to 54 Years | 3,353 | 13.9% |
| 55 to 64 Years | 4,832 | 20.1% |
| 65 to 74 Years | 3,291 | 13.7% |
| 75 to 84 Years | 1,996 | 8.3% |
| 85 Years and Over | 936 | 3.9% |
| Total | 24,088 | 100.0% |
Housing Finances in Richland
Median Income by Occupancy in Richland
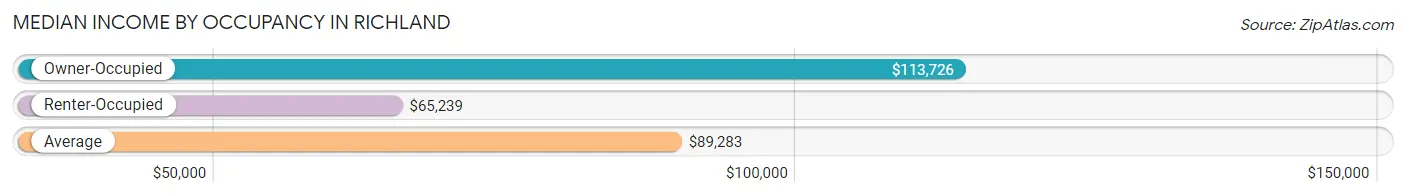
| Occupancy Type | # Households | Median Income |
| Owner-Occupied | 15,552 (64.6%) | $113,726 |
| Renter-Occupied | 8,536 (35.4%) | $65,239 |
| Average | 24,088 (100.0%) | $89,283 |
Occupancy by Householder Income Bracket in Richland
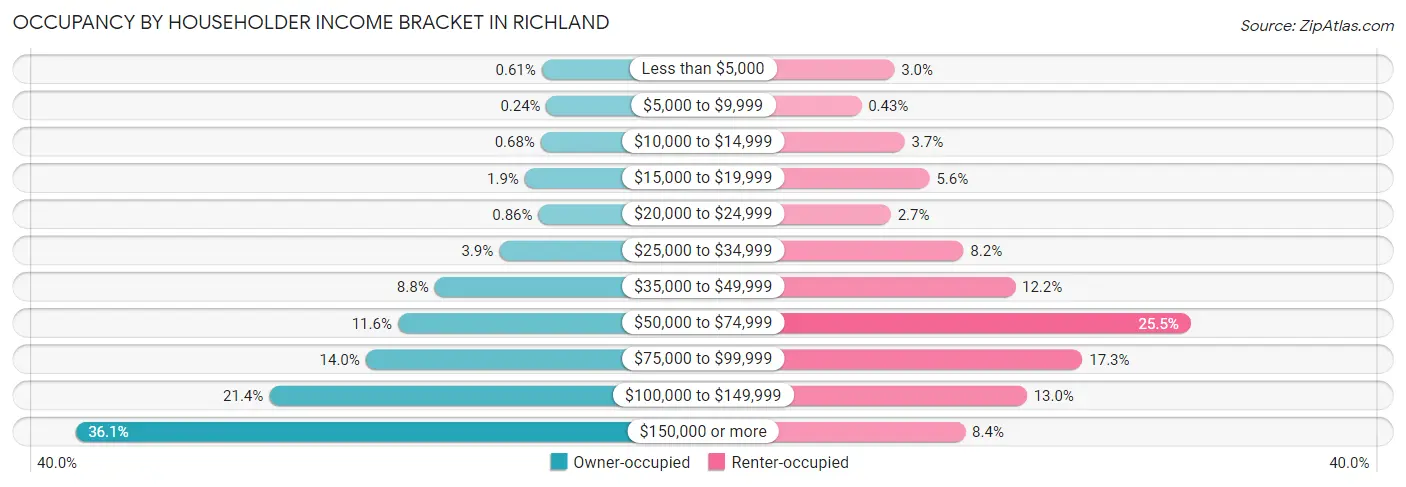
| Income Bracket | Owner-occupied | Renter-occupied |
| Less than $5,000 | 95 (0.6%) | 252 (2.9%) |
| $5,000 to $9,999 | 37 (0.2%) | 37 (0.4%) |
| $10,000 to $14,999 | 106 (0.7%) | 318 (3.7%) |
| $15,000 to $19,999 | 295 (1.9%) | 481 (5.6%) |
| $20,000 to $24,999 | 133 (0.9%) | 229 (2.7%) |
| $25,000 to $34,999 | 598 (3.8%) | 702 (8.2%) |
| $35,000 to $49,999 | 1,364 (8.8%) | 1,037 (12.1%) |
| $50,000 to $74,999 | 1,800 (11.6%) | 2,179 (25.5%) |
| $75,000 to $99,999 | 2,180 (14.0%) | 1,475 (17.3%) |
| $100,000 to $149,999 | 3,323 (21.4%) | 1,113 (13.0%) |
| $150,000 or more | 5,621 (36.1%) | 713 (8.4%) |
| Total | 15,552 (100.0%) | 8,536 (100.0%) |
Monthly Housing Cost Tiers in Richland
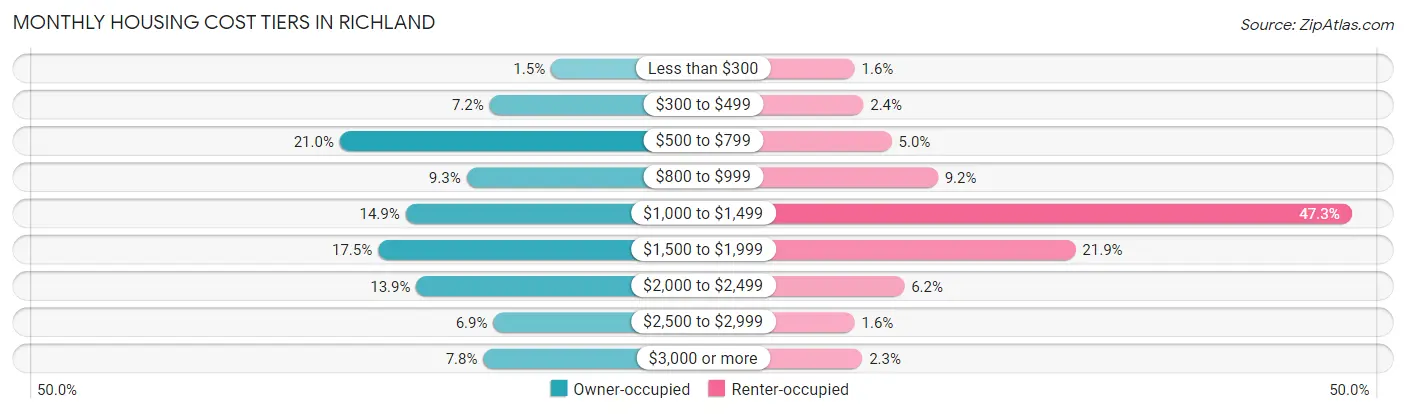
| Monthly Cost | Owner-occupied | Renter-occupied |
| Less than $300 | 240 (1.5%) | 135 (1.6%) |
| $300 to $499 | 1,120 (7.2%) | 203 (2.4%) |
| $500 to $799 | 3,265 (21.0%) | 426 (5.0%) |
| $800 to $999 | 1,449 (9.3%) | 788 (9.2%) |
| $1,000 to $1,499 | 2,322 (14.9%) | 4,039 (47.3%) |
| $1,500 to $1,999 | 2,715 (17.5%) | 1,870 (21.9%) |
| $2,000 to $2,499 | 2,168 (13.9%) | 525 (6.1%) |
| $2,500 to $2,999 | 1,065 (6.9%) | 135 (1.6%) |
| $3,000 or more | 1,208 (7.8%) | 195 (2.3%) |
| Total | 15,552 (100.0%) | 8,536 (100.0%) |
Physical Housing Characteristics in Richland
Housing Structures in Richland
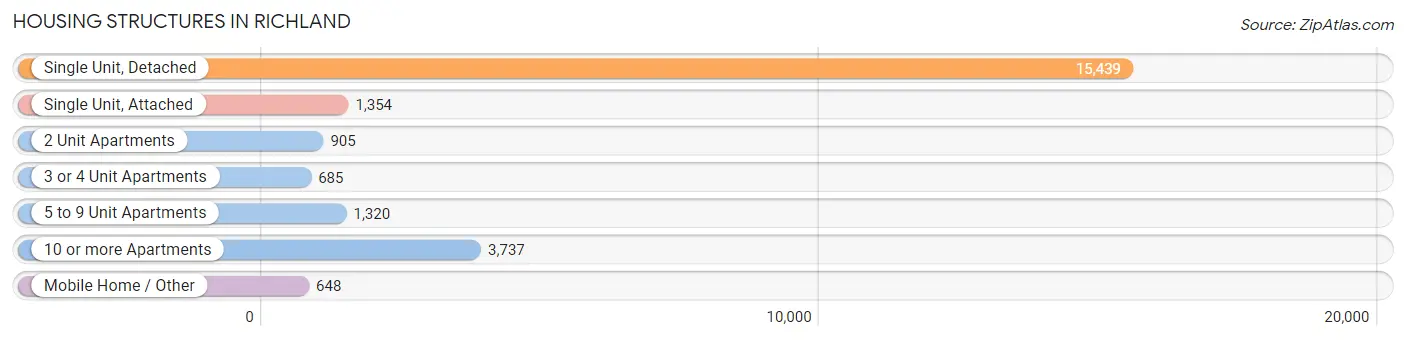
| Structure Type | # Housing Units | % Housing Units |
| Single Unit, Detached | 15,439 | 64.1% |
| Single Unit, Attached | 1,354 | 5.6% |
| 2 Unit Apartments | 905 | 3.8% |
| 3 or 4 Unit Apartments | 685 | 2.8% |
| 5 to 9 Unit Apartments | 1,320 | 5.5% |
| 10 or more Apartments | 3,737 | 15.5% |
| Mobile Home / Other | 648 | 2.7% |
| Total | 24,088 | 100.0% |
Housing Structures by Occupancy in Richland
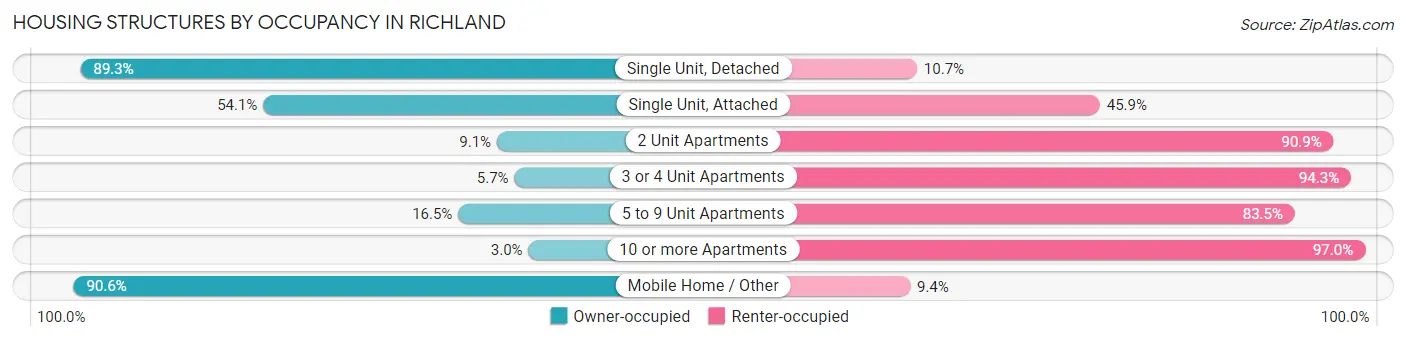
| Structure Type | Owner-occupied | Renter-occupied |
| Single Unit, Detached | 13,782 (89.3%) | 1,657 (10.7%) |
| Single Unit, Attached | 732 (54.1%) | 622 (45.9%) |
| 2 Unit Apartments | 82 (9.1%) | 823 (90.9%) |
| 3 or 4 Unit Apartments | 39 (5.7%) | 646 (94.3%) |
| 5 to 9 Unit Apartments | 218 (16.5%) | 1,102 (83.5%) |
| 10 or more Apartments | 112 (3.0%) | 3,625 (97.0%) |
| Mobile Home / Other | 587 (90.6%) | 61 (9.4%) |
| Total | 15,552 (64.6%) | 8,536 (35.4%) |
Housing Structures by Number of Rooms in Richland
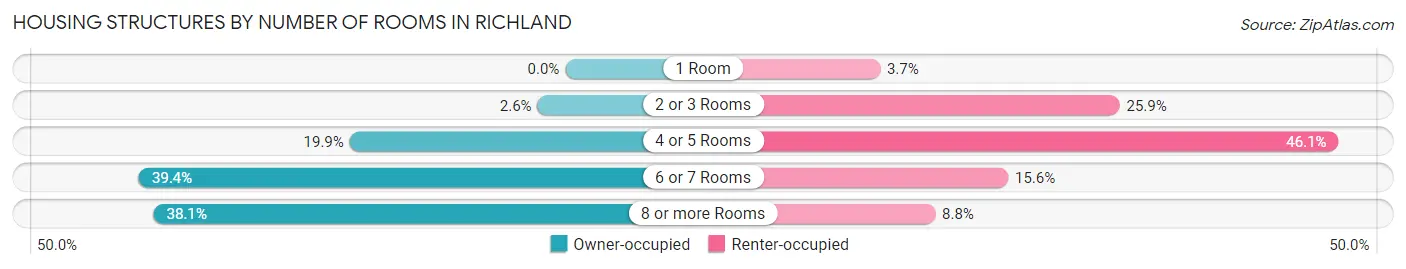
| Number of Rooms | Owner-occupied | Renter-occupied |
| 1 Room | 0 (0.0%) | 316 (3.7%) |
| 2 or 3 Rooms | 399 (2.6%) | 2,207 (25.9%) |
| 4 or 5 Rooms | 3,101 (19.9%) | 3,935 (46.1%) |
| 6 or 7 Rooms | 6,132 (39.4%) | 1,327 (15.5%) |
| 8 or more Rooms | 5,920 (38.1%) | 751 (8.8%) |
| Total | 15,552 (100.0%) | 8,536 (100.0%) |
Housing Structure by Heating Type in Richland
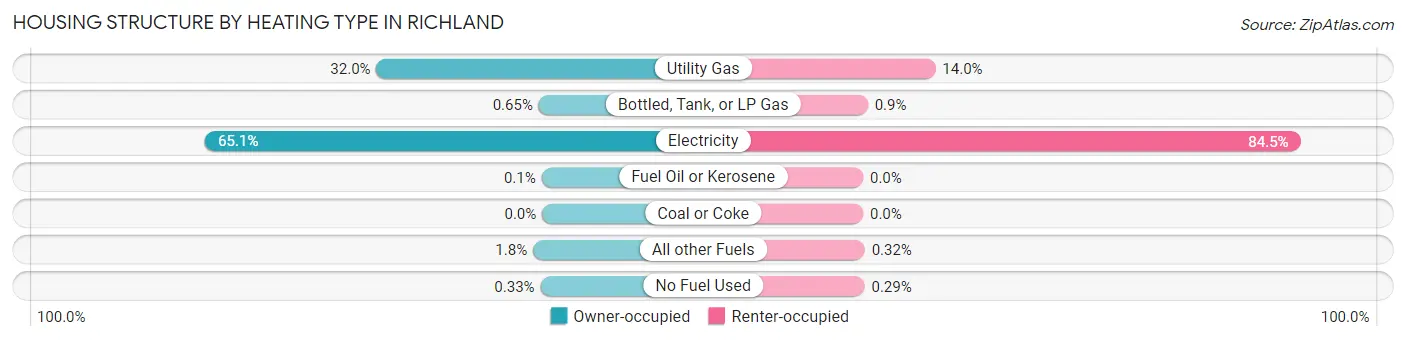
| Heating Type | Owner-occupied | Renter-occupied |
| Utility Gas | 4,980 (32.0%) | 1,193 (14.0%) |
| Bottled, Tank, or LP Gas | 101 (0.6%) | 77 (0.9%) |
| Electricity | 10,130 (65.1%) | 7,214 (84.5%) |
| Fuel Oil or Kerosene | 16 (0.1%) | 0 (0.0%) |
| Coal or Coke | 0 (0.0%) | 0 (0.0%) |
| All other Fuels | 274 (1.8%) | 27 (0.3%) |
| No Fuel Used | 51 (0.3%) | 25 (0.3%) |
| Total | 15,552 (100.0%) | 8,536 (100.0%) |
Household Vehicle Usage in Richland
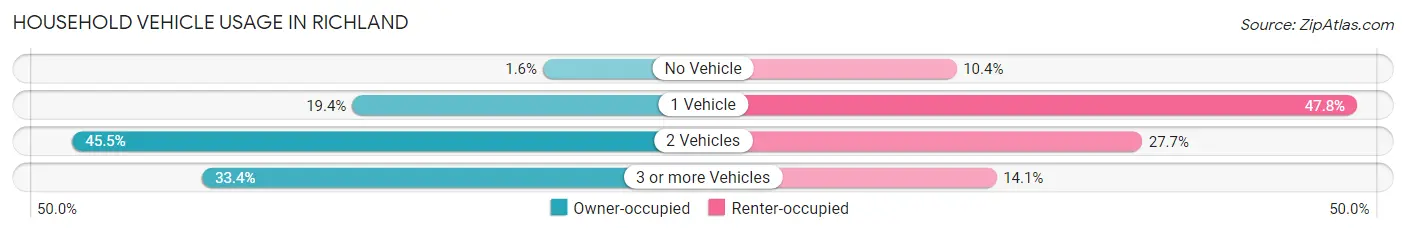
| Vehicles per Household | Owner-occupied | Renter-occupied |
| No Vehicle | 252 (1.6%) | 887 (10.4%) |
| 1 Vehicle | 3,020 (19.4%) | 4,079 (47.8%) |
| 2 Vehicles | 7,083 (45.5%) | 2,365 (27.7%) |
| 3 or more Vehicles | 5,197 (33.4%) | 1,205 (14.1%) |
| Total | 15,552 (100.0%) | 8,536 (100.0%) |
Real Estate & Mortgages in Richland
Real Estate and Mortgage Overview in Richland
| Characteristic | Without Mortgage | With Mortgage |
| Housing Units | 5,765 | 9,787 |
| Median Property Value | $343,300 | $377,200 |
| Median Household Income | $95,246 | $4,034 |
| Monthly Housing Costs | $641 | $1,205 |
| Real Estate Taxes | $3,178 | $165 |
Property Value by Mortgage Status in Richland
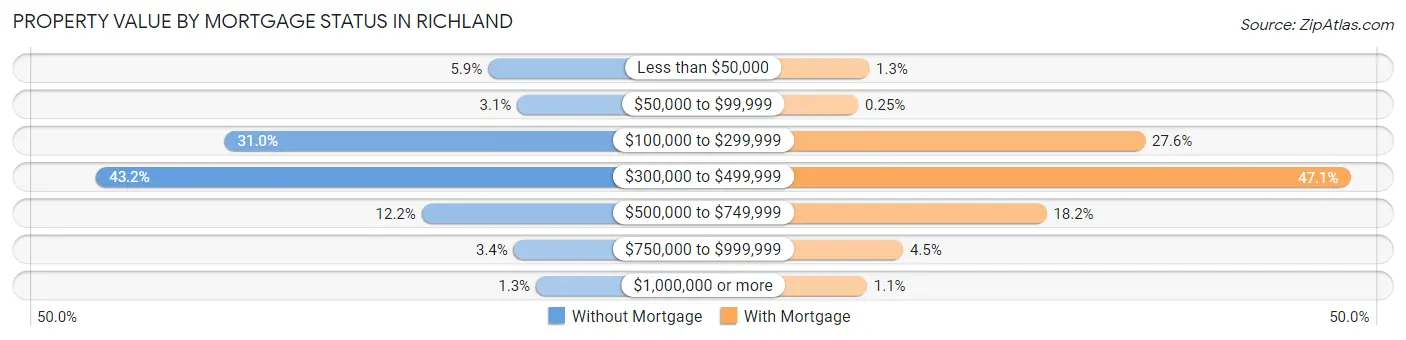
| Property Value | Without Mortgage | With Mortgage |
| Less than $50,000 | 338 (5.9%) | 126 (1.3%) |
| $50,000 to $99,999 | 178 (3.1%) | 24 (0.3%) |
| $100,000 to $299,999 | 1,784 (30.9%) | 2,698 (27.6%) |
| $300,000 to $499,999 | 2,489 (43.2%) | 4,612 (47.1%) |
| $500,000 to $749,999 | 703 (12.2%) | 1,779 (18.2%) |
| $750,000 to $999,999 | 198 (3.4%) | 442 (4.5%) |
| $1,000,000 or more | 75 (1.3%) | 106 (1.1%) |
| Total | 5,765 (100.0%) | 9,787 (100.0%) |
Household Income by Mortgage Status in Richland
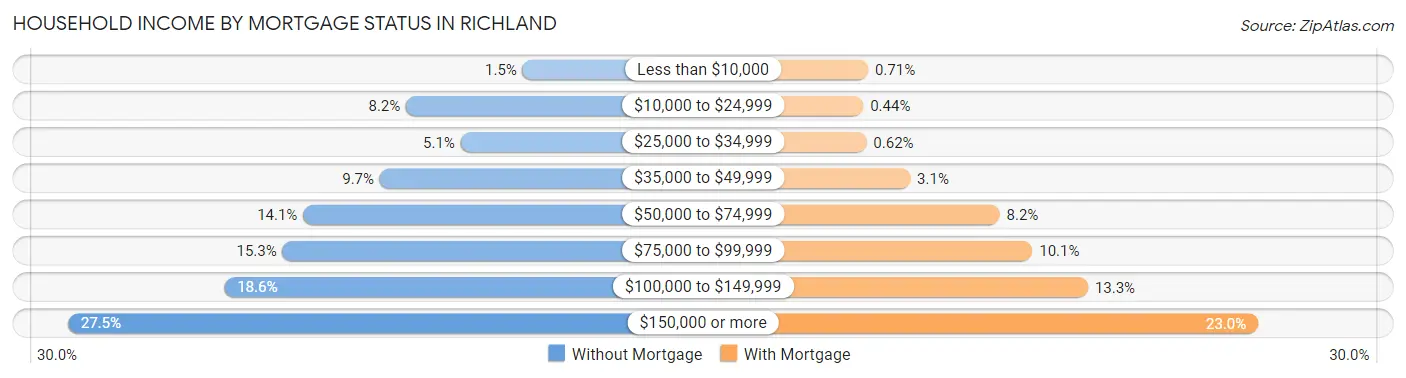
| Household Income | Without Mortgage | With Mortgage |
| Less than $10,000 | 89 (1.5%) | 69 (0.7%) |
| $10,000 to $24,999 | 473 (8.2%) | 43 (0.4%) |
| $25,000 to $34,999 | 293 (5.1%) | 61 (0.6%) |
| $35,000 to $49,999 | 559 (9.7%) | 305 (3.1%) |
| $50,000 to $74,999 | 812 (14.1%) | 805 (8.2%) |
| $75,000 to $99,999 | 880 (15.3%) | 988 (10.1%) |
| $100,000 to $149,999 | 1,072 (18.6%) | 1,300 (13.3%) |
| $150,000 or more | 1,587 (27.5%) | 2,251 (23.0%) |
| Total | 5,765 (100.0%) | 9,787 (100.0%) |
Property Value to Household Income Ratio in Richland
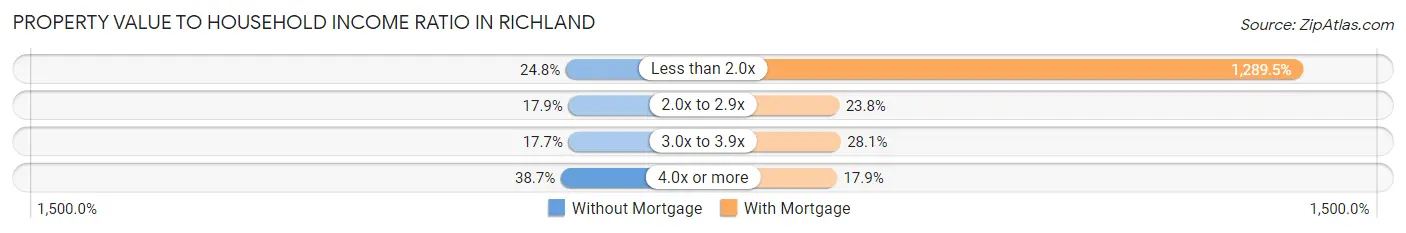
| Value-to-Income Ratio | Without Mortgage | With Mortgage |
| Less than 2.0x | 1,430 (24.8%) | 126,200 (1,289.5%) |
| 2.0x to 2.9x | 1,034 (17.9%) | 2,333 (23.8%) |
| 3.0x to 3.9x | 1,021 (17.7%) | 2,754 (28.1%) |
| 4.0x or more | 2,229 (38.7%) | 1,749 (17.9%) |
| Total | 5,765 (100.0%) | 9,787 (100.0%) |
Real Estate Taxes by Mortgage Status in Richland
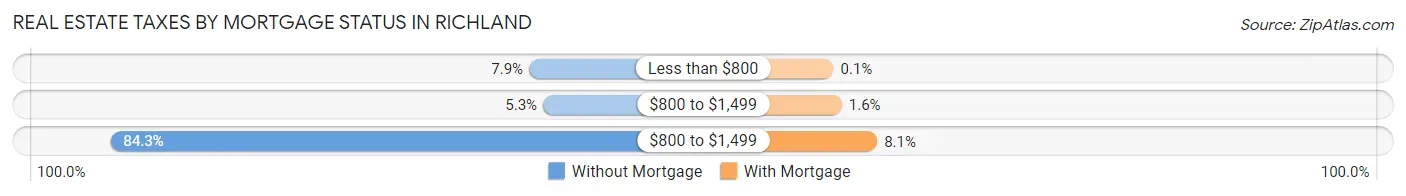
| Property Taxes | Without Mortgage | With Mortgage |
| Less than $800 | 454 (7.9%) | 10 (0.1%) |
| $800 to $1,499 | 307 (5.3%) | 158 (1.6%) |
| $800 to $1,499 | 4,861 (84.3%) | 790 (8.1%) |
| Total | 5,765 (100.0%) | 9,787 (100.0%) |
Health & Disability in Richland
Health Insurance Coverage by Age in Richland
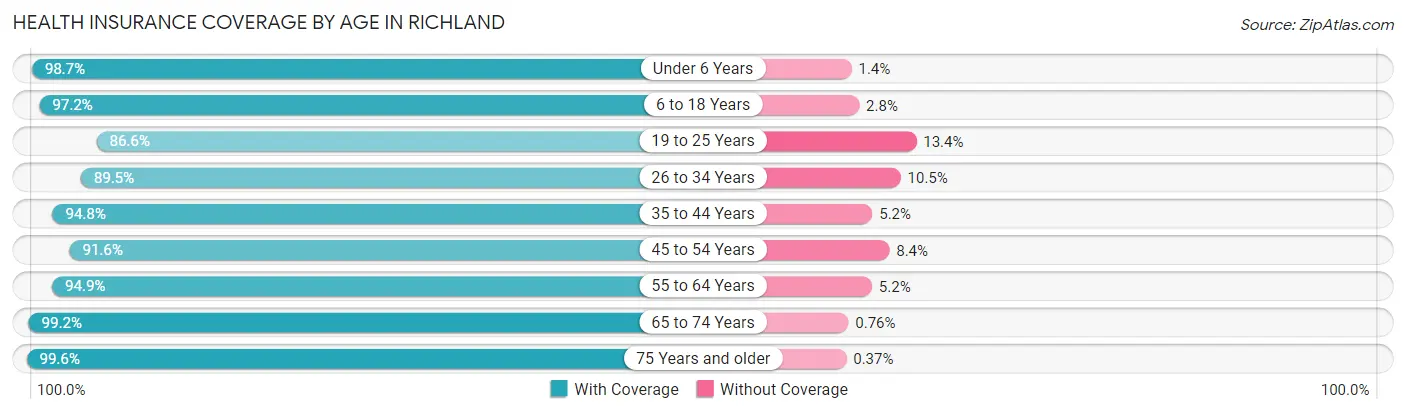
| Age Bracket | With Coverage | Without Coverage |
| Under 6 Years | 4,616 (98.7%) | 63 (1.3%) |
| 6 to 18 Years | 10,680 (97.2%) | 304 (2.8%) |
| 19 to 25 Years | 4,618 (86.6%) | 716 (13.4%) |
| 26 to 34 Years | 7,187 (89.5%) | 843 (10.5%) |
| 35 to 44 Years | 7,396 (94.8%) | 407 (5.2%) |
| 45 to 54 Years | 5,786 (91.6%) | 530 (8.4%) |
| 55 to 64 Years | 7,291 (94.9%) | 396 (5.1%) |
| 65 to 74 Years | 5,490 (99.2%) | 42 (0.8%) |
| 75 Years and older | 4,328 (99.6%) | 16 (0.4%) |
| Total | 57,392 (94.5%) | 3,317 (5.5%) |
Health Insurance Coverage by Citizenship Status in Richland
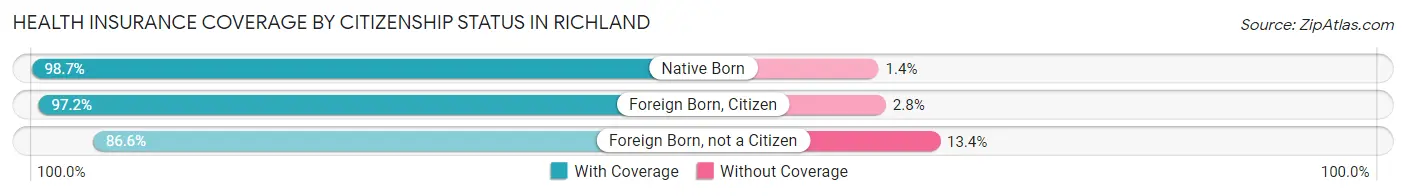
| Citizenship Status | With Coverage | Without Coverage |
| Native Born | 4,616 (98.7%) | 63 (1.3%) |
| Foreign Born, Citizen | 10,680 (97.2%) | 304 (2.8%) |
| Foreign Born, not a Citizen | 4,618 (86.6%) | 716 (13.4%) |
Health Insurance Coverage by Household Income in Richland
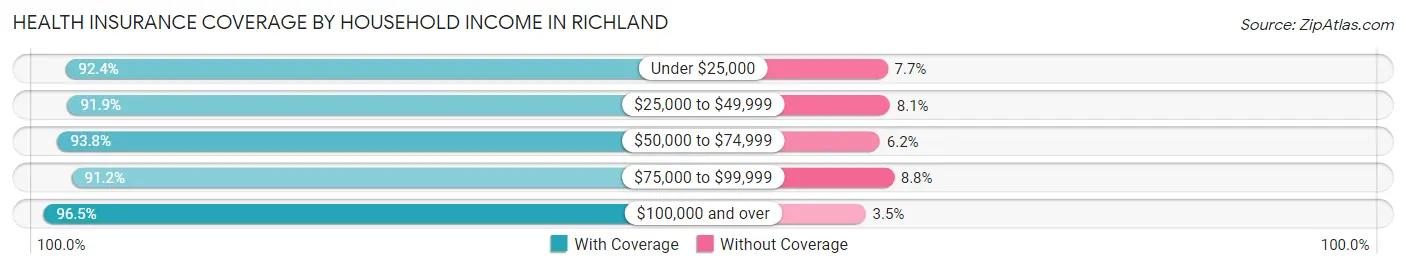
| Household Income | With Coverage | Without Coverage |
| Under $25,000 | 2,754 (92.3%) | 228 (7.6%) |
| $25,000 to $49,999 | 7,284 (91.9%) | 639 (8.1%) |
| $50,000 to $74,999 | 7,981 (93.8%) | 527 (6.2%) |
| $75,000 to $99,999 | 8,241 (91.2%) | 795 (8.8%) |
| $100,000 and over | 30,962 (96.5%) | 1,128 (3.5%) |
Public vs Private Health Insurance Coverage by Age in Richland
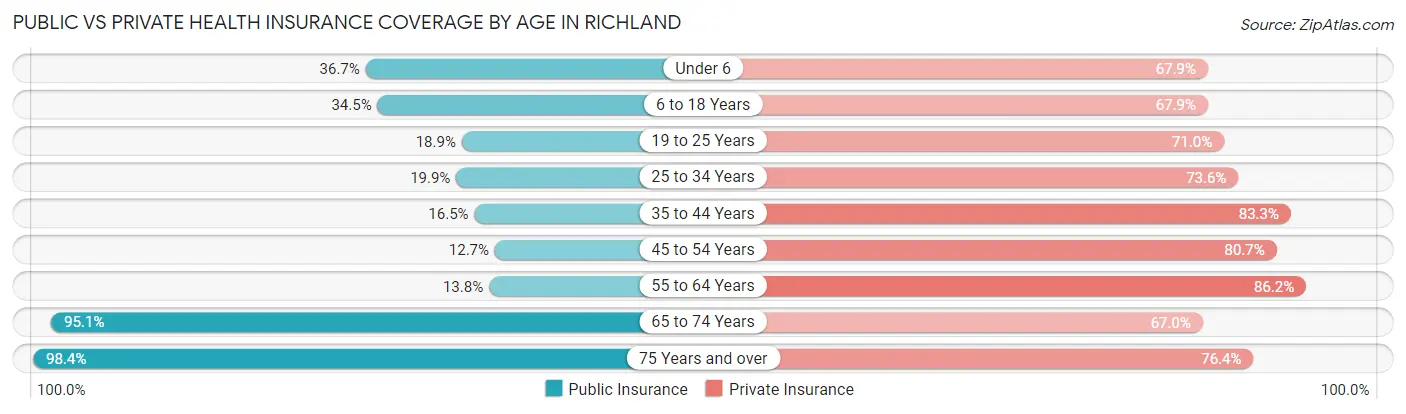
| Age Bracket | Public Insurance | Private Insurance |
| Under 6 | 1,717 (36.7%) | 3,179 (67.9%) |
| 6 to 18 Years | 3,790 (34.5%) | 7,460 (67.9%) |
| 19 to 25 Years | 1,006 (18.9%) | 3,785 (71.0%) |
| 25 to 34 Years | 1,597 (19.9%) | 5,908 (73.6%) |
| 35 to 44 Years | 1,288 (16.5%) | 6,503 (83.3%) |
| 45 to 54 Years | 803 (12.7%) | 5,097 (80.7%) |
| 55 to 64 Years | 1,061 (13.8%) | 6,624 (86.2%) |
| 65 to 74 Years | 5,260 (95.1%) | 3,706 (67.0%) |
| 75 Years and over | 4,276 (98.4%) | 3,318 (76.4%) |
| Total | 20,798 (34.3%) | 45,580 (75.1%) |
Disability Status by Sex by Age in Richland
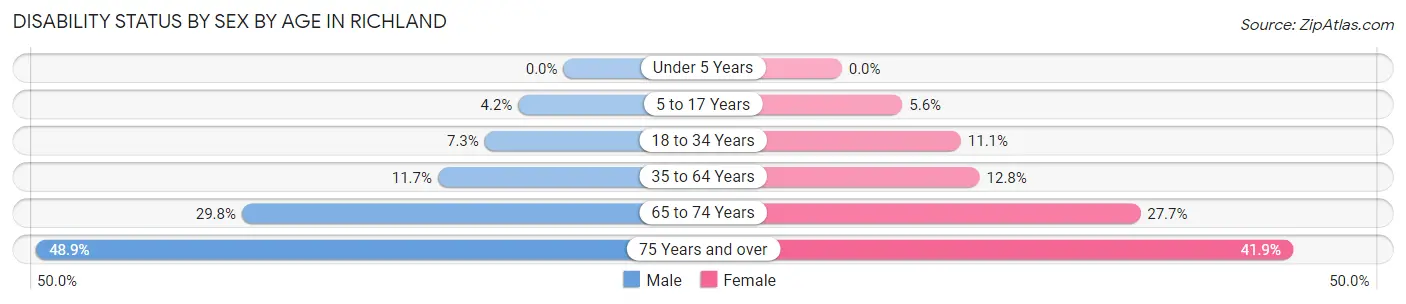
| Age Bracket | Male | Female |
| Under 5 Years | 0 (0.0%) | 0 (0.0%) |
| 5 to 17 Years | 255 (4.2%) | 284 (5.6%) |
| 18 to 34 Years | 533 (7.3%) | 756 (11.1%) |
| 35 to 64 Years | 1,296 (11.7%) | 1,367 (12.8%) |
| 65 to 74 Years | 762 (29.8%) | 825 (27.7%) |
| 75 Years and over | 976 (48.9%) | 983 (41.8%) |
Disability Class by Sex by Age in Richland
Disability Class: Hearing Difficulty
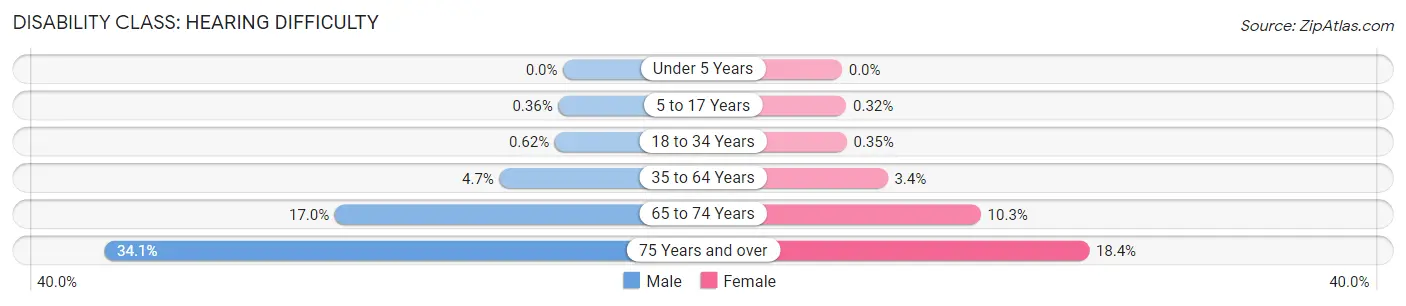
| Age Bracket | Male | Female |
| Under 5 Years | 0 (0.0%) | 0 (0.0%) |
| 5 to 17 Years | 22 (0.4%) | 16 (0.3%) |
| 18 to 34 Years | 45 (0.6%) | 24 (0.4%) |
| 35 to 64 Years | 526 (4.7%) | 362 (3.4%) |
| 65 to 74 Years | 433 (17.0%) | 307 (10.3%) |
| 75 Years and over | 680 (34.1%) | 431 (18.3%) |
Disability Class: Vision Difficulty
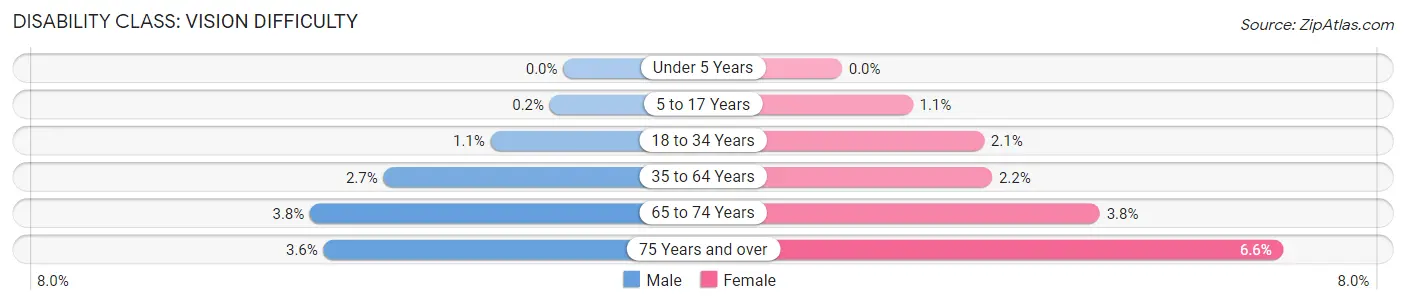
| Age Bracket | Male | Female |
| Under 5 Years | 0 (0.0%) | 0 (0.0%) |
| 5 to 17 Years | 12 (0.2%) | 53 (1.1%) |
| 18 to 34 Years | 79 (1.1%) | 144 (2.1%) |
| 35 to 64 Years | 297 (2.7%) | 238 (2.2%) |
| 65 to 74 Years | 96 (3.8%) | 114 (3.8%) |
| 75 Years and over | 71 (3.6%) | 154 (6.6%) |
Disability Class: Cognitive Difficulty
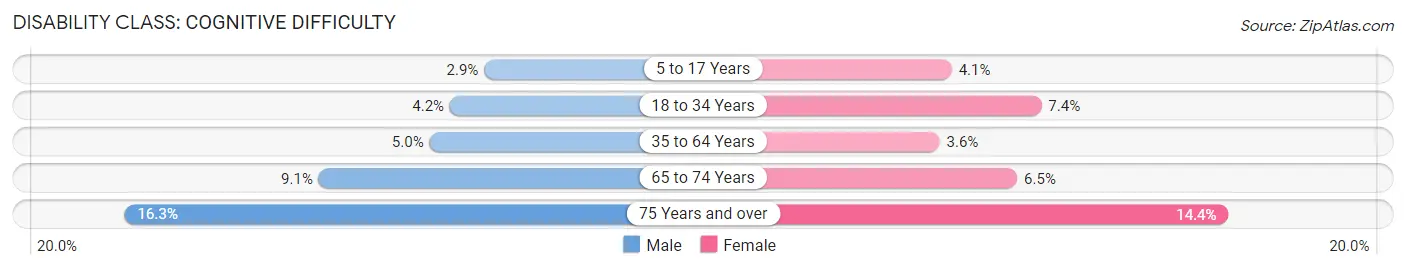
| Age Bracket | Male | Female |
| 5 to 17 Years | 179 (2.9%) | 206 (4.1%) |
| 18 to 34 Years | 307 (4.2%) | 507 (7.4%) |
| 35 to 64 Years | 553 (5.0%) | 388 (3.6%) |
| 65 to 74 Years | 232 (9.1%) | 194 (6.5%) |
| 75 Years and over | 325 (16.3%) | 337 (14.3%) |
Disability Class: Ambulatory Difficulty
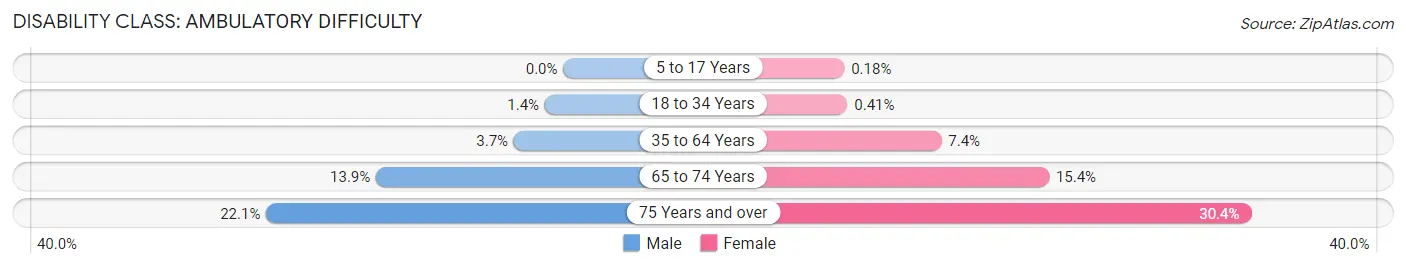
| Age Bracket | Male | Female |
| 5 to 17 Years | 0 (0.0%) | 9 (0.2%) |
| 18 to 34 Years | 100 (1.4%) | 28 (0.4%) |
| 35 to 64 Years | 408 (3.7%) | 790 (7.4%) |
| 65 to 74 Years | 355 (13.9%) | 458 (15.4%) |
| 75 Years and over | 440 (22.1%) | 714 (30.4%) |
Disability Class: Self-Care Difficulty
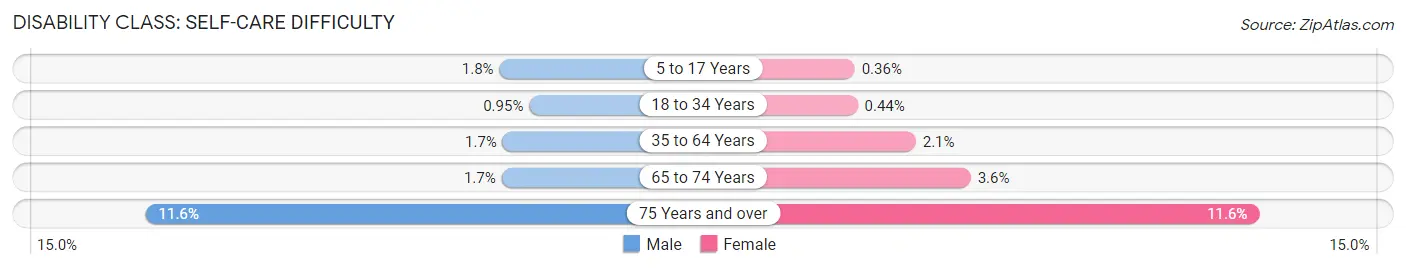
| Age Bracket | Male | Female |
| 5 to 17 Years | 108 (1.8%) | 18 (0.4%) |
| 18 to 34 Years | 69 (0.9%) | 30 (0.4%) |
| 35 to 64 Years | 188 (1.7%) | 220 (2.1%) |
| 65 to 74 Years | 44 (1.7%) | 107 (3.6%) |
| 75 Years and over | 232 (11.6%) | 273 (11.6%) |
Technology Access in Richland
Computing Device Access in Richland
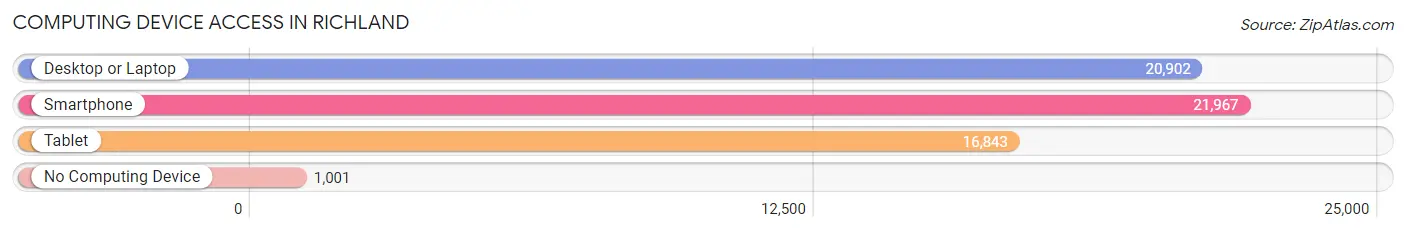
| Device Type | # Households | % Households |
| Desktop or Laptop | 20,902 | 86.8% |
| Smartphone | 21,967 | 91.2% |
| Tablet | 16,843 | 69.9% |
| No Computing Device | 1,001 | 4.2% |
| Total | 24,088 | 100.0% |
Internet Access in Richland
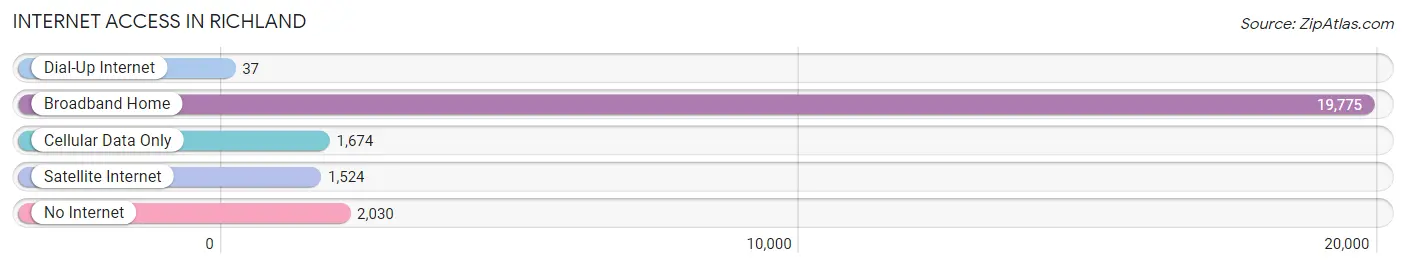
| Internet Type | # Households | % Households |
| Dial-Up Internet | 37 | 0.2% |
| Broadband Home | 19,775 | 82.1% |
| Cellular Data Only | 1,674 | 7.0% |
| Satellite Internet | 1,524 | 6.3% |
| No Internet | 2,030 | 8.4% |
| Total | 24,088 | 100.0% |
Richland Summary
Richland, Washington is a city located in Benton County in the southeastern part of the state. It is part of the Tri-Cities metropolitan area, which also includes the cities of Kennewick and Pasco. Richland is located along the Columbia River, and is home to the Hanford Nuclear Reservation, which is the site of the world’s first full-scale nuclear reactor.
History
The area that is now Richland was originally inhabited by the Wanapum and Yakama Native American tribes. The first non-native settlers arrived in the area in the late 1800s, and the town of Richland was officially incorporated in 1910. The town was named after the nearby Richland Creek, which was named by early settlers for its abundance of wild rye grass.
In 1943, the U.S. government purchased the land that is now the Hanford Nuclear Reservation, and the town of Richland was chosen as the site of the world’s first full-scale nuclear reactor. The reactor was completed in 1944, and the town of Richland was transformed into a bustling community of scientists, engineers, and workers.
Geography
Richland is located in the southeastern part of Washington State, in Benton County. It is situated along the Columbia River, and is part of the Tri-Cities metropolitan area, which also includes the cities of Kennewick and Pasco. The city covers an area of 16.3 square miles, and has an elevation of 486 feet.
The climate in Richland is semi-arid, with hot summers and mild winters. The average annual temperature is around 50 degrees Fahrenheit, and the average annual precipitation is around 8 inches.
Economy
Richland’s economy is largely driven by the Hanford Nuclear Reservation, which is the site of the world’s first full-scale nuclear reactor. The reservation is home to a number of research and development facilities, as well as a number of manufacturing and production plants.
In addition to the Hanford Nuclear Reservation, Richland is home to a number of other businesses, including a number of retail stores, restaurants, and hotels. The city is also home to a number of technology companies, including Microsoft, Amazon, and Boeing.
Demographics
As of the 2010 census, the population of Richland was 48,058. The racial makeup of the city was 87.3% White, 4.2% Hispanic or Latino, 2.7% Asian, 1.7% African American, and 0.7% Native American.
The median household income in Richland was $60,945, and the median family income was $71,945. The per capita income was $30,945. The poverty rate was 11.3%.
Richland is served by the Richland School District, which includes seven elementary schools, two middle schools, and two high schools. The city is also home to a number of higher education institutions, including Washington State University Tri-Cities, Columbia Basin College, and Heritage University.
Common Questions
What is Per Capita Income in Richland?
Per Capita income in Richland is $48,028.
What is the Median Family Income in Richland?
Median Family Income in Richland is $113,189.
What is the Median Household income in Richland?
Median Household Income in Richland is $89,283.
What is Income or Wage Gap in Richland?
Income or Wage Gap in Richland is 39.4%.
Women in Richland earn 60.6 cents for every dollar earned by a man.
What is Family Income Deficit in Richland?
Family Income Deficit in Richland is $11,402.
Families that are below poverty line in Richland earn $11,402 less on average than the poverty threshold level.
What is Inequality or Gini Index in Richland?
Inequality or Gini Index in Richland is 0.42.
What is the Total Population of Richland?
Total Population of Richland is 60,867.
What is the Total Male Population of Richland?
Total Male Population of Richland is 31,411.
What is the Total Female Population of Richland?
Total Female Population of Richland is 29,456.
What is the Ratio of Males per 100 Females in Richland?
There are 106.64 Males per 100 Females in Richland.
What is the Ratio of Females per 100 Males in Richland?
There are 93.78 Females per 100 Males in Richland.
What is the Median Population Age in Richland?
Median Population Age in Richland is 36.6 Years.
What is the Average Family Size in Richland
Average Family Size in Richland is 3.1 People.
What is the Average Household Size in Richland
Average Household Size in Richland is 2.5 People.
How Large is the Labor Force in Richland?
There are 30,377 People in the Labor Forcein in Richland.
What is the Percentage of People in the Labor Force in Richland?
63.6% of People are in the Labor Force in Richland.
What is the Unemployment Rate in Richland?
Unemployment Rate in Richland is 5.1%.