Sunnyslope, WA Map & Demographics
Sunnyslope Map
Sunnyslope Overview
$65,194
PER CAPITA INCOME
$130,583
AVG FAMILY INCOME
$124,076
AVG HOUSEHOLD INCOME
59.7%
WAGE / INCOME GAP [ % ]
40.3¢/ $1
WAGE / INCOME GAP [ $ ]
0.44
INEQUALITY / GINI INDEX
3,553
TOTAL POPULATION
1,807
MALE POPULATION
1,746
FEMALE POPULATION
103.49
MALES / 100 FEMALES
96.62
FEMALES / 100 MALES
46.9
MEDIAN AGE
3.0
AVG FAMILY SIZE
2.6
AVG HOUSEHOLD SIZE
1,727
LABOR FORCE [ PEOPLE ]
63.8%
PERCENT IN LABOR FORCE
1.3%
UNEMPLOYMENT RATE
Income in Sunnyslope
Income Overview in Sunnyslope
Per Capita Income in Sunnyslope is $65,194, while median incomes of families and households are $130,583 and $124,076 respectively.
| Characteristic | Number | Measure |
| Per Capita Income | 3,553 | $65,194 |
| Median Family Income | 1,023 | $130,583 |
| Mean Family Income | 1,023 | $177,255 |
| Median Household Income | 1,338 | $124,076 |
| Mean Household Income | 1,338 | $170,210 |
| Income Deficit | 1,023 | $0 |
| Wage / Income Gap (%) | 3,553 | 59.75% |
| Wage / Income Gap ($) | 3,553 | 40.25¢ per $1 |
| Gini / Inequality Index | 3,553 | 0.44 |
Earnings by Sex in Sunnyslope
Average Earnings in Sunnyslope are $57,713, $83,377 for men and $33,563 for women, a difference of 59.8%.
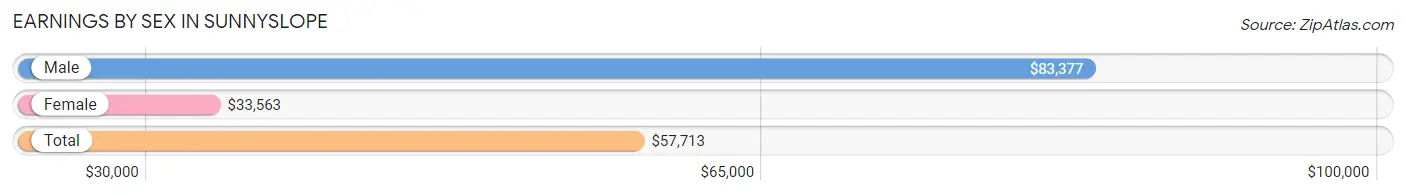
| Sex | Number | Average Earnings |
| Male | 951 (52.5%) | $83,377 |
| Female | 861 (47.5%) | $33,563 |
| Total | 1,812 (100.0%) | $57,713 |
Earnings by Sex by Income Bracket in Sunnyslope
The most common earnings brackets in Sunnyslope are $100,000+ for men (379 | 39.9%) and $100,000+ for women (187 | 21.7%).
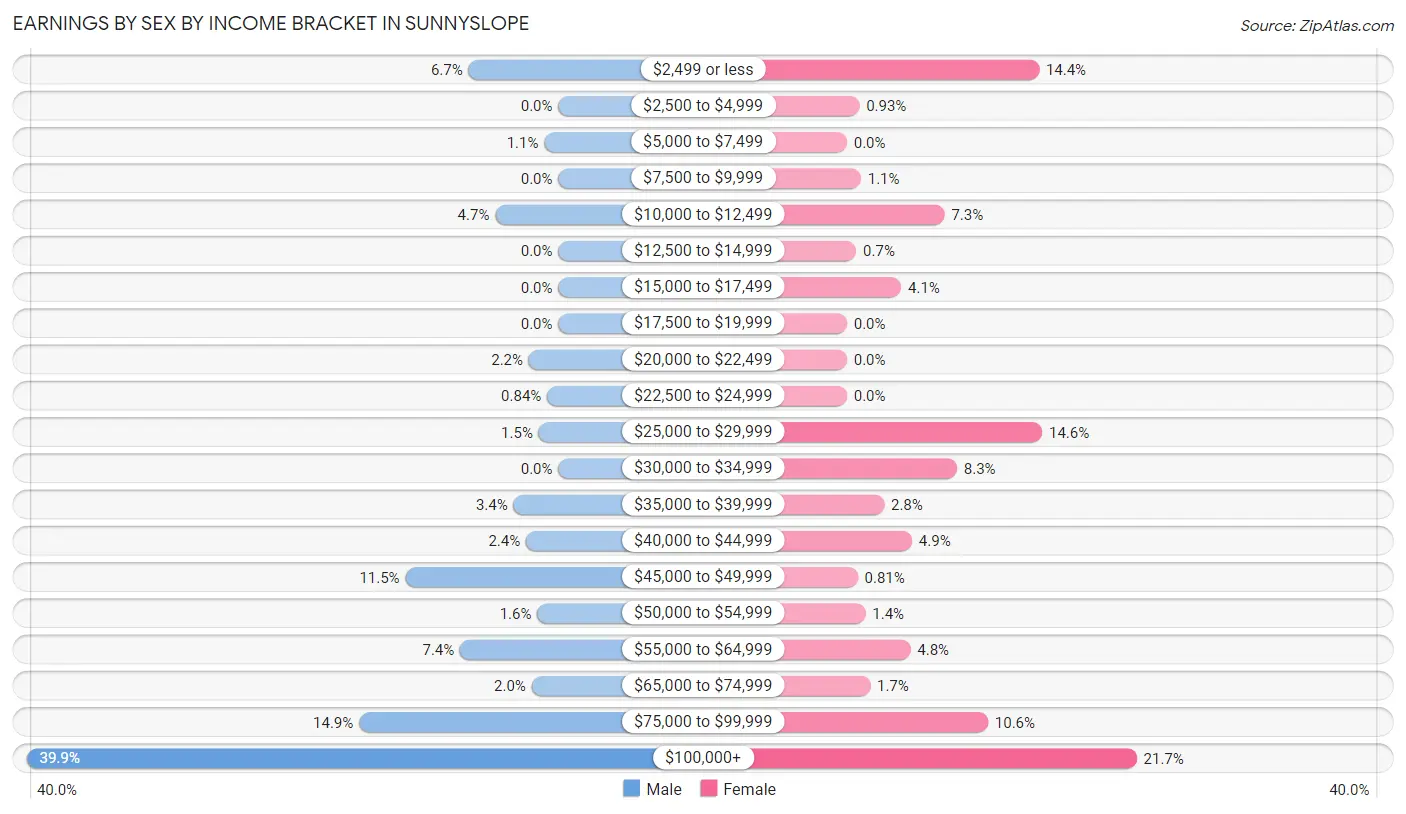
| Income | Male | Female |
| $2,499 or less | 64 (6.7%) | 124 (14.4%) |
| $2,500 to $4,999 | 0 (0.0%) | 8 (0.9%) |
| $5,000 to $7,499 | 10 (1.1%) | 0 (0.0%) |
| $7,500 to $9,999 | 0 (0.0%) | 9 (1.1%) |
| $10,000 to $12,499 | 45 (4.7%) | 63 (7.3%) |
| $12,500 to $14,999 | 0 (0.0%) | 6 (0.7%) |
| $15,000 to $17,499 | 0 (0.0%) | 35 (4.1%) |
| $17,500 to $19,999 | 0 (0.0%) | 0 (0.0%) |
| $20,000 to $22,499 | 21 (2.2%) | 0 (0.0%) |
| $22,500 to $24,999 | 8 (0.8%) | 0 (0.0%) |
| $25,000 to $29,999 | 14 (1.5%) | 126 (14.6%) |
| $30,000 to $34,999 | 0 (0.0%) | 71 (8.3%) |
| $35,000 to $39,999 | 32 (3.4%) | 24 (2.8%) |
| $40,000 to $44,999 | 23 (2.4%) | 42 (4.9%) |
| $45,000 to $49,999 | 109 (11.5%) | 7 (0.8%) |
| $50,000 to $54,999 | 15 (1.6%) | 12 (1.4%) |
| $55,000 to $64,999 | 70 (7.4%) | 41 (4.8%) |
| $65,000 to $74,999 | 19 (2.0%) | 15 (1.7%) |
| $75,000 to $99,999 | 142 (14.9%) | 91 (10.6%) |
| $100,000+ | 379 (39.9%) | 187 (21.7%) |
| Total | 951 (100.0%) | 861 (100.0%) |
Earnings by Sex by Educational Attainment in Sunnyslope
Average earnings in Sunnyslope are $89,265 for men and $43,788 for women, a difference of 50.9%. Men with an educational attainment of graduate degree enjoy the highest average annual earnings of $180,588, while those with high school diploma education earn the least with $47,900. Women with an educational attainment of graduate degree earn the most with the average annual earnings of $77,356, while those with high school diploma education have the smallest earnings of $26,213.
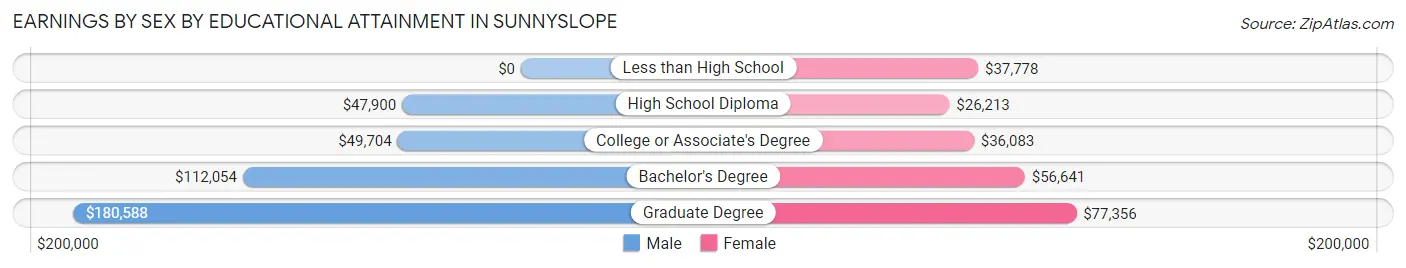
| Educational Attainment | Male Income | Female Income |
| Less than High School | - | - |
| High School Diploma | $47,900 | $26,213 |
| College or Associate's Degree | $49,704 | $36,083 |
| Bachelor's Degree | $112,054 | $56,641 |
| Graduate Degree | $180,588 | $77,356 |
| Total | $89,265 | $43,788 |
Family Income in Sunnyslope
Family Income Brackets in Sunnyslope
According to the Sunnyslope family income data, there are 288 families falling into the $200,000+ income range, which is the most common income bracket and makes up 28.1% of all families.
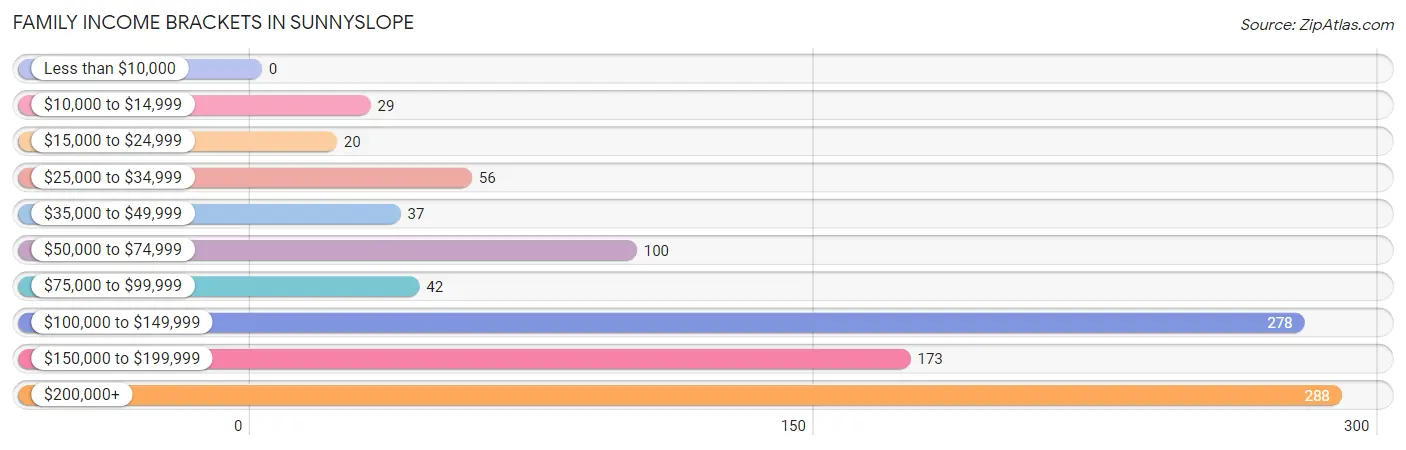
| Income Bracket | # Families | % Families |
| Less than $10,000 | 0 | 0.0% |
| $10,000 to $14,999 | 29 | 2.8% |
| $15,000 to $24,999 | 20 | 2.0% |
| $25,000 to $34,999 | 56 | 5.5% |
| $35,000 to $49,999 | 37 | 3.6% |
| $50,000 to $74,999 | 100 | 9.8% |
| $75,000 to $99,999 | 42 | 4.1% |
| $100,000 to $149,999 | 278 | 27.2% |
| $150,000 to $199,999 | 173 | 16.9% |
| $200,000+ | 288 | 28.2% |
Family Income by Famaliy Size in Sunnyslope
3-person families (139 | 13.6%) account for the highest median family income in Sunnyslope with $176,339 per family, while 2-person families (570 | 55.7%) have the highest median income of $62,097 per family member.
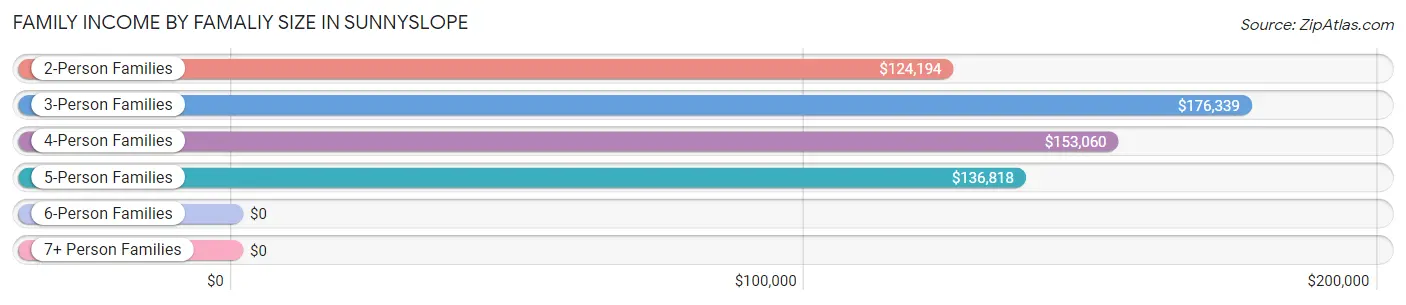
| Income Bracket | # Families | Median Income |
| 2-Person Families | 570 (55.7%) | $124,194 |
| 3-Person Families | 139 (13.6%) | $176,339 |
| 4-Person Families | 197 (19.3%) | $153,060 |
| 5-Person Families | 66 (6.5%) | $136,818 |
| 6-Person Families | 51 (5.0%) | $0 |
| 7+ Person Families | 0 (0.0%) | $0 |
| Total | 1,023 (100.0%) | $130,583 |
Family Income by Number of Earners in Sunnyslope
The median family income in Sunnyslope is $130,583, with families comprising 3+ earners (87) having the highest median family income of $250,001, while families with no earners (164) have the lowest median family income of $101,250, accounting for 8.5% and 16.0% of families, respectively.
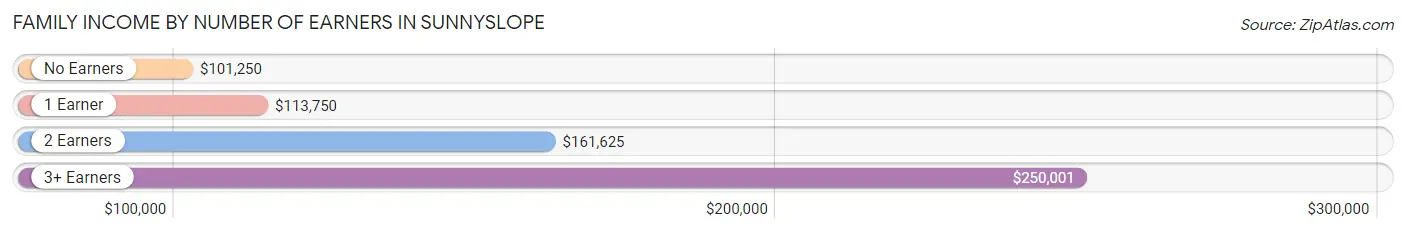
| Number of Earners | # Families | Median Income |
| No Earners | 164 (16.0%) | $101,250 |
| 1 Earner | 346 (33.8%) | $113,750 |
| 2 Earners | 426 (41.6%) | $161,625 |
| 3+ Earners | 87 (8.5%) | $250,001 |
| Total | 1,023 (100.0%) | $130,583 |
Household Income in Sunnyslope
Household Income Brackets in Sunnyslope
With 363 households falling in the category, the $200,000+ income range is the most frequent in Sunnyslope, accounting for 27.1% of all households. In contrast, only 8 households (0.6%) fall into the less than $10,000 income bracket, making it the least populous group.
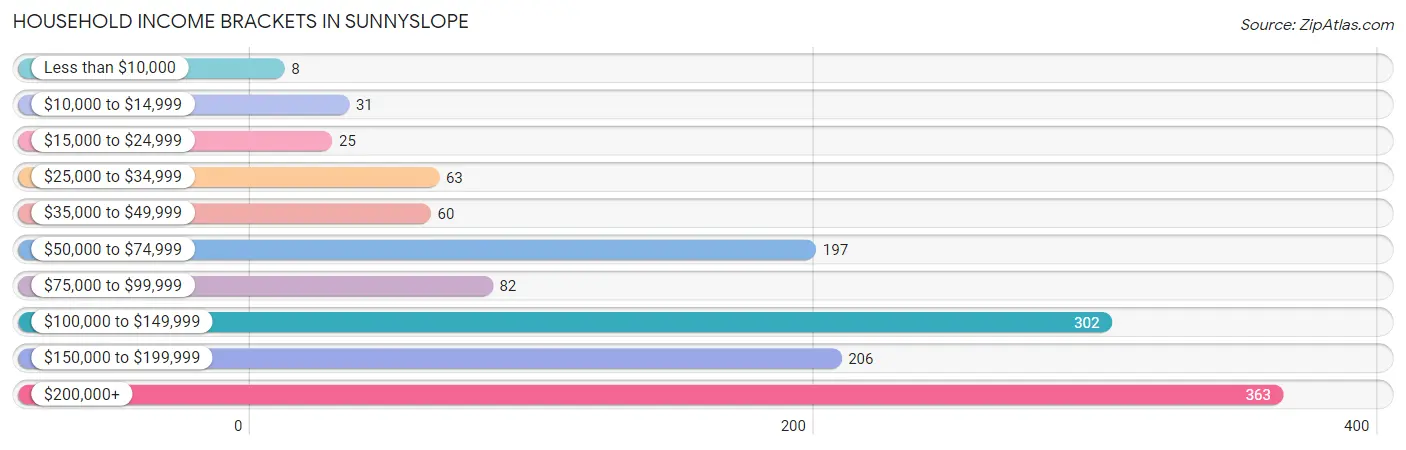
| Income Bracket | # Households | % Households |
| Less than $10,000 | 8 | 0.6% |
| $10,000 to $14,999 | 31 | 2.3% |
| $15,000 to $24,999 | 25 | 1.9% |
| $25,000 to $34,999 | 63 | 4.7% |
| $35,000 to $49,999 | 60 | 4.5% |
| $50,000 to $74,999 | 197 | 14.7% |
| $75,000 to $99,999 | 82 | 6.1% |
| $100,000 to $149,999 | 302 | 22.6% |
| $150,000 to $199,999 | 206 | 15.4% |
| $200,000+ | 363 | 27.1% |
Household Income by Householder Age in Sunnyslope
The median household income in Sunnyslope is $124,076, with the highest median household income of $191,875 found in the 45 to 64 years age bracket for the primary householder. A total of 504 households (37.7%) fall into this category. Meanwhile, the 15 to 24 years age bracket for the primary householder has the lowest median household income of $0, with 67 households (5.0%) in this group.
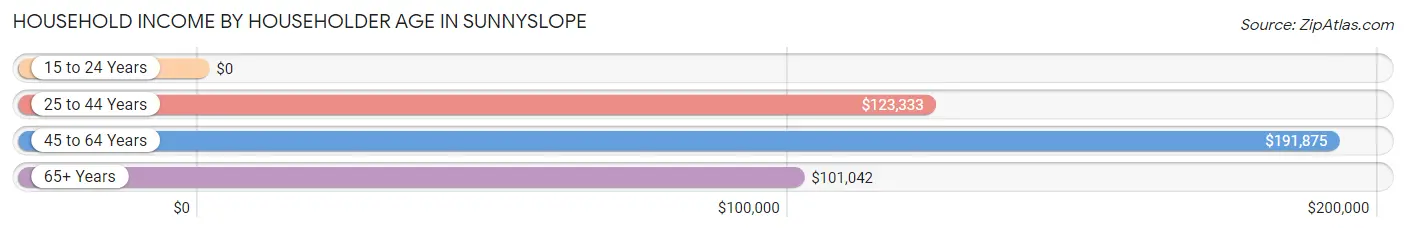
| Income Bracket | # Households | Median Income |
| 15 to 24 Years | 67 (5.0%) | $0 |
| 25 to 44 Years | 292 (21.8%) | $123,333 |
| 45 to 64 Years | 504 (37.7%) | $191,875 |
| 65+ Years | 475 (35.5%) | $101,042 |
| Total | 1,338 (100.0%) | $124,076 |
Poverty in Sunnyslope
Income Below Poverty by Sex and Age in Sunnyslope
With 10.3% poverty level for males and 12.0% for females among the residents of Sunnyslope, 12 to 14 year old males and 15 year old females are the most vulnerable to poverty, with 48 males (53.3%) and 14 females (100.0%) in their respective age groups living below the poverty level.
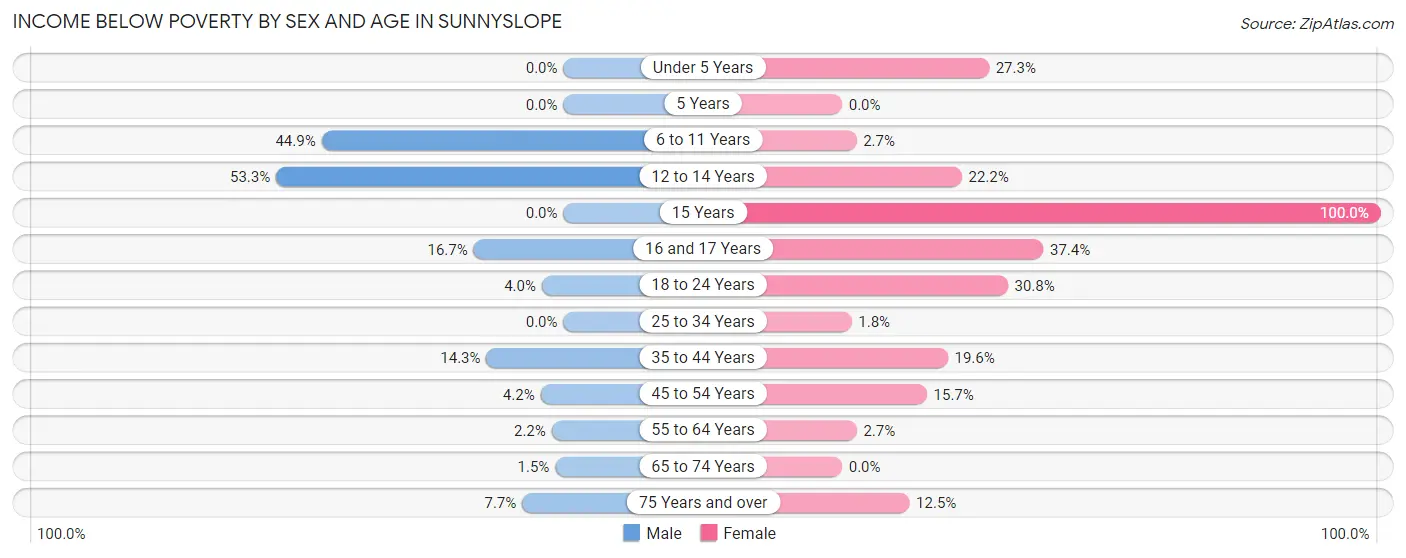
| Age Bracket | Male | Female |
| Under 5 Years | 0 (0.0%) | 42 (27.3%) |
| 5 Years | 0 (0.0%) | 0 (0.0%) |
| 6 to 11 Years | 79 (44.9%) | 4 (2.7%) |
| 12 to 14 Years | 48 (53.3%) | 12 (22.2%) |
| 15 Years | 0 (0.0%) | 14 (100.0%) |
| 16 and 17 Years | 3 (16.7%) | 31 (37.3%) |
| 18 to 24 Years | 4 (4.0%) | 16 (30.8%) |
| 25 to 34 Years | 0 (0.0%) | 3 (1.8%) |
| 35 to 44 Years | 18 (14.3%) | 32 (19.6%) |
| 45 to 54 Years | 10 (4.2%) | 31 (15.7%) |
| 55 to 64 Years | 6 (2.2%) | 8 (2.7%) |
| 65 to 74 Years | 4 (1.5%) | 0 (0.0%) |
| 75 Years and over | 14 (7.6%) | 17 (12.5%) |
| Total | 186 (10.3%) | 210 (12.0%) |
Income Above Poverty by Sex and Age in Sunnyslope
According to the poverty statistics in Sunnyslope, males aged under 5 years and females aged 5 years are the age groups that are most secure financially, with 100.0% of males and 100.0% of females in these age groups living above the poverty line.
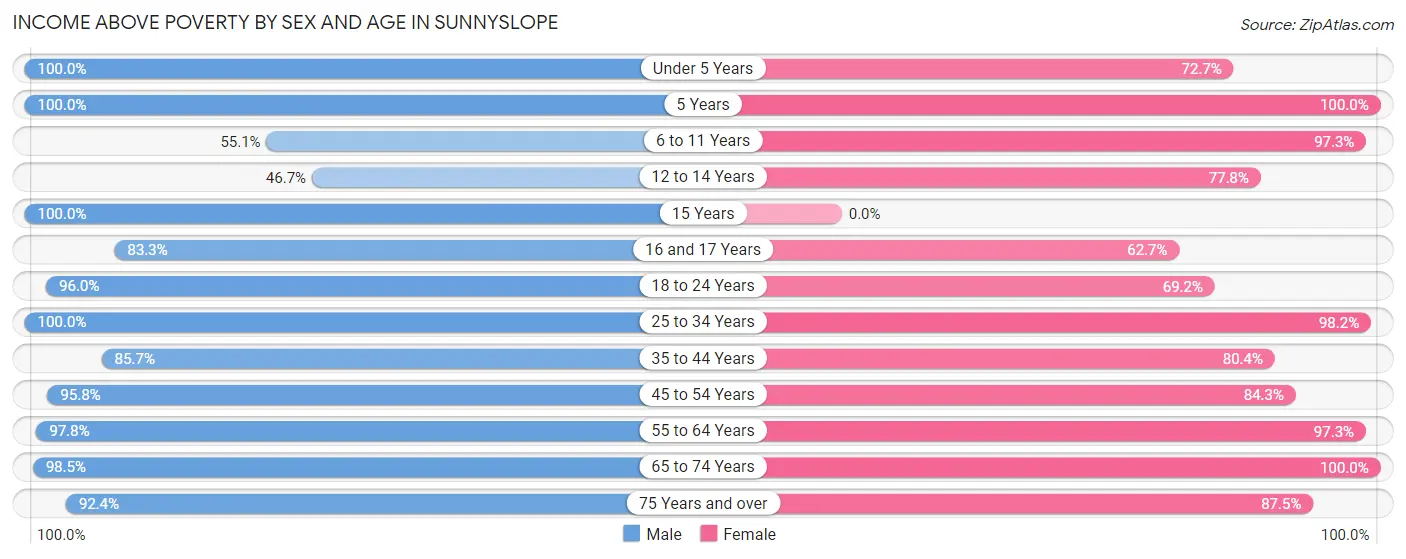
| Age Bracket | Male | Female |
| Under 5 Years | 125 (100.0%) | 112 (72.7%) |
| 5 Years | 45 (100.0%) | 17 (100.0%) |
| 6 to 11 Years | 97 (55.1%) | 146 (97.3%) |
| 12 to 14 Years | 42 (46.7%) | 42 (77.8%) |
| 15 Years | 15 (100.0%) | 0 (0.0%) |
| 16 and 17 Years | 15 (83.3%) | 52 (62.6%) |
| 18 to 24 Years | 96 (96.0%) | 36 (69.2%) |
| 25 to 34 Years | 147 (100.0%) | 166 (98.2%) |
| 35 to 44 Years | 108 (85.7%) | 131 (80.4%) |
| 45 to 54 Years | 226 (95.8%) | 166 (84.3%) |
| 55 to 64 Years | 269 (97.8%) | 286 (97.3%) |
| 65 to 74 Years | 261 (98.5%) | 263 (100.0%) |
| 75 Years and over | 169 (92.3%) | 119 (87.5%) |
| Total | 1,615 (89.7%) | 1,536 (88.0%) |
Income Below Poverty Among Married-Couple Families in Sunnyslope
The poverty statistics for married-couple families in Sunnyslope show that 0.8% or 7 of the total 898 families live below the poverty line. Families with no children have the highest poverty rate of 1.1%, comprising of 7 families. On the other hand, families with 1 or 2 children have the lowest poverty rate of 0.0%, which includes 0 families.
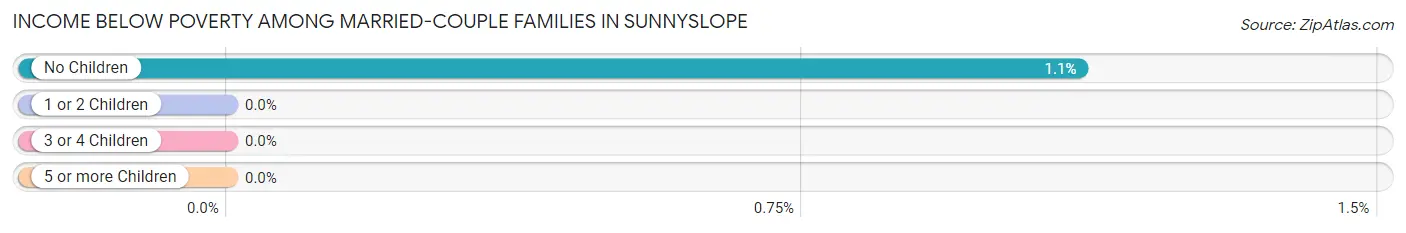
| Children | Above Poverty | Below Poverty |
| No Children | 625 (98.9%) | 7 (1.1%) |
| 1 or 2 Children | 178 (100.0%) | 0 (0.0%) |
| 3 or 4 Children | 88 (100.0%) | 0 (0.0%) |
| 5 or more Children | 0 (0.0%) | 0 (0.0%) |
| Total | 891 (99.2%) | 7 (0.8%) |
Income Below Poverty Among Single-Parent Households in Sunnyslope
According to the poverty data in Sunnyslope, 100.0% or 24 single-father households and 31.7% or 32 single-mother households are living below the poverty line. Among single-father households, those with 1 or 2 children have the highest poverty rate, with 10 households (100.0%) experiencing poverty. Likewise, among single-mother households, those with 5 or more children have the highest poverty rate, with 29 households (100.0%) falling below the poverty line.
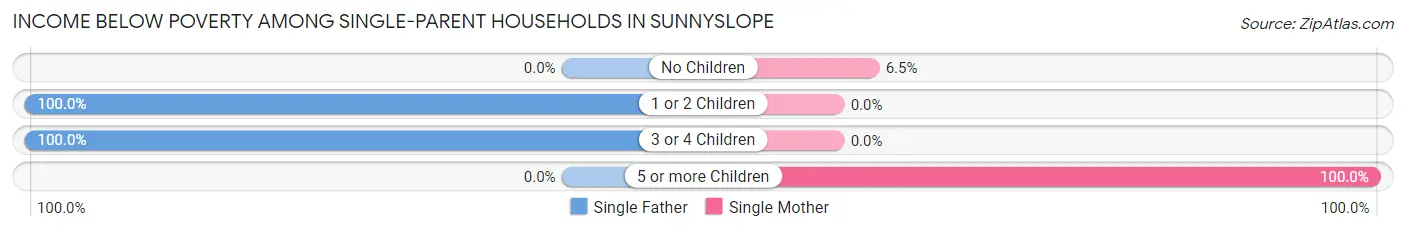
| Children | Single Father | Single Mother |
| No Children | 0 (0.0%) | 3 (6.5%) |
| 1 or 2 Children | 10 (100.0%) | 0 (0.0%) |
| 3 or 4 Children | 14 (100.0%) | 0 (0.0%) |
| 5 or more Children | 0 (0.0%) | 29 (100.0%) |
| Total | 24 (100.0%) | 32 (31.7%) |
Income Below Poverty Among Married-Couple vs Single-Parent Households in Sunnyslope
The poverty data for Sunnyslope shows that 7 of the married-couple family households (0.8%) and 56 of the single-parent households (44.8%) are living below the poverty level. Within the married-couple family households, those with no children have the highest poverty rate, with 7 households (1.1%) falling below the poverty line. Among the single-parent households, those with 1 or 2 children have the highest poverty rate, with 10 household (100.0%) living below poverty.
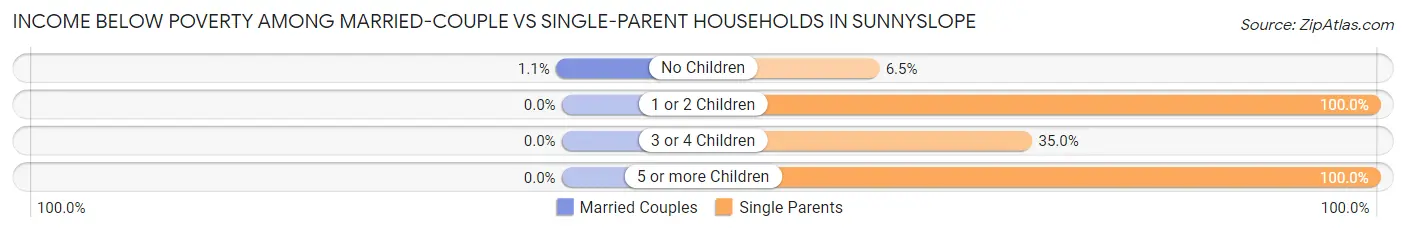
| Children | Married-Couple Families | Single-Parent Households |
| No Children | 7 (1.1%) | 3 (6.5%) |
| 1 or 2 Children | 0 (0.0%) | 10 (100.0%) |
| 3 or 4 Children | 0 (0.0%) | 14 (35.0%) |
| 5 or more Children | 0 (0.0%) | 29 (100.0%) |
| Total | 7 (0.8%) | 56 (44.8%) |
Race in Sunnyslope
The most populous races in Sunnyslope are White / Caucasian (2,830 | 79.6%), Hispanic or Latino (615 | 17.3%), and Some other Race (481 | 13.5%).
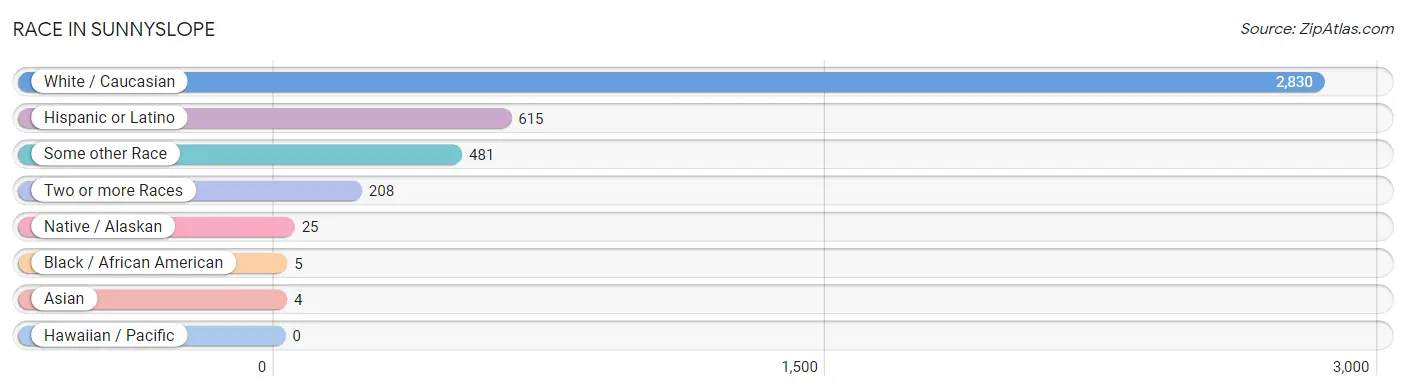
| Race | # Population | % Population |
| Asian | 4 | 0.1% |
| Black / African American | 5 | 0.1% |
| Hawaiian / Pacific | 0 | 0.0% |
| Hispanic or Latino | 615 | 17.3% |
| Native / Alaskan | 25 | 0.7% |
| White / Caucasian | 2,830 | 79.6% |
| Two or more Races | 208 | 5.9% |
| Some other Race | 481 | 13.5% |
| Total | 3,553 | 100.0% |
Ancestry in Sunnyslope
The most populous ancestries reported in Sunnyslope are German (728 | 20.5%), Mexican (605 | 17.0%), English (505 | 14.2%), Norwegian (287 | 8.1%), and Irish (273 | 7.7%), together accounting for 67.5% of all Sunnyslope residents.
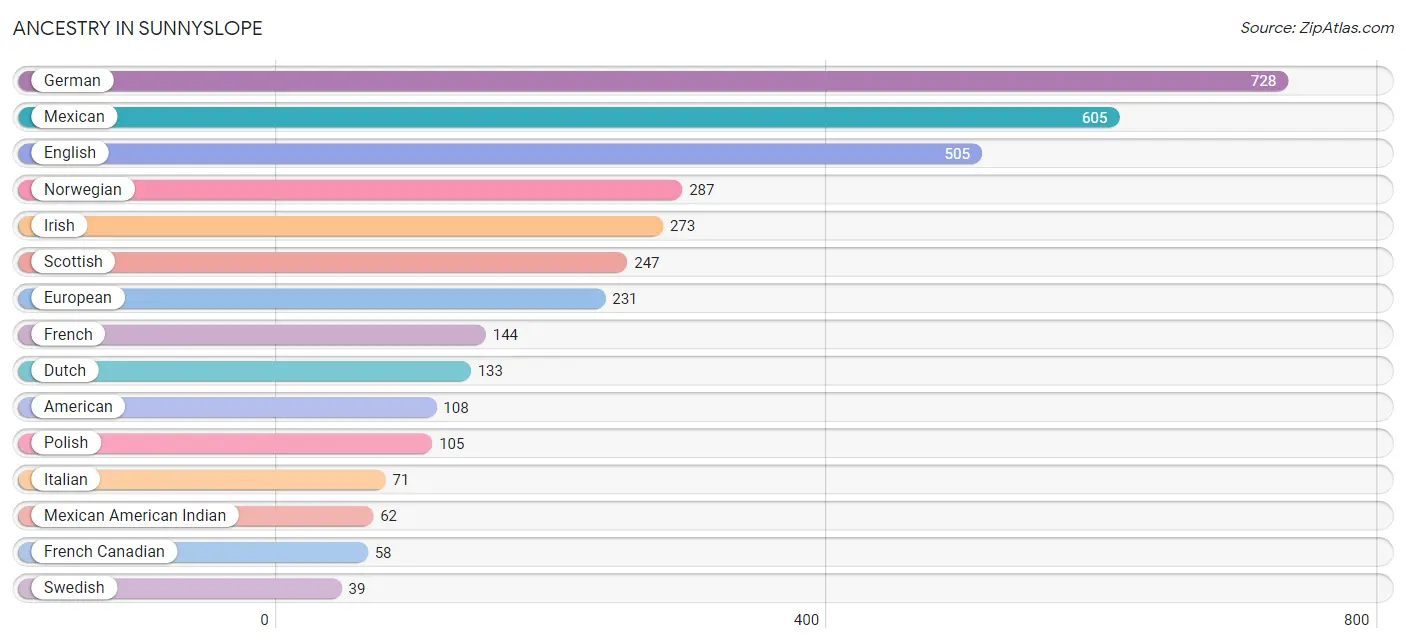
| Ancestry | # Population | % Population |
| American | 108 | 3.0% |
| Austrian | 16 | 0.4% |
| British | 32 | 0.9% |
| Canadian | 10 | 0.3% |
| Cherokee | 9 | 0.3% |
| Croatian | 13 | 0.4% |
| Czech | 15 | 0.4% |
| Danish | 5 | 0.1% |
| Dutch | 133 | 3.7% |
| Eastern European | 30 | 0.8% |
| English | 505 | 14.2% |
| European | 231 | 6.5% |
| Finnish | 6 | 0.2% |
| French | 144 | 4.1% |
| French Canadian | 58 | 1.6% |
| German | 728 | 20.5% |
| Greek | 14 | 0.4% |
| Hungarian | 10 | 0.3% |
| Icelander | 5 | 0.1% |
| Irish | 273 | 7.7% |
| Italian | 71 | 2.0% |
| Luxembourger | 5 | 0.1% |
| Mexican | 605 | 17.0% |
| Mexican American Indian | 62 | 1.8% |
| Northern European | 23 | 0.6% |
| Norwegian | 287 | 8.1% |
| Polish | 105 | 3.0% |
| Portuguese | 32 | 0.9% |
| Russian | 10 | 0.3% |
| Scandinavian | 6 | 0.2% |
| Scotch-Irish | 23 | 0.6% |
| Scottish | 247 | 7.0% |
| Sioux | 17 | 0.5% |
| Spanish | 5 | 0.1% |
| Sri Lankan | 4 | 0.1% |
| Swedish | 39 | 1.1% |
| Swiss | 19 | 0.5% |
| Welsh | 19 | 0.5% | View All 38 Rows |
Immigrants in Sunnyslope
The most numerous immigrant groups reported in Sunnyslope came from Latin America (136 | 3.8%), Canada (106 | 3.0%), Central America (106 | 3.0%), Mexico (106 | 3.0%), and Brazil (30 | 0.8%), together accounting for 13.6% of all Sunnyslope residents.
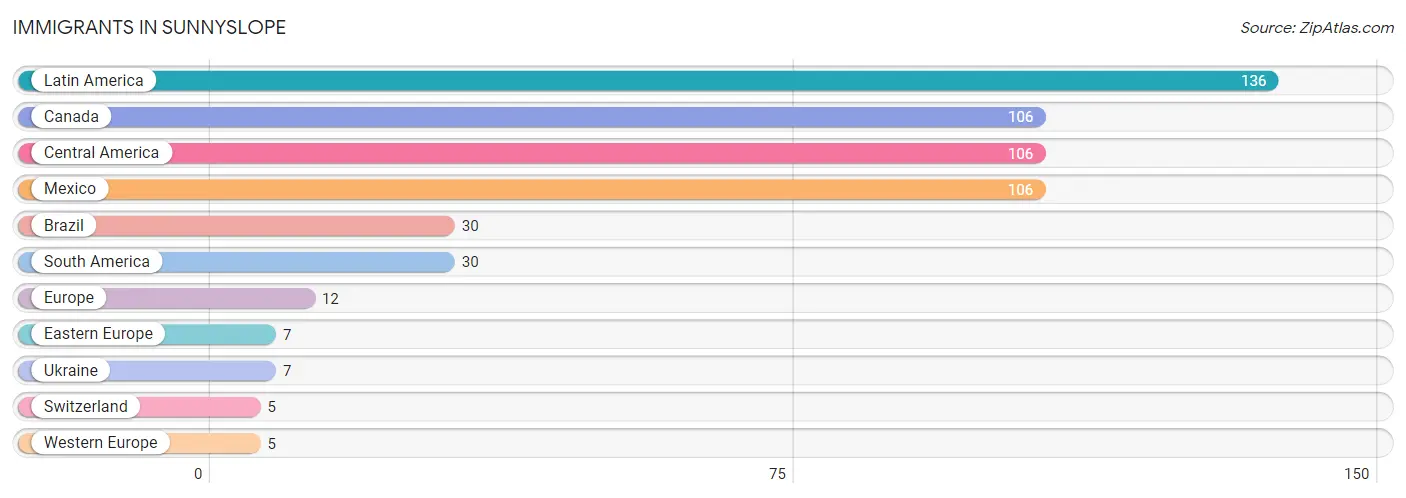
| Immigration Origin | # Population | % Population |
| Brazil | 30 | 0.8% |
| Canada | 106 | 3.0% |
| Central America | 106 | 3.0% |
| Eastern Europe | 7 | 0.2% |
| Europe | 12 | 0.3% |
| Latin America | 136 | 3.8% |
| Mexico | 106 | 3.0% |
| South America | 30 | 0.8% |
| Switzerland | 5 | 0.1% |
| Ukraine | 7 | 0.2% |
| Western Europe | 5 | 0.1% | View All 11 Rows |
Sex and Age in Sunnyslope
Sex and Age in Sunnyslope
The most populous age groups in Sunnyslope are 65 to 69 Years (190 | 10.5%) for men and 65 to 69 Years (168 | 9.6%) for women.
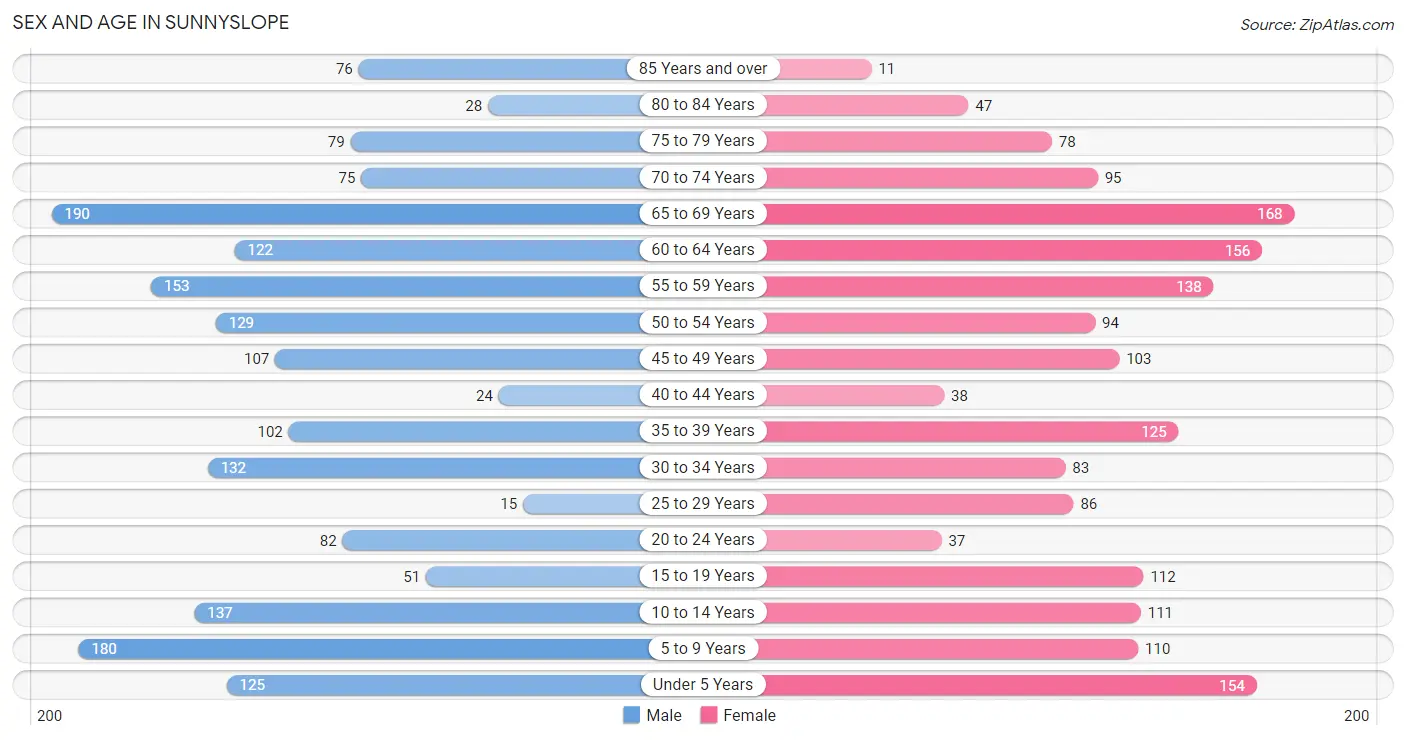
| Age Bracket | Male | Female |
| Under 5 Years | 125 (6.9%) | 154 (8.8%) |
| 5 to 9 Years | 180 (10.0%) | 110 (6.3%) |
| 10 to 14 Years | 137 (7.6%) | 111 (6.4%) |
| 15 to 19 Years | 51 (2.8%) | 112 (6.4%) |
| 20 to 24 Years | 82 (4.5%) | 37 (2.1%) |
| 25 to 29 Years | 15 (0.8%) | 86 (4.9%) |
| 30 to 34 Years | 132 (7.3%) | 83 (4.8%) |
| 35 to 39 Years | 102 (5.6%) | 125 (7.2%) |
| 40 to 44 Years | 24 (1.3%) | 38 (2.2%) |
| 45 to 49 Years | 107 (5.9%) | 103 (5.9%) |
| 50 to 54 Years | 129 (7.1%) | 94 (5.4%) |
| 55 to 59 Years | 153 (8.5%) | 138 (7.9%) |
| 60 to 64 Years | 122 (6.8%) | 156 (8.9%) |
| 65 to 69 Years | 190 (10.5%) | 168 (9.6%) |
| 70 to 74 Years | 75 (4.2%) | 95 (5.4%) |
| 75 to 79 Years | 79 (4.4%) | 78 (4.5%) |
| 80 to 84 Years | 28 (1.5%) | 47 (2.7%) |
| 85 Years and over | 76 (4.2%) | 11 (0.6%) |
| Total | 1,807 (100.0%) | 1,746 (100.0%) |
Families and Households in Sunnyslope
Median Family Size in Sunnyslope
The median family size in Sunnyslope is 2.96 persons per family, with single female/mother families (101 | 9.9%) accounting for the largest median family size of 5.04 persons per family. On the other hand, married-couple families (898 | 87.8%) represent the smallest median family size with 2.73 persons per family.
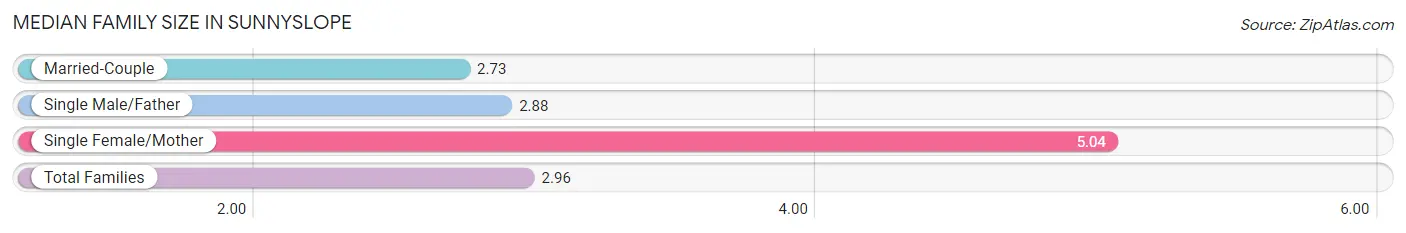
| Family Type | # Families | Family Size |
| Married-Couple | 898 (87.8%) | 2.73 |
| Single Male/Father | 24 (2.4%) | 2.88 |
| Single Female/Mother | 101 (9.9%) | 5.04 |
| Total Families | 1,023 (100.0%) | 2.96 |
Median Household Size in Sunnyslope
The median household size in Sunnyslope is 2.64 persons per household, with single female/mother households (101 | 7.5%) accounting for the largest median household size of 5.44 persons per household. non-family households (315 | 23.5%) represent the smallest median household size with 1.34 persons per household.
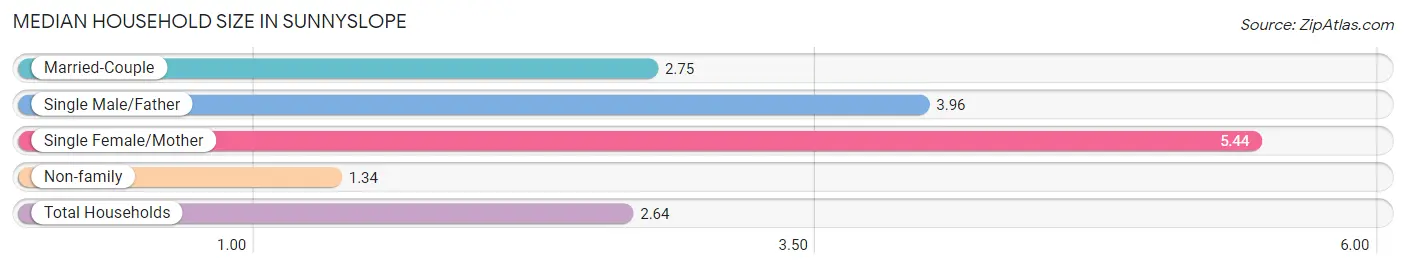
| Household Type | # Households | Household Size |
| Married-Couple | 898 (67.1%) | 2.75 |
| Single Male/Father | 24 (1.8%) | 3.96 |
| Single Female/Mother | 101 (7.5%) | 5.44 |
| Non-family | 315 (23.5%) | 1.34 |
| Total Households | 1,338 (100.0%) | 2.64 |
Household Size by Marriage Status in Sunnyslope
Out of a total of 1,338 households in Sunnyslope, 1,023 (76.5%) are family households, while 315 (23.5%) are nonfamily households. The most numerous type of family households are 2-person households, comprising 570, and the most common type of nonfamily households are 1-person households, comprising 204.
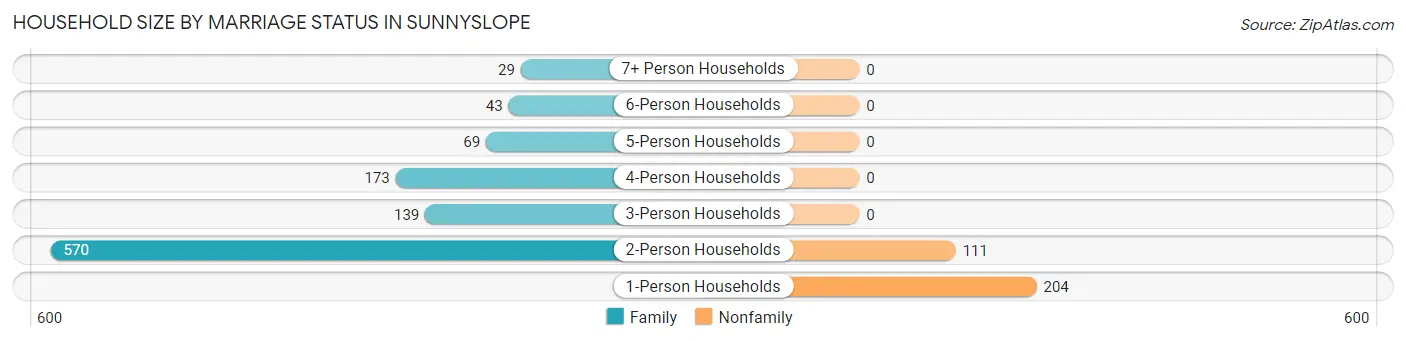
| Household Size | Family Households | Nonfamily Households |
| 1-Person Households | - | 204 (15.2%) |
| 2-Person Households | 570 (42.6%) | 111 (8.3%) |
| 3-Person Households | 139 (10.4%) | 0 (0.0%) |
| 4-Person Households | 173 (12.9%) | 0 (0.0%) |
| 5-Person Households | 69 (5.2%) | 0 (0.0%) |
| 6-Person Households | 43 (3.2%) | 0 (0.0%) |
| 7+ Person Households | 29 (2.2%) | 0 (0.0%) |
| Total | 1,023 (76.5%) | 315 (23.5%) |
Female Fertility in Sunnyslope
Fertility by Age in Sunnyslope
Average fertility rate in Sunnyslope is 128.0 births per 1,000 women. Women in the age bracket of 20 to 34 years have the highest fertility rate with 272.0 births per 1,000 women. Women in the age bracket of 20 to 34 years acount for 68.3% of all women with births.
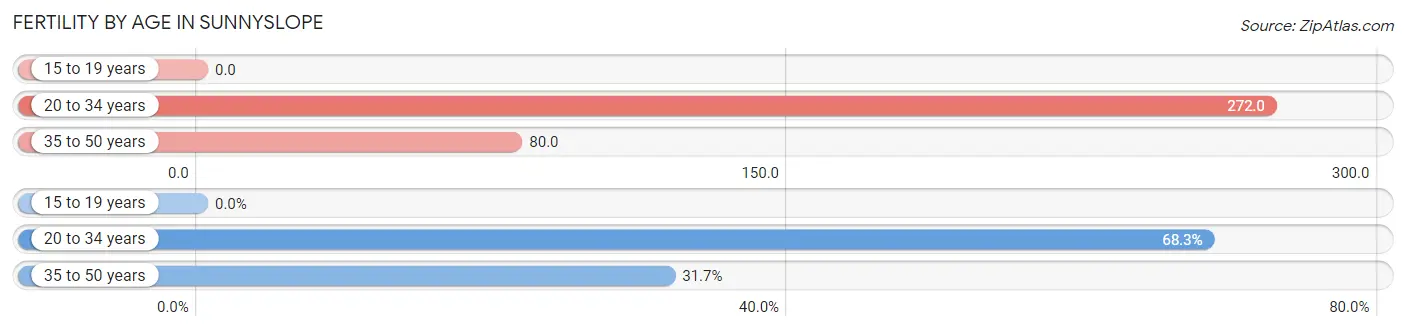
| Age Bracket | Women with Births | Births / 1,000 Women |
| 15 to 19 years | 0 (0.0%) | 0.0 |
| 20 to 34 years | 56 (68.3%) | 272.0 |
| 35 to 50 years | 26 (31.7%) | 80.0 |
| Total | 82 (100.0%) | 128.0 |
Fertility by Age by Marriage Status in Sunnyslope
68.3% of women with births (82) in Sunnyslope are married. The highest percentage of unmarried women with births falls into 20 to 34 years age bracket with 46.4% of them unmarried at the time of birth, while the lowest percentage of unmarried women with births belong to 35 to 50 years age bracket with 0.0% of them unmarried.
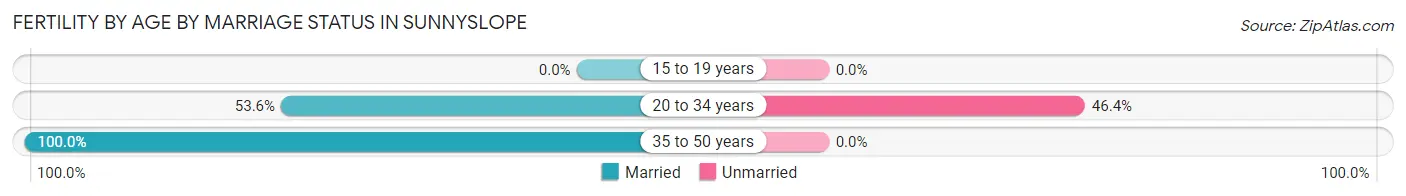
| Age Bracket | Married | Unmarried |
| 15 to 19 years | 0 (0.0%) | 0 (0.0%) |
| 20 to 34 years | 30 (53.6%) | 26 (46.4%) |
| 35 to 50 years | 26 (100.0%) | 0 (0.0%) |
| Total | 56 (68.3%) | 26 (31.7%) |
Fertility by Education in Sunnyslope
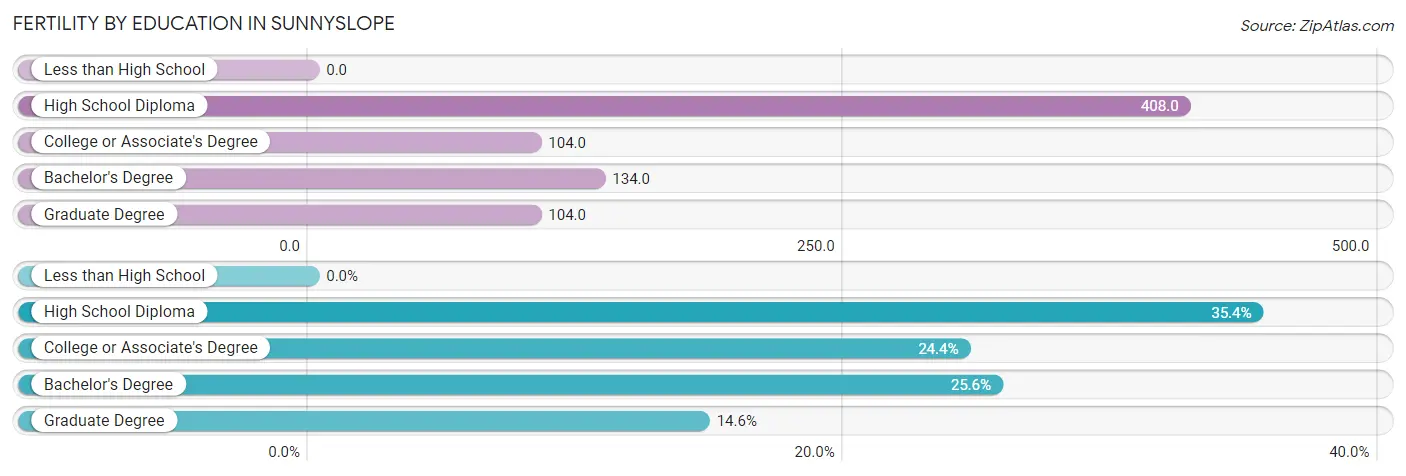
| Educational Attainment | Women with Births | Births / 1,000 Women |
| Less than High School | 0 (0.0%) | 0.0 |
| High School Diploma | 29 (35.4%) | 408.0 |
| College or Associate's Degree | 20 (24.4%) | 104.0 |
| Bachelor's Degree | 21 (25.6%) | 134.0 |
| Graduate Degree | 12 (14.6%) | 104.0 |
| Total | 82 (100.0%) | 128.0 |
Fertility by Education by Marriage Status in Sunnyslope
31.7% of women with births in Sunnyslope are unmarried. Women with the educational attainment of college or associate's degree are most likely to be married with 100.0% of them married at childbirth, while women with the educational attainment of high school diploma are least likely to be married with 89.7% of them unmarried at childbirth.
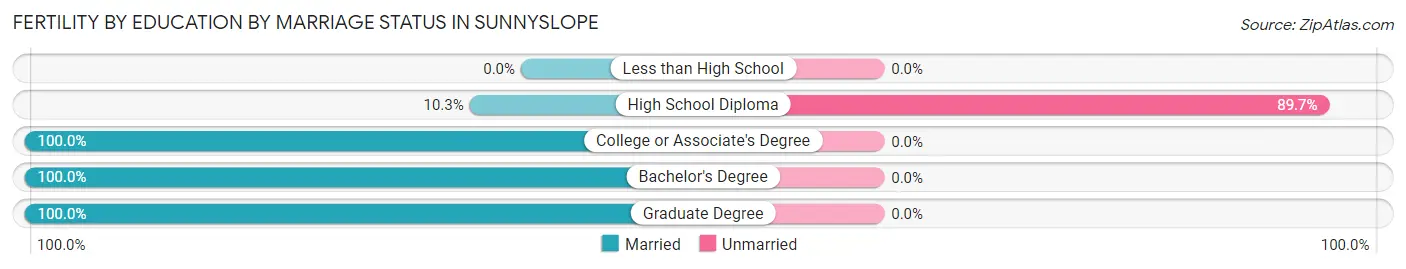
| Educational Attainment | Married | Unmarried |
| Less than High School | 0 (0.0%) | 0 (0.0%) |
| High School Diploma | 3 (10.3%) | 26 (89.7%) |
| College or Associate's Degree | 20 (100.0%) | 0 (0.0%) |
| Bachelor's Degree | 21 (100.0%) | 0 (0.0%) |
| Graduate Degree | 12 (100.0%) | 0 (0.0%) |
| Total | 56 (68.3%) | 26 (31.7%) |
Employment Characteristics in Sunnyslope
Employment by Class of Employer in Sunnyslope
Among the 1,699 employed individuals in Sunnyslope, private company employees (791 | 46.6%), local government employees (407 | 24.0%), and self-employed (not incorporated) (199 | 11.7%) make up the most common classes of employment.
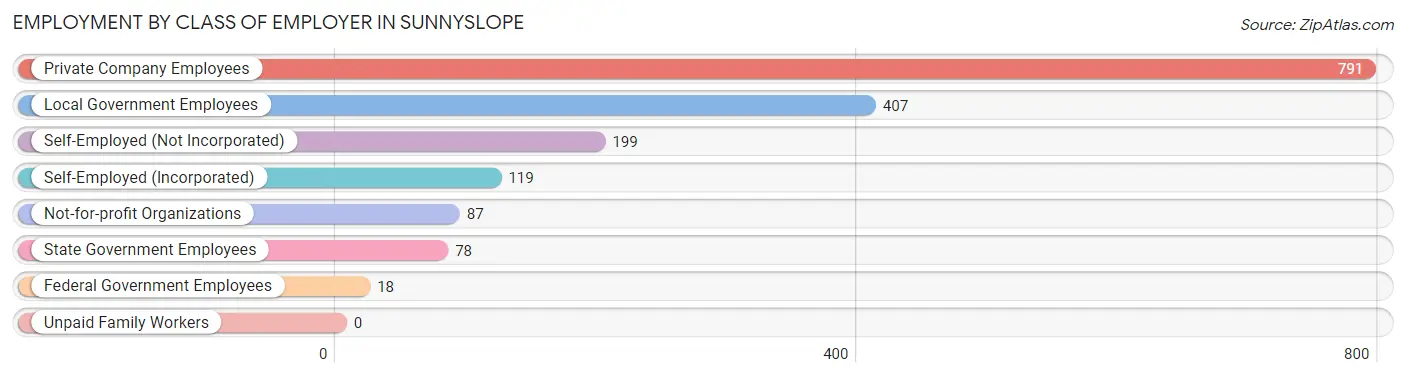
| Employer Class | # Employees | % Employees |
| Private Company Employees | 791 | 46.6% |
| Self-Employed (Incorporated) | 119 | 7.0% |
| Self-Employed (Not Incorporated) | 199 | 11.7% |
| Not-for-profit Organizations | 87 | 5.1% |
| Local Government Employees | 407 | 24.0% |
| State Government Employees | 78 | 4.6% |
| Federal Government Employees | 18 | 1.1% |
| Unpaid Family Workers | 0 | 0.0% |
| Total | 1,699 | 100.0% |
Employment Status by Age in Sunnyslope
According to the labor force statistics for Sunnyslope, out of the total population over 16 years of age (2,707), 63.8% or 1,727 individuals are in the labor force, with 1.3% or 22 of them unemployed. The age group with the highest labor force participation rate is 25 to 29 years, with 100.0% or 101 individuals in the labor force. Within the labor force, the 16 to 19 years age range has the highest percentage of unemployed individuals, with 15.0% or 12 of them being unemployed.
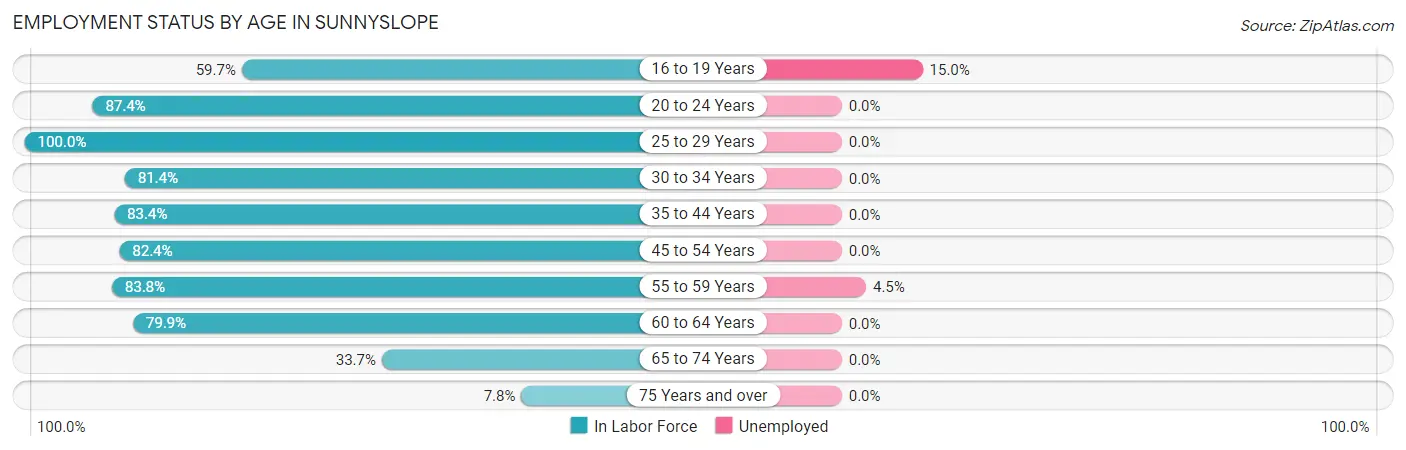
| Age Bracket | In Labor Force | Unemployed |
| 16 to 19 Years | 80 (59.7%) | 12 (15.0%) |
| 20 to 24 Years | 104 (87.4%) | 0 (0.0%) |
| 25 to 29 Years | 101 (100.0%) | 0 (0.0%) |
| 30 to 34 Years | 175 (81.4%) | 0 (0.0%) |
| 35 to 44 Years | 241 (83.4%) | 0 (0.0%) |
| 45 to 54 Years | 357 (82.4%) | 0 (0.0%) |
| 55 to 59 Years | 244 (83.8%) | 11 (4.5%) |
| 60 to 64 Years | 222 (79.9%) | 0 (0.0%) |
| 65 to 74 Years | 178 (33.7%) | 0 (0.0%) |
| 75 Years and over | 25 (7.8%) | 0 (0.0%) |
| Total | 1,727 (63.8%) | 22 (1.3%) |
Employment Status by Educational Attainment in Sunnyslope
According to labor force statistics for Sunnyslope, 83.4% of individuals (1,340) out of the total population between 25 and 64 years of age (1,607) are in the labor force, with 0.8% or 11 of them being unemployed. The group with the highest labor force participation rate are those with the educational attainment of less than high school, with 100.0% or 61 individuals in the labor force. Within the labor force, individuals with college / associate degree education have the highest percentage of unemployment, with 2.6% or 11 of them being unemployed.
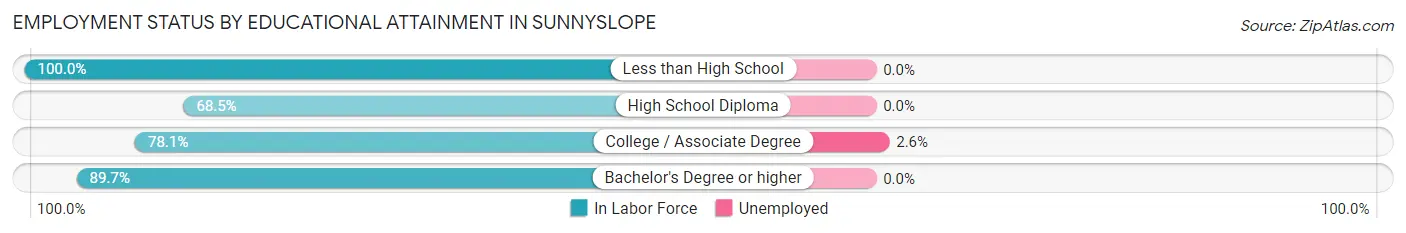
| Educational Attainment | In Labor Force | Unemployed |
| Less than High School | 61 (100.0%) | 0 (0.0%) |
| High School Diploma | 146 (68.5%) | 0 (0.0%) |
| College / Associate Degree | 420 (78.1%) | 14 (2.6%) |
| Bachelor's Degree or higher | 713 (89.7%) | 0 (0.0%) |
| Total | 1,340 (83.4%) | 13 (0.8%) |
Employment Occupations by Sex in Sunnyslope
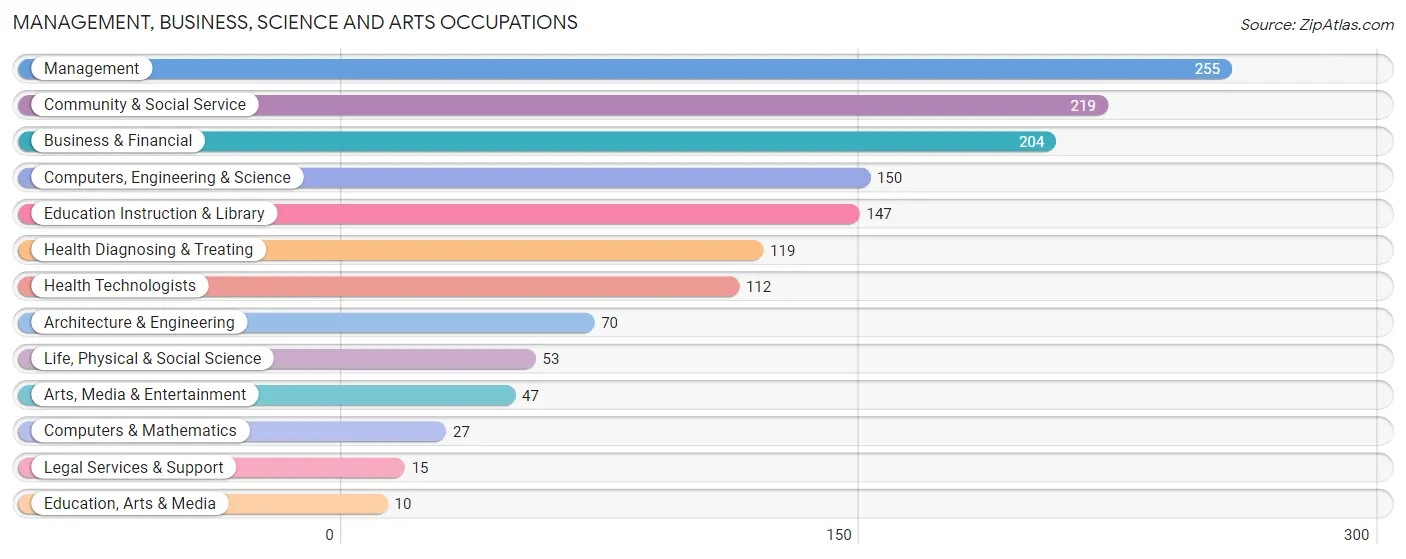
Management, Business, Science and Arts Occupations
The most common Management, Business, Science and Arts occupations in Sunnyslope are Management (255 | 15.0%), Community & Social Service (219 | 12.9%), Business & Financial (204 | 12.0%), Computers, Engineering & Science (150 | 8.8%), and Education Instruction & Library (147 | 8.6%).
Management, Business, Science and Arts Occupations by Sex
Within the Management, Business, Science and Arts occupations in Sunnyslope, the most male-oriented occupations are Computers & Mathematics (100.0%), Education, Arts & Media (100.0%), and Legal Services & Support (100.0%), while the most female-oriented occupations are Education Instruction & Library (93.9%), Community & Social Service (72.2%), and Health Diagnosing & Treating (67.2%).
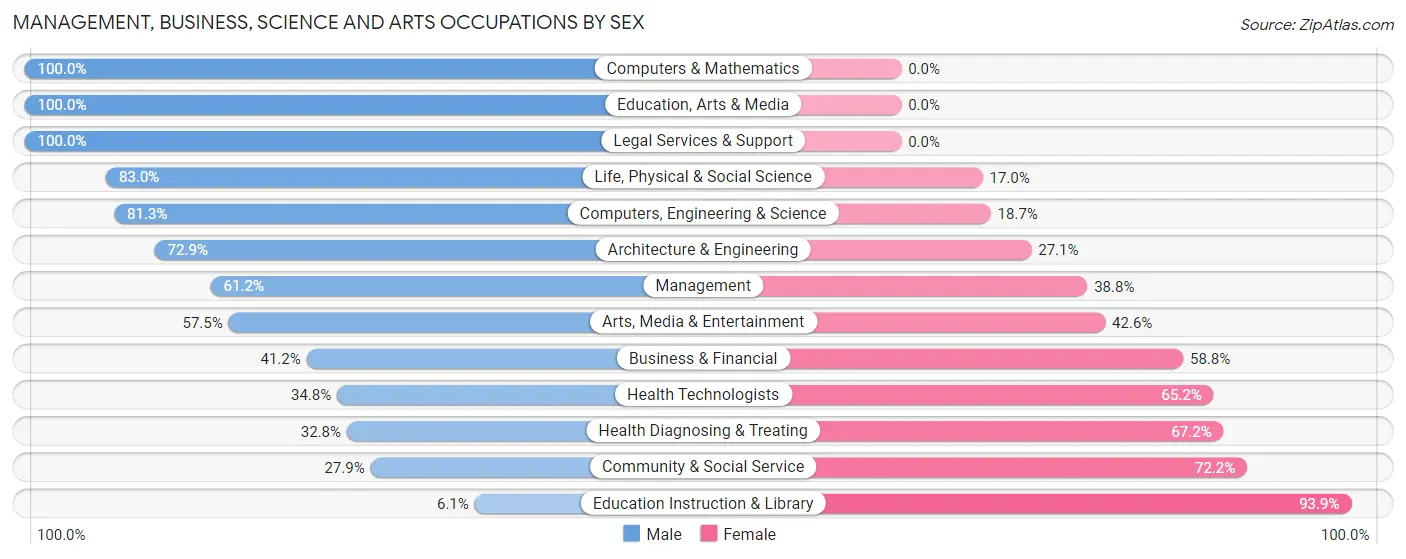
| Occupation | Male | Female |
| Management | 156 (61.2%) | 99 (38.8%) |
| Business & Financial | 84 (41.2%) | 120 (58.8%) |
| Computers, Engineering & Science | 122 (81.3%) | 28 (18.7%) |
| Computers & Mathematics | 27 (100.0%) | 0 (0.0%) |
| Architecture & Engineering | 51 (72.9%) | 19 (27.1%) |
| Life, Physical & Social Science | 44 (83.0%) | 9 (17.0%) |
| Community & Social Service | 61 (27.9%) | 158 (72.2%) |
| Education, Arts & Media | 10 (100.0%) | 0 (0.0%) |
| Legal Services & Support | 15 (100.0%) | 0 (0.0%) |
| Education Instruction & Library | 9 (6.1%) | 138 (93.9%) |
| Arts, Media & Entertainment | 27 (57.5%) | 20 (42.5%) |
| Health Diagnosing & Treating | 39 (32.8%) | 80 (67.2%) |
| Health Technologists | 39 (34.8%) | 73 (65.2%) |
| Total (Category) | 462 (48.8%) | 485 (51.2%) |
| Total (Overall) | 893 (52.4%) | 811 (47.6%) |
Services Occupations
The most common Services occupations in Sunnyslope are Food Preparation & Serving (131 | 7.7%), Security & Protection (93 | 5.5%), Firefighting & Prevention (81 | 4.8%), Cleaning & Maintenance (22 | 1.3%), and Law Enforcement (12 | 0.7%).
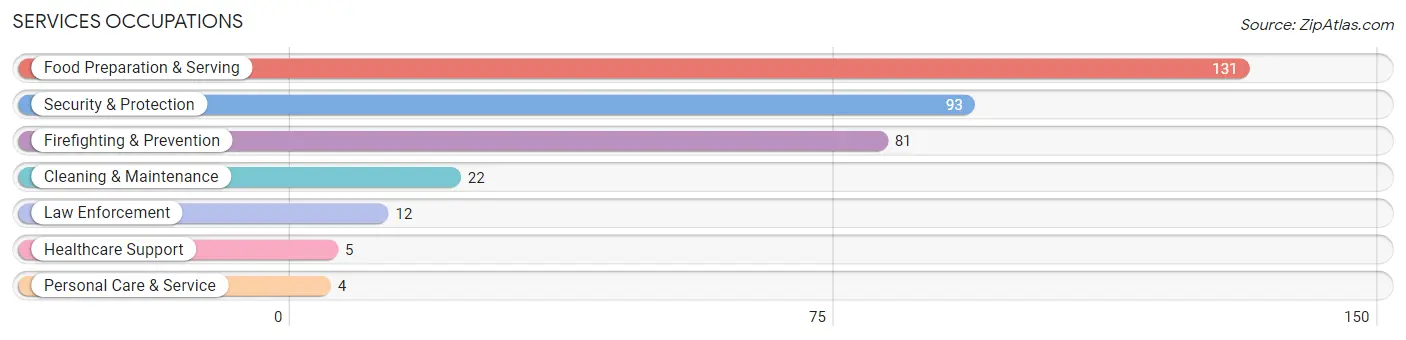
Services Occupations by Sex
Within the Services occupations in Sunnyslope, the most male-oriented occupations are Law Enforcement (100.0%), Security & Protection (92.5%), and Firefighting & Prevention (91.4%), while the most female-oriented occupations are Healthcare Support (100.0%), Personal Care & Service (100.0%), and Food Preparation & Serving (67.2%).
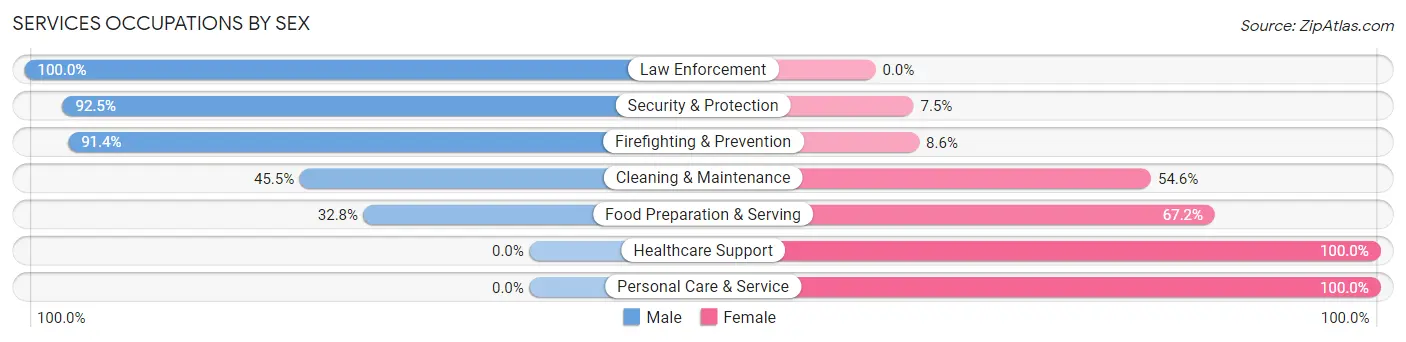
| Occupation | Male | Female |
| Healthcare Support | 0 (0.0%) | 5 (100.0%) |
| Security & Protection | 86 (92.5%) | 7 (7.5%) |
| Firefighting & Prevention | 74 (91.4%) | 7 (8.6%) |
| Law Enforcement | 12 (100.0%) | 0 (0.0%) |
| Food Preparation & Serving | 43 (32.8%) | 88 (67.2%) |
| Cleaning & Maintenance | 10 (45.5%) | 12 (54.5%) |
| Personal Care & Service | 0 (0.0%) | 4 (100.0%) |
| Total (Category) | 139 (54.5%) | 116 (45.5%) |
| Total (Overall) | 893 (52.4%) | 811 (47.6%) |
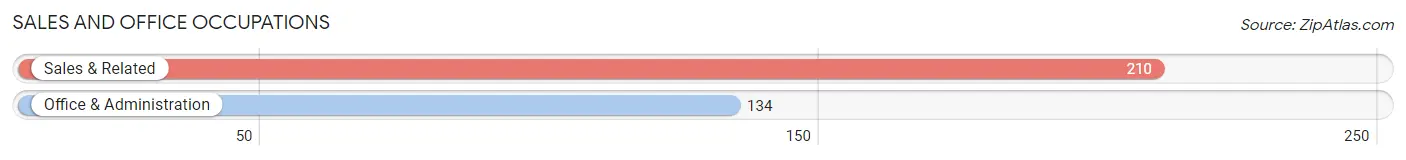
Sales and Office Occupations
The most common Sales and Office occupations in Sunnyslope are Sales & Related (210 | 12.3%), and Office & Administration (134 | 7.9%).
Sales and Office Occupations by Sex
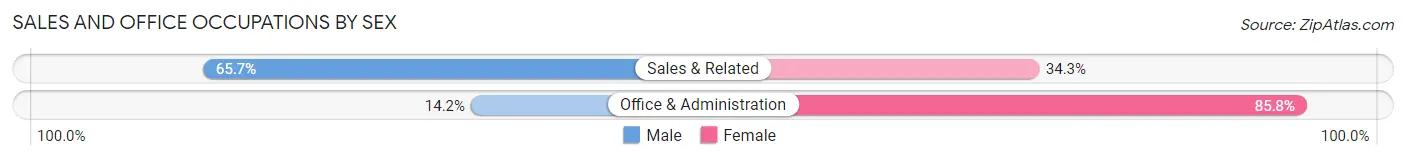
| Occupation | Male | Female |
| Sales & Related | 138 (65.7%) | 72 (34.3%) |
| Office & Administration | 19 (14.2%) | 115 (85.8%) |
| Total (Category) | 157 (45.6%) | 187 (54.4%) |
| Total (Overall) | 893 (52.4%) | 811 (47.6%) |
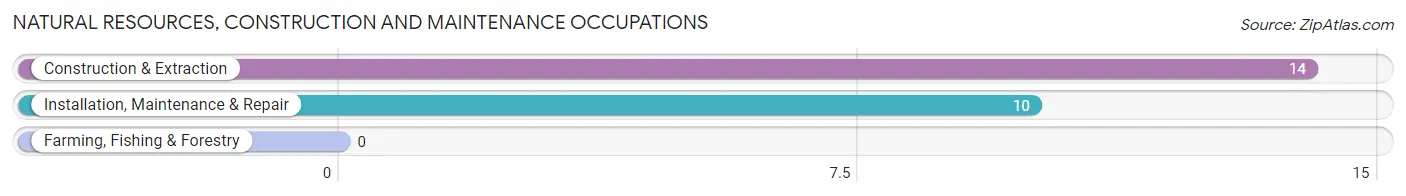
Natural Resources, Construction and Maintenance Occupations
The most common Natural Resources, Construction and Maintenance occupations in Sunnyslope are Construction & Extraction (14 | 0.8%), and Installation, Maintenance & Repair (10 | 0.6%).
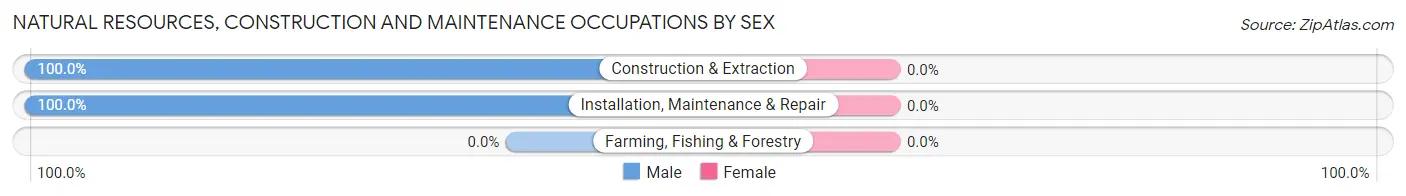
Natural Resources, Construction and Maintenance Occupations by Sex
| Occupation | Male | Female |
| Farming, Fishing & Forestry | 0 (0.0%) | 0 (0.0%) |
| Construction & Extraction | 14 (100.0%) | 0 (0.0%) |
| Installation, Maintenance & Repair | 10 (100.0%) | 0 (0.0%) |
| Total (Category) | 24 (100.0%) | 0 (0.0%) |
| Total (Overall) | 893 (52.4%) | 811 (47.6%) |
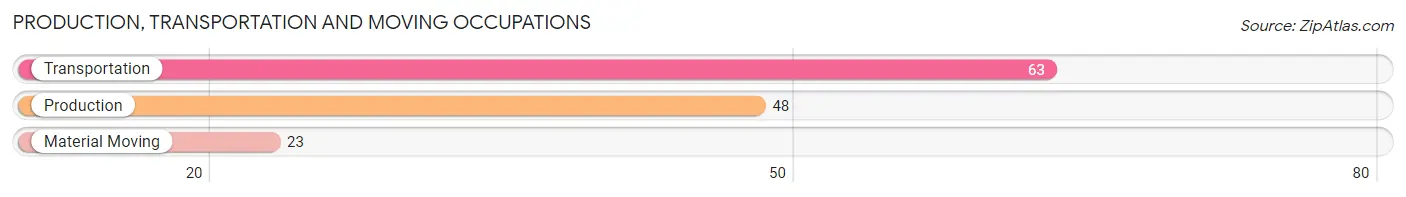
Production, Transportation and Moving Occupations
The most common Production, Transportation and Moving occupations in Sunnyslope are Transportation (63 | 3.7%), Production (48 | 2.8%), and Material Moving (23 | 1.3%).
Production, Transportation and Moving Occupations by Sex
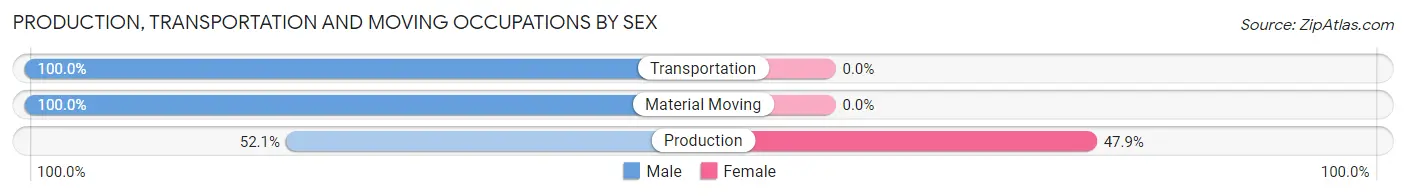
| Occupation | Male | Female |
| Production | 25 (52.1%) | 23 (47.9%) |
| Transportation | 63 (100.0%) | 0 (0.0%) |
| Material Moving | 23 (100.0%) | 0 (0.0%) |
| Total (Category) | 111 (82.8%) | 23 (17.2%) |
| Total (Overall) | 893 (52.4%) | 811 (47.6%) |
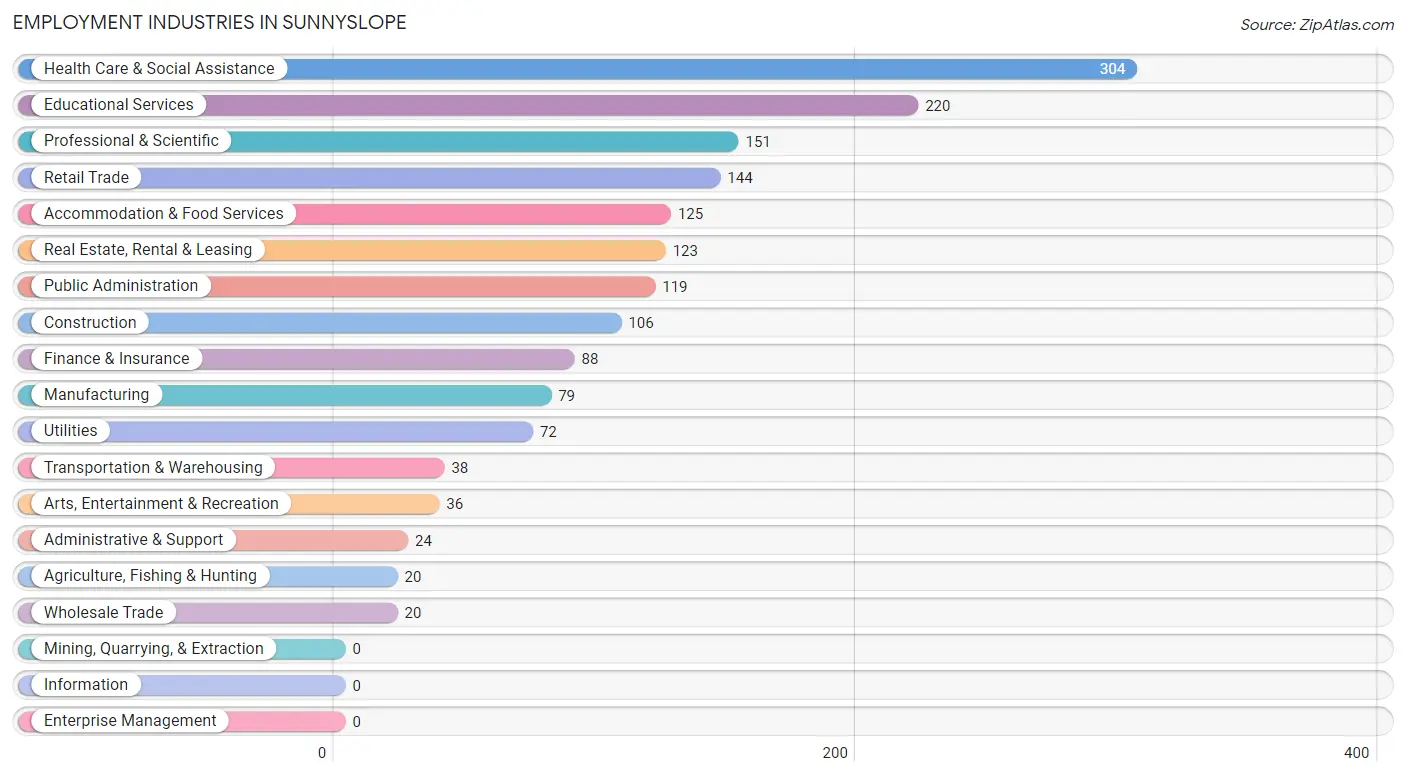
Employment Industries by Sex in Sunnyslope
Employment Industries in Sunnyslope
The major employment industries in Sunnyslope include Health Care & Social Assistance (304 | 17.8%), Educational Services (220 | 12.9%), Professional & Scientific (151 | 8.9%), Retail Trade (144 | 8.5%), and Accommodation & Food Services (125 | 7.3%).
Employment Industries by Sex in Sunnyslope
The Sunnyslope industries that see more men than women are Agriculture, Fishing & Hunting (100.0%), Transportation & Warehousing (100.0%), and Public Administration (94.1%), whereas the industries that tend to have a higher number of women are Wholesale Trade (100.0%), Educational Services (85.5%), and Accommodation & Food Services (77.6%).
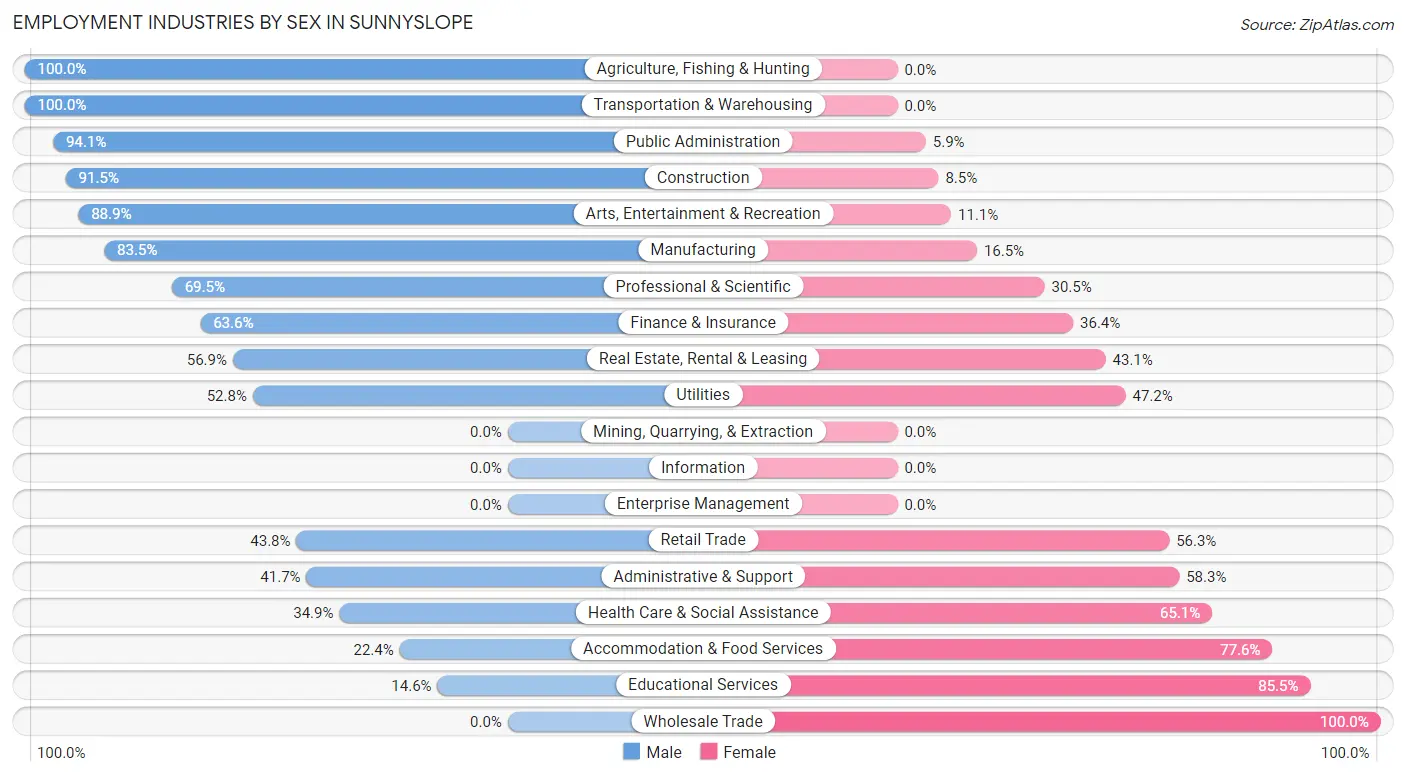
| Industry | Male | Female |
| Agriculture, Fishing & Hunting | 20 (100.0%) | 0 (0.0%) |
| Mining, Quarrying, & Extraction | 0 (0.0%) | 0 (0.0%) |
| Construction | 97 (91.5%) | 9 (8.5%) |
| Manufacturing | 66 (83.5%) | 13 (16.5%) |
| Wholesale Trade | 0 (0.0%) | 20 (100.0%) |
| Retail Trade | 63 (43.8%) | 81 (56.2%) |
| Transportation & Warehousing | 38 (100.0%) | 0 (0.0%) |
| Utilities | 38 (52.8%) | 34 (47.2%) |
| Information | 0 (0.0%) | 0 (0.0%) |
| Finance & Insurance | 56 (63.6%) | 32 (36.4%) |
| Real Estate, Rental & Leasing | 70 (56.9%) | 53 (43.1%) |
| Professional & Scientific | 105 (69.5%) | 46 (30.5%) |
| Enterprise Management | 0 (0.0%) | 0 (0.0%) |
| Administrative & Support | 10 (41.7%) | 14 (58.3%) |
| Educational Services | 32 (14.5%) | 188 (85.5%) |
| Health Care & Social Assistance | 106 (34.9%) | 198 (65.1%) |
| Arts, Entertainment & Recreation | 32 (88.9%) | 4 (11.1%) |
| Accommodation & Food Services | 28 (22.4%) | 97 (77.6%) |
| Public Administration | 112 (94.1%) | 7 (5.9%) |
| Total | 893 (52.4%) | 811 (47.6%) |
Education in Sunnyslope
School Enrollment in Sunnyslope
The most common levels of schooling among the 810 students in Sunnyslope are elementary school (221 | 27.3%), middle school (212 | 26.2%), and high school (132 | 16.3%).
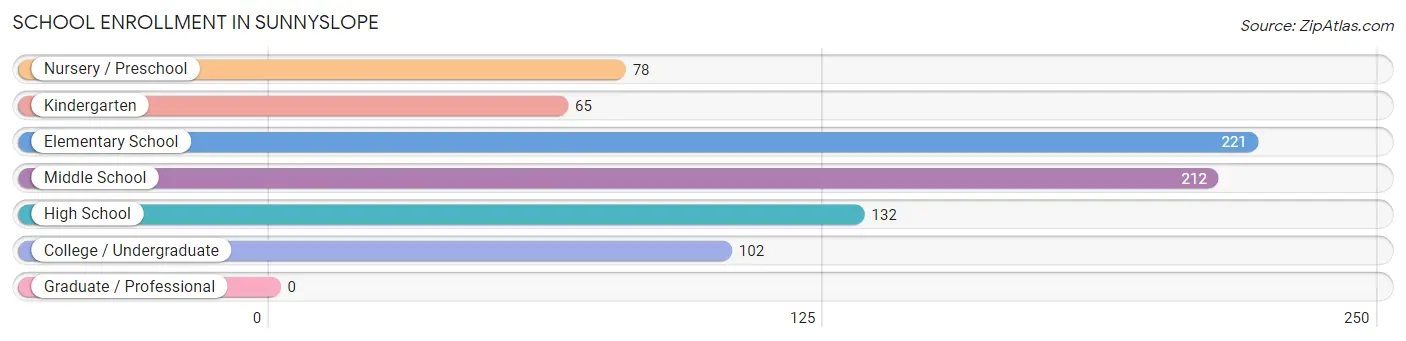
| School Level | # Students | % Students |
| Nursery / Preschool | 78 | 9.6% |
| Kindergarten | 65 | 8.0% |
| Elementary School | 221 | 27.3% |
| Middle School | 212 | 26.2% |
| High School | 132 | 16.3% |
| College / Undergraduate | 102 | 12.6% |
| Graduate / Professional | 0 | 0.0% |
| Total | 810 | 100.0% |
School Enrollment by Age by Funding Source in Sunnyslope
Out of a total of 810 students who are enrolled in schools in Sunnyslope, 62 (7.7%) attend a private institution, while the remaining 748 (92.3%) are enrolled in public schools. The age group of 35 years and over has the highest likelihood of being enrolled in private schools, with 25 (58.1% in the age bracket) enrolled. Conversely, the age group of 10 to 14 year olds has the lowest likelihood of being enrolled in a private school, with 248 (100.0% in the age bracket) attending a public institution.
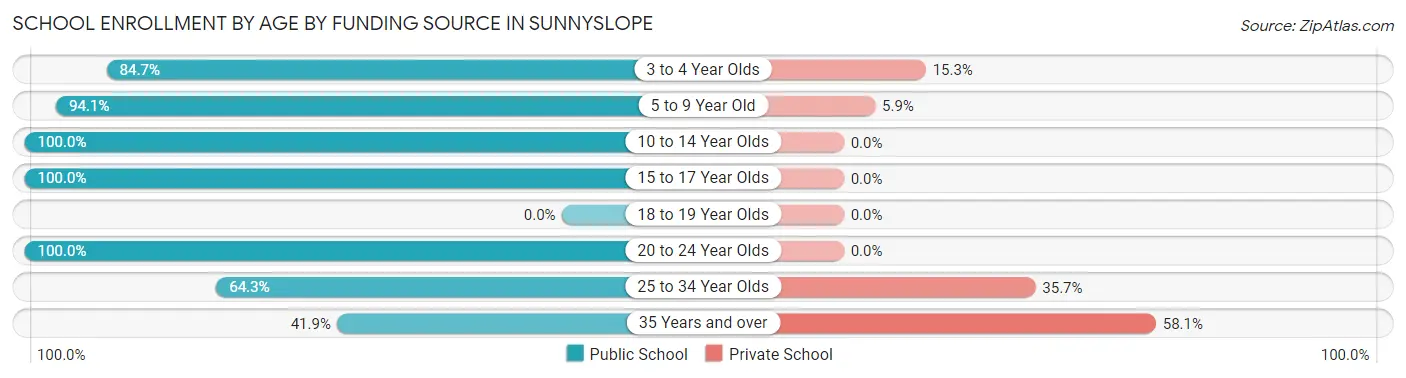
| Age Bracket | Public School | Private School |
| 3 to 4 Year Olds | 61 (84.7%) | 11 (15.3%) |
| 5 to 9 Year Old | 257 (94.1%) | 16 (5.9%) |
| 10 to 14 Year Olds | 248 (100.0%) | 0 (0.0%) |
| 15 to 17 Year Olds | 115 (100.0%) | 0 (0.0%) |
| 18 to 19 Year Olds | 0 (0.0%) | 0 (0.0%) |
| 20 to 24 Year Olds | 31 (100.0%) | 0 (0.0%) |
| 25 to 34 Year Olds | 18 (64.3%) | 10 (35.7%) |
| 35 Years and over | 18 (41.9%) | 25 (58.1%) |
| Total | 748 (92.3%) | 62 (7.7%) |
Educational Attainment by Field of Study in Sunnyslope
Business (271 | 23.5%), social sciences (123 | 10.7%), education (123 | 10.7%), bio, nature & agricultural (117 | 10.2%), and science & technology (114 | 9.9%) are the most common fields of study among 1,153 individuals in Sunnyslope who have obtained a bachelor's degree or higher.
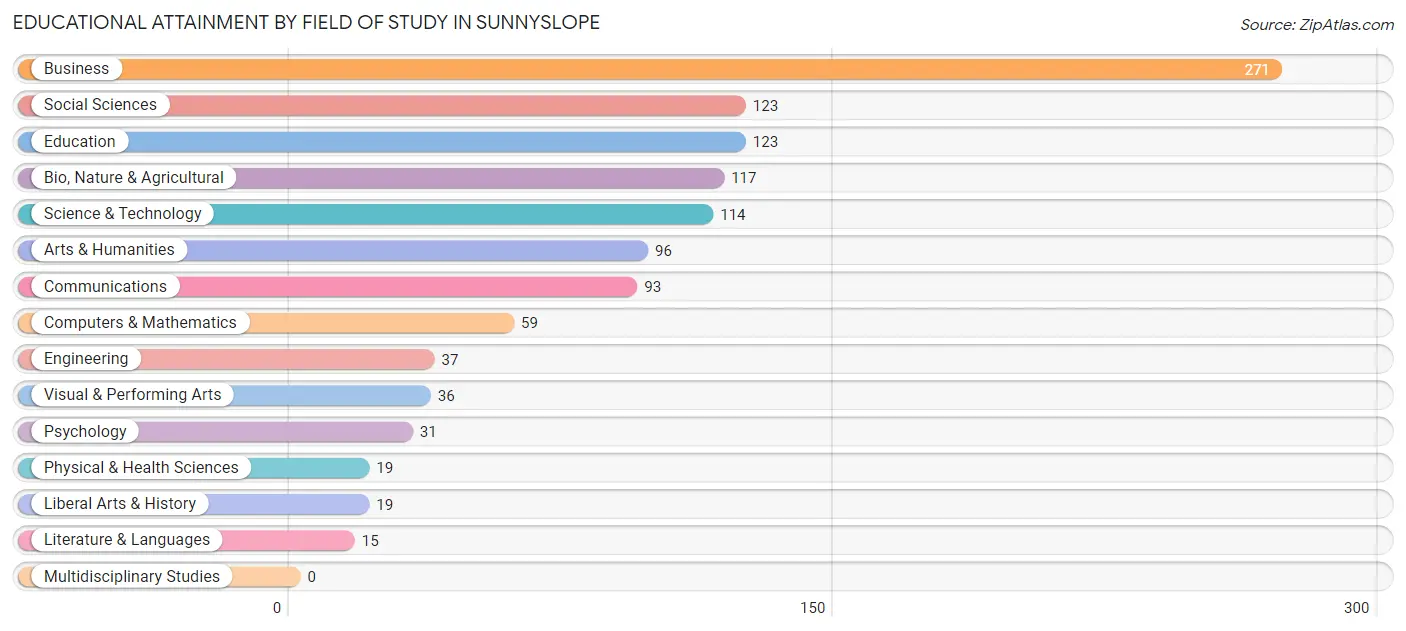
| Field of Study | # Graduates | % Graduates |
| Computers & Mathematics | 59 | 5.1% |
| Bio, Nature & Agricultural | 117 | 10.2% |
| Physical & Health Sciences | 19 | 1.7% |
| Psychology | 31 | 2.7% |
| Social Sciences | 123 | 10.7% |
| Engineering | 37 | 3.2% |
| Multidisciplinary Studies | 0 | 0.0% |
| Science & Technology | 114 | 9.9% |
| Business | 271 | 23.5% |
| Education | 123 | 10.7% |
| Literature & Languages | 15 | 1.3% |
| Liberal Arts & History | 19 | 1.7% |
| Visual & Performing Arts | 36 | 3.1% |
| Communications | 93 | 8.1% |
| Arts & Humanities | 96 | 8.3% |
| Total | 1,153 | 100.0% |
Transportation & Commute in Sunnyslope
Vehicle Availability by Sex in Sunnyslope
The most prevalent vehicle ownership categories in Sunnyslope are males with 3 vehicles (403, accounting for 45.4%) and females with 3 vehicles (359, making up 49.7%).
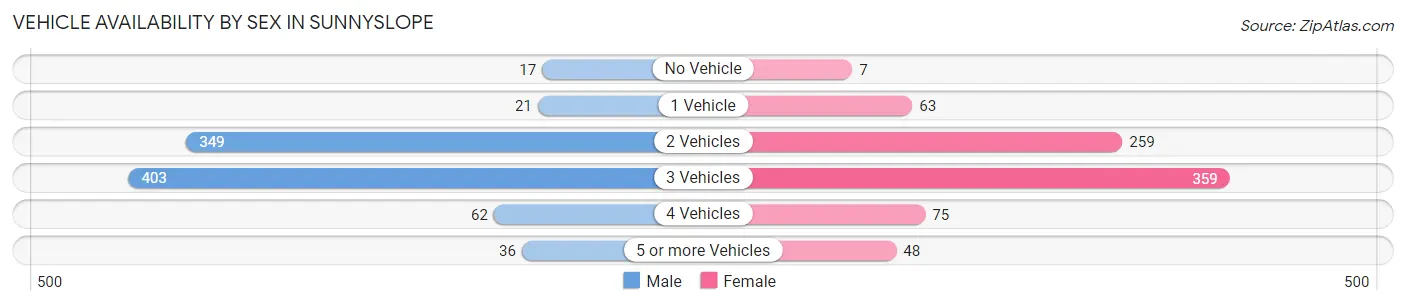
| Vehicles Available | Male | Female |
| No Vehicle | 17 (1.9%) | 7 (0.9%) |
| 1 Vehicle | 21 (2.4%) | 63 (7.8%) |
| 2 Vehicles | 349 (39.3%) | 259 (31.9%) |
| 3 Vehicles | 403 (45.4%) | 359 (44.3%) |
| 4 Vehicles | 62 (7.0%) | 75 (9.2%) |
| 5 or more Vehicles | 36 (4.1%) | 48 (5.9%) |
| Total | 888 (100.0%) | 811 (100.0%) |
Commute Time in Sunnyslope
The most frequently occuring commute durations in Sunnyslope are 15 to 19 minutes (382 commuters, 26.1%), 10 to 14 minutes (314 commuters, 21.5%), and 20 to 24 minutes (241 commuters, 16.5%).
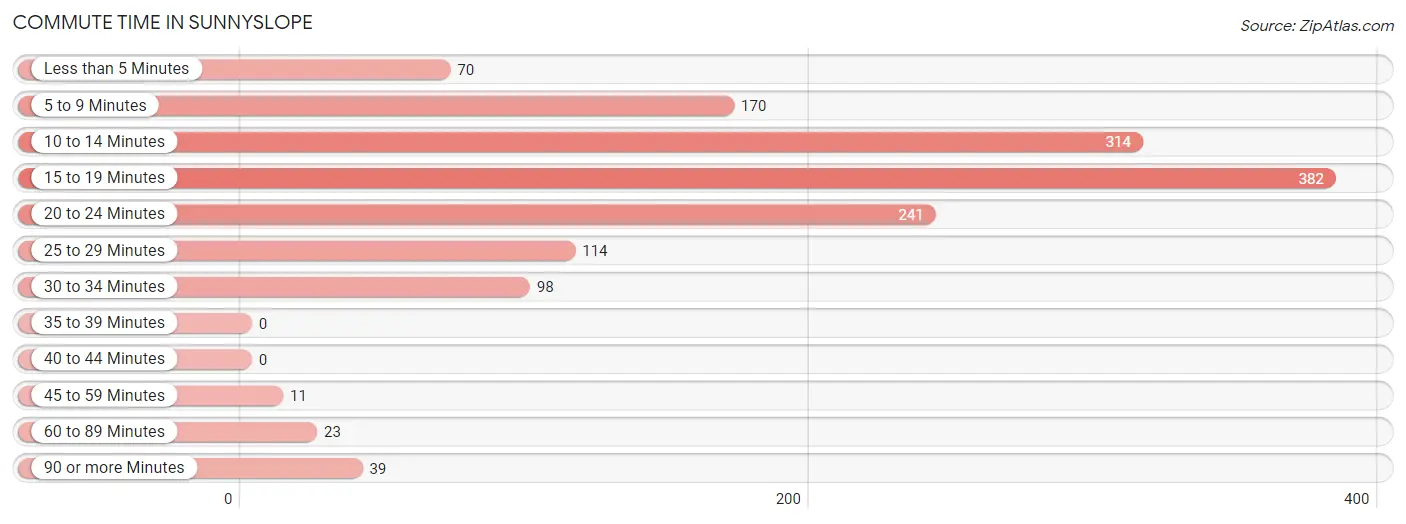
| Commute Time | # Commuters | % Commuters |
| Less than 5 Minutes | 70 | 4.8% |
| 5 to 9 Minutes | 170 | 11.6% |
| 10 to 14 Minutes | 314 | 21.5% |
| 15 to 19 Minutes | 382 | 26.1% |
| 20 to 24 Minutes | 241 | 16.5% |
| 25 to 29 Minutes | 114 | 7.8% |
| 30 to 34 Minutes | 98 | 6.7% |
| 35 to 39 Minutes | 0 | 0.0% |
| 40 to 44 Minutes | 0 | 0.0% |
| 45 to 59 Minutes | 11 | 0.7% |
| 60 to 89 Minutes | 23 | 1.6% |
| 90 or more Minutes | 39 | 2.7% |
Commute Time by Sex in Sunnyslope
The most common commute times in Sunnyslope are 15 to 19 minutes (292 commuters, 38.9%) for males and 10 to 14 minutes (216 commuters, 30.4%) for females.
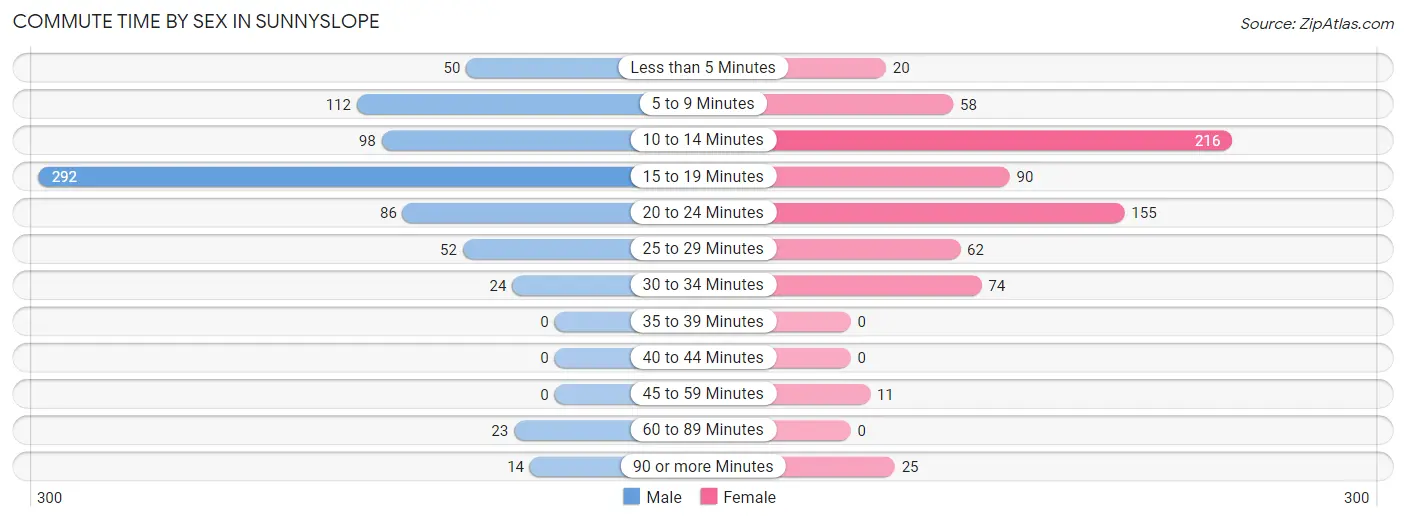
| Commute Time | Male | Female |
| Less than 5 Minutes | 50 (6.7%) | 20 (2.8%) |
| 5 to 9 Minutes | 112 (14.9%) | 58 (8.2%) |
| 10 to 14 Minutes | 98 (13.1%) | 216 (30.4%) |
| 15 to 19 Minutes | 292 (38.9%) | 90 (12.7%) |
| 20 to 24 Minutes | 86 (11.5%) | 155 (21.8%) |
| 25 to 29 Minutes | 52 (6.9%) | 62 (8.7%) |
| 30 to 34 Minutes | 24 (3.2%) | 74 (10.4%) |
| 35 to 39 Minutes | 0 (0.0%) | 0 (0.0%) |
| 40 to 44 Minutes | 0 (0.0%) | 0 (0.0%) |
| 45 to 59 Minutes | 0 (0.0%) | 11 (1.5%) |
| 60 to 89 Minutes | 23 (3.1%) | 0 (0.0%) |
| 90 or more Minutes | 14 (1.9%) | 25 (3.5%) |
Time of Departure to Work by Sex in Sunnyslope
The most frequent times of departure to work in Sunnyslope are 7:00 AM to 7:29 AM (230, 30.6%) for males and 7:00 AM to 7:29 AM (187, 26.3%) for females.
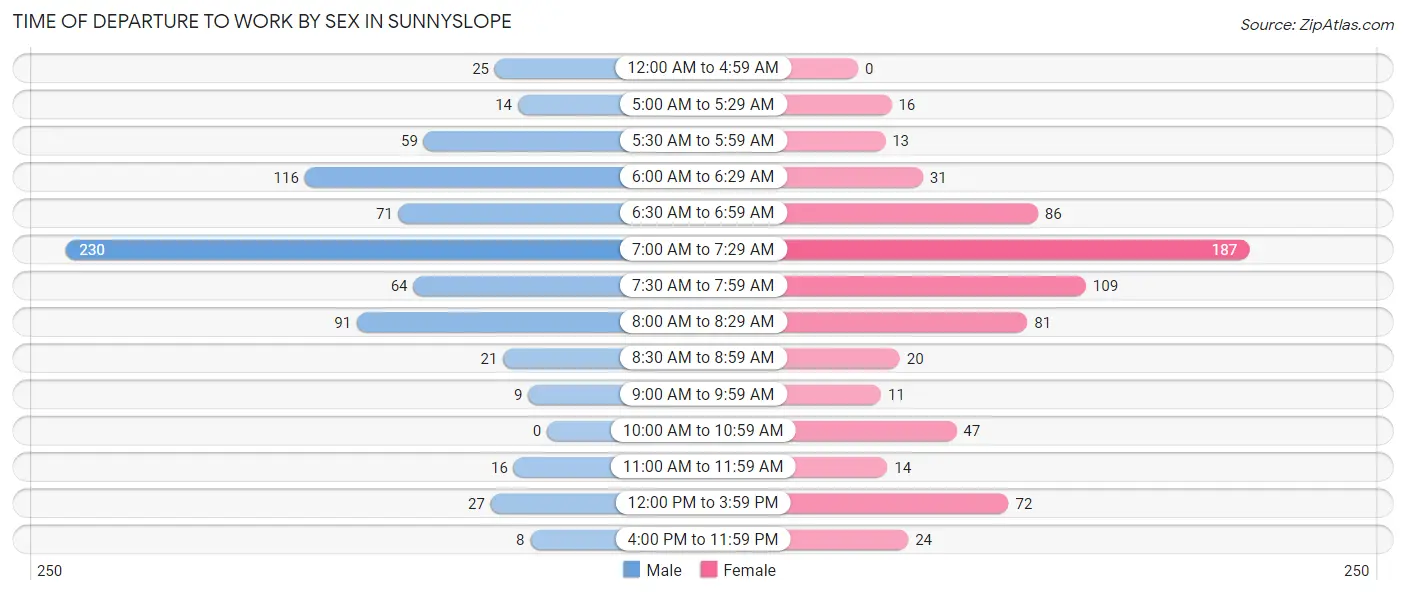
| Time of Departure | Male | Female |
| 12:00 AM to 4:59 AM | 25 (3.3%) | 0 (0.0%) |
| 5:00 AM to 5:29 AM | 14 (1.9%) | 16 (2.2%) |
| 5:30 AM to 5:59 AM | 59 (7.9%) | 13 (1.8%) |
| 6:00 AM to 6:29 AM | 116 (15.4%) | 31 (4.4%) |
| 6:30 AM to 6:59 AM | 71 (9.5%) | 86 (12.1%) |
| 7:00 AM to 7:29 AM | 230 (30.6%) | 187 (26.3%) |
| 7:30 AM to 7:59 AM | 64 (8.5%) | 109 (15.3%) |
| 8:00 AM to 8:29 AM | 91 (12.1%) | 81 (11.4%) |
| 8:30 AM to 8:59 AM | 21 (2.8%) | 20 (2.8%) |
| 9:00 AM to 9:59 AM | 9 (1.2%) | 11 (1.5%) |
| 10:00 AM to 10:59 AM | 0 (0.0%) | 47 (6.6%) |
| 11:00 AM to 11:59 AM | 16 (2.1%) | 14 (2.0%) |
| 12:00 PM to 3:59 PM | 27 (3.6%) | 72 (10.1%) |
| 4:00 PM to 11:59 PM | 8 (1.1%) | 24 (3.4%) |
| Total | 751 (100.0%) | 711 (100.0%) |
Housing Occupancy in Sunnyslope
Occupancy by Ownership in Sunnyslope
Of the total 1,338 dwellings in Sunnyslope, owner-occupied units account for 1,134 (84.8%), while renter-occupied units make up 204 (15.2%).
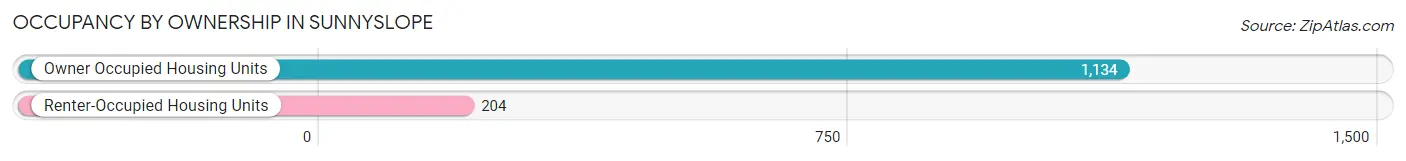
| Occupancy | # Housing Units | % Housing Units |
| Owner Occupied Housing Units | 1,134 | 84.8% |
| Renter-Occupied Housing Units | 204 | 15.2% |
| Total Occupied Housing Units | 1,338 | 100.0% |
Occupancy by Household Size in Sunnyslope
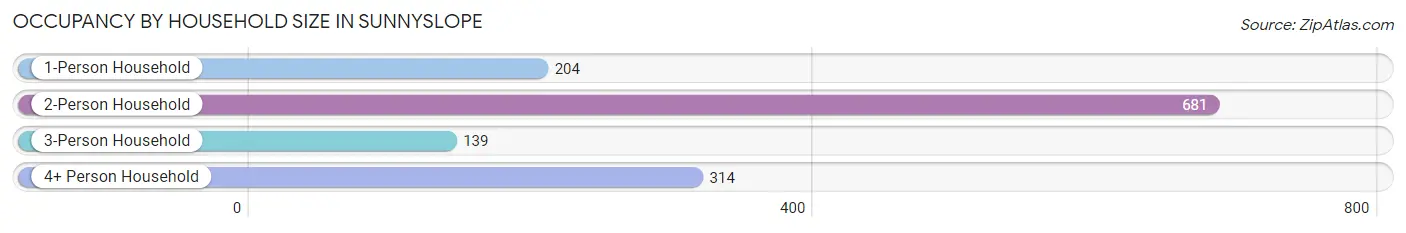
| Household Size | # Housing Units | % Housing Units |
| 1-Person Household | 204 | 15.2% |
| 2-Person Household | 681 | 50.9% |
| 3-Person Household | 139 | 10.4% |
| 4+ Person Household | 314 | 23.5% |
| Total Housing Units | 1,338 | 100.0% |
Occupancy by Ownership by Household Size in Sunnyslope
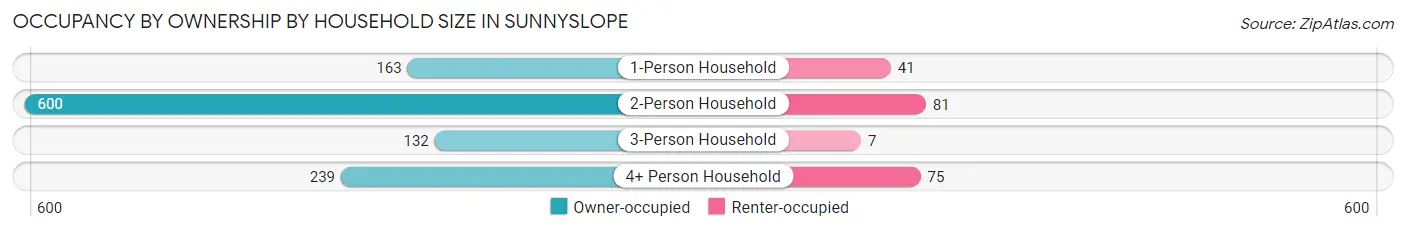
| Household Size | Owner-occupied | Renter-occupied |
| 1-Person Household | 163 (79.9%) | 41 (20.1%) |
| 2-Person Household | 600 (88.1%) | 81 (11.9%) |
| 3-Person Household | 132 (95.0%) | 7 (5.0%) |
| 4+ Person Household | 239 (76.1%) | 75 (23.9%) |
| Total Housing Units | 1,134 (84.8%) | 204 (15.2%) |
Occupancy by Educational Attainment in Sunnyslope
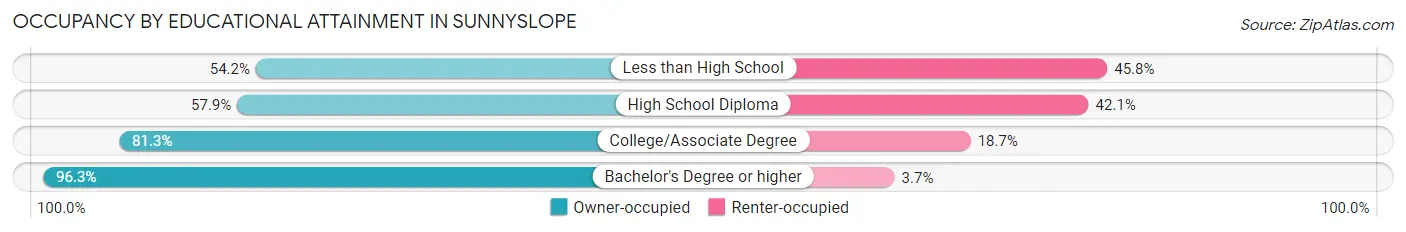
| Household Size | Owner-occupied | Renter-occupied |
| Less than High School | 13 (54.2%) | 11 (45.8%) |
| High School Diploma | 103 (57.9%) | 75 (42.1%) |
| College/Associate Degree | 412 (81.3%) | 95 (18.7%) |
| Bachelor's Degree or higher | 606 (96.3%) | 23 (3.7%) |
Occupancy by Age of Householder in Sunnyslope
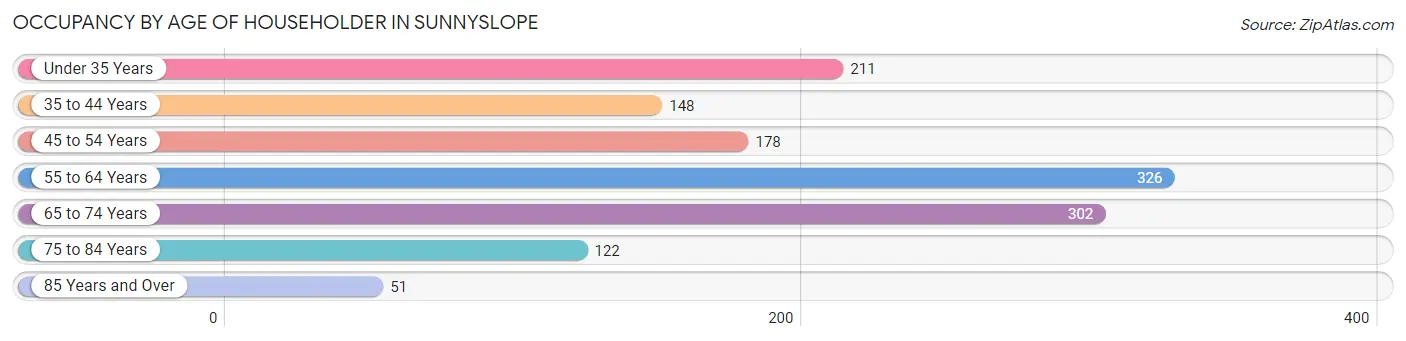
| Age Bracket | # Households | % Households |
| Under 35 Years | 211 | 15.8% |
| 35 to 44 Years | 148 | 11.1% |
| 45 to 54 Years | 178 | 13.3% |
| 55 to 64 Years | 326 | 24.4% |
| 65 to 74 Years | 302 | 22.6% |
| 75 to 84 Years | 122 | 9.1% |
| 85 Years and Over | 51 | 3.8% |
| Total | 1,338 | 100.0% |
Housing Finances in Sunnyslope
Median Income by Occupancy in Sunnyslope
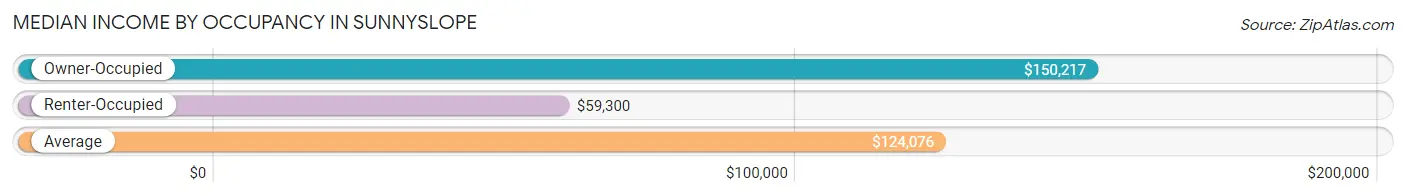
| Occupancy Type | # Households | Median Income |
| Owner-Occupied | 1,134 (84.8%) | $150,217 |
| Renter-Occupied | 204 (15.2%) | $59,300 |
| Average | 1,338 (100.0%) | $124,076 |
Occupancy by Householder Income Bracket in Sunnyslope
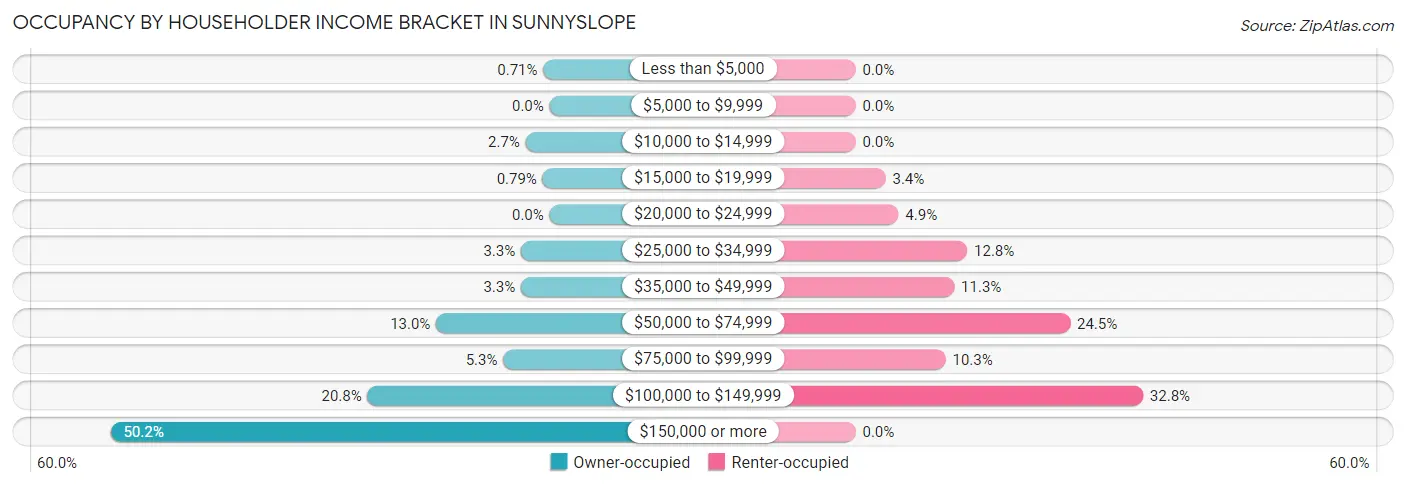
| Income Bracket | Owner-occupied | Renter-occupied |
| Less than $5,000 | 8 (0.7%) | 0 (0.0%) |
| $5,000 to $9,999 | 0 (0.0%) | 0 (0.0%) |
| $10,000 to $14,999 | 31 (2.7%) | 0 (0.0%) |
| $15,000 to $19,999 | 9 (0.8%) | 7 (3.4%) |
| $20,000 to $24,999 | 0 (0.0%) | 10 (4.9%) |
| $25,000 to $34,999 | 37 (3.3%) | 26 (12.8%) |
| $35,000 to $49,999 | 37 (3.3%) | 23 (11.3%) |
| $50,000 to $74,999 | 147 (13.0%) | 50 (24.5%) |
| $75,000 to $99,999 | 60 (5.3%) | 21 (10.3%) |
| $100,000 to $149,999 | 236 (20.8%) | 67 (32.8%) |
| $150,000 or more | 569 (50.2%) | 0 (0.0%) |
| Total | 1,134 (100.0%) | 204 (100.0%) |
Monthly Housing Cost Tiers in Sunnyslope
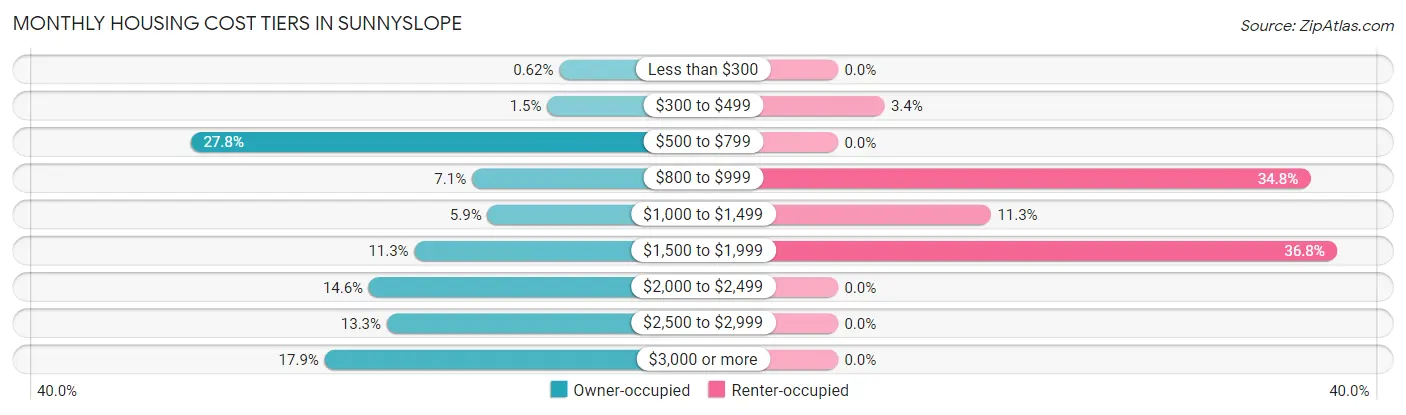
| Monthly Cost | Owner-occupied | Renter-occupied |
| Less than $300 | 7 (0.6%) | 0 (0.0%) |
| $300 to $499 | 17 (1.5%) | 7 (3.4%) |
| $500 to $799 | 315 (27.8%) | 0 (0.0%) |
| $800 to $999 | 80 (7.0%) | 71 (34.8%) |
| $1,000 to $1,499 | 67 (5.9%) | 23 (11.3%) |
| $1,500 to $1,999 | 128 (11.3%) | 75 (36.8%) |
| $2,000 to $2,499 | 166 (14.6%) | 0 (0.0%) |
| $2,500 to $2,999 | 151 (13.3%) | 0 (0.0%) |
| $3,000 or more | 203 (17.9%) | 0 (0.0%) |
| Total | 1,134 (100.0%) | 204 (100.0%) |
Physical Housing Characteristics in Sunnyslope
Housing Structures in Sunnyslope
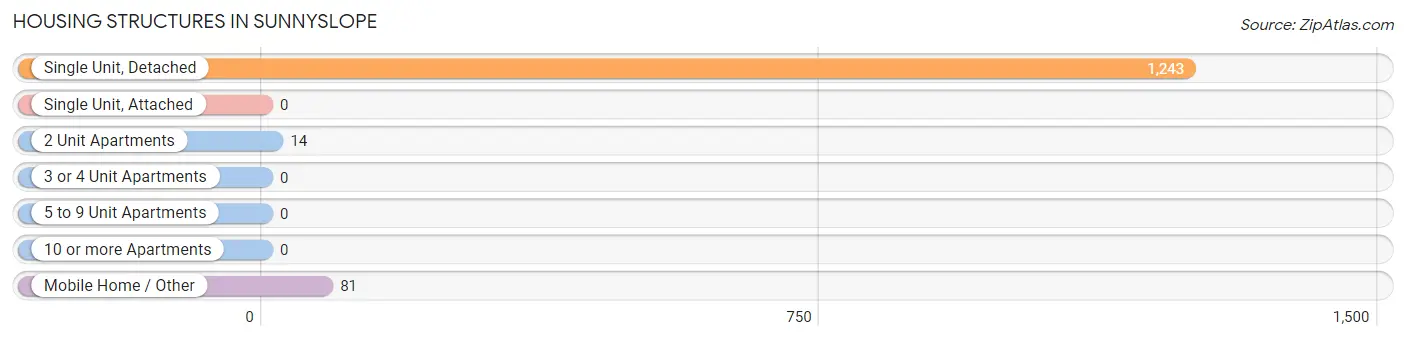
| Structure Type | # Housing Units | % Housing Units |
| Single Unit, Detached | 1,243 | 92.9% |
| Single Unit, Attached | 0 | 0.0% |
| 2 Unit Apartments | 14 | 1.1% |
| 3 or 4 Unit Apartments | 0 | 0.0% |
| 5 to 9 Unit Apartments | 0 | 0.0% |
| 10 or more Apartments | 0 | 0.0% |
| Mobile Home / Other | 81 | 6.0% |
| Total | 1,338 | 100.0% |
Housing Structures by Occupancy in Sunnyslope
| Structure Type | Owner-occupied | Renter-occupied |
| Single Unit, Detached | 1,080 (86.9%) | 163 (13.1%) |
| Single Unit, Attached | 0 (0.0%) | 0 (0.0%) |
| 2 Unit Apartments | 6 (42.9%) | 8 (57.1%) |
| 3 or 4 Unit Apartments | 0 (0.0%) | 0 (0.0%) |
| 5 to 9 Unit Apartments | 0 (0.0%) | 0 (0.0%) |
| 10 or more Apartments | 0 (0.0%) | 0 (0.0%) |
| Mobile Home / Other | 48 (59.3%) | 33 (40.7%) |
| Total | 1,134 (84.8%) | 204 (15.2%) |
Housing Structures by Number of Rooms in Sunnyslope
| Number of Rooms | Owner-occupied | Renter-occupied |
| 1 Room | 0 (0.0%) | 8 (3.9%) |
| 2 or 3 Rooms | 13 (1.1%) | 67 (32.8%) |
| 4 or 5 Rooms | 250 (22.1%) | 70 (34.3%) |
| 6 or 7 Rooms | 345 (30.4%) | 59 (28.9%) |
| 8 or more Rooms | 526 (46.4%) | 0 (0.0%) |
| Total | 1,134 (100.0%) | 204 (100.0%) |
Housing Structure by Heating Type in Sunnyslope
| Heating Type | Owner-occupied | Renter-occupied |
| Utility Gas | 6 (0.5%) | 0 (0.0%) |
| Bottled, Tank, or LP Gas | 0 (0.0%) | 0 (0.0%) |
| Electricity | 1,121 (98.9%) | 204 (100.0%) |
| Fuel Oil or Kerosene | 0 (0.0%) | 0 (0.0%) |
| Coal or Coke | 0 (0.0%) | 0 (0.0%) |
| All other Fuels | 7 (0.6%) | 0 (0.0%) |
| No Fuel Used | 0 (0.0%) | 0 (0.0%) |
| Total | 1,134 (100.0%) | 204 (100.0%) |
Household Vehicle Usage in Sunnyslope
| Vehicles per Household | Owner-occupied | Renter-occupied |
| No Vehicle | 17 (1.5%) | 12 (5.9%) |
| 1 Vehicle | 114 (10.1%) | 62 (30.4%) |
| 2 Vehicles | 421 (37.1%) | 113 (55.4%) |
| 3 or more Vehicles | 582 (51.3%) | 17 (8.3%) |
| Total | 1,134 (100.0%) | 204 (100.0%) |
Real Estate & Mortgages in Sunnyslope
Real Estate and Mortgage Overview in Sunnyslope
| Characteristic | Without Mortgage | With Mortgage |
| Housing Units | 408 | 726 |
| Median Property Value | $579,200 | $632,000 |
| Median Household Income | $111,771 | $449 |
| Monthly Housing Costs | $675 | $203 |
| Real Estate Taxes | $5,086 | $0 |
Property Value by Mortgage Status in Sunnyslope
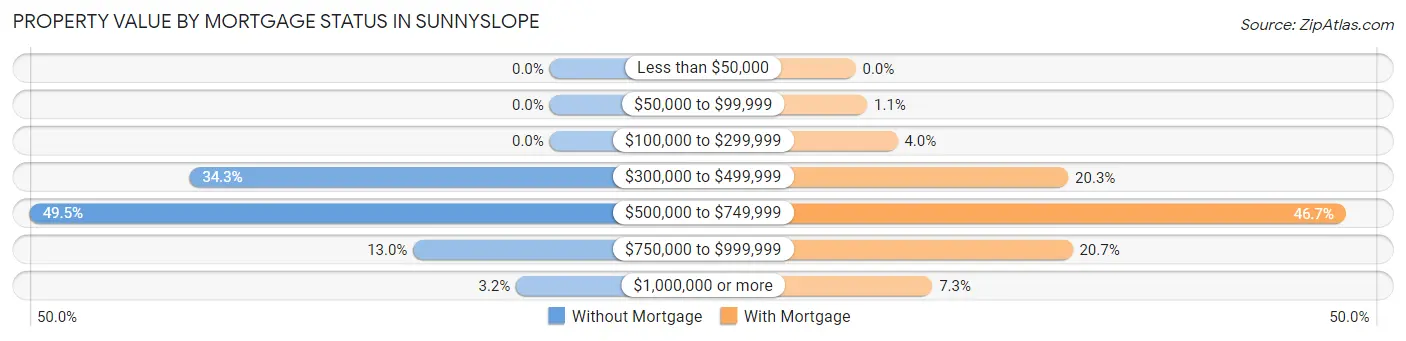
| Property Value | Without Mortgage | With Mortgage |
| Less than $50,000 | 0 (0.0%) | 0 (0.0%) |
| $50,000 to $99,999 | 0 (0.0%) | 8 (1.1%) |
| $100,000 to $299,999 | 0 (0.0%) | 29 (4.0%) |
| $300,000 to $499,999 | 140 (34.3%) | 147 (20.3%) |
| $500,000 to $749,999 | 202 (49.5%) | 339 (46.7%) |
| $750,000 to $999,999 | 53 (13.0%) | 150 (20.7%) |
| $1,000,000 or more | 13 (3.2%) | 53 (7.3%) |
| Total | 408 (100.0%) | 726 (100.0%) |
Household Income by Mortgage Status in Sunnyslope
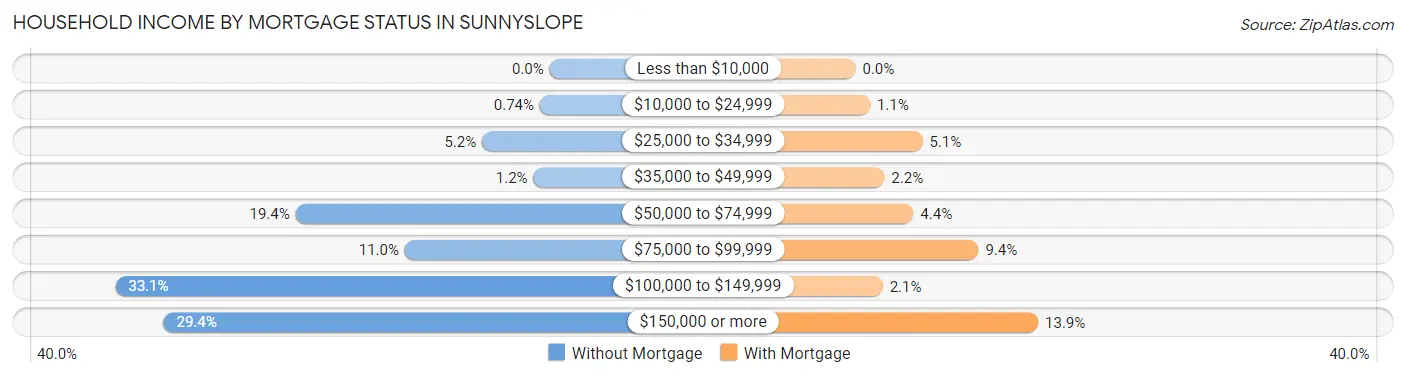
| Household Income | Without Mortgage | With Mortgage |
| Less than $10,000 | 0 (0.0%) | 0 (0.0%) |
| $10,000 to $24,999 | 3 (0.7%) | 8 (1.1%) |
| $25,000 to $34,999 | 21 (5.1%) | 37 (5.1%) |
| $35,000 to $49,999 | 5 (1.2%) | 16 (2.2%) |
| $50,000 to $74,999 | 79 (19.4%) | 32 (4.4%) |
| $75,000 to $99,999 | 45 (11.0%) | 68 (9.4%) |
| $100,000 to $149,999 | 135 (33.1%) | 15 (2.1%) |
| $150,000 or more | 120 (29.4%) | 101 (13.9%) |
| Total | 408 (100.0%) | 726 (100.0%) |
Property Value to Household Income Ratio in Sunnyslope
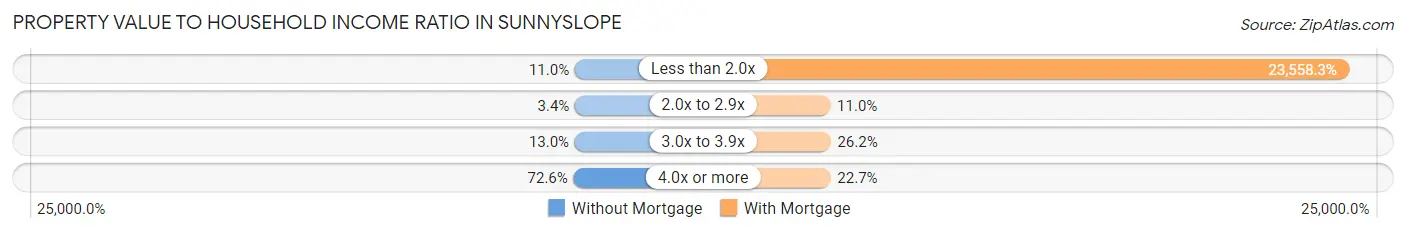
| Value-to-Income Ratio | Without Mortgage | With Mortgage |
| Less than 2.0x | 45 (11.0%) | 171,033 (23,558.3%) |
| 2.0x to 2.9x | 14 (3.4%) | 80 (11.0%) |
| 3.0x to 3.9x | 53 (13.0%) | 190 (26.2%) |
| 4.0x or more | 296 (72.6%) | 165 (22.7%) |
| Total | 408 (100.0%) | 726 (100.0%) |
Real Estate Taxes by Mortgage Status in Sunnyslope
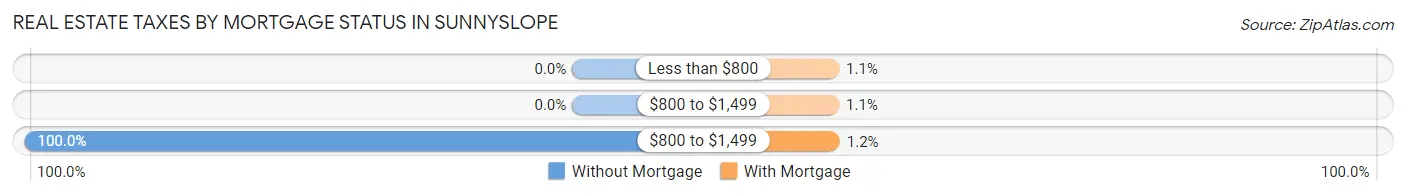
| Property Taxes | Without Mortgage | With Mortgage |
| Less than $800 | 0 (0.0%) | 8 (1.1%) |
| $800 to $1,499 | 0 (0.0%) | 8 (1.1%) |
| $800 to $1,499 | 408 (100.0%) | 9 (1.2%) |
| Total | 408 (100.0%) | 726 (100.0%) |
Health & Disability in Sunnyslope
Health Insurance Coverage by Age in Sunnyslope
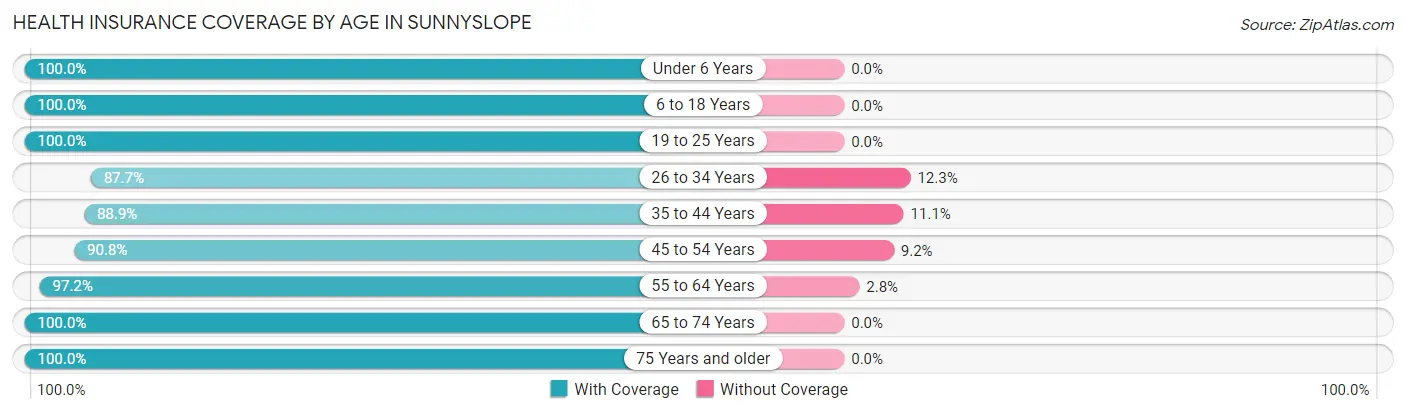
| Age Bracket | With Coverage | Without Coverage |
| Under 6 Years | 341 (100.0%) | 0 (0.0%) |
| 6 to 18 Years | 624 (100.0%) | 0 (0.0%) |
| 19 to 25 Years | 134 (100.0%) | 0 (0.0%) |
| 26 to 34 Years | 277 (87.7%) | 39 (12.3%) |
| 35 to 44 Years | 257 (88.9%) | 32 (11.1%) |
| 45 to 54 Years | 393 (90.8%) | 40 (9.2%) |
| 55 to 64 Years | 553 (97.2%) | 16 (2.8%) |
| 65 to 74 Years | 528 (100.0%) | 0 (0.0%) |
| 75 Years and older | 319 (100.0%) | 0 (0.0%) |
| Total | 3,426 (96.4%) | 127 (3.6%) |
Health Insurance Coverage by Citizenship Status in Sunnyslope
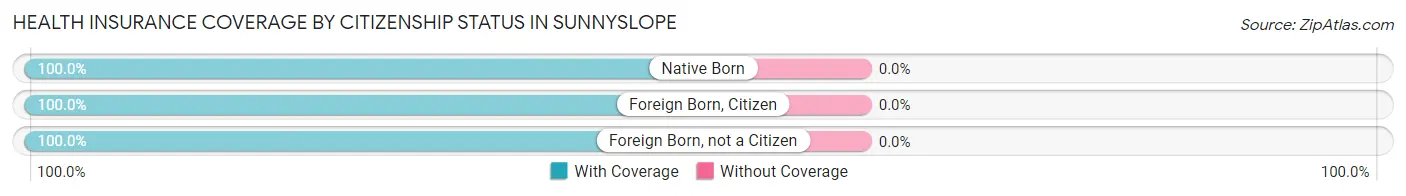
| Citizenship Status | With Coverage | Without Coverage |
| Native Born | 341 (100.0%) | 0 (0.0%) |
| Foreign Born, Citizen | 624 (100.0%) | 0 (0.0%) |
| Foreign Born, not a Citizen | 134 (100.0%) | 0 (0.0%) |
Health Insurance Coverage by Household Income in Sunnyslope
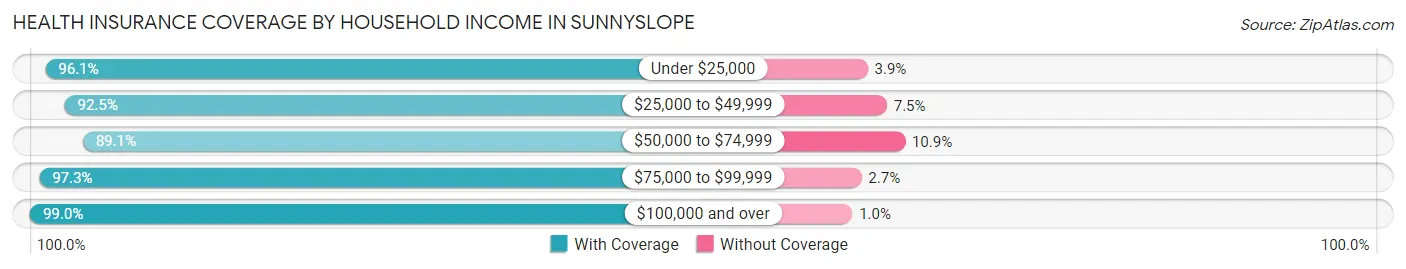
| Household Income | With Coverage | Without Coverage |
| Under $25,000 | 74 (96.1%) | 3 (3.9%) |
| $25,000 to $49,999 | 321 (92.5%) | 26 (7.5%) |
| $50,000 to $74,999 | 564 (89.1%) | 69 (10.9%) |
| $75,000 to $99,999 | 213 (97.3%) | 6 (2.7%) |
| $100,000 and over | 2,236 (99.0%) | 23 (1.0%) |
Public vs Private Health Insurance Coverage by Age in Sunnyslope
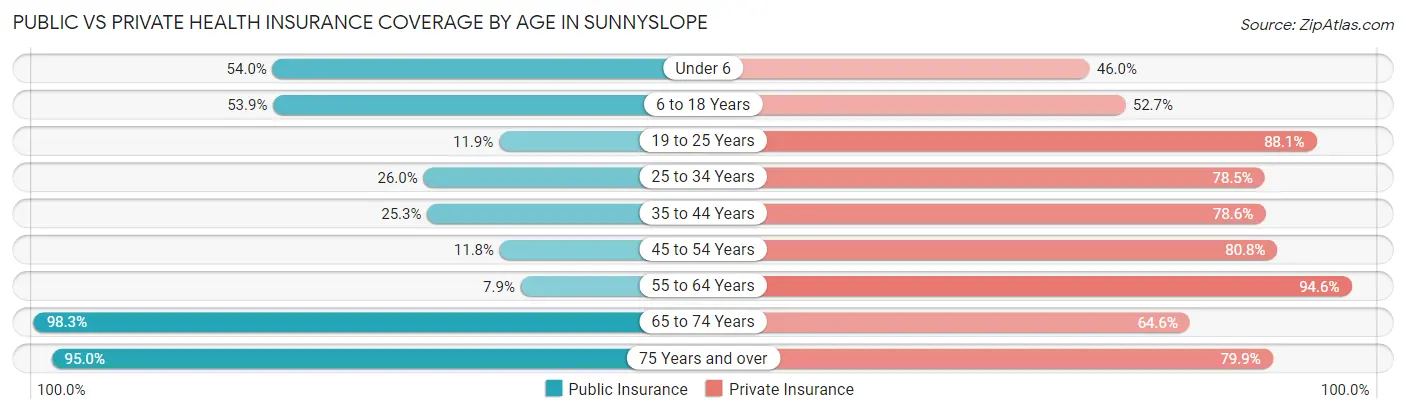
| Age Bracket | Public Insurance | Private Insurance |
| Under 6 | 184 (54.0%) | 157 (46.0%) |
| 6 to 18 Years | 336 (53.8%) | 329 (52.7%) |
| 19 to 25 Years | 16 (11.9%) | 118 (88.1%) |
| 25 to 34 Years | 82 (26.0%) | 248 (78.5%) |
| 35 to 44 Years | 73 (25.3%) | 227 (78.5%) |
| 45 to 54 Years | 51 (11.8%) | 350 (80.8%) |
| 55 to 64 Years | 45 (7.9%) | 538 (94.6%) |
| 65 to 74 Years | 519 (98.3%) | 341 (64.6%) |
| 75 Years and over | 303 (95.0%) | 255 (79.9%) |
| Total | 1,609 (45.3%) | 2,563 (72.1%) |
Disability Status by Sex by Age in Sunnyslope
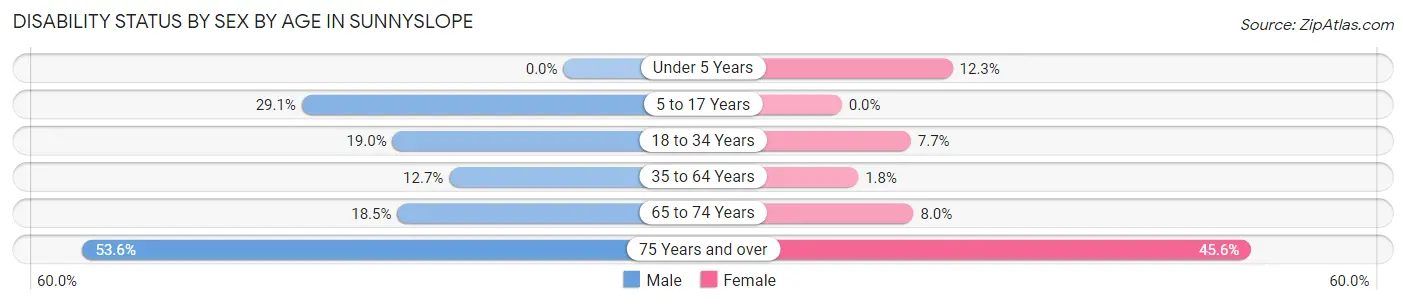
| Age Bracket | Male | Female |
| Under 5 Years | 0 (0.0%) | 19 (12.3%) |
| 5 to 17 Years | 102 (29.1%) | 0 (0.0%) |
| 18 to 34 Years | 47 (19.0%) | 17 (7.7%) |
| 35 to 64 Years | 81 (12.7%) | 12 (1.8%) |
| 65 to 74 Years | 49 (18.5%) | 21 (8.0%) |
| 75 Years and over | 98 (53.5%) | 62 (45.6%) |
Disability Class by Sex by Age in Sunnyslope
Disability Class: Hearing Difficulty
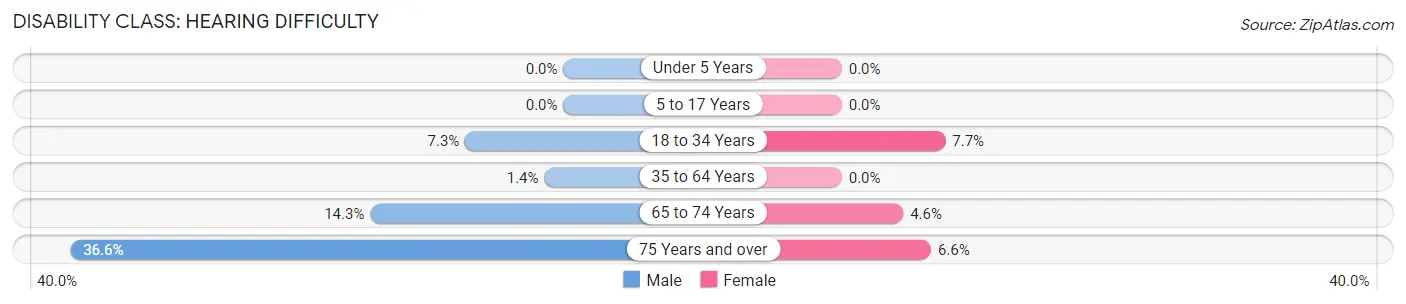
| Age Bracket | Male | Female |
| Under 5 Years | 0 (0.0%) | 0 (0.0%) |
| 5 to 17 Years | 0 (0.0%) | 0 (0.0%) |
| 18 to 34 Years | 18 (7.3%) | 17 (7.7%) |
| 35 to 64 Years | 9 (1.4%) | 0 (0.0%) |
| 65 to 74 Years | 38 (14.3%) | 12 (4.6%) |
| 75 Years and over | 67 (36.6%) | 9 (6.6%) |
Disability Class: Vision Difficulty
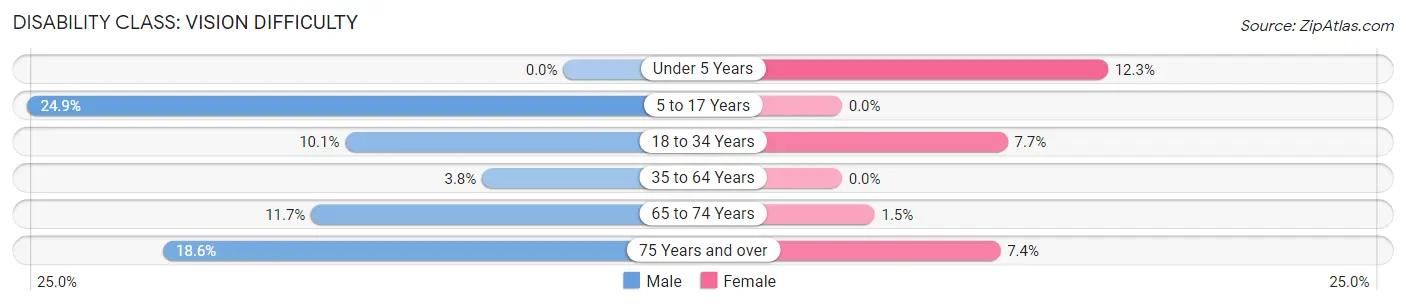
| Age Bracket | Male | Female |
| Under 5 Years | 0 (0.0%) | 19 (12.3%) |
| 5 to 17 Years | 87 (24.9%) | 0 (0.0%) |
| 18 to 34 Years | 25 (10.1%) | 17 (7.7%) |
| 35 to 64 Years | 24 (3.8%) | 0 (0.0%) |
| 65 to 74 Years | 31 (11.7%) | 4 (1.5%) |
| 75 Years and over | 34 (18.6%) | 10 (7.3%) |
Disability Class: Cognitive Difficulty
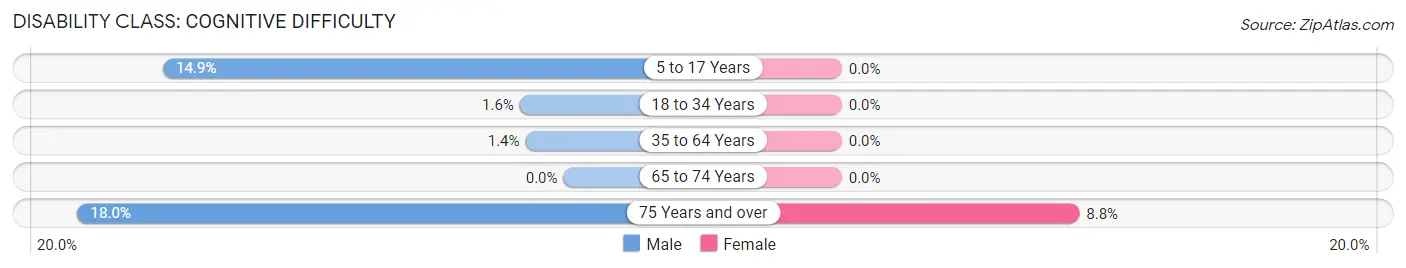
| Age Bracket | Male | Female |
| 5 to 17 Years | 52 (14.9%) | 0 (0.0%) |
| 18 to 34 Years | 4 (1.6%) | 0 (0.0%) |
| 35 to 64 Years | 9 (1.4%) | 0 (0.0%) |
| 65 to 74 Years | 0 (0.0%) | 0 (0.0%) |
| 75 Years and over | 33 (18.0%) | 12 (8.8%) |
Disability Class: Ambulatory Difficulty
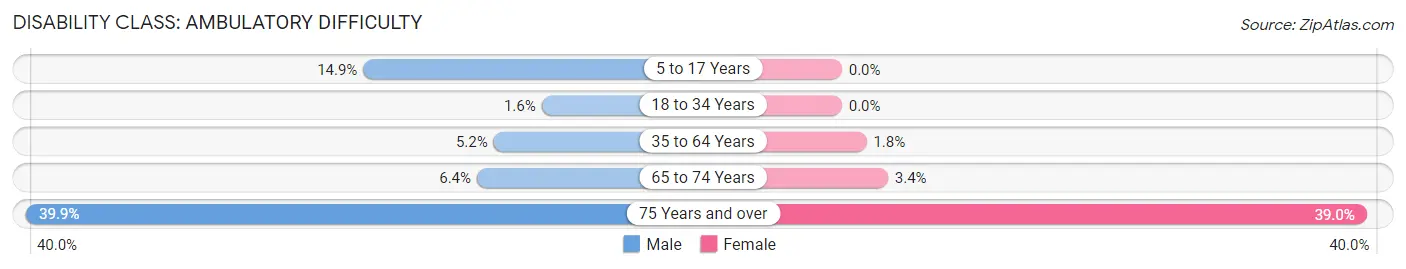
| Age Bracket | Male | Female |
| 5 to 17 Years | 52 (14.9%) | 0 (0.0%) |
| 18 to 34 Years | 4 (1.6%) | 0 (0.0%) |
| 35 to 64 Years | 33 (5.2%) | 12 (1.8%) |
| 65 to 74 Years | 17 (6.4%) | 9 (3.4%) |
| 75 Years and over | 73 (39.9%) | 53 (39.0%) |
Disability Class: Self-Care Difficulty
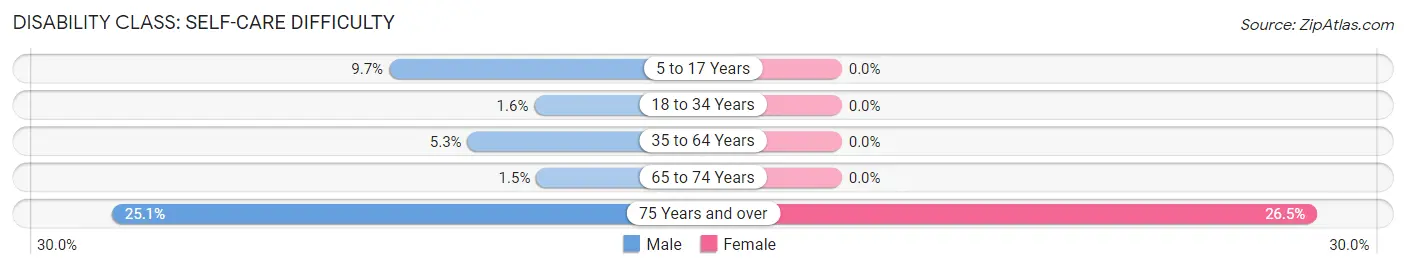
| Age Bracket | Male | Female |
| 5 to 17 Years | 34 (9.7%) | 0 (0.0%) |
| 18 to 34 Years | 4 (1.6%) | 0 (0.0%) |
| 35 to 64 Years | 34 (5.3%) | 0 (0.0%) |
| 65 to 74 Years | 4 (1.5%) | 0 (0.0%) |
| 75 Years and over | 46 (25.1%) | 36 (26.5%) |
Technology Access in Sunnyslope
Computing Device Access in Sunnyslope
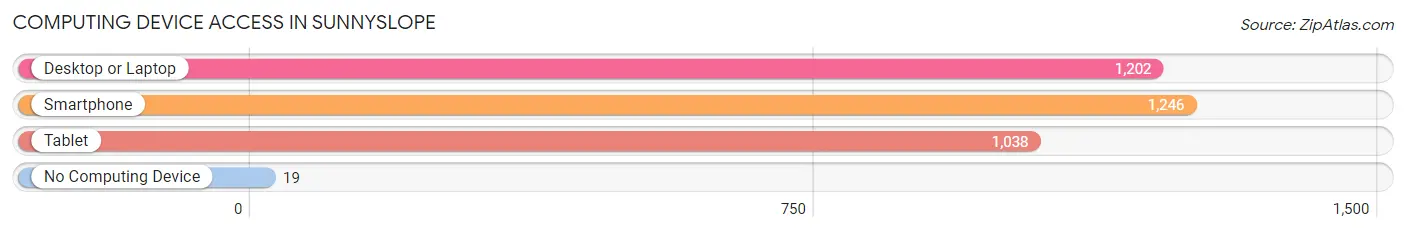
| Device Type | # Households | % Households |
| Desktop or Laptop | 1,202 | 89.8% |
| Smartphone | 1,246 | 93.1% |
| Tablet | 1,038 | 77.6% |
| No Computing Device | 19 | 1.4% |
| Total | 1,338 | 100.0% |
Internet Access in Sunnyslope
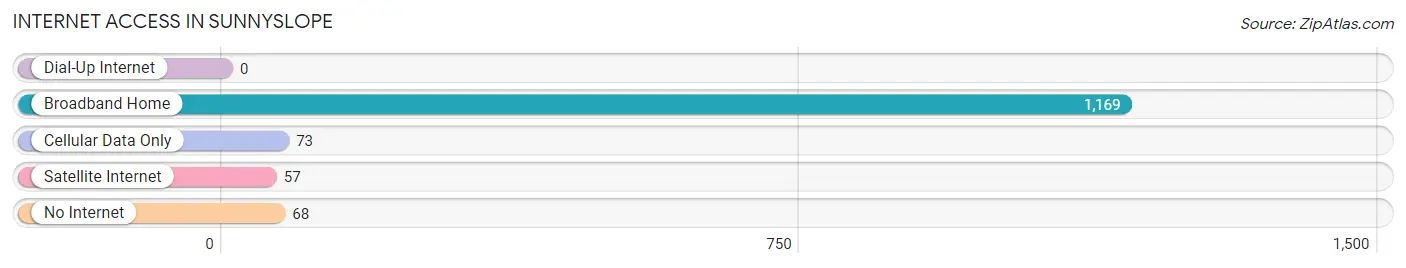
| Internet Type | # Households | % Households |
| Dial-Up Internet | 0 | 0.0% |
| Broadband Home | 1,169 | 87.4% |
| Cellular Data Only | 73 | 5.5% |
| Satellite Internet | 57 | 4.3% |
| No Internet | 68 | 5.1% |
| Total | 1,338 | 100.0% |
Sunnyslope Summary
Sunnyslope, Washington is a small town located in the northeastern corner of the state, near the Canadian border. It is a rural community with a population of just over 1,000 people. The town is situated in a valley surrounded by mountains and is known for its beautiful scenery and outdoor activities.
History
Sunnyslope was first settled in the late 1800s by homesteaders who were attracted to the area by its fertile soil and abundant natural resources. The town was officially incorporated in 1909 and was named after the sunny slopes of the surrounding mountains. In the early 1900s, the town was a thriving agricultural community, with many farms and ranches in the area.
In the 1950s, Sunnyslope began to experience a population boom as people moved to the area to take advantage of the area’s natural beauty and recreational opportunities. The town has since become a popular destination for outdoor enthusiasts, with many people visiting the area for camping, fishing, hunting, and other activities.
Geography
Sunnyslope is located in the northeastern corner of Washington, near the Canadian border. The town is situated in a valley surrounded by mountains, with the highest peak in the area being Mount Baker. The town is located in a temperate rainforest climate, with mild temperatures and abundant rainfall.
The town is located near several rivers, including the Nooksack River, which is a popular destination for fishing and rafting. The town is also located near several lakes, including Lake Whatcom, which is a popular destination for swimming, boating, and other water activities.
Economy
Sunnyslope’s economy is largely based on tourism and outdoor recreation. The town is home to several campgrounds, RV parks, and other recreational facilities, which attract visitors from all over the country. The town is also home to several small businesses, including restaurants, shops, and other services.
The town is also home to several farms and ranches, which produce a variety of crops and livestock. The town is also home to several logging companies, which harvest timber from the surrounding forests.
Demographics
As of the 2010 census, Sunnyslope had a population of 1,072 people. The town is predominantly white, with the majority of the population being of European descent. The town also has a small Native American population, with the majority of the population being of the Lummi tribe.
The town has a median household income of $41,250, which is slightly lower than the state average. The town also has a higher than average poverty rate, with nearly 20% of the population living below the poverty line.
Sunnyslope is a small town with a rich history and a unique culture. The town is known for its beautiful scenery and outdoor activities, and is a popular destination for tourists and outdoor enthusiasts. The town is also home to several small businesses and farms, which provide employment opportunities for the local population. Sunnyslope is a great place to live and visit, and is sure to provide a unique and memorable experience for all who visit.
Common Questions
What is Per Capita Income in Sunnyslope?
Per Capita income in Sunnyslope is $65,194.
What is the Median Family Income in Sunnyslope?
Median Family Income in Sunnyslope is $130,583.
What is the Median Household income in Sunnyslope?
Median Household Income in Sunnyslope is $124,076.
What is Income or Wage Gap in Sunnyslope?
Income or Wage Gap in Sunnyslope is 59.7%.
Women in Sunnyslope earn 40.3 cents for every dollar earned by a man.
What is Inequality or Gini Index in Sunnyslope?
Inequality or Gini Index in Sunnyslope is 0.44.
What is the Total Population of Sunnyslope?
Total Population of Sunnyslope is 3,553.
What is the Total Male Population of Sunnyslope?
Total Male Population of Sunnyslope is 1,807.
What is the Total Female Population of Sunnyslope?
Total Female Population of Sunnyslope is 1,746.
What is the Ratio of Males per 100 Females in Sunnyslope?
There are 103.49 Males per 100 Females in Sunnyslope.
What is the Ratio of Females per 100 Males in Sunnyslope?
There are 96.62 Females per 100 Males in Sunnyslope.
What is the Median Population Age in Sunnyslope?
Median Population Age in Sunnyslope is 46.9 Years.
What is the Average Family Size in Sunnyslope
Average Family Size in Sunnyslope is 3.0 People.
What is the Average Household Size in Sunnyslope
Average Household Size in Sunnyslope is 2.6 People.
How Large is the Labor Force in Sunnyslope?
There are 1,727 People in the Labor Forcein in Sunnyslope.
What is the Percentage of People in the Labor Force in Sunnyslope?
63.8% of People are in the Labor Force in Sunnyslope.
What is the Unemployment Rate in Sunnyslope?
Unemployment Rate in Sunnyslope is 1.3%.