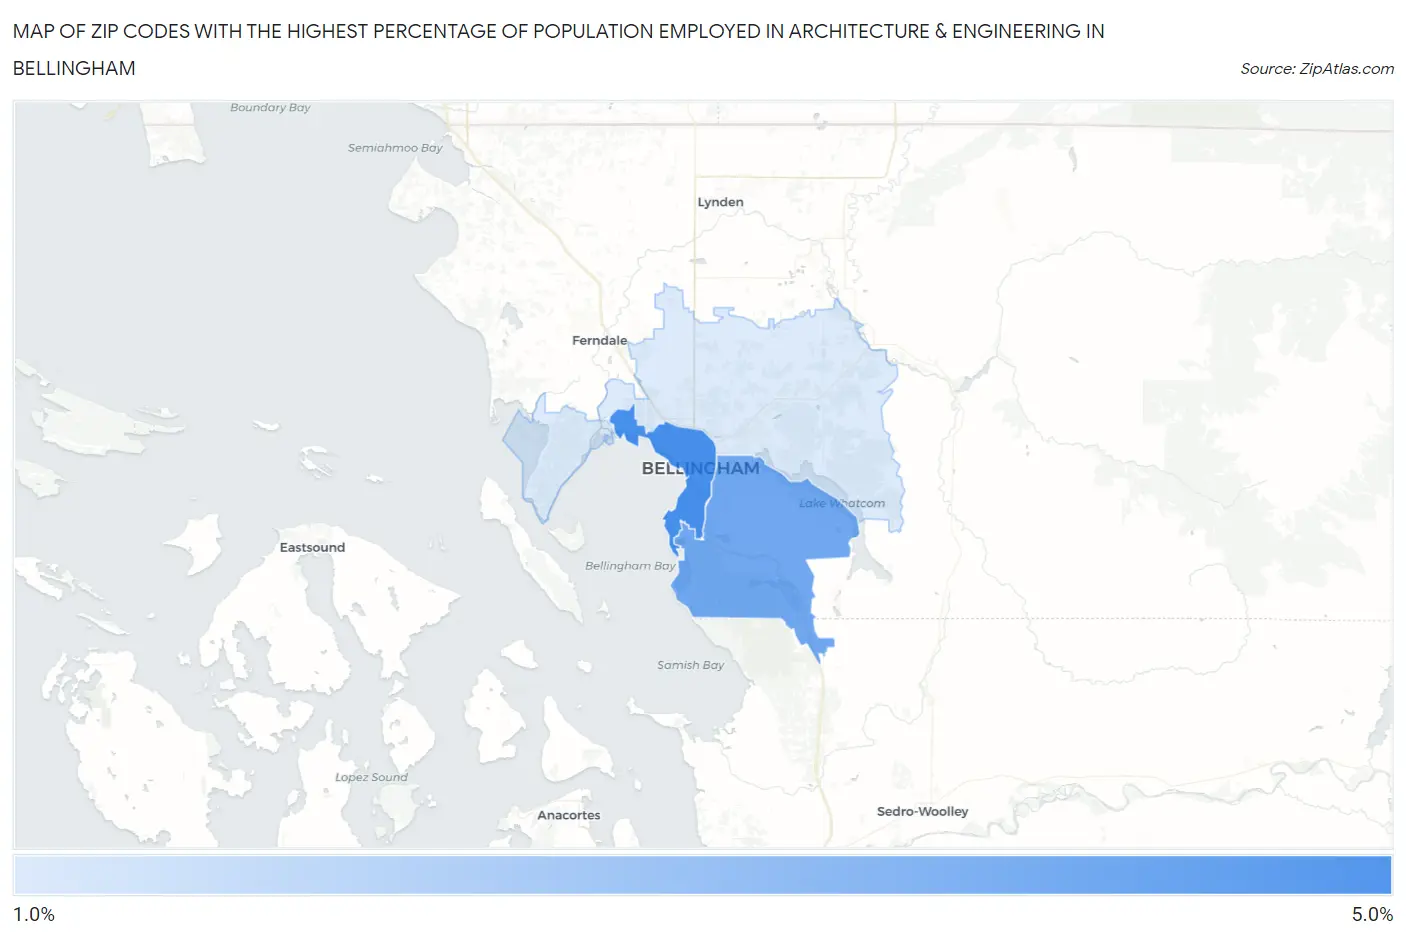
Zip Codes with the Highest Percentage of Population Employed in Architecture & Engineering in Bellingham, WA
RELATED REPORTS & OPTIONS
Architecture & Engineering
Bellingham
Compare Zip Codes
Map of Zip Codes with the Highest Percentage of Population Employed in Architecture & Engineering in Bellingham
1.3%
4.2%
Zip Codes with the Highest Percentage of Population Employed in Architecture & Engineering in Bellingham, WA
| Zip Code | % Employed | vs State | vs National | |
| 1. | 98225 | 4.2% | 2.8%(+1.42)#73 | 2.1%(+2.06)#2,487 |
| 2. | 98229 | 3.4% | 2.8%(+0.607)#115 | 2.1%(+1.25)#3,967 |
| 3. | 98226 | 1.3% | 2.8%(-1.52)#307 | 2.1%(-0.879)#14,526 |
1
Common Questions
What are the Top Zip Codes with the Highest Percentage of Population Employed in Architecture & Engineering in Bellingham, WA?
Top Zip Codes with the Highest Percentage of Population Employed in Architecture & Engineering in Bellingham, WA are:
What zip code has the Highest Percentage of Population Employed in Architecture & Engineering in Bellingham, WA?
98225 has the Highest Percentage of Population Employed in Architecture & Engineering in Bellingham, WA with 4.2%.
What is the Percentage of Population Employed in Architecture & Engineering in Bellingham, WA?
Percentage of Population Employed in Architecture & Engineering in Bellingham is 2.8%.
What is the Percentage of Population Employed in Architecture & Engineering in Washington?
Percentage of Population Employed in Architecture & Engineering in Washington is 2.8%.
What is the Percentage of Population Employed in Architecture & Engineering in the United States?
Percentage of Population Employed in Architecture & Engineering in the United States is 2.1%.