Mercer Island, WA Map & Demographics
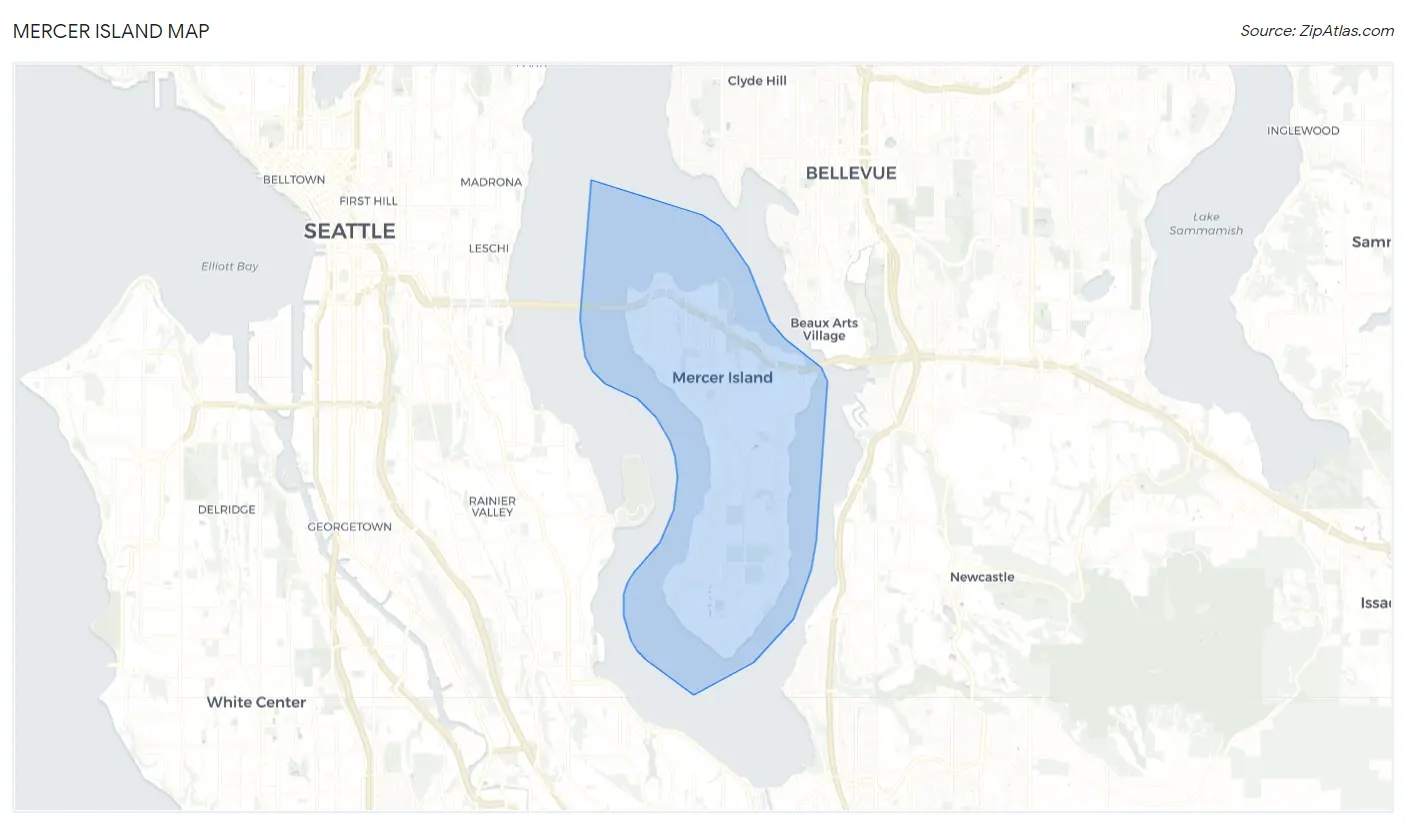
Mercer Island Map
Mercer Island Overview
$113,575
PER CAPITA INCOME
$250,001
AVG FAMILY INCOME
$190,985
AVG HOUSEHOLD INCOME
49.3%
WAGE / INCOME GAP [ % ]
50.7¢/ $1
WAGE / INCOME GAP [ $ ]
0.52
INEQUALITY / GINI INDEX
25,464
TOTAL POPULATION
12,008
MALE POPULATION
13,456
FEMALE POPULATION
89.24
MALES / 100 FEMALES
112.06
FEMALES / 100 MALES
45.3
MEDIAN AGE
3.1
AVG FAMILY SIZE
2.6
AVG HOUSEHOLD SIZE
12,197
LABOR FORCE [ PEOPLE ]
59.4%
PERCENT IN LABOR FORCE
2.6%
UNEMPLOYMENT RATE
Mercer Island Zip Codes
Income in Mercer Island
Income Overview in Mercer Island
Per Capita Income in Mercer Island is $113,575, while median incomes of families and households are $250,001 and $190,985 respectively.
| Characteristic | Number | Measure |
| Per Capita Income | 25,464 | $113,575 |
| Median Family Income | 6,969 | $250,001 |
| Mean Family Income | 6,969 | $361,958 |
| Median Household Income | 9,782 | $190,985 |
| Mean Household Income | 9,782 | $290,655 |
| Income Deficit | 6,969 | $0 |
| Wage / Income Gap (%) | 25,464 | 49.31% |
| Wage / Income Gap ($) | 25,464 | 50.69¢ per $1 |
| Gini / Inequality Index | 25,464 | 0.52 |
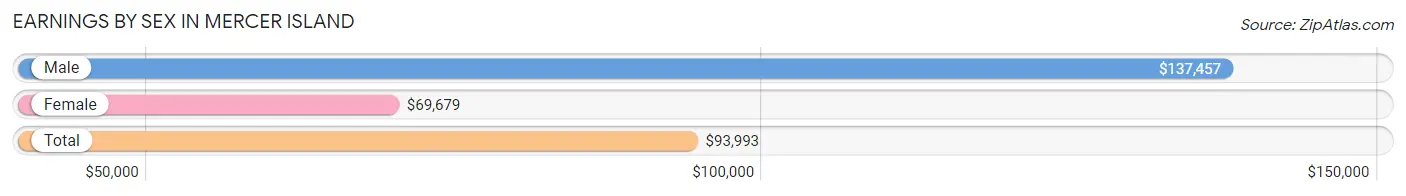
Earnings by Sex in Mercer Island
Average Earnings in Mercer Island are $93,993, $137,457 for men and $69,679 for women, a difference of 49.3%.
| Sex | Number | Average Earnings |
| Male | 7,159 (53.7%) | $137,457 |
| Female | 6,165 (46.3%) | $69,679 |
| Total | 13,324 (100.0%) | $93,993 |
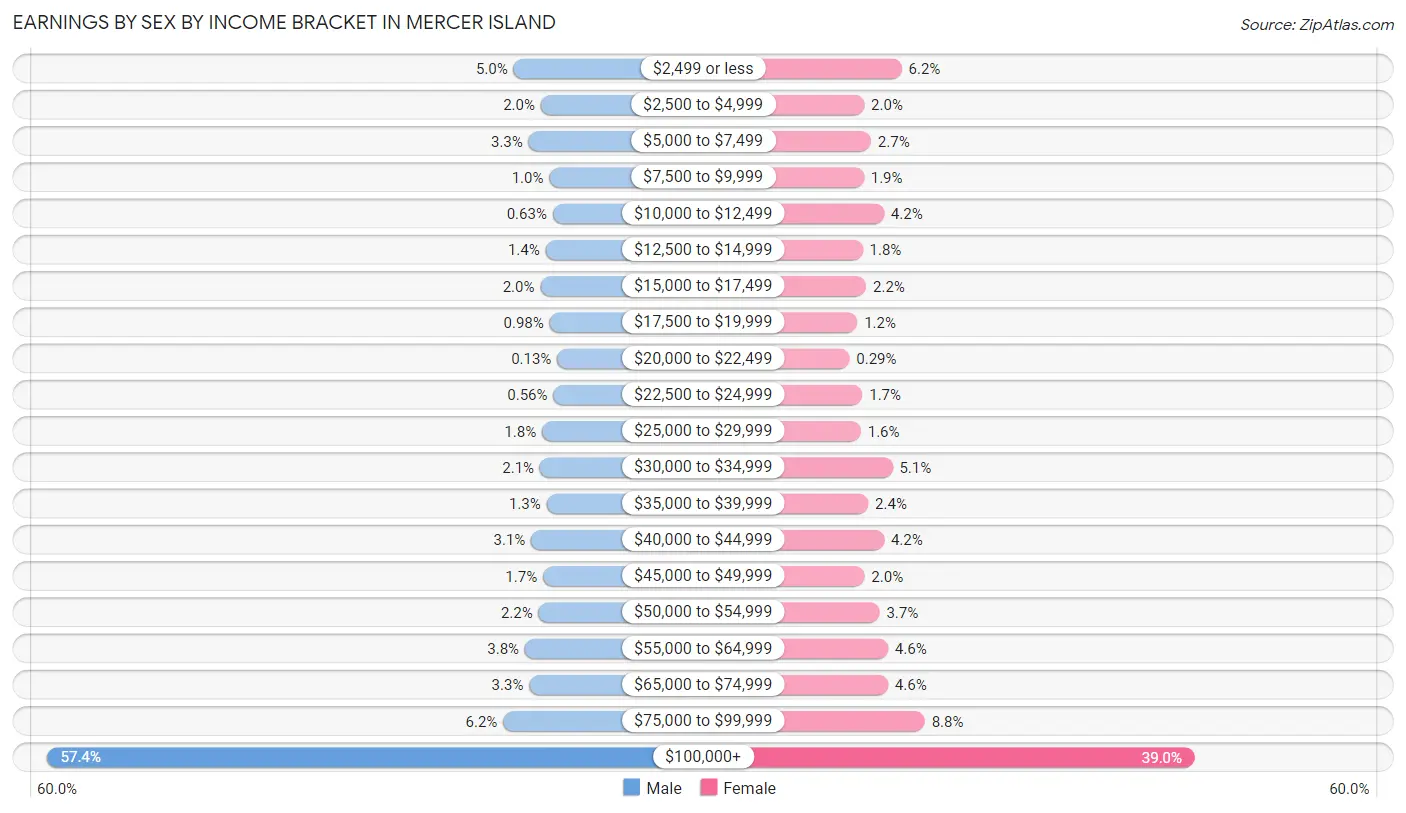
Earnings by Sex by Income Bracket in Mercer Island
The most common earnings brackets in Mercer Island are $100,000+ for men (4,110 | 57.4%) and $100,000+ for women (2,405 | 39.0%).
| Income | Male | Female |
| $2,499 or less | 360 (5.0%) | 380 (6.2%) |
| $2,500 to $4,999 | 141 (2.0%) | 120 (1.9%) |
| $5,000 to $7,499 | 239 (3.3%) | 167 (2.7%) |
| $7,500 to $9,999 | 73 (1.0%) | 118 (1.9%) |
| $10,000 to $12,499 | 45 (0.6%) | 257 (4.2%) |
| $12,500 to $14,999 | 103 (1.4%) | 110 (1.8%) |
| $15,000 to $17,499 | 145 (2.0%) | 134 (2.2%) |
| $17,500 to $19,999 | 70 (1.0%) | 72 (1.2%) |
| $20,000 to $22,499 | 9 (0.1%) | 18 (0.3%) |
| $22,500 to $24,999 | 40 (0.6%) | 107 (1.7%) |
| $25,000 to $29,999 | 132 (1.8%) | 97 (1.6%) |
| $30,000 to $34,999 | 148 (2.1%) | 316 (5.1%) |
| $35,000 to $39,999 | 95 (1.3%) | 148 (2.4%) |
| $40,000 to $44,999 | 218 (3.0%) | 258 (4.2%) |
| $45,000 to $49,999 | 124 (1.7%) | 122 (2.0%) |
| $50,000 to $54,999 | 160 (2.2%) | 226 (3.7%) |
| $55,000 to $64,999 | 269 (3.8%) | 285 (4.6%) |
| $65,000 to $74,999 | 234 (3.3%) | 285 (4.6%) |
| $75,000 to $99,999 | 444 (6.2%) | 540 (8.8%) |
| $100,000+ | 4,110 (57.4%) | 2,405 (39.0%) |
| Total | 7,159 (100.0%) | 6,165 (100.0%) |
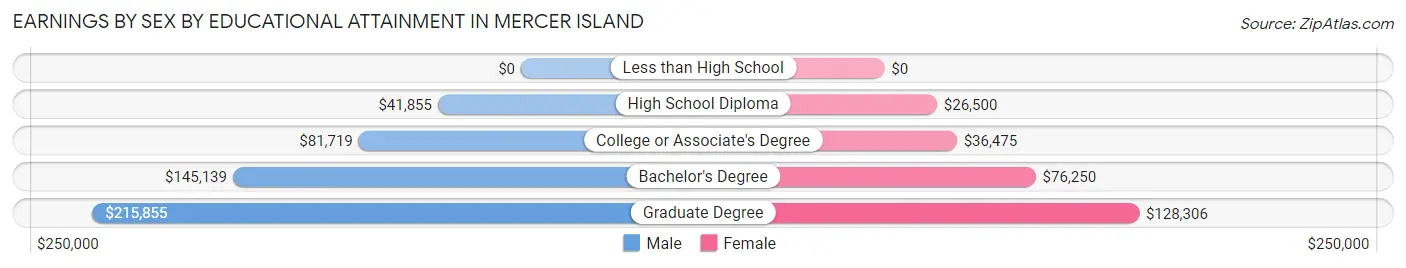
Earnings by Sex by Educational Attainment in Mercer Island
Average earnings in Mercer Island are $160,000 for men and $79,929 for women, a difference of 50.0%. Men with an educational attainment of graduate degree enjoy the highest average annual earnings of $215,855, while those with high school diploma education earn the least with $41,855. Women with an educational attainment of graduate degree earn the most with the average annual earnings of $128,306, while those with high school diploma education have the smallest earnings of $26,500.
| Educational Attainment | Male Income | Female Income |
| Less than High School | - | - |
| High School Diploma | $41,855 | $26,500 |
| College or Associate's Degree | $81,719 | $36,475 |
| Bachelor's Degree | $145,139 | $76,250 |
| Graduate Degree | $215,855 | $128,306 |
| Total | $160,000 | $79,929 |
Family Income in Mercer Island
Family Income Brackets in Mercer Island
According to the Mercer Island family income data, there are 4,279 families falling into the $200,000+ income range, which is the most common income bracket and makes up 61.4% of all families. Conversely, the $10,000 to $14,999 income bracket is the least frequent group with only 28 families (0.4%) belonging to this category.
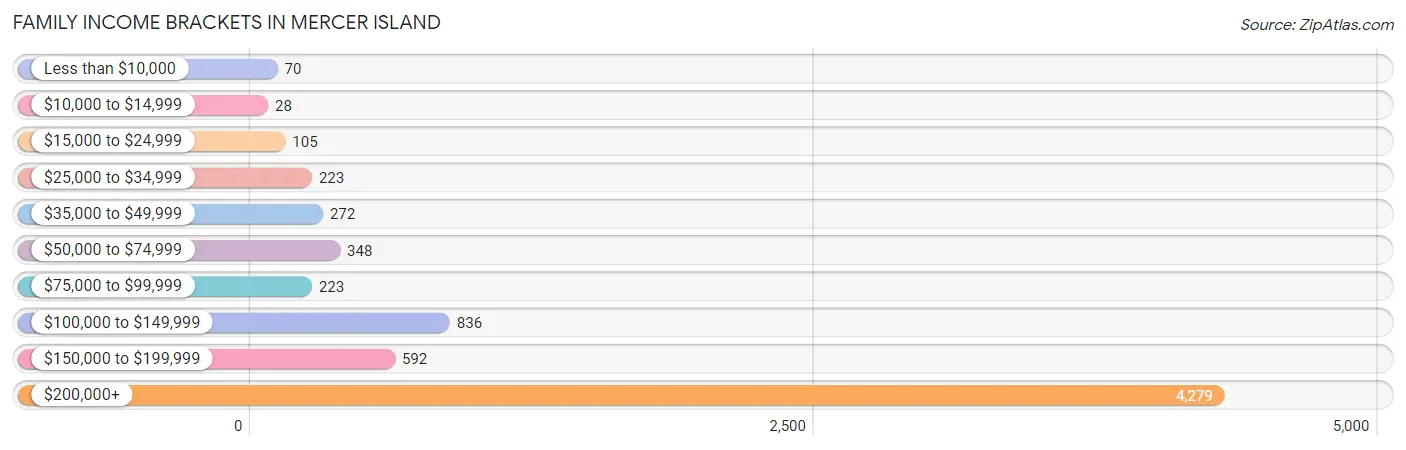
| Income Bracket | # Families | % Families |
| Less than $10,000 | 70 | 1.0% |
| $10,000 to $14,999 | 28 | 0.4% |
| $15,000 to $24,999 | 105 | 1.5% |
| $25,000 to $34,999 | 223 | 3.2% |
| $35,000 to $49,999 | 272 | 3.9% |
| $50,000 to $74,999 | 348 | 5.0% |
| $75,000 to $99,999 | 223 | 3.2% |
| $100,000 to $149,999 | 836 | 12.0% |
| $150,000 to $199,999 | 592 | 8.5% |
| $200,000+ | 4,279 | 61.4% |
Family Income by Famaliy Size in Mercer Island
4-person families (1,756 | 25.2%) account for the highest median family income in Mercer Island with $250,001 per family, while 2-person families (3,016 | 43.3%) have the highest median income of $90,766 per family member.
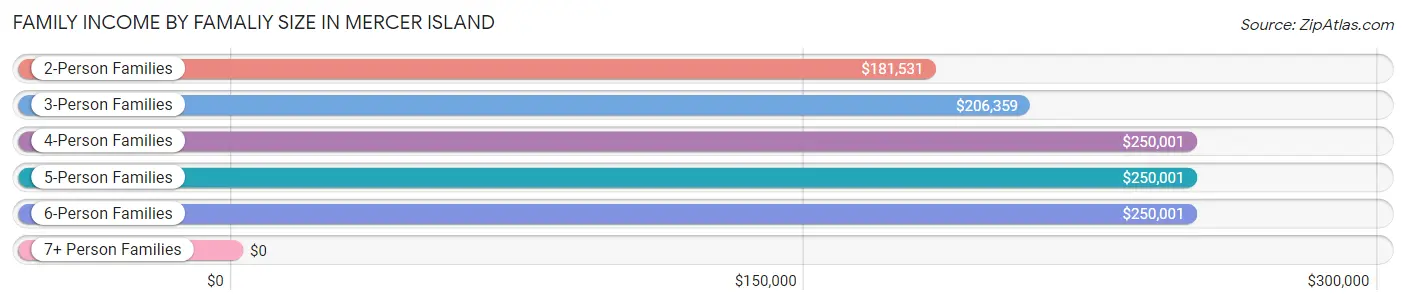
| Income Bracket | # Families | Median Income |
| 2-Person Families | 3,016 (43.3%) | $181,531 |
| 3-Person Families | 1,439 (20.6%) | $206,359 |
| 4-Person Families | 1,756 (25.2%) | $250,001 |
| 5-Person Families | 653 (9.4%) | $250,001 |
| 6-Person Families | 77 (1.1%) | $250,001 |
| 7+ Person Families | 28 (0.4%) | $0 |
| Total | 6,969 (100.0%) | $250,001 |
Family Income by Number of Earners in Mercer Island
The median family income in Mercer Island is $250,001, with families comprising 2 earners (3,232) having the highest median family income of $250,001, while families with no earners (854) have the lowest median family income of $128,750, accounting for 46.4% and 12.2% of families, respectively.
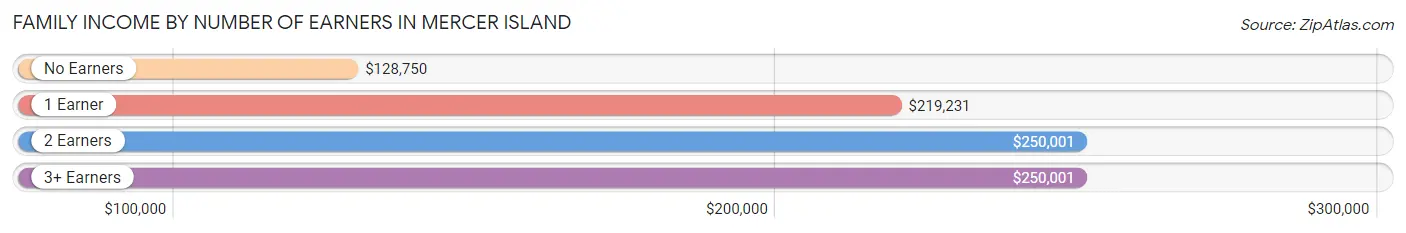
| Number of Earners | # Families | Median Income |
| No Earners | 854 (12.2%) | $128,750 |
| 1 Earner | 2,188 (31.4%) | $219,231 |
| 2 Earners | 3,232 (46.4%) | $250,001 |
| 3+ Earners | 695 (10.0%) | $250,001 |
| Total | 6,969 (100.0%) | $250,001 |
Household Income in Mercer Island
Household Income Brackets in Mercer Island
With 4,725 households falling in the category, the $200,000+ income range is the most frequent in Mercer Island, accounting for 48.3% of all households. In contrast, only 59 households (0.6%) fall into the $10,000 to $14,999 income bracket, making it the least populous group.
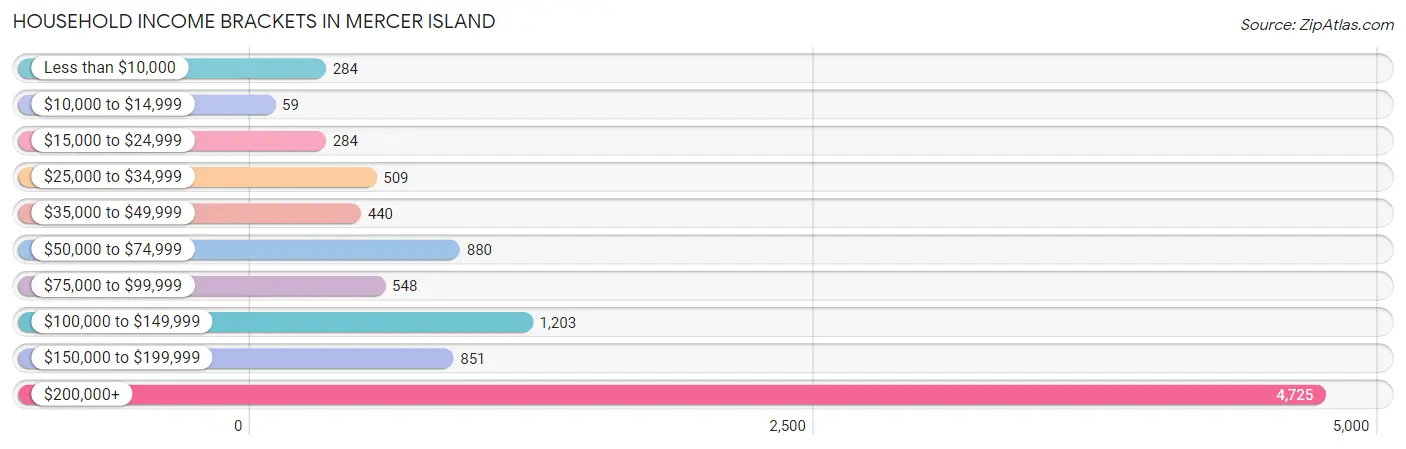
| Income Bracket | # Households | % Households |
| Less than $10,000 | 284 | 2.9% |
| $10,000 to $14,999 | 59 | 0.6% |
| $15,000 to $24,999 | 284 | 2.9% |
| $25,000 to $34,999 | 509 | 5.2% |
| $35,000 to $49,999 | 440 | 4.5% |
| $50,000 to $74,999 | 880 | 9.0% |
| $75,000 to $99,999 | 548 | 5.6% |
| $100,000 to $149,999 | 1,203 | 12.3% |
| $150,000 to $199,999 | 851 | 8.7% |
| $200,000+ | 4,725 | 48.3% |
Household Income by Householder Age in Mercer Island
The median household income in Mercer Island is $190,985, with the highest median household income of $250,001 found in the 45 to 64 years age bracket for the primary householder. A total of 4,219 households (43.1%) fall into this category. Meanwhile, the 15 to 24 years age bracket for the primary householder has the lowest median household income of $68,947, with 136 households (1.4%) in this group.
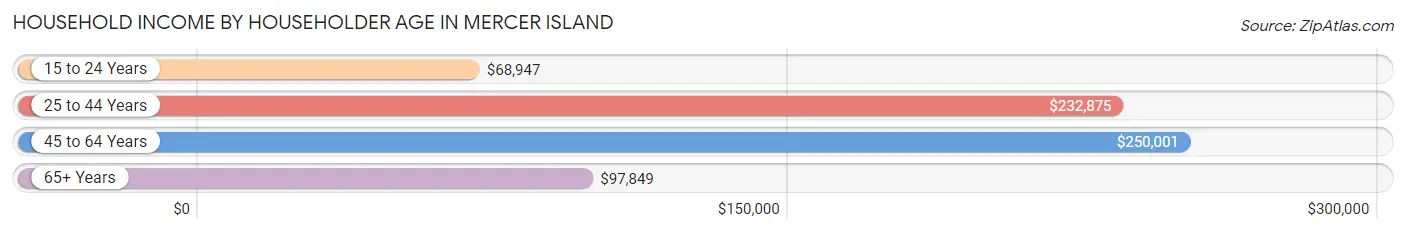
| Income Bracket | # Households | Median Income |
| 15 to 24 Years | 136 (1.4%) | $68,947 |
| 25 to 44 Years | 2,517 (25.7%) | $232,875 |
| 45 to 64 Years | 4,219 (43.1%) | $250,001 |
| 65+ Years | 2,910 (29.7%) | $97,849 |
| Total | 9,782 (100.0%) | $190,985 |
Poverty in Mercer Island
Income Below Poverty by Sex and Age in Mercer Island
With 3.9% poverty level for males and 6.5% for females among the residents of Mercer Island, under 5 year old males and 5 year old females are the most vulnerable to poverty, with 36 males (8.4%) and 36 females (30.8%) in their respective age groups living below the poverty level.
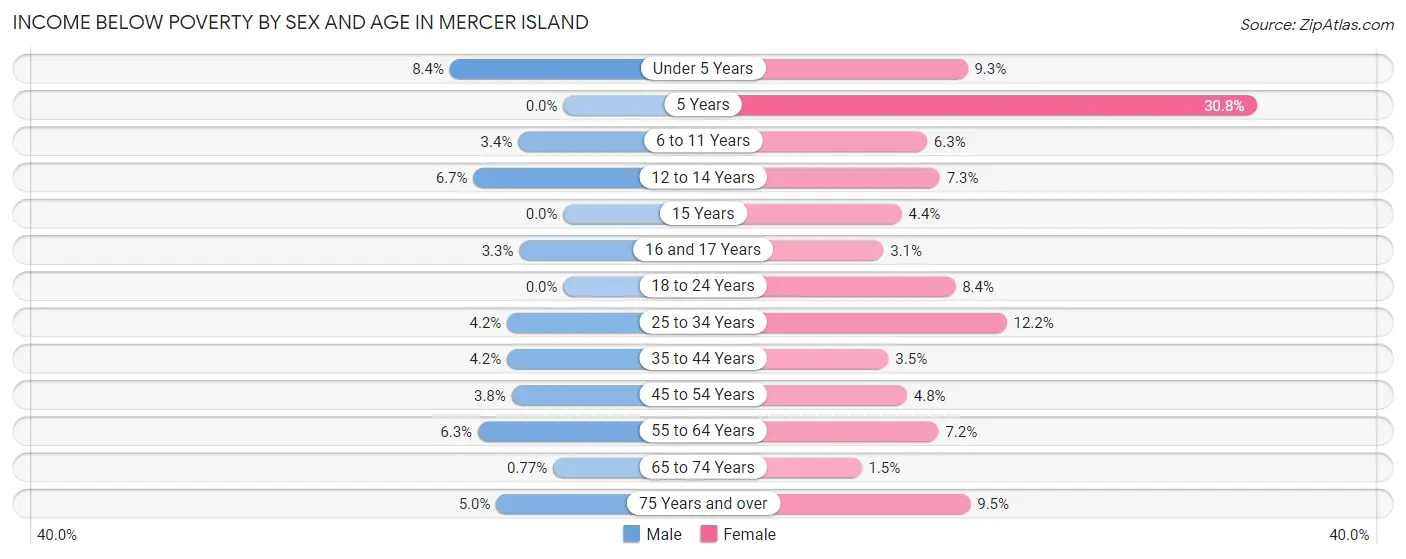
| Age Bracket | Male | Female |
| Under 5 Years | 36 (8.4%) | 54 (9.3%) |
| 5 Years | 0 (0.0%) | 36 (30.8%) |
| 6 to 11 Years | 35 (3.4%) | 65 (6.3%) |
| 12 to 14 Years | 40 (6.7%) | 49 (7.3%) |
| 15 Years | 0 (0.0%) | 8 (4.4%) |
| 16 and 17 Years | 12 (3.3%) | 18 (3.1%) |
| 18 to 24 Years | 0 (0.0%) | 48 (8.4%) |
| 25 to 34 Years | 44 (4.2%) | 130 (12.2%) |
| 35 to 44 Years | 59 (4.2%) | 59 (3.5%) |
| 45 to 54 Years | 79 (3.8%) | 109 (4.8%) |
| 55 to 64 Years | 99 (6.3%) | 130 (7.2%) |
| 65 to 74 Years | 10 (0.8%) | 19 (1.5%) |
| 75 Years and over | 50 (5.0%) | 143 (9.5%) |
| Total | 464 (3.9%) | 868 (6.5%) |
Income Above Poverty by Sex and Age in Mercer Island
According to the poverty statistics in Mercer Island, males aged 5 years and females aged 65 to 74 years are the age groups that are most secure financially, with 100.0% of males and 98.5% of females in these age groups living above the poverty line.
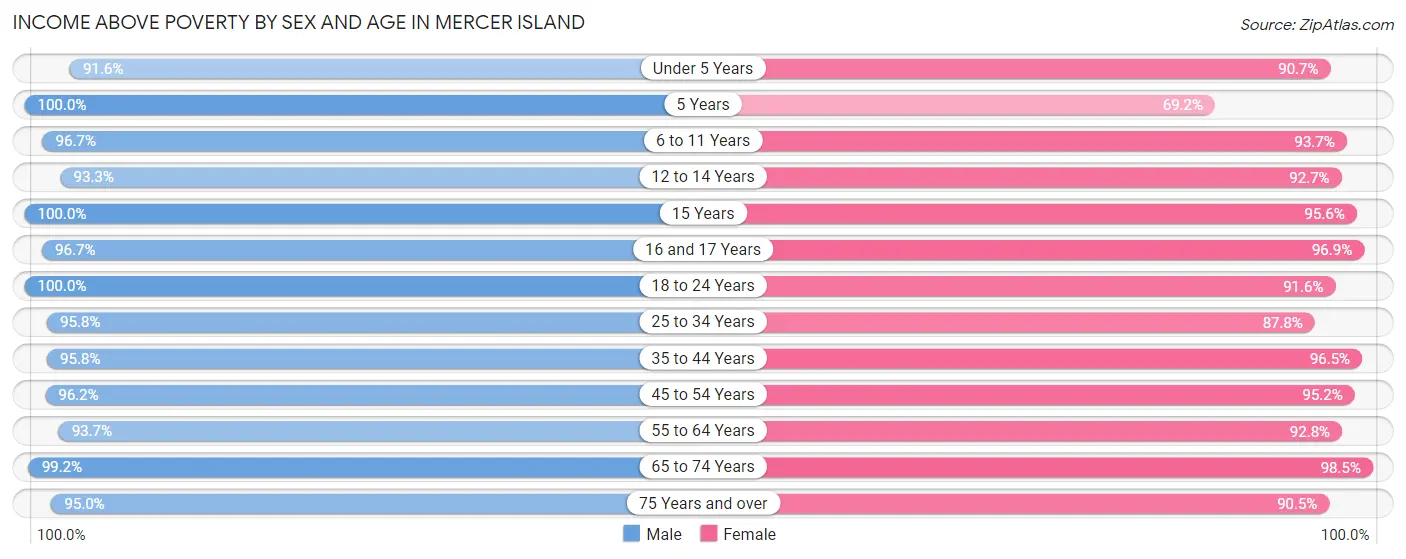
| Age Bracket | Male | Female |
| Under 5 Years | 391 (91.6%) | 525 (90.7%) |
| 5 Years | 119 (100.0%) | 81 (69.2%) |
| 6 to 11 Years | 1,009 (96.7%) | 964 (93.7%) |
| 12 to 14 Years | 559 (93.3%) | 625 (92.7%) |
| 15 Years | 125 (100.0%) | 172 (95.6%) |
| 16 and 17 Years | 355 (96.7%) | 566 (96.9%) |
| 18 to 24 Years | 883 (100.0%) | 522 (91.6%) |
| 25 to 34 Years | 1,011 (95.8%) | 933 (87.8%) |
| 35 to 44 Years | 1,351 (95.8%) | 1,648 (96.5%) |
| 45 to 54 Years | 1,980 (96.2%) | 2,148 (95.2%) |
| 55 to 64 Years | 1,463 (93.7%) | 1,681 (92.8%) |
| 65 to 74 Years | 1,283 (99.2%) | 1,282 (98.5%) |
| 75 Years and over | 955 (95.0%) | 1,356 (90.5%) |
| Total | 11,484 (96.1%) | 12,503 (93.5%) |
Income Below Poverty Among Married-Couple Families in Mercer Island
The poverty statistics for married-couple families in Mercer Island show that 2.5% or 159 of the total 6,298 families live below the poverty line. Families with 3 or 4 children have the highest poverty rate of 7.5%, comprising of 32 families. On the other hand, families with 5 or more children have the lowest poverty rate of 0.0%, which includes 0 families.
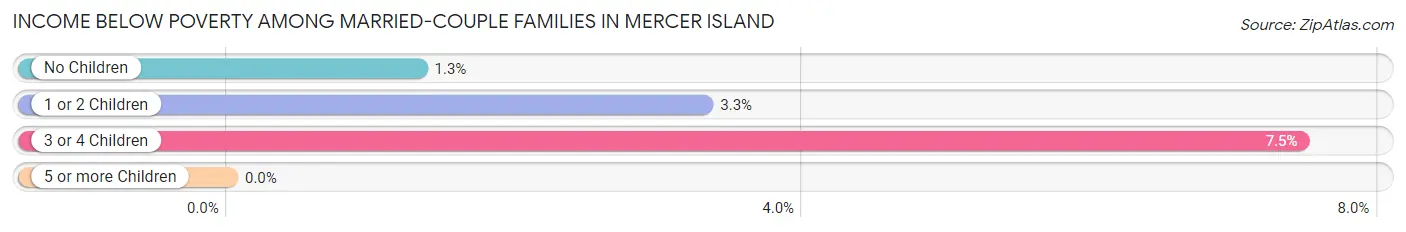
| Children | Above Poverty | Below Poverty |
| No Children | 3,293 (98.7%) | 44 (1.3%) |
| 1 or 2 Children | 2,421 (96.7%) | 83 (3.3%) |
| 3 or 4 Children | 397 (92.5%) | 32 (7.5%) |
| 5 or more Children | 28 (100.0%) | 0 (0.0%) |
| Total | 6,139 (97.5%) | 159 (2.5%) |
Income Below Poverty Among Single-Parent Households in Mercer Island
According to the poverty data in Mercer Island, 8.0% or 15 single-father households and 10.7% or 52 single-mother households are living below the poverty line. Among single-father households, those with 1 or 2 children have the highest poverty rate, with 15 households (19.0%) experiencing poverty. Likewise, among single-mother households, those with 1 or 2 children have the highest poverty rate, with 52 households (23.2%) falling below the poverty line.
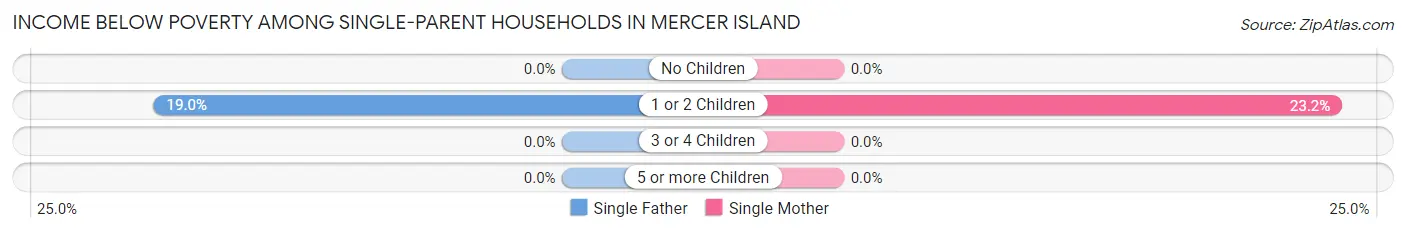
| Children | Single Father | Single Mother |
| No Children | 0 (0.0%) | 0 (0.0%) |
| 1 or 2 Children | 15 (19.0%) | 52 (23.2%) |
| 3 or 4 Children | 0 (0.0%) | 0 (0.0%) |
| 5 or more Children | 0 (0.0%) | 0 (0.0%) |
| Total | 15 (8.0%) | 52 (10.7%) |
Income Below Poverty Among Married-Couple vs Single-Parent Households in Mercer Island
The poverty data for Mercer Island shows that 159 of the married-couple family households (2.5%) and 67 of the single-parent households (10.0%) are living below the poverty level. Within the married-couple family households, those with 3 or 4 children have the highest poverty rate, with 32 households (7.5%) falling below the poverty line. Among the single-parent households, those with 1 or 2 children have the highest poverty rate, with 67 household (22.1%) living below poverty.
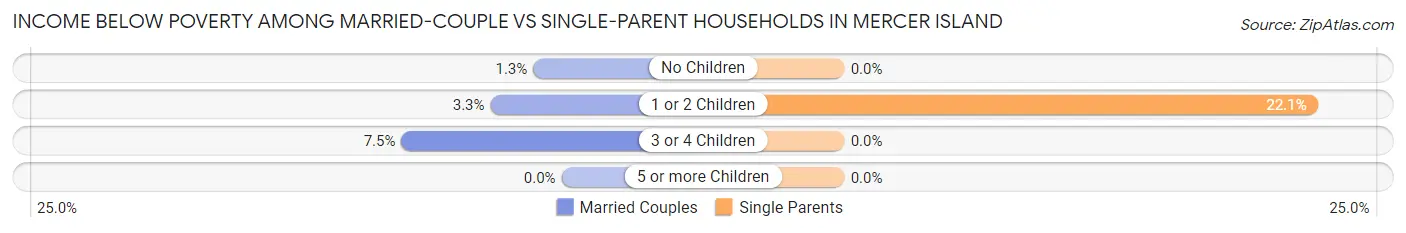
| Children | Married-Couple Families | Single-Parent Households |
| No Children | 44 (1.3%) | 0 (0.0%) |
| 1 or 2 Children | 83 (3.3%) | 67 (22.1%) |
| 3 or 4 Children | 32 (7.5%) | 0 (0.0%) |
| 5 or more Children | 0 (0.0%) | 0 (0.0%) |
| Total | 159 (2.5%) | 67 (10.0%) |
Race in Mercer Island
The most populous races in Mercer Island are White / Caucasian (16,882 | 66.3%), Asian (5,658 | 22.2%), and Two or more Races (2,264 | 8.9%).
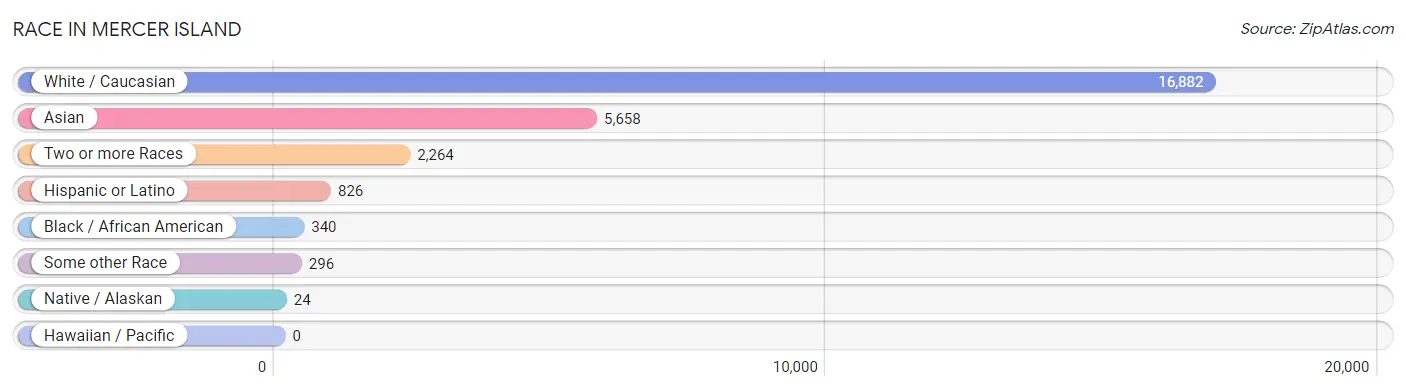
| Race | # Population | % Population |
| Asian | 5,658 | 22.2% |
| Black / African American | 340 | 1.3% |
| Hawaiian / Pacific | 0 | 0.0% |
| Hispanic or Latino | 826 | 3.2% |
| Native / Alaskan | 24 | 0.1% |
| White / Caucasian | 16,882 | 66.3% |
| Two or more Races | 2,264 | 8.9% |
| Some other Race | 296 | 1.2% |
| Total | 25,464 | 100.0% |
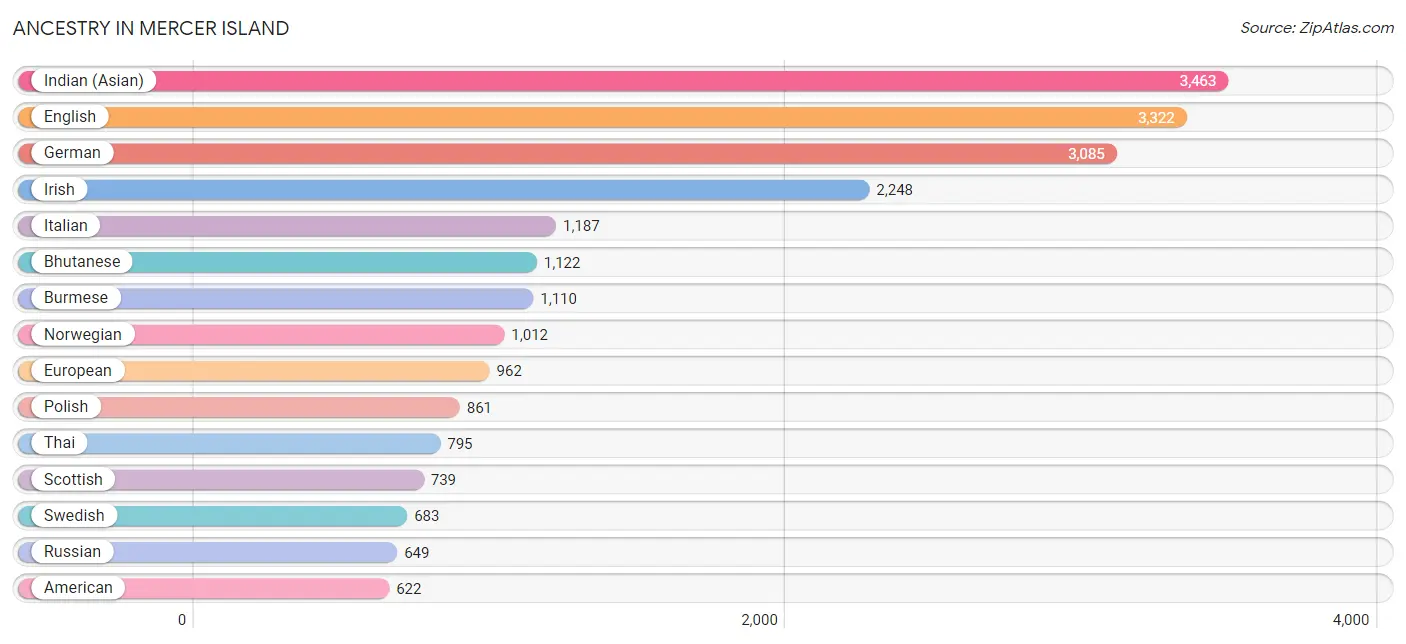
Ancestry in Mercer Island
The most populous ancestries reported in Mercer Island are Indian (Asian) (3,463 | 13.6%), English (3,322 | 13.1%), German (3,085 | 12.1%), Irish (2,248 | 8.8%), and Italian (1,187 | 4.7%), together accounting for 52.3% of all Mercer Island residents.
| Ancestry | # Population | % Population |
| African | 25 | 0.1% |
| Albanian | 220 | 0.9% |
| American | 622 | 2.4% |
| Arab | 48 | 0.2% |
| Argentinean | 43 | 0.2% |
| Armenian | 39 | 0.2% |
| Austrian | 234 | 0.9% |
| Belgian | 32 | 0.1% |
| Bhutanese | 1,122 | 4.4% |
| Blackfeet | 47 | 0.2% |
| Brazilian | 97 | 0.4% |
| British | 512 | 2.0% |
| Burmese | 1,110 | 4.4% |
| Canadian | 107 | 0.4% |
| Carpatho Rusyn | 10 | 0.0% |
| Central American | 18 | 0.1% |
| Cherokee | 25 | 0.1% |
| Colombian | 8 | 0.0% |
| Croatian | 49 | 0.2% |
| Cuban | 6 | 0.0% |
| Czech | 118 | 0.5% |
| Danish | 238 | 0.9% |
| Dutch | 226 | 0.9% |
| Eastern European | 214 | 0.8% |
| Egyptian | 14 | 0.1% |
| English | 3,322 | 13.1% |
| Estonian | 9 | 0.0% |
| European | 962 | 3.8% |
| Filipino | 407 | 1.6% |
| Finnish | 121 | 0.5% |
| French | 547 | 2.1% |
| French Canadian | 293 | 1.1% |
| German | 3,085 | 12.1% |
| Greek | 99 | 0.4% |
| Guatemalan | 10 | 0.0% |
| Guyanese | 22 | 0.1% |
| Hungarian | 171 | 0.7% |
| Icelander | 13 | 0.1% |
| Indian (Asian) | 3,463 | 13.6% |
| Iranian | 135 | 0.5% |
| Irish | 2,248 | 8.8% |
| Israeli | 66 | 0.3% |
| Italian | 1,187 | 4.7% |
| Japanese | 10 | 0.0% |
| Kenyan | 10 | 0.0% |
| Korean | 241 | 0.9% |
| Laotian | 34 | 0.1% |
| Latvian | 7 | 0.0% |
| Lebanese | 7 | 0.0% |
| Lithuanian | 149 | 0.6% |
| Mexican | 420 | 1.7% |
| Native Hawaiian | 45 | 0.2% |
| Navajo | 16 | 0.1% |
| Nigerian | 31 | 0.1% |
| Northern European | 147 | 0.6% |
| Norwegian | 1,012 | 4.0% |
| Pakistani | 79 | 0.3% |
| Palestinian | 7 | 0.0% |
| Panamanian | 8 | 0.0% |
| Pennsylvania German | 10 | 0.0% |
| Peruvian | 88 | 0.4% |
| Polish | 861 | 3.4% |
| Portuguese | 31 | 0.1% |
| Puerto Rican | 58 | 0.2% |
| Romanian | 88 | 0.4% |
| Russian | 649 | 2.5% |
| Scandinavian | 299 | 1.2% |
| Scotch-Irish | 354 | 1.4% |
| Scottish | 739 | 2.9% |
| Seminole | 46 | 0.2% |
| Senegalese | 9 | 0.0% |
| Serbian | 46 | 0.2% |
| Slavic | 10 | 0.0% |
| Slovak | 53 | 0.2% |
| Slovene | 18 | 0.1% |
| South African | 3 | 0.0% |
| South American | 158 | 0.6% |
| Spaniard | 10 | 0.0% |
| Spanish | 40 | 0.2% |
| Sri Lankan | 209 | 0.8% |
| Subsaharan African | 78 | 0.3% |
| Swedish | 683 | 2.7% |
| Swiss | 155 | 0.6% |
| Thai | 795 | 3.1% |
| Tlingit-Haida | 8 | 0.0% |
| Turkish | 253 | 1.0% |
| Ukrainian | 247 | 1.0% |
| Venezuelan | 19 | 0.1% |
| Welsh | 163 | 0.6% |
| Yugoslavian | 31 | 0.1% | View All 90 Rows |
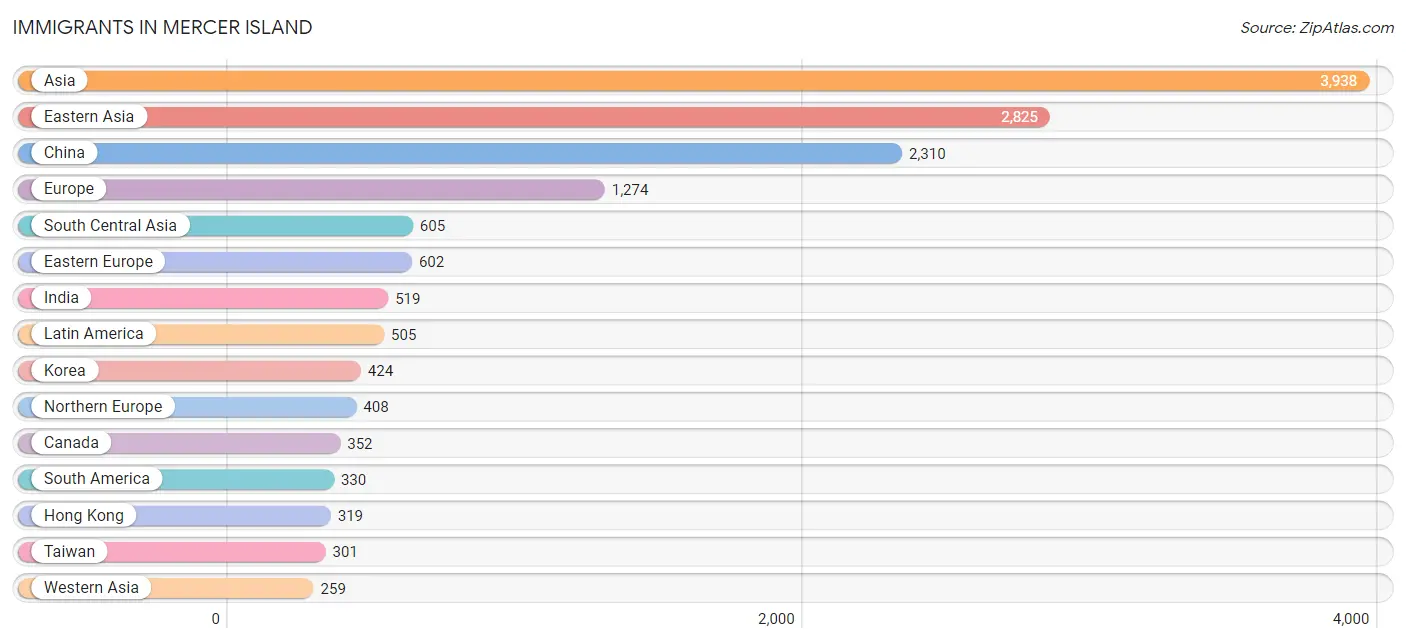
Immigrants in Mercer Island
The most numerous immigrant groups reported in Mercer Island came from Asia (3,938 | 15.5%), Eastern Asia (2,825 | 11.1%), China (2,310 | 9.1%), Europe (1,274 | 5.0%), and South Central Asia (605 | 2.4%), together accounting for 43.0% of all Mercer Island residents.
| Immigration Origin | # Population | % Population |
| Africa | 93 | 0.4% |
| Argentina | 144 | 0.6% |
| Asia | 3,938 | 15.5% |
| Australia | 47 | 0.2% |
| Austria | 20 | 0.1% |
| Belgium | 43 | 0.2% |
| Bosnia and Herzegovina | 8 | 0.0% |
| Brazil | 147 | 0.6% |
| Cambodia | 5 | 0.0% |
| Canada | 352 | 1.4% |
| Central America | 175 | 0.7% |
| China | 2,310 | 9.1% |
| Croatia | 8 | 0.0% |
| Czechoslovakia | 37 | 0.2% |
| Denmark | 16 | 0.1% |
| Eastern Africa | 47 | 0.2% |
| Eastern Asia | 2,825 | 11.1% |
| Eastern Europe | 602 | 2.4% |
| Egypt | 8 | 0.0% |
| England | 101 | 0.4% |
| Europe | 1,274 | 5.0% |
| France | 62 | 0.2% |
| Germany | 66 | 0.3% |
| Greece | 3 | 0.0% |
| Guatemala | 10 | 0.0% |
| Hong Kong | 319 | 1.3% |
| India | 519 | 2.0% |
| Indonesia | 31 | 0.1% |
| Iran | 86 | 0.3% |
| Ireland | 9 | 0.0% |
| Israel | 121 | 0.5% |
| Italy | 42 | 0.2% |
| Japan | 91 | 0.4% |
| Kenya | 20 | 0.1% |
| Korea | 424 | 1.7% |
| Latin America | 505 | 2.0% |
| Lebanon | 3 | 0.0% |
| Mexico | 157 | 0.6% |
| Moldova | 18 | 0.1% |
| Netherlands | 10 | 0.0% |
| Nigeria | 15 | 0.1% |
| Northern Africa | 8 | 0.0% |
| Northern Europe | 408 | 1.6% |
| Oceania | 95 | 0.4% |
| Panama | 8 | 0.0% |
| Peru | 20 | 0.1% |
| Philippines | 22 | 0.1% |
| Poland | 60 | 0.2% |
| Portugal | 9 | 0.0% |
| Romania | 60 | 0.2% |
| Russia | 88 | 0.4% |
| Saudi Arabia | 6 | 0.0% |
| Senegal | 9 | 0.0% |
| Singapore | 22 | 0.1% |
| South Africa | 14 | 0.1% |
| South America | 330 | 1.3% |
| South Central Asia | 605 | 2.4% |
| South Eastern Asia | 249 | 1.0% |
| Southern Europe | 54 | 0.2% |
| Sweden | 55 | 0.2% |
| Switzerland | 9 | 0.0% |
| Taiwan | 301 | 1.2% |
| Thailand | 68 | 0.3% |
| Turkey | 129 | 0.5% |
| Ukraine | 153 | 0.6% |
| Venezuela | 19 | 0.1% |
| Vietnam | 101 | 0.4% |
| Western Africa | 24 | 0.1% |
| Western Asia | 259 | 1.0% |
| Western Europe | 210 | 0.8% | View All 70 Rows |
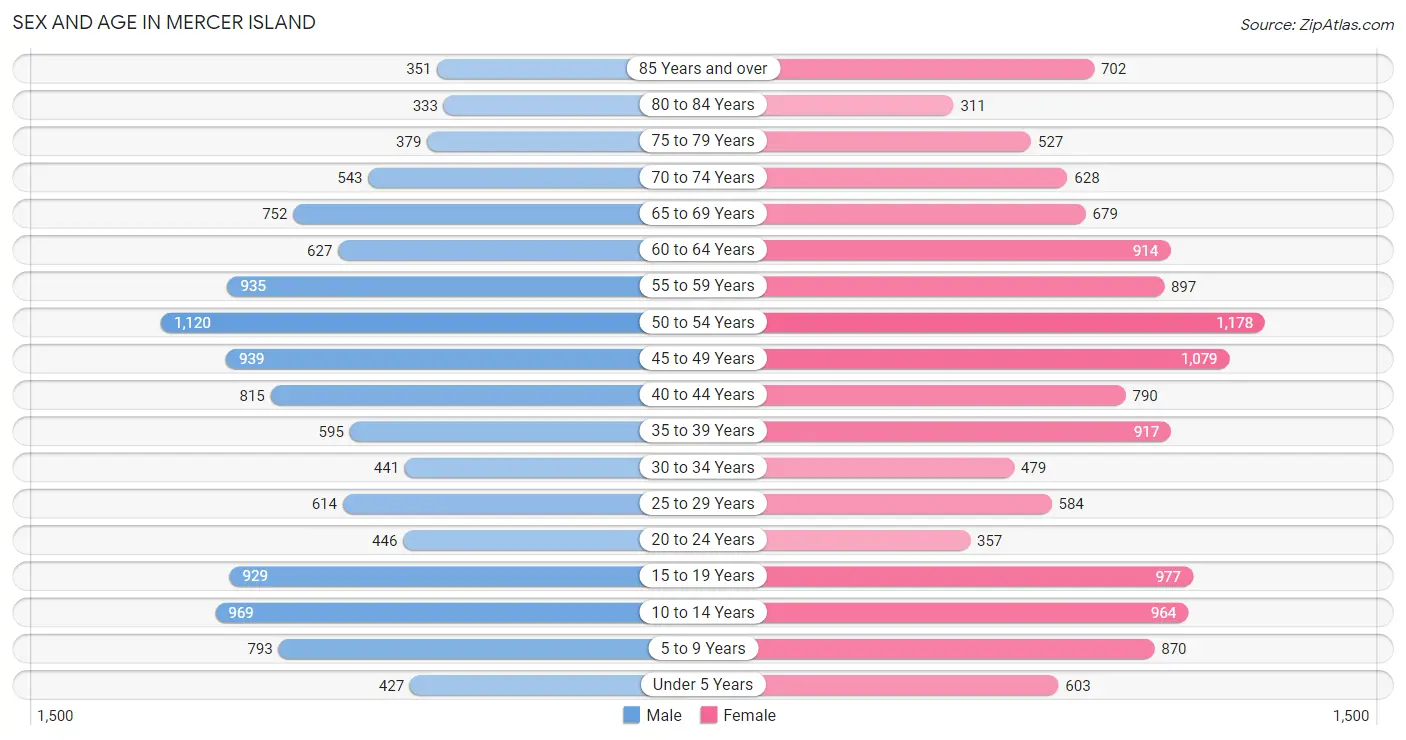
Sex and Age in Mercer Island
Sex and Age in Mercer Island
The most populous age groups in Mercer Island are 50 to 54 Years (1,120 | 9.3%) for men and 50 to 54 Years (1,178 | 8.7%) for women.
| Age Bracket | Male | Female |
| Under 5 Years | 427 (3.6%) | 603 (4.5%) |
| 5 to 9 Years | 793 (6.6%) | 870 (6.5%) |
| 10 to 14 Years | 969 (8.1%) | 964 (7.2%) |
| 15 to 19 Years | 929 (7.7%) | 977 (7.3%) |
| 20 to 24 Years | 446 (3.7%) | 357 (2.6%) |
| 25 to 29 Years | 614 (5.1%) | 584 (4.3%) |
| 30 to 34 Years | 441 (3.7%) | 479 (3.6%) |
| 35 to 39 Years | 595 (5.0%) | 917 (6.8%) |
| 40 to 44 Years | 815 (6.8%) | 790 (5.9%) |
| 45 to 49 Years | 939 (7.8%) | 1,079 (8.0%) |
| 50 to 54 Years | 1,120 (9.3%) | 1,178 (8.7%) |
| 55 to 59 Years | 935 (7.8%) | 897 (6.7%) |
| 60 to 64 Years | 627 (5.2%) | 914 (6.8%) |
| 65 to 69 Years | 752 (6.3%) | 679 (5.1%) |
| 70 to 74 Years | 543 (4.5%) | 628 (4.7%) |
| 75 to 79 Years | 379 (3.2%) | 527 (3.9%) |
| 80 to 84 Years | 333 (2.8%) | 311 (2.3%) |
| 85 Years and over | 351 (2.9%) | 702 (5.2%) |
| Total | 12,008 (100.0%) | 13,456 (100.0%) |
Families and Households in Mercer Island
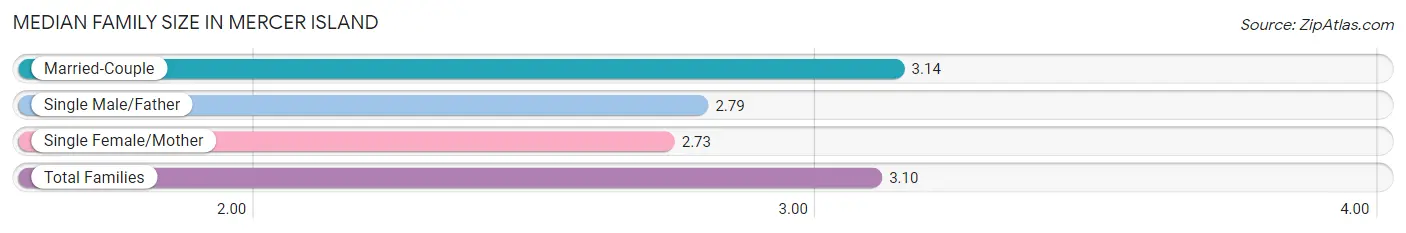
Median Family Size in Mercer Island
The median family size in Mercer Island is 3.10 persons per family, with married-couple families (6,298 | 90.4%) accounting for the largest median family size of 3.14 persons per family. On the other hand, single female/mother families (484 | 7.0%) represent the smallest median family size with 2.73 persons per family.
| Family Type | # Families | Family Size |
| Married-Couple | 6,298 (90.4%) | 3.14 |
| Single Male/Father | 187 (2.7%) | 2.79 |
| Single Female/Mother | 484 (7.0%) | 2.73 |
| Total Families | 6,969 (100.0%) | 3.10 |
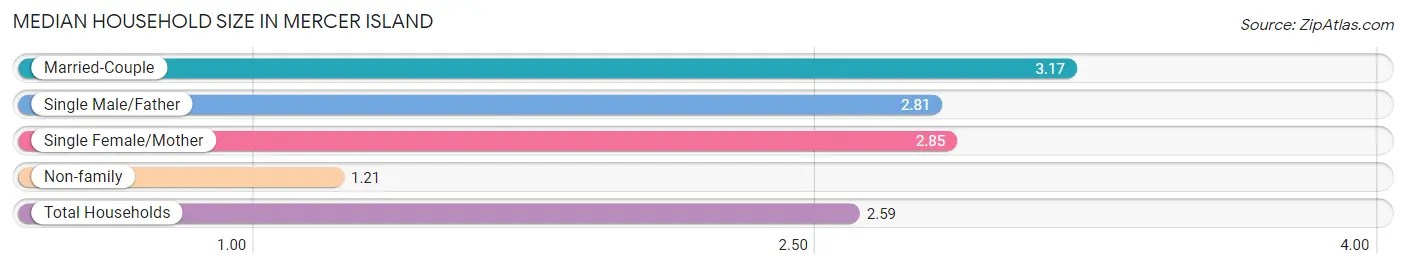
Median Household Size in Mercer Island
The median household size in Mercer Island is 2.59 persons per household, with married-couple households (6,298 | 64.4%) accounting for the largest median household size of 3.17 persons per household. non-family households (2,813 | 28.8%) represent the smallest median household size with 1.21 persons per household.
| Household Type | # Households | Household Size |
| Married-Couple | 6,298 (64.4%) | 3.17 |
| Single Male/Father | 187 (1.9%) | 2.81 |
| Single Female/Mother | 484 (5.0%) | 2.85 |
| Non-family | 2,813 (28.8%) | 1.21 |
| Total Households | 9,782 (100.0%) | 2.59 |
Household Size by Marriage Status in Mercer Island
Out of a total of 9,782 households in Mercer Island, 6,969 (71.2%) are family households, while 2,813 (28.8%) are nonfamily households. The most numerous type of family households are 2-person households, comprising 2,931, and the most common type of nonfamily households are 1-person households, comprising 2,304.
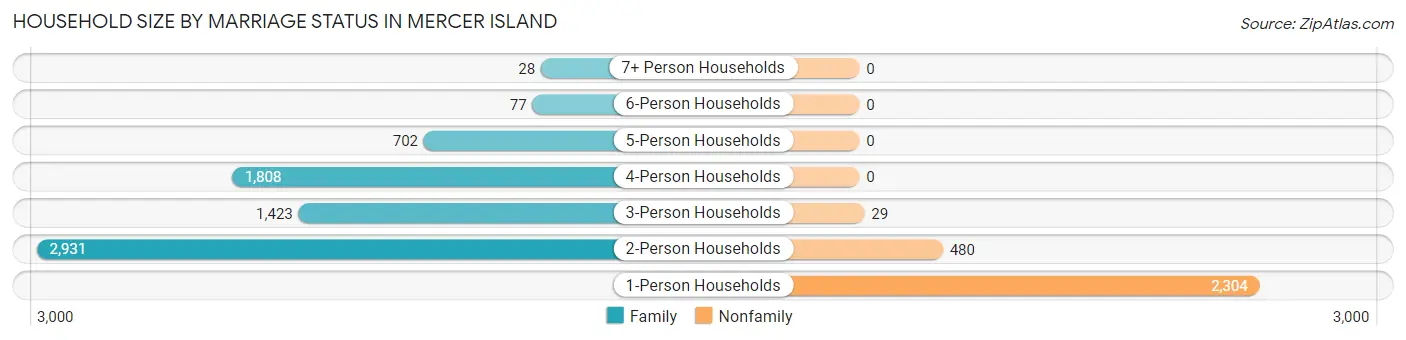
| Household Size | Family Households | Nonfamily Households |
| 1-Person Households | - | 2,304 (23.5%) |
| 2-Person Households | 2,931 (30.0%) | 480 (4.9%) |
| 3-Person Households | 1,423 (14.5%) | 29 (0.3%) |
| 4-Person Households | 1,808 (18.5%) | 0 (0.0%) |
| 5-Person Households | 702 (7.2%) | 0 (0.0%) |
| 6-Person Households | 77 (0.8%) | 0 (0.0%) |
| 7+ Person Households | 28 (0.3%) | 0 (0.0%) |
| Total | 6,969 (71.2%) | 2,813 (28.8%) |
Female Fertility in Mercer Island
Fertility by Age in Mercer Island
Average fertility rate in Mercer Island is 29.0 births per 1,000 women. Women in the age bracket of 20 to 34 years have the highest fertility rate with 83.0 births per 1,000 women. Women in the age bracket of 20 to 34 years acount for 75.2% of all women with births.
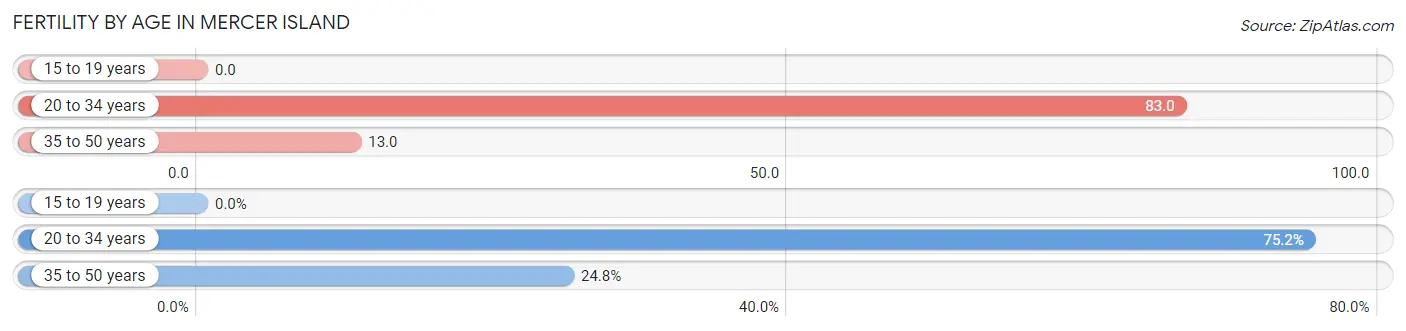
| Age Bracket | Women with Births | Births / 1,000 Women |
| 15 to 19 years | 0 (0.0%) | 0.0 |
| 20 to 34 years | 118 (75.2%) | 83.0 |
| 35 to 50 years | 39 (24.8%) | 13.0 |
| Total | 157 (100.0%) | 29.0 |
Fertility by Age by Marriage Status in Mercer Island
93.6% of women with births (157) in Mercer Island are married. The highest percentage of unmarried women with births falls into 20 to 34 years age bracket with 8.5% of them unmarried at the time of birth, while the lowest percentage of unmarried women with births belong to 35 to 50 years age bracket with 0.0% of them unmarried.
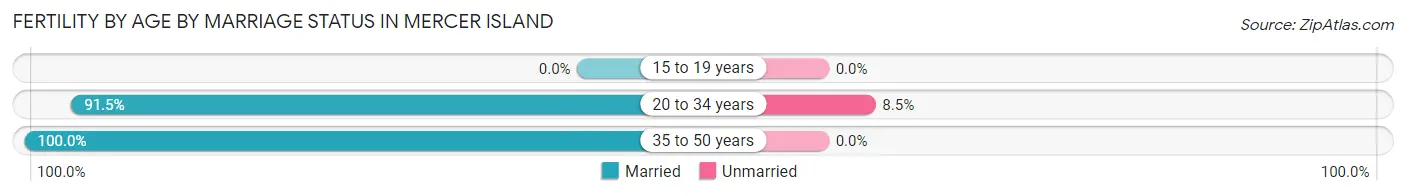
| Age Bracket | Married | Unmarried |
| 15 to 19 years | 0 (0.0%) | 0 (0.0%) |
| 20 to 34 years | 108 (91.5%) | 10 (8.5%) |
| 35 to 50 years | 39 (100.0%) | 0 (0.0%) |
| Total | 147 (93.6%) | 10 (6.4%) |
Fertility by Education in Mercer Island
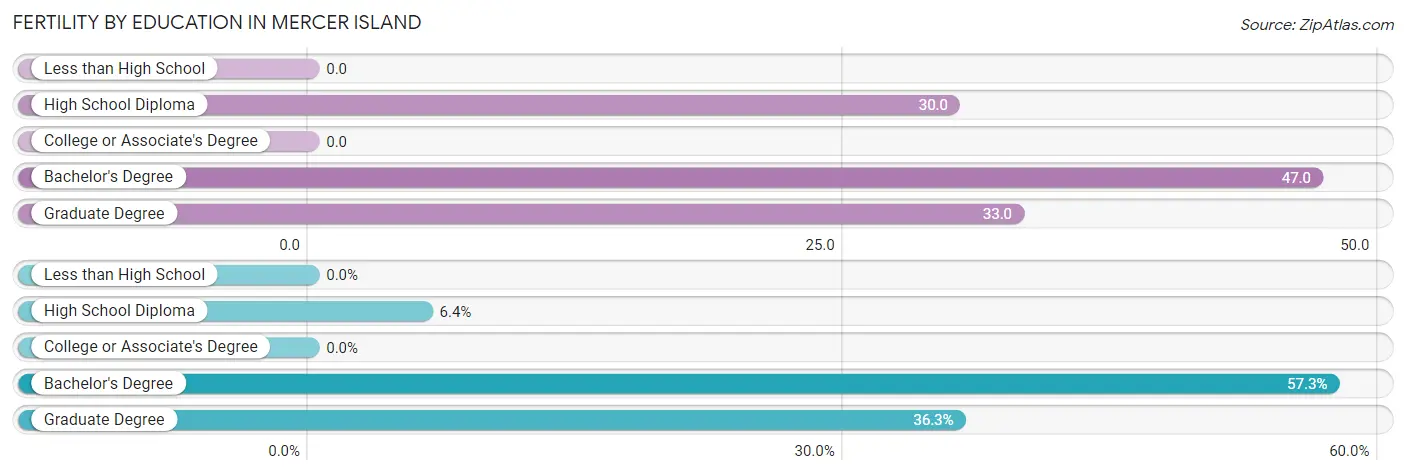
| Educational Attainment | Women with Births | Births / 1,000 Women |
| Less than High School | 0 (0.0%) | 0.0 |
| High School Diploma | 10 (6.4%) | 30.0 |
| College or Associate's Degree | 0 (0.0%) | 0.0 |
| Bachelor's Degree | 90 (57.3%) | 47.0 |
| Graduate Degree | 57 (36.3%) | 33.0 |
| Total | 157 (100.0%) | 29.0 |
Fertility by Education by Marriage Status in Mercer Island
6.4% of women with births in Mercer Island are unmarried. Women with the educational attainment of bachelor's degree are most likely to be married with 100.0% of them married at childbirth, while women with the educational attainment of high school diploma are least likely to be married with 100.0% of them unmarried at childbirth.
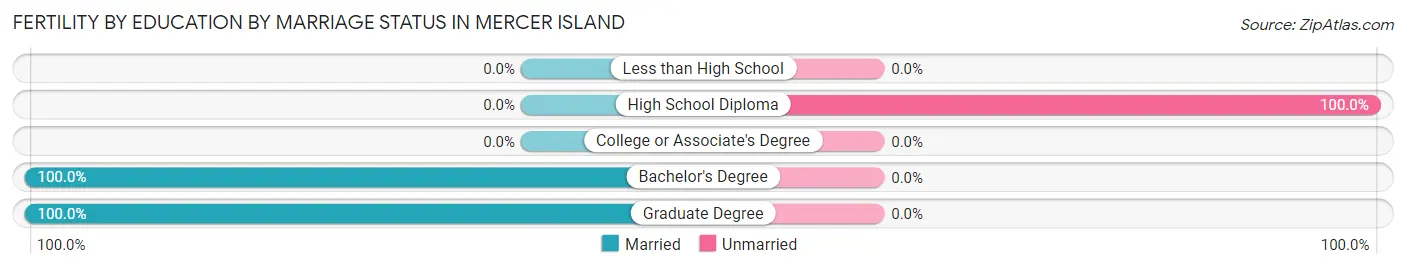
| Educational Attainment | Married | Unmarried |
| Less than High School | 0 (0.0%) | 0 (0.0%) |
| High School Diploma | 0 (0.0%) | 10 (100.0%) |
| College or Associate's Degree | 0 (0.0%) | 0 (0.0%) |
| Bachelor's Degree | 90 (100.0%) | 0 (0.0%) |
| Graduate Degree | 57 (100.0%) | 0 (0.0%) |
| Total | 147 (93.6%) | 10 (6.4%) |
Employment Characteristics in Mercer Island
Employment by Class of Employer in Mercer Island
Among the 11,650 employed individuals in Mercer Island, private company employees (7,530 | 64.6%), not-for-profit organizations (1,185 | 10.2%), and self-employed (not incorporated) (1,077 | 9.2%) make up the most common classes of employment.
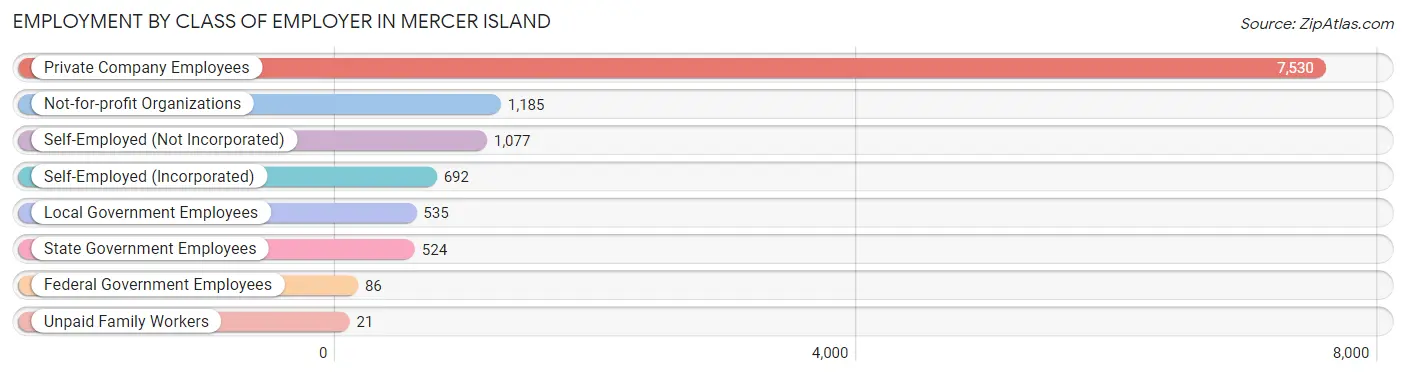
| Employer Class | # Employees | % Employees |
| Private Company Employees | 7,530 | 64.6% |
| Self-Employed (Incorporated) | 692 | 5.9% |
| Self-Employed (Not Incorporated) | 1,077 | 9.2% |
| Not-for-profit Organizations | 1,185 | 10.2% |
| Local Government Employees | 535 | 4.6% |
| State Government Employees | 524 | 4.5% |
| Federal Government Employees | 86 | 0.7% |
| Unpaid Family Workers | 21 | 0.2% |
| Total | 11,650 | 100.0% |
Employment Status by Age in Mercer Island
According to the labor force statistics for Mercer Island, out of the total population over 16 years of age (20,533), 59.4% or 12,197 individuals are in the labor force, with 2.6% or 317 of them unemployed. The age group with the highest labor force participation rate is 25 to 29 years, with 83.5% or 1,000 individuals in the labor force. Within the labor force, the 20 to 24 years age range has the highest percentage of unemployed individuals, with 11.8% or 70 of them being unemployed.
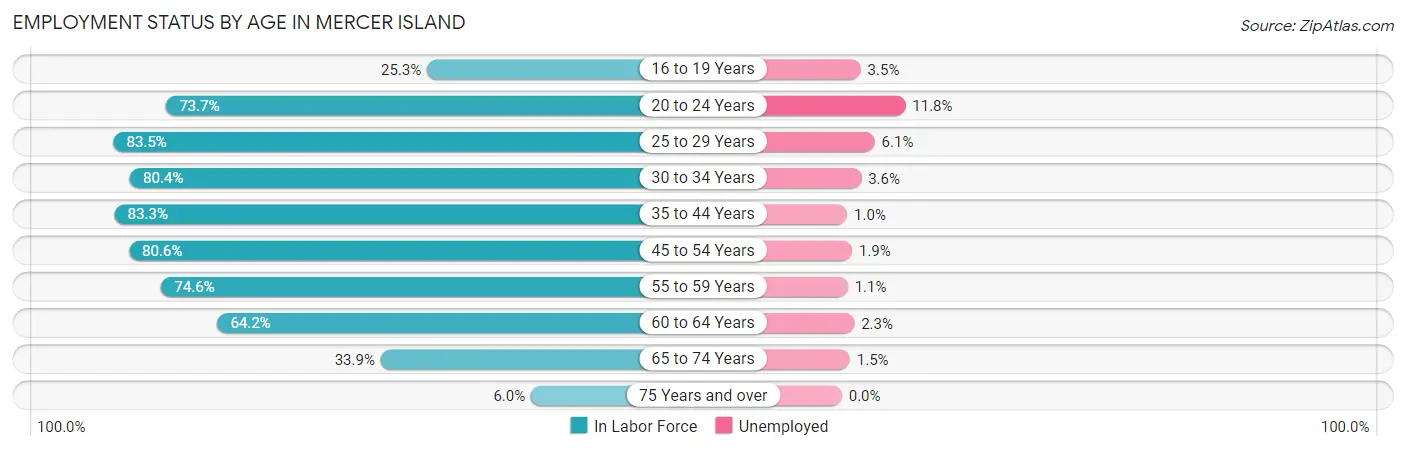
| Age Bracket | In Labor Force | Unemployed |
| 16 to 19 Years | 405 (25.3%) | 14 (3.5%) |
| 20 to 24 Years | 592 (73.7%) | 70 (11.8%) |
| 25 to 29 Years | 1,000 (83.5%) | 61 (6.1%) |
| 30 to 34 Years | 740 (80.4%) | 27 (3.6%) |
| 35 to 44 Years | 2,596 (83.3%) | 26 (1.0%) |
| 45 to 54 Years | 3,479 (80.6%) | 66 (1.9%) |
| 55 to 59 Years | 1,367 (74.6%) | 15 (1.1%) |
| 60 to 64 Years | 989 (64.2%) | 23 (2.3%) |
| 65 to 74 Years | 882 (33.9%) | 13 (1.5%) |
| 75 Years and over | 156 (6.0%) | 0 (0.0%) |
| Total | 12,197 (59.4%) | 317 (2.6%) |
Employment Status by Educational Attainment in Mercer Island
According to labor force statistics for Mercer Island, 78.7% of individuals (10,171) out of the total population between 25 and 64 years of age (12,924) are in the labor force, with 2.1% or 214 of them being unemployed. The group with the highest labor force participation rate are those with the educational attainment of bachelor's degree or higher, with 80.6% or 8,536 individuals in the labor force. Within the labor force, individuals with less than high school education have the highest percentage of unemployment, with 18.8% or 12 of them being unemployed.
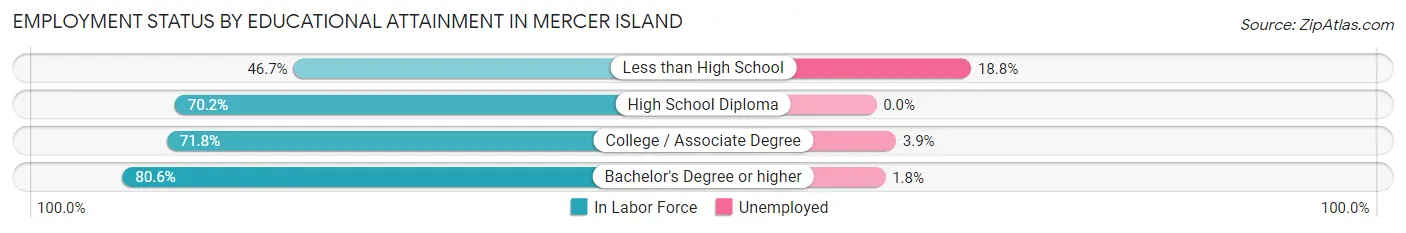
| Educational Attainment | In Labor Force | Unemployed |
| Less than High School | 64 (46.7%) | 26 (18.8%) |
| High School Diploma | 330 (70.2%) | 0 (0.0%) |
| College / Associate Degree | 1,240 (71.8%) | 67 (3.9%) |
| Bachelor's Degree or higher | 8,536 (80.6%) | 191 (1.8%) |
| Total | 10,171 (78.7%) | 271 (2.1%) |
Employment Occupations by Sex in Mercer Island
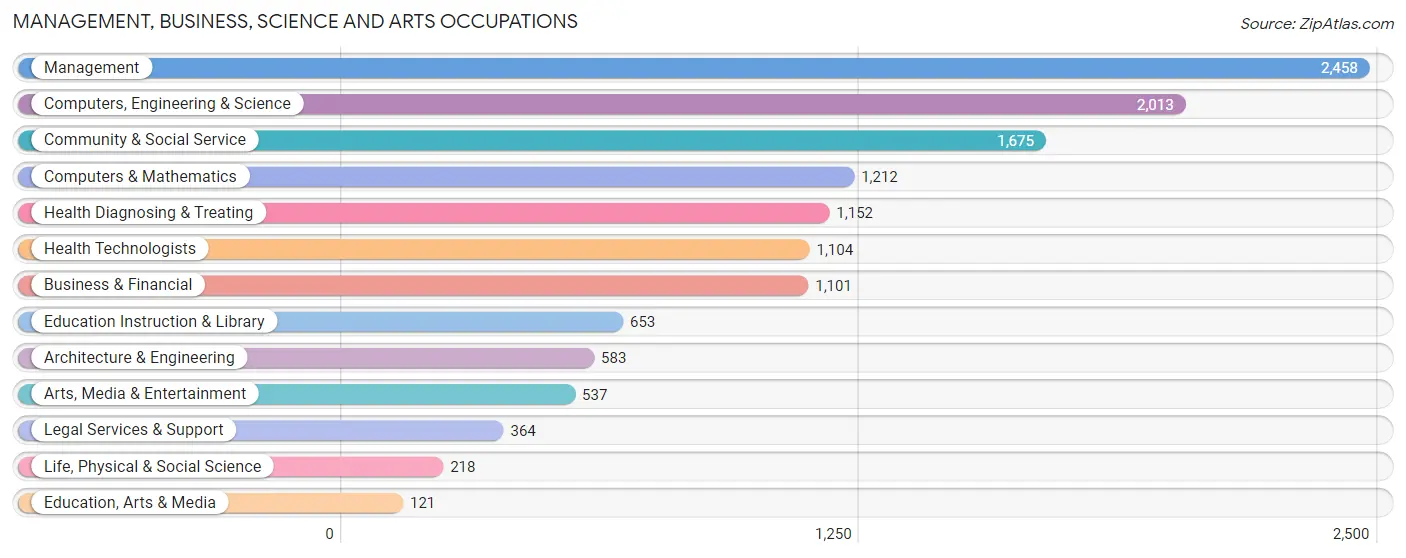
Management, Business, Science and Arts Occupations
The most common Management, Business, Science and Arts occupations in Mercer Island are Management (2,458 | 20.7%), Computers, Engineering & Science (2,013 | 16.9%), Community & Social Service (1,675 | 14.1%), Computers & Mathematics (1,212 | 10.2%), and Health Diagnosing & Treating (1,152 | 9.7%).
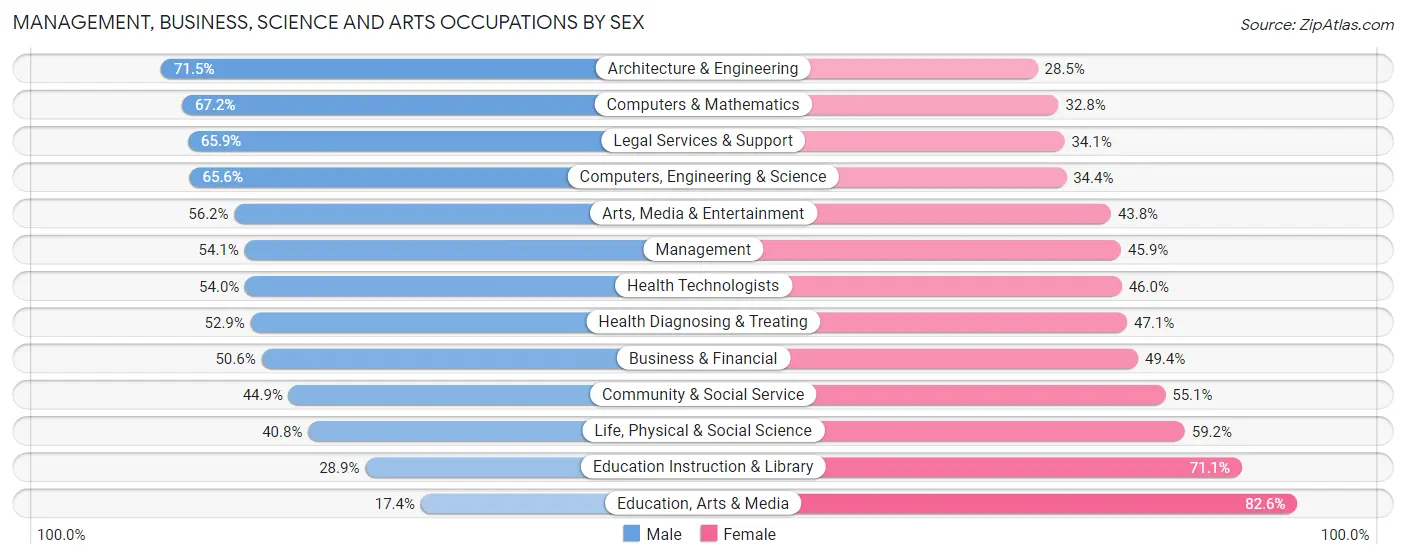
Management, Business, Science and Arts Occupations by Sex
Within the Management, Business, Science and Arts occupations in Mercer Island, the most male-oriented occupations are Architecture & Engineering (71.5%), Computers & Mathematics (67.2%), and Legal Services & Support (65.9%), while the most female-oriented occupations are Education, Arts & Media (82.6%), Education Instruction & Library (71.1%), and Life, Physical & Social Science (59.2%).
| Occupation | Male | Female |
| Management | 1,330 (54.1%) | 1,128 (45.9%) |
| Business & Financial | 557 (50.6%) | 544 (49.4%) |
| Computers, Engineering & Science | 1,320 (65.6%) | 693 (34.4%) |
| Computers & Mathematics | 814 (67.2%) | 398 (32.8%) |
| Architecture & Engineering | 417 (71.5%) | 166 (28.5%) |
| Life, Physical & Social Science | 89 (40.8%) | 129 (59.2%) |
| Community & Social Service | 752 (44.9%) | 923 (55.1%) |
| Education, Arts & Media | 21 (17.4%) | 100 (82.6%) |
| Legal Services & Support | 240 (65.9%) | 124 (34.1%) |
| Education Instruction & Library | 189 (28.9%) | 464 (71.1%) |
| Arts, Media & Entertainment | 302 (56.2%) | 235 (43.8%) |
| Health Diagnosing & Treating | 609 (52.9%) | 543 (47.1%) |
| Health Technologists | 596 (54.0%) | 508 (46.0%) |
| Total (Category) | 4,568 (54.4%) | 3,831 (45.6%) |
| Total (Overall) | 6,411 (53.9%) | 5,480 (46.1%) |
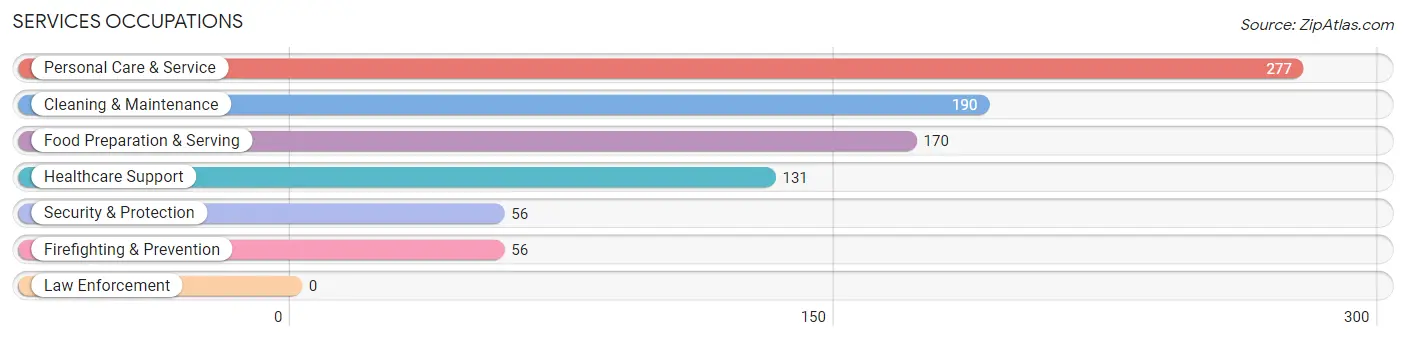
Services Occupations
The most common Services occupations in Mercer Island are Personal Care & Service (277 | 2.3%), Cleaning & Maintenance (190 | 1.6%), Food Preparation & Serving (170 | 1.4%), Healthcare Support (131 | 1.1%), and Security & Protection (56 | 0.5%).
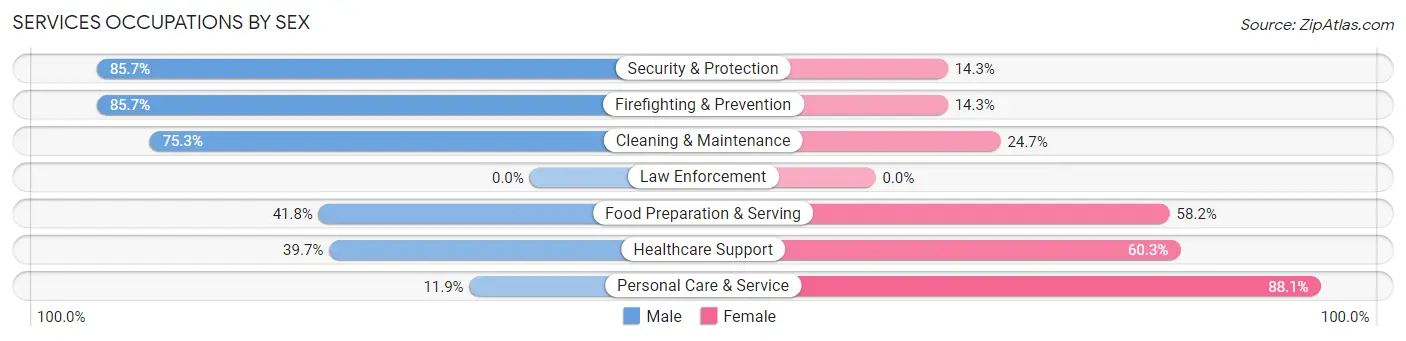
Services Occupations by Sex
Within the Services occupations in Mercer Island, the most male-oriented occupations are Security & Protection (85.7%), Firefighting & Prevention (85.7%), and Cleaning & Maintenance (75.3%), while the most female-oriented occupations are Personal Care & Service (88.1%), Healthcare Support (60.3%), and Food Preparation & Serving (58.2%).
| Occupation | Male | Female |
| Healthcare Support | 52 (39.7%) | 79 (60.3%) |
| Security & Protection | 48 (85.7%) | 8 (14.3%) |
| Firefighting & Prevention | 48 (85.7%) | 8 (14.3%) |
| Law Enforcement | 0 (0.0%) | 0 (0.0%) |
| Food Preparation & Serving | 71 (41.8%) | 99 (58.2%) |
| Cleaning & Maintenance | 143 (75.3%) | 47 (24.7%) |
| Personal Care & Service | 33 (11.9%) | 244 (88.1%) |
| Total (Category) | 347 (42.1%) | 477 (57.9%) |
| Total (Overall) | 6,411 (53.9%) | 5,480 (46.1%) |
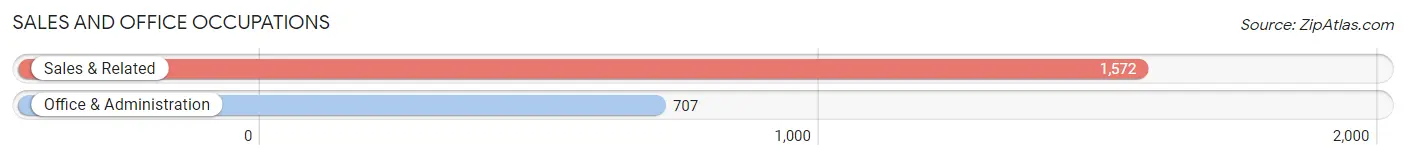
Sales and Office Occupations
The most common Sales and Office occupations in Mercer Island are Sales & Related (1,572 | 13.2%), and Office & Administration (707 | 5.9%).
Sales and Office Occupations by Sex
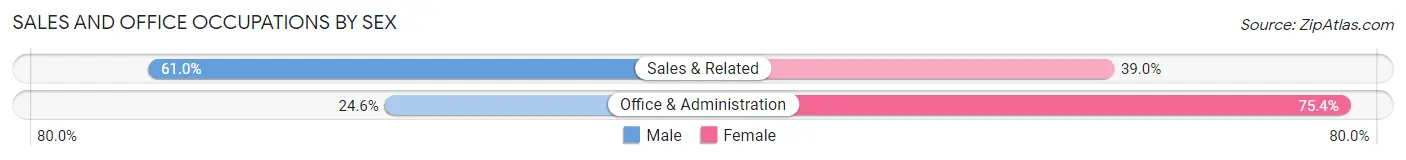
| Occupation | Male | Female |
| Sales & Related | 959 (61.0%) | 613 (39.0%) |
| Office & Administration | 174 (24.6%) | 533 (75.4%) |
| Total (Category) | 1,133 (49.7%) | 1,146 (50.3%) |
| Total (Overall) | 6,411 (53.9%) | 5,480 (46.1%) |
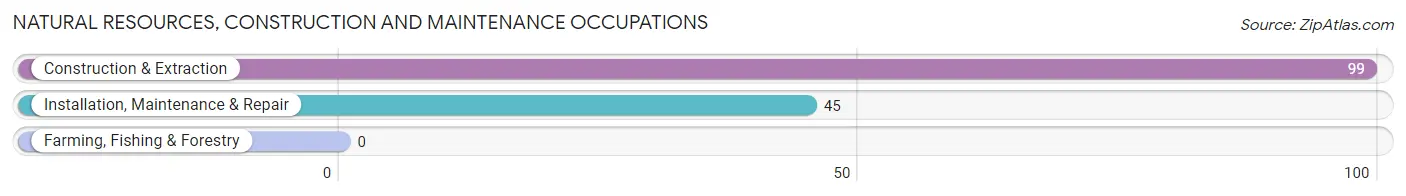
Natural Resources, Construction and Maintenance Occupations
The most common Natural Resources, Construction and Maintenance occupations in Mercer Island are Construction & Extraction (99 | 0.8%), and Installation, Maintenance & Repair (45 | 0.4%).
Natural Resources, Construction and Maintenance Occupations by Sex
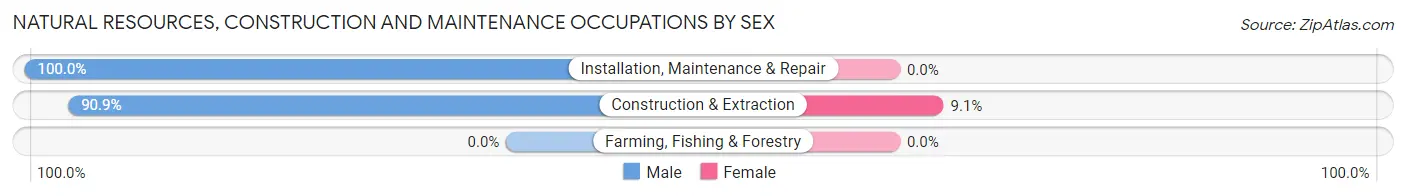
| Occupation | Male | Female |
| Farming, Fishing & Forestry | 0 (0.0%) | 0 (0.0%) |
| Construction & Extraction | 90 (90.9%) | 9 (9.1%) |
| Installation, Maintenance & Repair | 45 (100.0%) | 0 (0.0%) |
| Total (Category) | 135 (93.8%) | 9 (6.2%) |
| Total (Overall) | 6,411 (53.9%) | 5,480 (46.1%) |
Production, Transportation and Moving Occupations
The most common Production, Transportation and Moving occupations in Mercer Island are Transportation (170 | 1.4%), Production (38 | 0.3%), and Material Moving (37 | 0.3%).
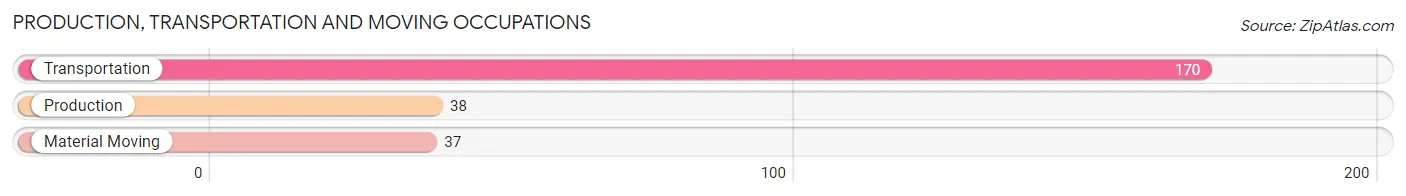
Production, Transportation and Moving Occupations by Sex
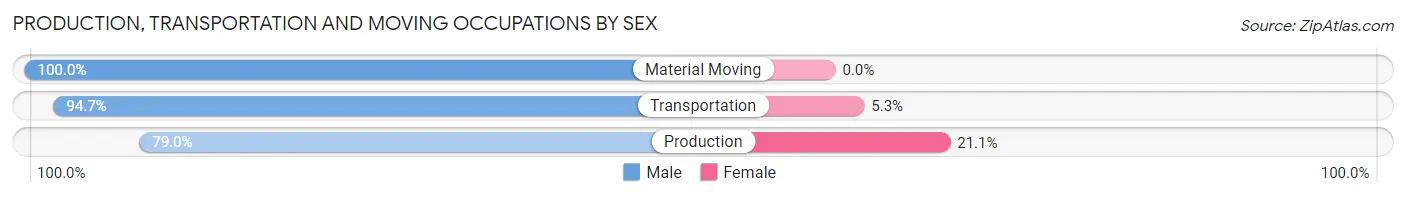
| Occupation | Male | Female |
| Production | 30 (78.9%) | 8 (21.0%) |
| Transportation | 161 (94.7%) | 9 (5.3%) |
| Material Moving | 37 (100.0%) | 0 (0.0%) |
| Total (Category) | 228 (93.1%) | 17 (6.9%) |
| Total (Overall) | 6,411 (53.9%) | 5,480 (46.1%) |
Employment Industries by Sex in Mercer Island
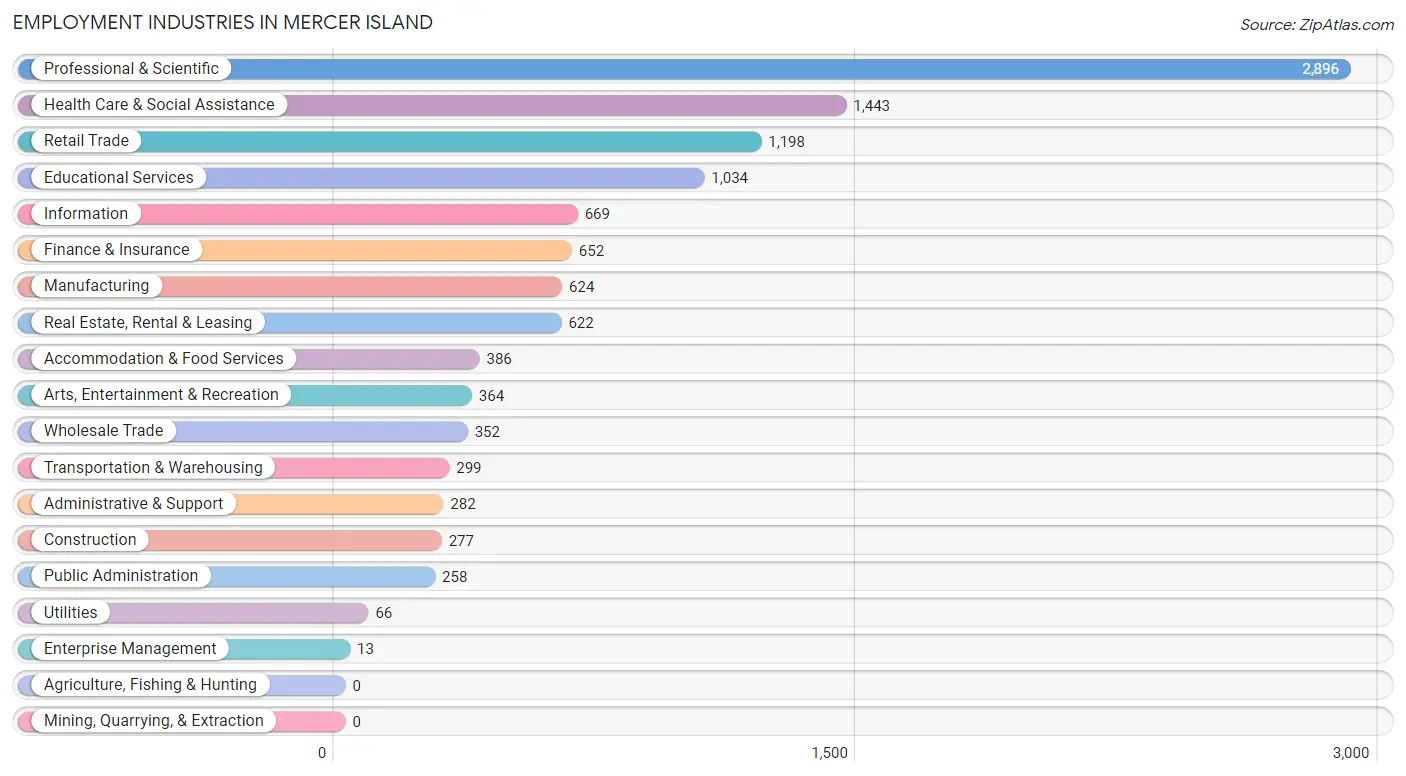
Employment Industries in Mercer Island
The major employment industries in Mercer Island include Professional & Scientific (2,896 | 24.3%), Health Care & Social Assistance (1,443 | 12.1%), Retail Trade (1,198 | 10.1%), Educational Services (1,034 | 8.7%), and Information (669 | 5.6%).
Employment Industries by Sex in Mercer Island
The Mercer Island industries that see more men than women are Utilities (100.0%), Construction (74.7%), and Wholesale Trade (68.5%), whereas the industries that tend to have a higher number of women are Enterprise Management (100.0%), Educational Services (63.1%), and Accommodation & Food Services (59.6%).
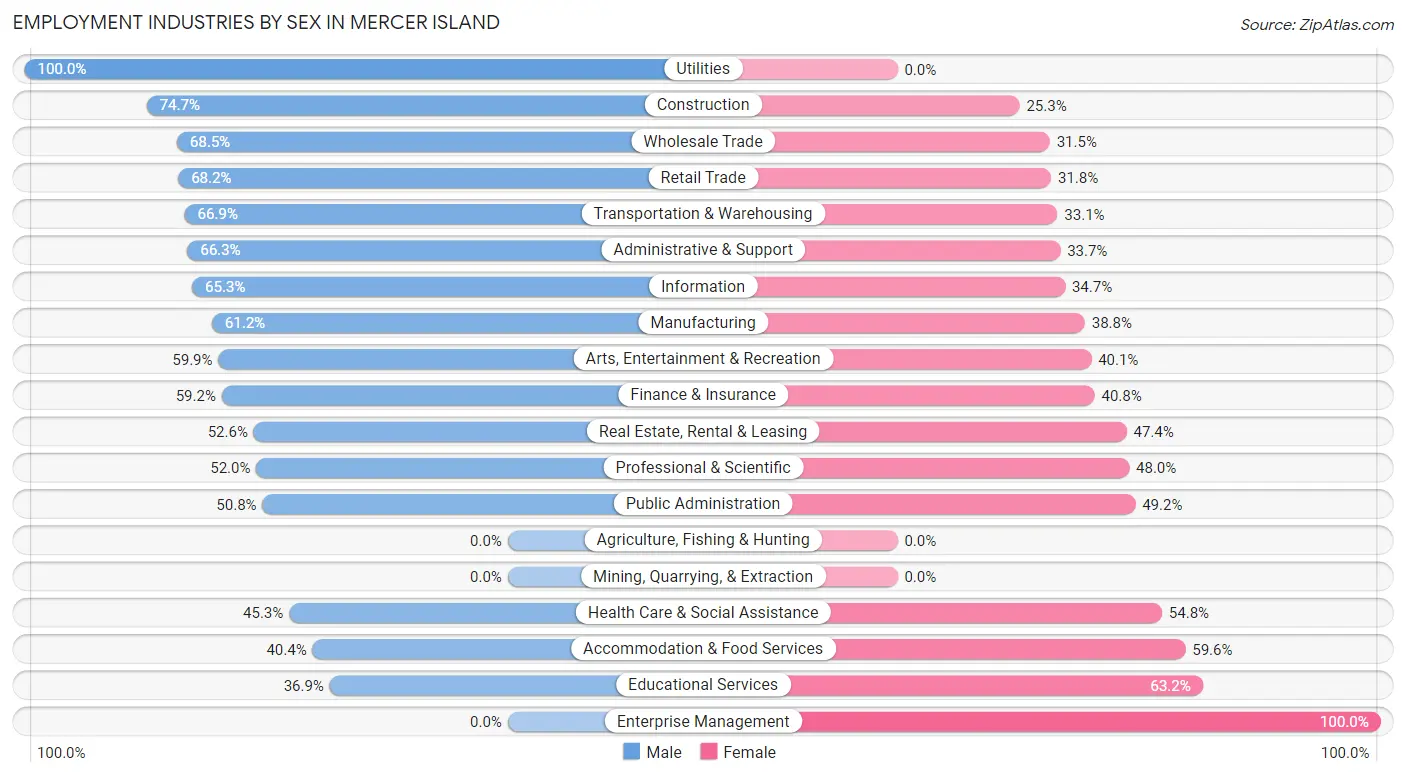
| Industry | Male | Female |
| Agriculture, Fishing & Hunting | 0 (0.0%) | 0 (0.0%) |
| Mining, Quarrying, & Extraction | 0 (0.0%) | 0 (0.0%) |
| Construction | 207 (74.7%) | 70 (25.3%) |
| Manufacturing | 382 (61.2%) | 242 (38.8%) |
| Wholesale Trade | 241 (68.5%) | 111 (31.5%) |
| Retail Trade | 817 (68.2%) | 381 (31.8%) |
| Transportation & Warehousing | 200 (66.9%) | 99 (33.1%) |
| Utilities | 66 (100.0%) | 0 (0.0%) |
| Information | 437 (65.3%) | 232 (34.7%) |
| Finance & Insurance | 386 (59.2%) | 266 (40.8%) |
| Real Estate, Rental & Leasing | 327 (52.6%) | 295 (47.4%) |
| Professional & Scientific | 1,507 (52.0%) | 1,389 (48.0%) |
| Enterprise Management | 0 (0.0%) | 13 (100.0%) |
| Administrative & Support | 187 (66.3%) | 95 (33.7%) |
| Educational Services | 381 (36.8%) | 653 (63.1%) |
| Health Care & Social Assistance | 653 (45.3%) | 790 (54.7%) |
| Arts, Entertainment & Recreation | 218 (59.9%) | 146 (40.1%) |
| Accommodation & Food Services | 156 (40.4%) | 230 (59.6%) |
| Public Administration | 131 (50.8%) | 127 (49.2%) |
| Total | 6,411 (53.9%) | 5,480 (46.1%) |
Education in Mercer Island
School Enrollment in Mercer Island
The most common levels of schooling among the 6,881 students in Mercer Island are high school (2,022 | 29.4%), elementary school (1,457 | 21.2%), and middle school (1,457 | 21.2%).
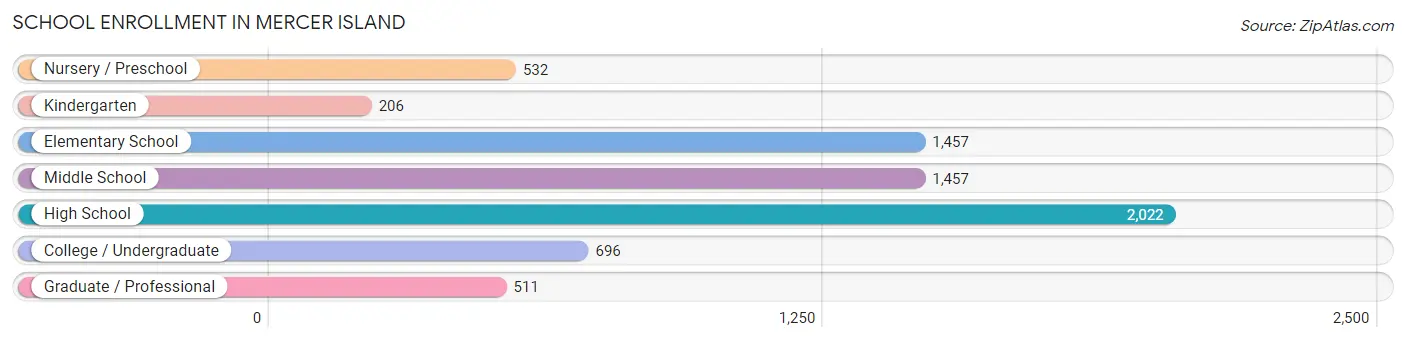
| School Level | # Students | % Students |
| Nursery / Preschool | 532 | 7.7% |
| Kindergarten | 206 | 3.0% |
| Elementary School | 1,457 | 21.2% |
| Middle School | 1,457 | 21.2% |
| High School | 2,022 | 29.4% |
| College / Undergraduate | 696 | 10.1% |
| Graduate / Professional | 511 | 7.4% |
| Total | 6,881 | 100.0% |
School Enrollment by Age by Funding Source in Mercer Island
Out of a total of 6,881 students who are enrolled in schools in Mercer Island, 1,548 (22.5%) attend a private institution, while the remaining 5,333 (77.5%) are enrolled in public schools. The age group of 3 to 4 year olds has the highest likelihood of being enrolled in private schools, with 255 (66.7% in the age bracket) enrolled. Conversely, the age group of 18 to 19 year olds has the lowest likelihood of being enrolled in a private school, with 559 (90.3% in the age bracket) attending a public institution.
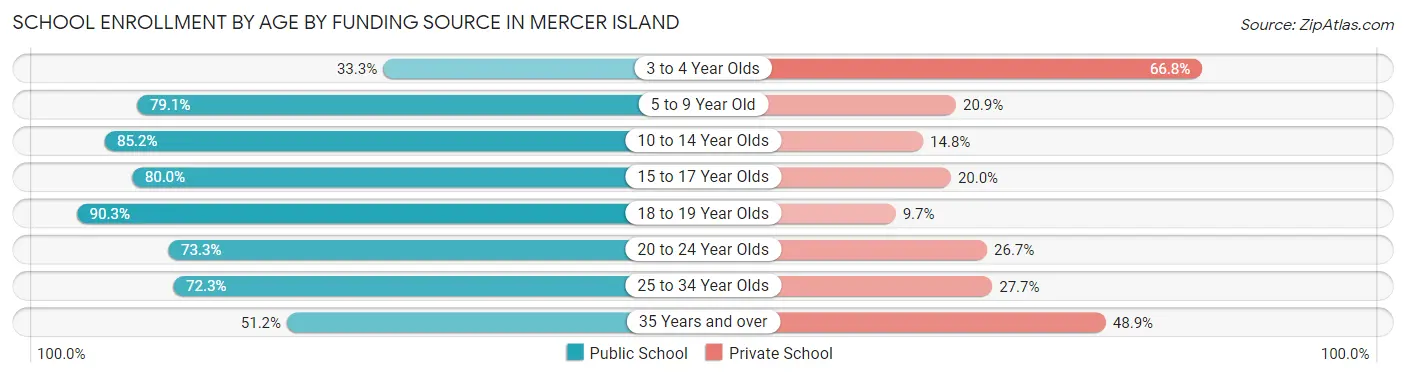
| Age Bracket | Public School | Private School |
| 3 to 4 Year Olds | 127 (33.3%) | 255 (66.7%) |
| 5 to 9 Year Old | 1,272 (79.1%) | 337 (20.9%) |
| 10 to 14 Year Olds | 1,599 (85.2%) | 278 (14.8%) |
| 15 to 17 Year Olds | 1,005 (80.0%) | 251 (20.0%) |
| 18 to 19 Year Olds | 559 (90.3%) | 60 (9.7%) |
| 20 to 24 Year Olds | 384 (73.3%) | 140 (26.7%) |
| 25 to 34 Year Olds | 256 (72.3%) | 98 (27.7%) |
| 35 Years and over | 133 (51.1%) | 127 (48.8%) |
| Total | 5,333 (77.5%) | 1,548 (22.5%) |
Educational Attainment by Field of Study in Mercer Island
Business (2,341 | 15.2%), social sciences (1,945 | 12.6%), engineering (1,918 | 12.4%), computers & mathematics (1,440 | 9.3%), and bio, nature & agricultural (1,322 | 8.6%) are the most common fields of study among 15,442 individuals in Mercer Island who have obtained a bachelor's degree or higher.
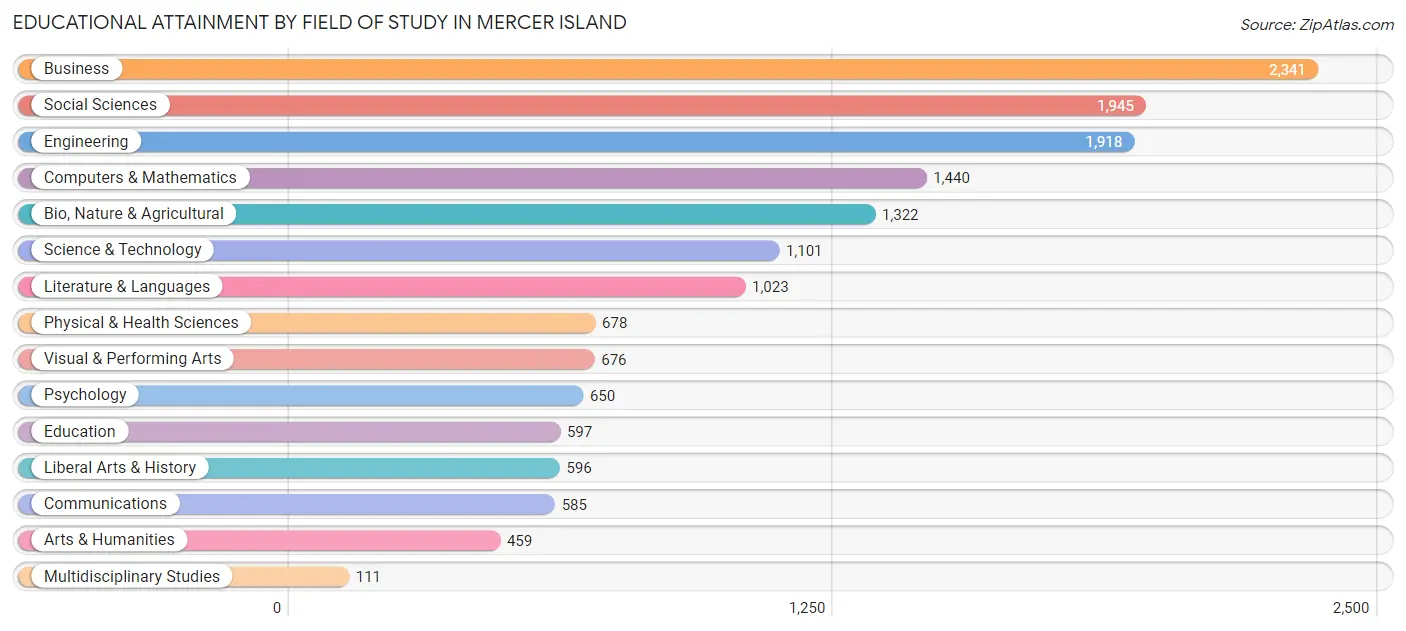
| Field of Study | # Graduates | % Graduates |
| Computers & Mathematics | 1,440 | 9.3% |
| Bio, Nature & Agricultural | 1,322 | 8.6% |
| Physical & Health Sciences | 678 | 4.4% |
| Psychology | 650 | 4.2% |
| Social Sciences | 1,945 | 12.6% |
| Engineering | 1,918 | 12.4% |
| Multidisciplinary Studies | 111 | 0.7% |
| Science & Technology | 1,101 | 7.1% |
| Business | 2,341 | 15.2% |
| Education | 597 | 3.9% |
| Literature & Languages | 1,023 | 6.6% |
| Liberal Arts & History | 596 | 3.9% |
| Visual & Performing Arts | 676 | 4.4% |
| Communications | 585 | 3.8% |
| Arts & Humanities | 459 | 3.0% |
| Total | 15,442 | 100.0% |
Transportation & Commute in Mercer Island
Vehicle Availability by Sex in Mercer Island
The most prevalent vehicle ownership categories in Mercer Island are males with 2 vehicles (2,848, accounting for 45.1%) and females with 2 vehicles (2,331, making up 53.3%).
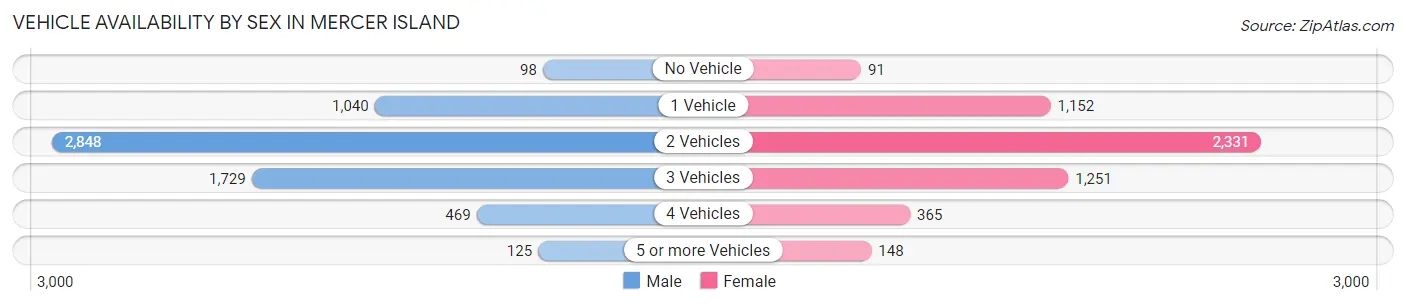
| Vehicles Available | Male | Female |
| No Vehicle | 98 (1.5%) | 91 (1.7%) |
| 1 Vehicle | 1,040 (16.5%) | 1,152 (21.6%) |
| 2 Vehicles | 2,848 (45.1%) | 2,331 (43.7%) |
| 3 Vehicles | 1,729 (27.4%) | 1,251 (23.4%) |
| 4 Vehicles | 469 (7.4%) | 365 (6.8%) |
| 5 or more Vehicles | 125 (2.0%) | 148 (2.8%) |
| Total | 6,309 (100.0%) | 5,338 (100.0%) |
Commute Time in Mercer Island
The most frequently occuring commute durations in Mercer Island are 30 to 34 minutes (1,739 commuters, 21.4%), 20 to 24 minutes (1,557 commuters, 19.2%), and 15 to 19 minutes (853 commuters, 10.5%).
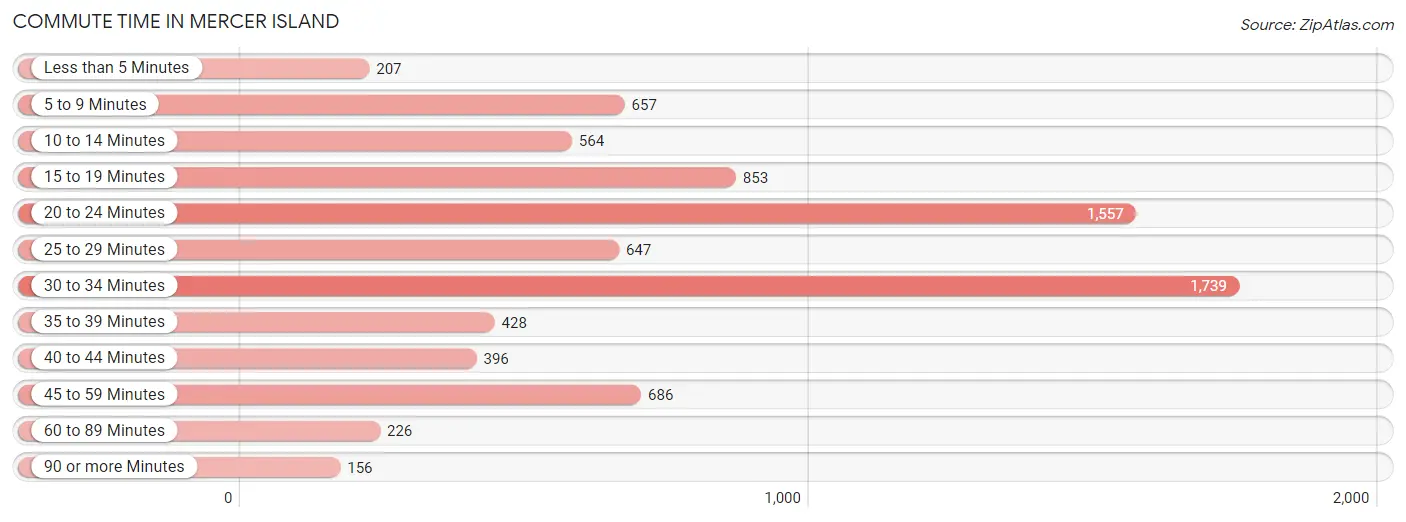
| Commute Time | # Commuters | % Commuters |
| Less than 5 Minutes | 207 | 2.5% |
| 5 to 9 Minutes | 657 | 8.1% |
| 10 to 14 Minutes | 564 | 7.0% |
| 15 to 19 Minutes | 853 | 10.5% |
| 20 to 24 Minutes | 1,557 | 19.2% |
| 25 to 29 Minutes | 647 | 8.0% |
| 30 to 34 Minutes | 1,739 | 21.4% |
| 35 to 39 Minutes | 428 | 5.3% |
| 40 to 44 Minutes | 396 | 4.9% |
| 45 to 59 Minutes | 686 | 8.5% |
| 60 to 89 Minutes | 226 | 2.8% |
| 90 or more Minutes | 156 | 1.9% |
Commute Time by Sex in Mercer Island
The most common commute times in Mercer Island are 30 to 34 minutes (973 commuters, 21.7%) for males and 20 to 24 minutes (778 commuters, 21.4%) for females.
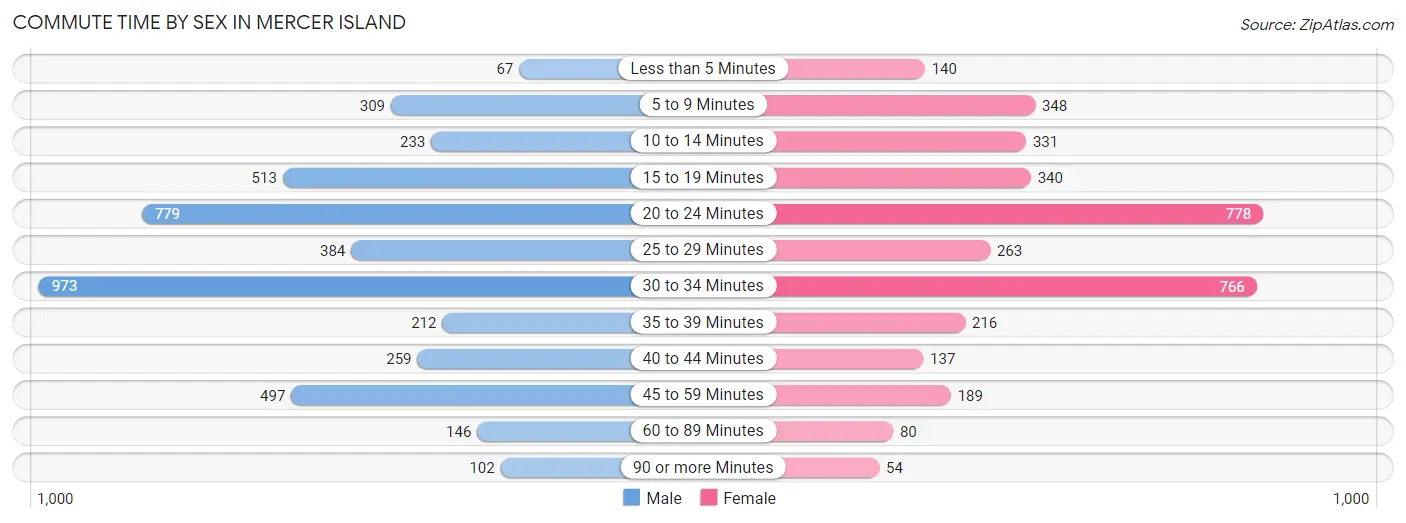
| Commute Time | Male | Female |
| Less than 5 Minutes | 67 (1.5%) | 140 (3.8%) |
| 5 to 9 Minutes | 309 (6.9%) | 348 (9.6%) |
| 10 to 14 Minutes | 233 (5.2%) | 331 (9.1%) |
| 15 to 19 Minutes | 513 (11.5%) | 340 (9.3%) |
| 20 to 24 Minutes | 779 (17.4%) | 778 (21.4%) |
| 25 to 29 Minutes | 384 (8.6%) | 263 (7.2%) |
| 30 to 34 Minutes | 973 (21.7%) | 766 (21.0%) |
| 35 to 39 Minutes | 212 (4.7%) | 216 (5.9%) |
| 40 to 44 Minutes | 259 (5.8%) | 137 (3.8%) |
| 45 to 59 Minutes | 497 (11.1%) | 189 (5.2%) |
| 60 to 89 Minutes | 146 (3.3%) | 80 (2.2%) |
| 90 or more Minutes | 102 (2.3%) | 54 (1.5%) |
Time of Departure to Work by Sex in Mercer Island
The most frequent times of departure to work in Mercer Island are 7:30 AM to 7:59 AM (762, 17.0%) for males and 7:30 AM to 7:59 AM (650, 17.8%) for females.
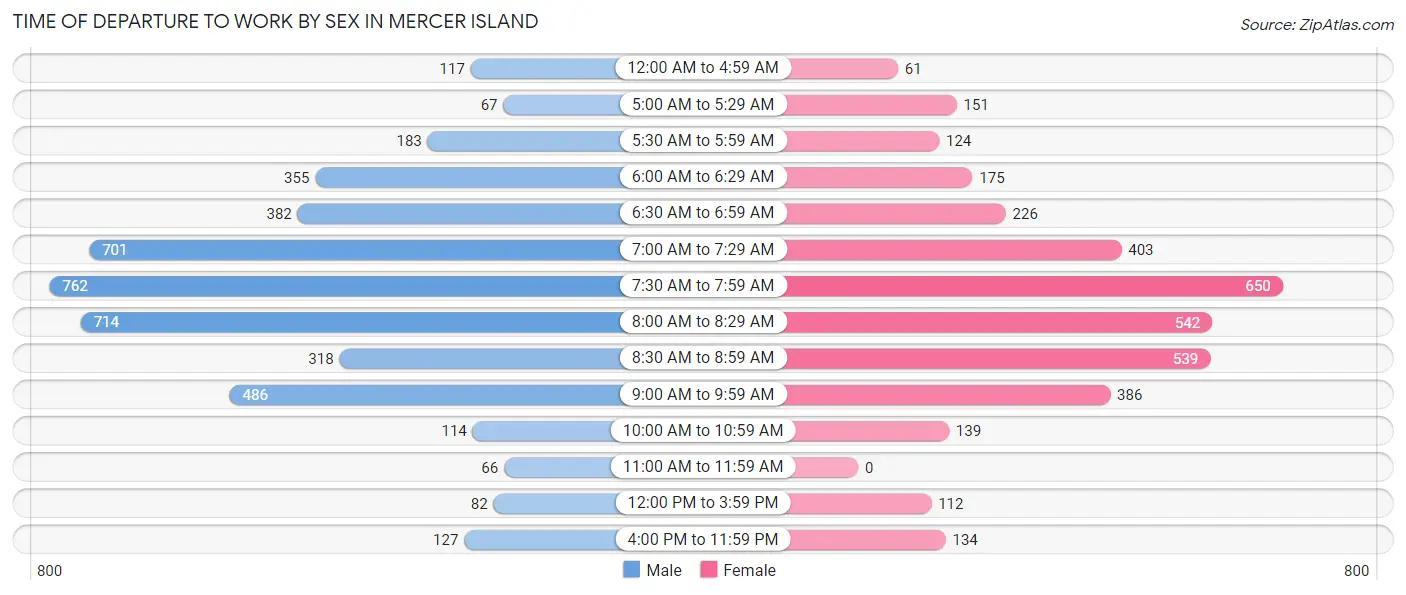
| Time of Departure | Male | Female |
| 12:00 AM to 4:59 AM | 117 (2.6%) | 61 (1.7%) |
| 5:00 AM to 5:29 AM | 67 (1.5%) | 151 (4.2%) |
| 5:30 AM to 5:59 AM | 183 (4.1%) | 124 (3.4%) |
| 6:00 AM to 6:29 AM | 355 (7.9%) | 175 (4.8%) |
| 6:30 AM to 6:59 AM | 382 (8.5%) | 226 (6.2%) |
| 7:00 AM to 7:29 AM | 701 (15.7%) | 403 (11.1%) |
| 7:30 AM to 7:59 AM | 762 (17.0%) | 650 (17.8%) |
| 8:00 AM to 8:29 AM | 714 (16.0%) | 542 (14.9%) |
| 8:30 AM to 8:59 AM | 318 (7.1%) | 539 (14.8%) |
| 9:00 AM to 9:59 AM | 486 (10.9%) | 386 (10.6%) |
| 10:00 AM to 10:59 AM | 114 (2.5%) | 139 (3.8%) |
| 11:00 AM to 11:59 AM | 66 (1.5%) | 0 (0.0%) |
| 12:00 PM to 3:59 PM | 82 (1.8%) | 112 (3.1%) |
| 4:00 PM to 11:59 PM | 127 (2.8%) | 134 (3.7%) |
| Total | 4,474 (100.0%) | 3,642 (100.0%) |
Housing Occupancy in Mercer Island
Occupancy by Ownership in Mercer Island
Of the total 9,782 dwellings in Mercer Island, owner-occupied units account for 6,649 (68.0%), while renter-occupied units make up 3,133 (32.0%).
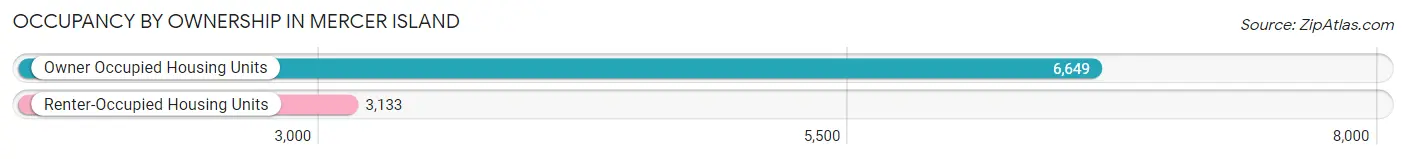
| Occupancy | # Housing Units | % Housing Units |
| Owner Occupied Housing Units | 6,649 | 68.0% |
| Renter-Occupied Housing Units | 3,133 | 32.0% |
| Total Occupied Housing Units | 9,782 | 100.0% |
Occupancy by Household Size in Mercer Island
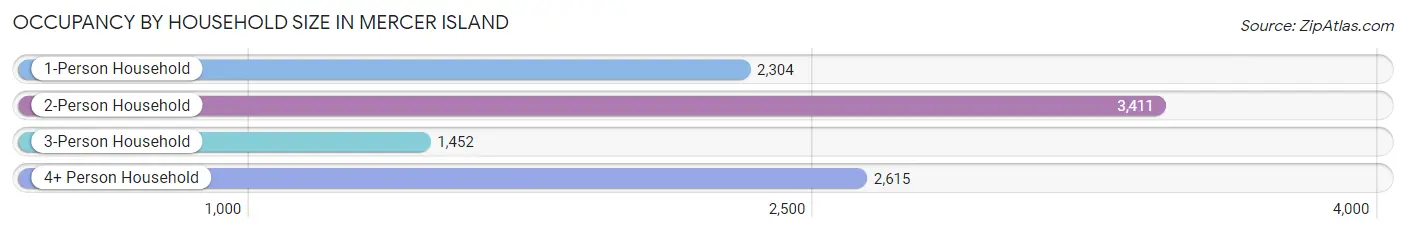
| Household Size | # Housing Units | % Housing Units |
| 1-Person Household | 2,304 | 23.5% |
| 2-Person Household | 3,411 | 34.9% |
| 3-Person Household | 1,452 | 14.8% |
| 4+ Person Household | 2,615 | 26.7% |
| Total Housing Units | 9,782 | 100.0% |
Occupancy by Ownership by Household Size in Mercer Island
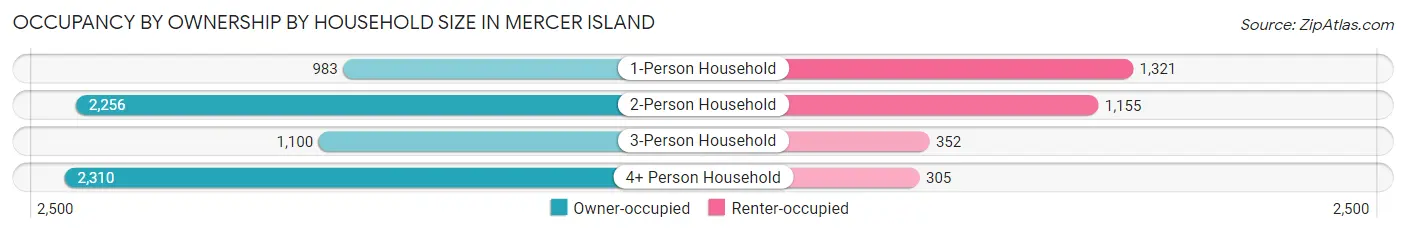
| Household Size | Owner-occupied | Renter-occupied |
| 1-Person Household | 983 (42.7%) | 1,321 (57.3%) |
| 2-Person Household | 2,256 (66.1%) | 1,155 (33.9%) |
| 3-Person Household | 1,100 (75.8%) | 352 (24.2%) |
| 4+ Person Household | 2,310 (88.3%) | 305 (11.7%) |
| Total Housing Units | 6,649 (68.0%) | 3,133 (32.0%) |
Occupancy by Educational Attainment in Mercer Island
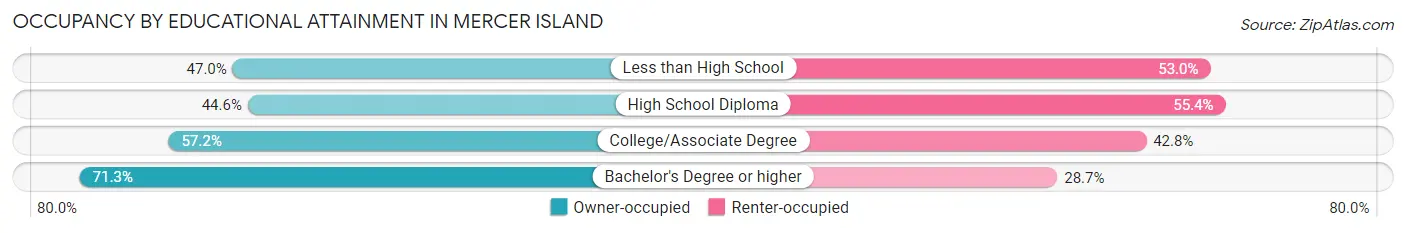
| Household Size | Owner-occupied | Renter-occupied |
| Less than High School | 63 (47.0%) | 71 (53.0%) |
| High School Diploma | 182 (44.6%) | 226 (55.4%) |
| College/Associate Degree | 734 (57.2%) | 550 (42.8%) |
| Bachelor's Degree or higher | 5,670 (71.3%) | 2,286 (28.7%) |
Occupancy by Age of Householder in Mercer Island
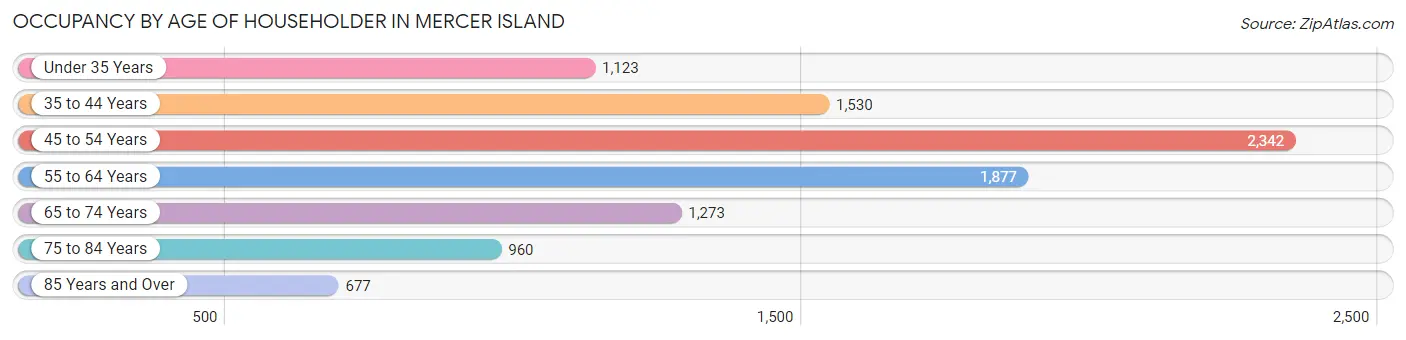
| Age Bracket | # Households | % Households |
| Under 35 Years | 1,123 | 11.5% |
| 35 to 44 Years | 1,530 | 15.6% |
| 45 to 54 Years | 2,342 | 23.9% |
| 55 to 64 Years | 1,877 | 19.2% |
| 65 to 74 Years | 1,273 | 13.0% |
| 75 to 84 Years | 960 | 9.8% |
| 85 Years and Over | 677 | 6.9% |
| Total | 9,782 | 100.0% |
Housing Finances in Mercer Island
Median Income by Occupancy in Mercer Island
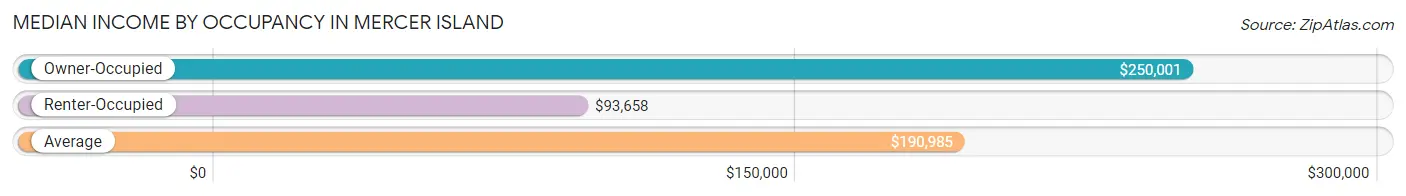
| Occupancy Type | # Households | Median Income |
| Owner-Occupied | 6,649 (68.0%) | $250,001 |
| Renter-Occupied | 3,133 (32.0%) | $93,658 |
| Average | 9,782 (100.0%) | $190,985 |
Occupancy by Householder Income Bracket in Mercer Island
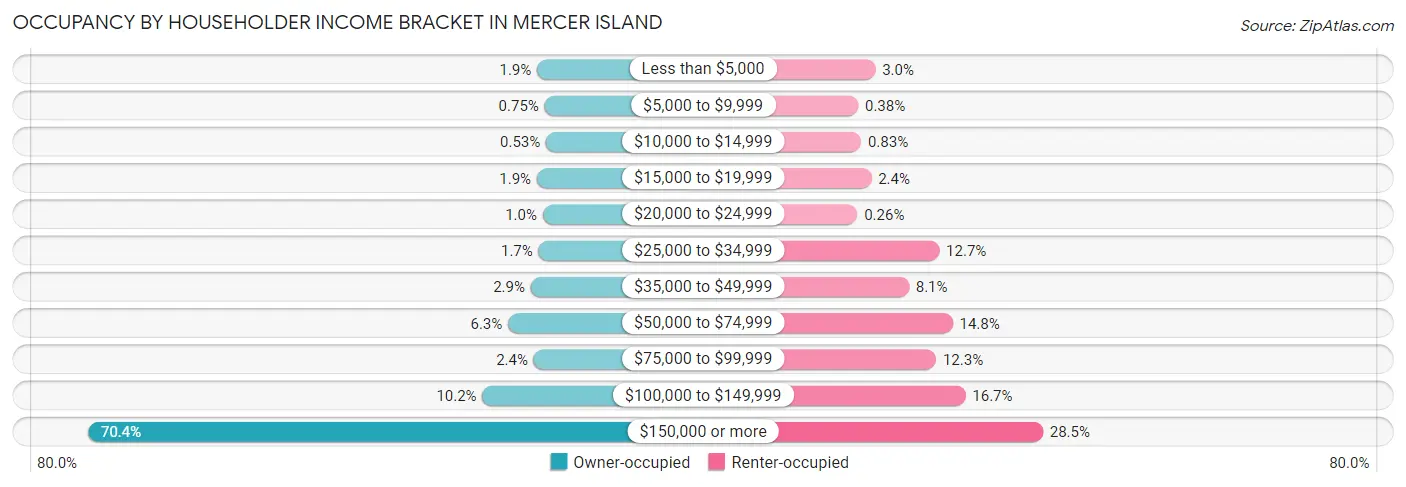
| Income Bracket | Owner-occupied | Renter-occupied |
| Less than $5,000 | 126 (1.9%) | 94 (3.0%) |
| $5,000 to $9,999 | 50 (0.7%) | 12 (0.4%) |
| $10,000 to $14,999 | 35 (0.5%) | 26 (0.8%) |
| $15,000 to $19,999 | 128 (1.9%) | 75 (2.4%) |
| $20,000 to $24,999 | 69 (1.0%) | 8 (0.3%) |
| $25,000 to $34,999 | 111 (1.7%) | 399 (12.7%) |
| $35,000 to $49,999 | 191 (2.9%) | 254 (8.1%) |
| $50,000 to $74,999 | 420 (6.3%) | 463 (14.8%) |
| $75,000 to $99,999 | 160 (2.4%) | 384 (12.3%) |
| $100,000 to $149,999 | 680 (10.2%) | 524 (16.7%) |
| $150,000 or more | 4,679 (70.4%) | 894 (28.5%) |
| Total | 6,649 (100.0%) | 3,133 (100.0%) |
Monthly Housing Cost Tiers in Mercer Island
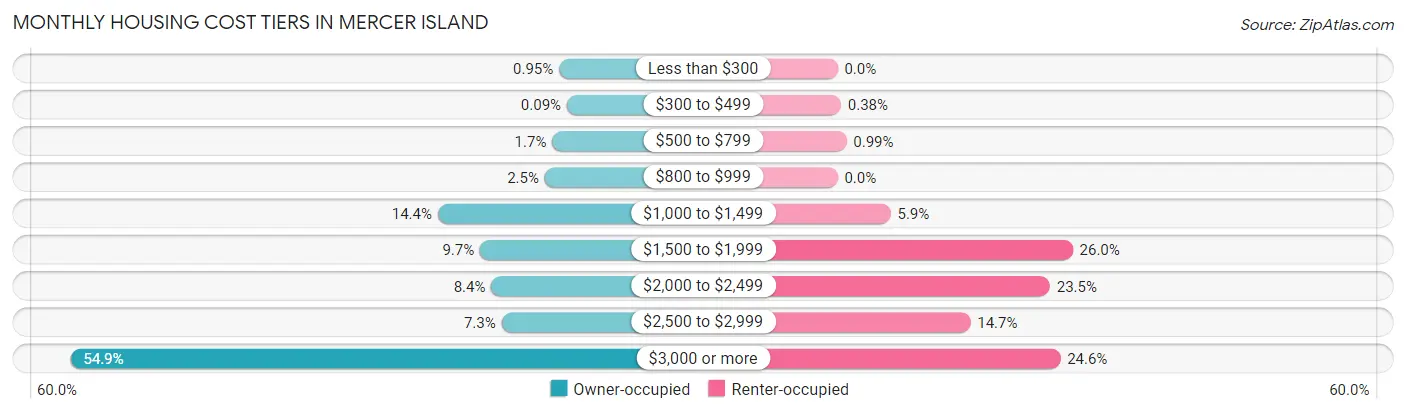
| Monthly Cost | Owner-occupied | Renter-occupied |
| Less than $300 | 63 (0.9%) | 0 (0.0%) |
| $300 to $499 | 6 (0.1%) | 12 (0.4%) |
| $500 to $799 | 114 (1.7%) | 31 (1.0%) |
| $800 to $999 | 168 (2.5%) | 0 (0.0%) |
| $1,000 to $1,499 | 954 (14.3%) | 184 (5.9%) |
| $1,500 to $1,999 | 644 (9.7%) | 814 (26.0%) |
| $2,000 to $2,499 | 561 (8.4%) | 735 (23.5%) |
| $2,500 to $2,999 | 486 (7.3%) | 460 (14.7%) |
| $3,000 or more | 3,653 (54.9%) | 771 (24.6%) |
| Total | 6,649 (100.0%) | 3,133 (100.0%) |
Physical Housing Characteristics in Mercer Island
Housing Structures in Mercer Island
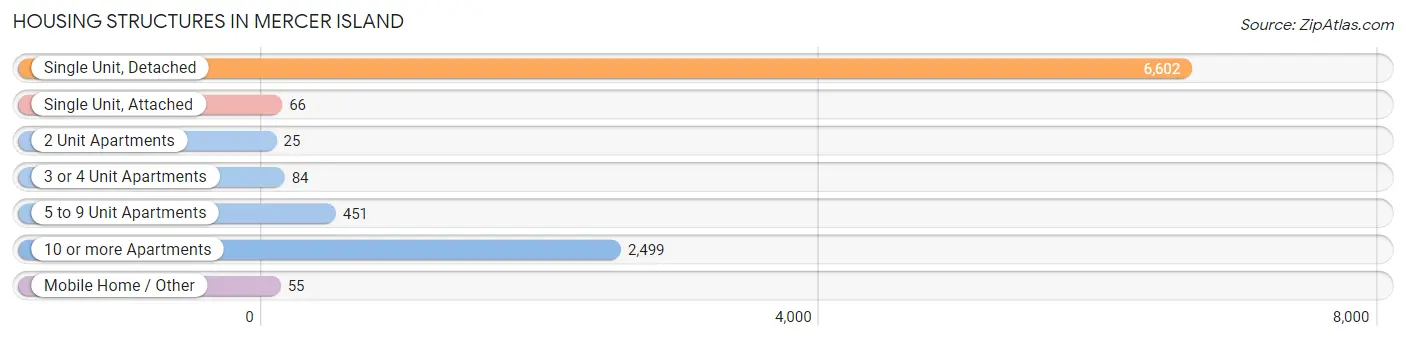
| Structure Type | # Housing Units | % Housing Units |
| Single Unit, Detached | 6,602 | 67.5% |
| Single Unit, Attached | 66 | 0.7% |
| 2 Unit Apartments | 25 | 0.3% |
| 3 or 4 Unit Apartments | 84 | 0.9% |
| 5 to 9 Unit Apartments | 451 | 4.6% |
| 10 or more Apartments | 2,499 | 25.6% |
| Mobile Home / Other | 55 | 0.6% |
| Total | 9,782 | 100.0% |
Housing Structures by Occupancy in Mercer Island
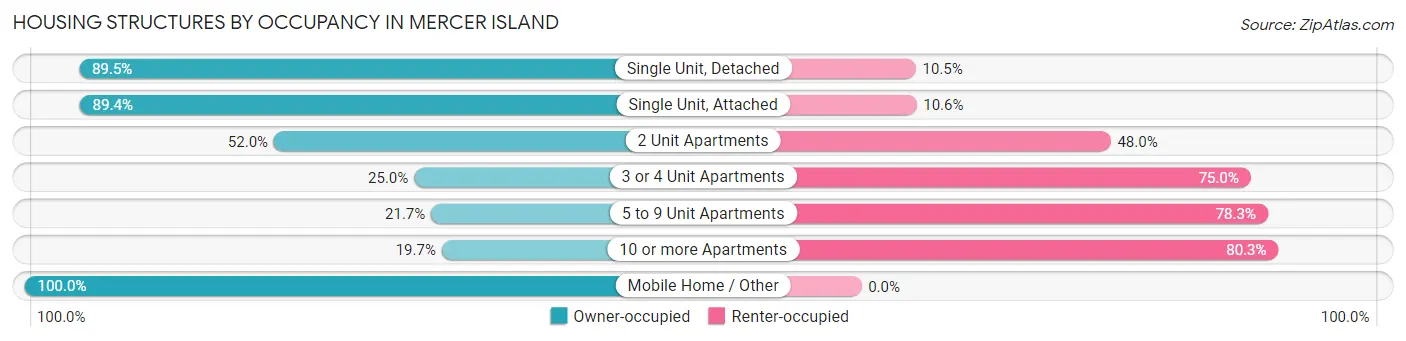
| Structure Type | Owner-occupied | Renter-occupied |
| Single Unit, Detached | 5,911 (89.5%) | 691 (10.5%) |
| Single Unit, Attached | 59 (89.4%) | 7 (10.6%) |
| 2 Unit Apartments | 13 (52.0%) | 12 (48.0%) |
| 3 or 4 Unit Apartments | 21 (25.0%) | 63 (75.0%) |
| 5 to 9 Unit Apartments | 98 (21.7%) | 353 (78.3%) |
| 10 or more Apartments | 492 (19.7%) | 2,007 (80.3%) |
| Mobile Home / Other | 55 (100.0%) | 0 (0.0%) |
| Total | 6,649 (68.0%) | 3,133 (32.0%) |
Housing Structures by Number of Rooms in Mercer Island
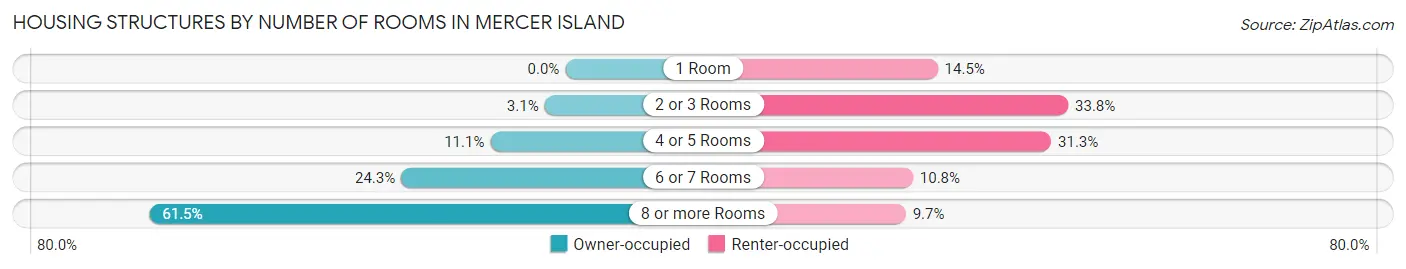
| Number of Rooms | Owner-occupied | Renter-occupied |
| 1 Room | 0 (0.0%) | 453 (14.5%) |
| 2 or 3 Rooms | 204 (3.1%) | 1,058 (33.8%) |
| 4 or 5 Rooms | 738 (11.1%) | 979 (31.2%) |
| 6 or 7 Rooms | 1,616 (24.3%) | 338 (10.8%) |
| 8 or more Rooms | 4,091 (61.5%) | 305 (9.7%) |
| Total | 6,649 (100.0%) | 3,133 (100.0%) |
Housing Structure by Heating Type in Mercer Island
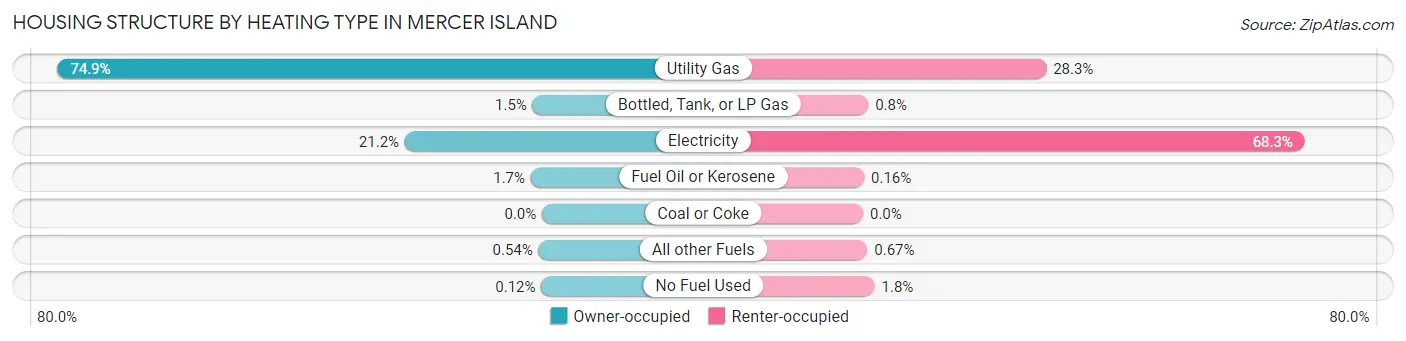
| Heating Type | Owner-occupied | Renter-occupied |
| Utility Gas | 4,982 (74.9%) | 887 (28.3%) |
| Bottled, Tank, or LP Gas | 97 (1.5%) | 25 (0.8%) |
| Electricity | 1,410 (21.2%) | 2,139 (68.3%) |
| Fuel Oil or Kerosene | 116 (1.7%) | 5 (0.2%) |
| Coal or Coke | 0 (0.0%) | 0 (0.0%) |
| All other Fuels | 36 (0.5%) | 21 (0.7%) |
| No Fuel Used | 8 (0.1%) | 56 (1.8%) |
| Total | 6,649 (100.0%) | 3,133 (100.0%) |
Household Vehicle Usage in Mercer Island
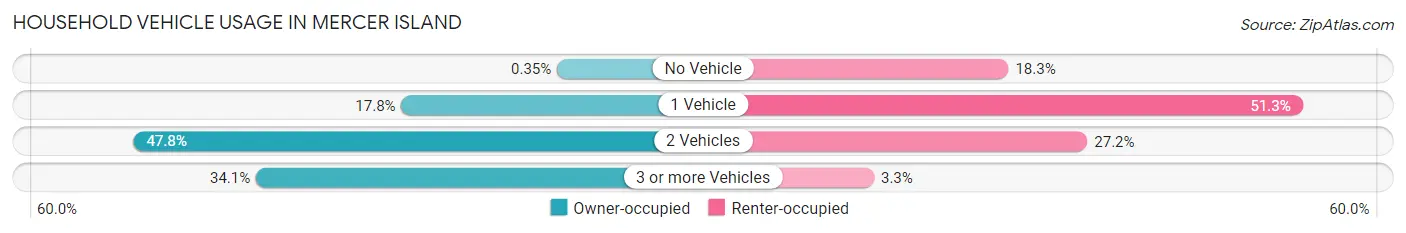
| Vehicles per Household | Owner-occupied | Renter-occupied |
| No Vehicle | 23 (0.4%) | 574 (18.3%) |
| 1 Vehicle | 1,183 (17.8%) | 1,606 (51.3%) |
| 2 Vehicles | 3,178 (47.8%) | 851 (27.2%) |
| 3 or more Vehicles | 2,265 (34.1%) | 102 (3.3%) |
| Total | 6,649 (100.0%) | 3,133 (100.0%) |
Real Estate & Mortgages in Mercer Island
Real Estate and Mortgage Overview in Mercer Island
| Characteristic | Without Mortgage | With Mortgage |
| Housing Units | 2,522 | 4,127 |
| Median Property Value | $1,576,100 | $1,739,400 |
| Median Household Income | $173,056 | $3,335 |
| Monthly Housing Costs | $1,501 | $3,384 |
| Real Estate Taxes | $10,001 | $6 |
Property Value by Mortgage Status in Mercer Island
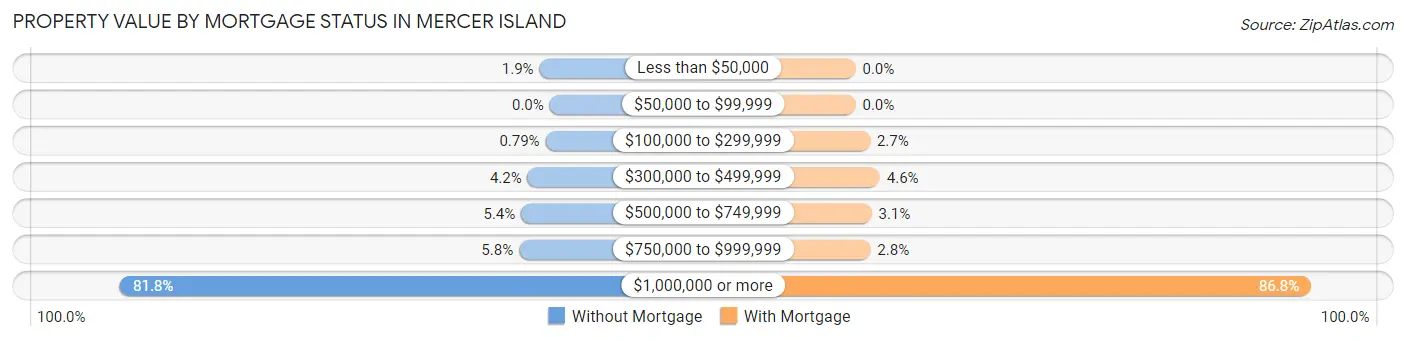
| Property Value | Without Mortgage | With Mortgage |
| Less than $50,000 | 49 (1.9%) | 0 (0.0%) |
| $50,000 to $99,999 | 0 (0.0%) | 0 (0.0%) |
| $100,000 to $299,999 | 20 (0.8%) | 113 (2.7%) |
| $300,000 to $499,999 | 106 (4.2%) | 191 (4.6%) |
| $500,000 to $749,999 | 137 (5.4%) | 126 (3.0%) |
| $750,000 to $999,999 | 147 (5.8%) | 117 (2.8%) |
| $1,000,000 or more | 2,063 (81.8%) | 3,580 (86.8%) |
| Total | 2,522 (100.0%) | 4,127 (100.0%) |
Household Income by Mortgage Status in Mercer Island
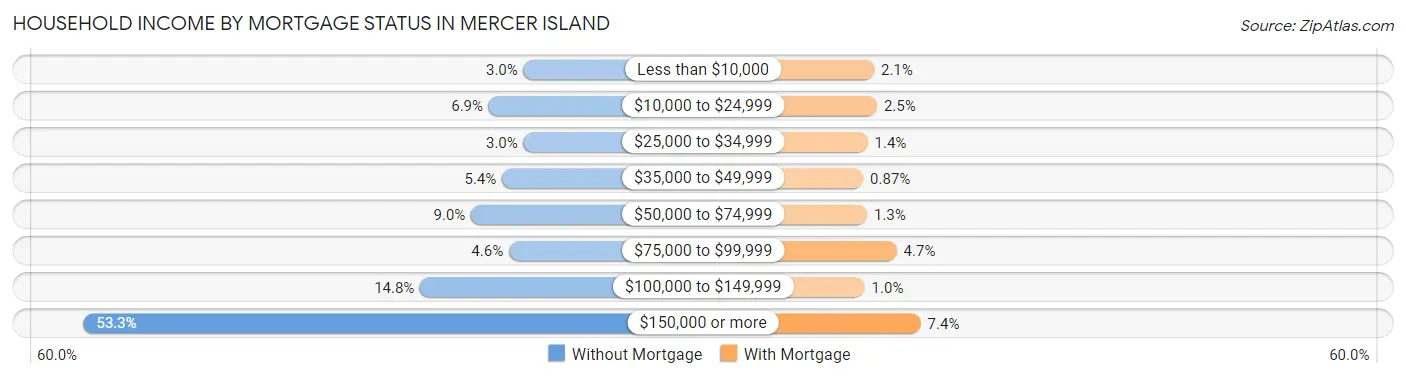
| Household Income | Without Mortgage | With Mortgage |
| Less than $10,000 | 75 (3.0%) | 87 (2.1%) |
| $10,000 to $24,999 | 175 (6.9%) | 101 (2.5%) |
| $25,000 to $34,999 | 75 (3.0%) | 57 (1.4%) |
| $35,000 to $49,999 | 137 (5.4%) | 36 (0.9%) |
| $50,000 to $74,999 | 226 (9.0%) | 54 (1.3%) |
| $75,000 to $99,999 | 117 (4.6%) | 194 (4.7%) |
| $100,000 to $149,999 | 373 (14.8%) | 43 (1.0%) |
| $150,000 or more | 1,344 (53.3%) | 307 (7.4%) |
| Total | 2,522 (100.0%) | 4,127 (100.0%) |
Property Value to Household Income Ratio in Mercer Island
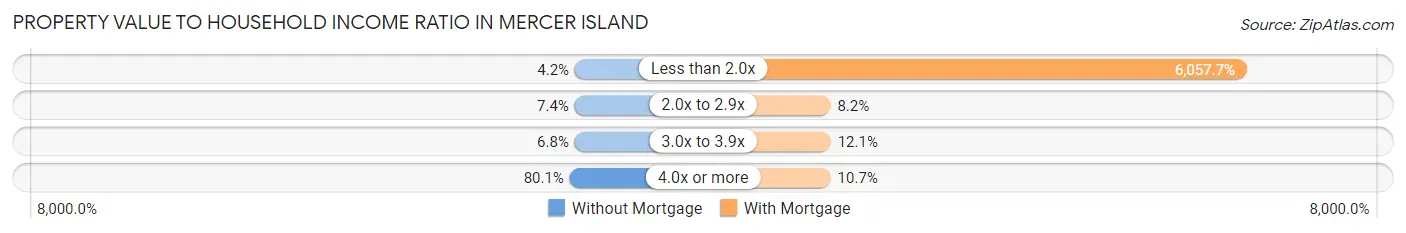
| Value-to-Income Ratio | Without Mortgage | With Mortgage |
| Less than 2.0x | 107 (4.2%) | 250,001 (6,057.7%) |
| 2.0x to 2.9x | 187 (7.4%) | 340 (8.2%) |
| 3.0x to 3.9x | 172 (6.8%) | 499 (12.1%) |
| 4.0x or more | 2,021 (80.1%) | 443 (10.7%) |
| Total | 2,522 (100.0%) | 4,127 (100.0%) |
Real Estate Taxes by Mortgage Status in Mercer Island
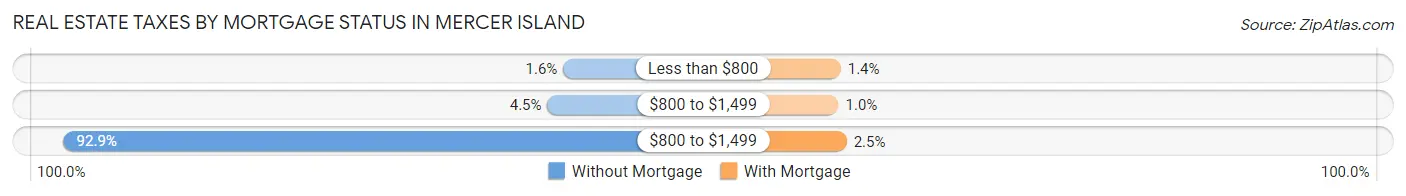
| Property Taxes | Without Mortgage | With Mortgage |
| Less than $800 | 41 (1.6%) | 58 (1.4%) |
| $800 to $1,499 | 114 (4.5%) | 42 (1.0%) |
| $800 to $1,499 | 2,342 (92.9%) | 103 (2.5%) |
| Total | 2,522 (100.0%) | 4,127 (100.0%) |
Health & Disability in Mercer Island
Health Insurance Coverage by Age in Mercer Island
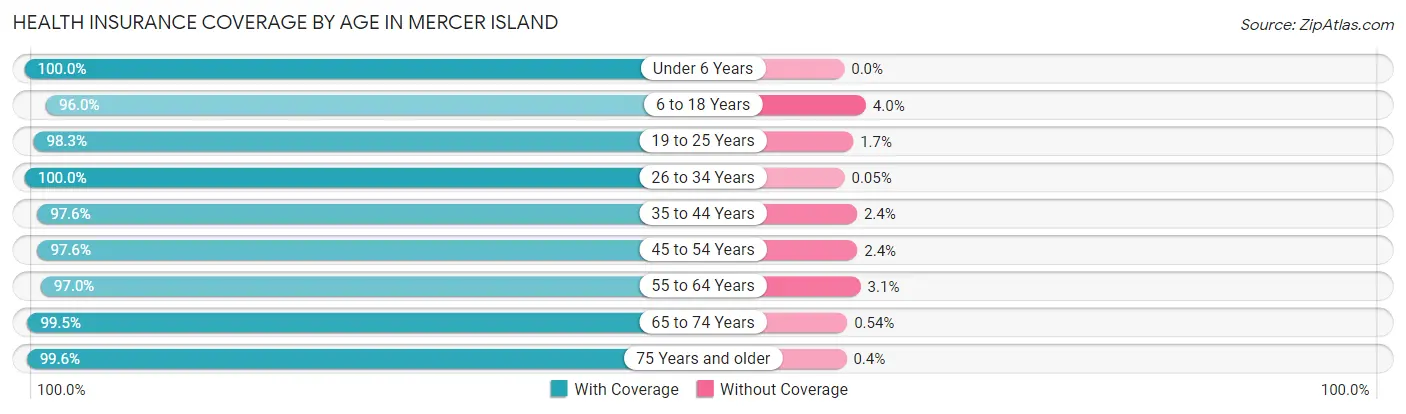
| Age Bracket | With Coverage | Without Coverage |
| Under 6 Years | 1,266 (100.0%) | 0 (0.0%) |
| 6 to 18 Years | 4,911 (96.0%) | 206 (4.0%) |
| 19 to 25 Years | 1,180 (98.3%) | 20 (1.7%) |
| 26 to 34 Years | 1,869 (100.0%) | 1 (0.1%) |
| 35 to 44 Years | 3,043 (97.6%) | 74 (2.4%) |
| 45 to 54 Years | 4,211 (97.6%) | 105 (2.4%) |
| 55 to 64 Years | 3,270 (97.0%) | 103 (3.0%) |
| 65 to 74 Years | 2,580 (99.5%) | 14 (0.5%) |
| 75 Years and older | 2,494 (99.6%) | 10 (0.4%) |
| Total | 24,824 (97.9%) | 533 (2.1%) |
Health Insurance Coverage by Citizenship Status in Mercer Island
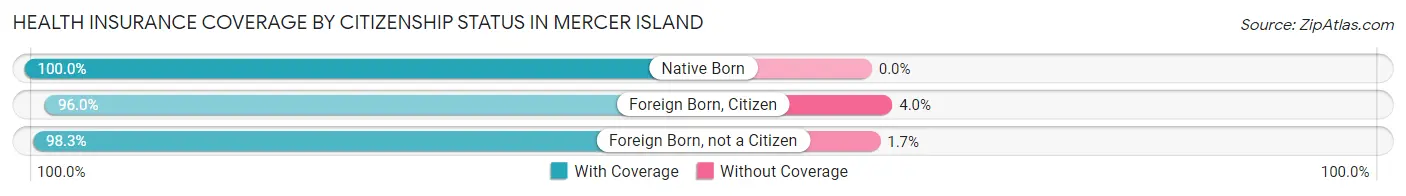
| Citizenship Status | With Coverage | Without Coverage |
| Native Born | 1,266 (100.0%) | 0 (0.0%) |
| Foreign Born, Citizen | 4,911 (96.0%) | 206 (4.0%) |
| Foreign Born, not a Citizen | 1,180 (98.3%) | 20 (1.7%) |
Health Insurance Coverage by Household Income in Mercer Island
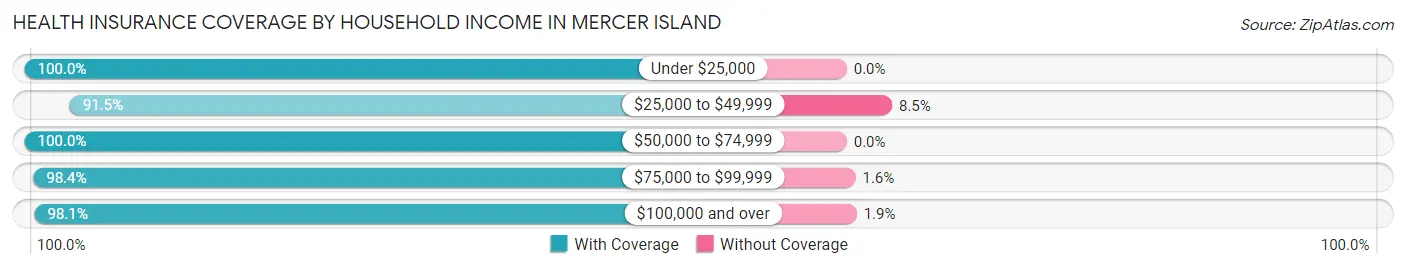
| Household Income | With Coverage | Without Coverage |
| Under $25,000 | 1,072 (100.0%) | 0 (0.0%) |
| $25,000 to $49,999 | 1,555 (91.5%) | 144 (8.5%) |
| $50,000 to $74,999 | 1,641 (100.0%) | 0 (0.0%) |
| $75,000 to $99,999 | 838 (98.4%) | 14 (1.6%) |
| $100,000 and over | 19,679 (98.1%) | 373 (1.9%) |
Public vs Private Health Insurance Coverage by Age in Mercer Island
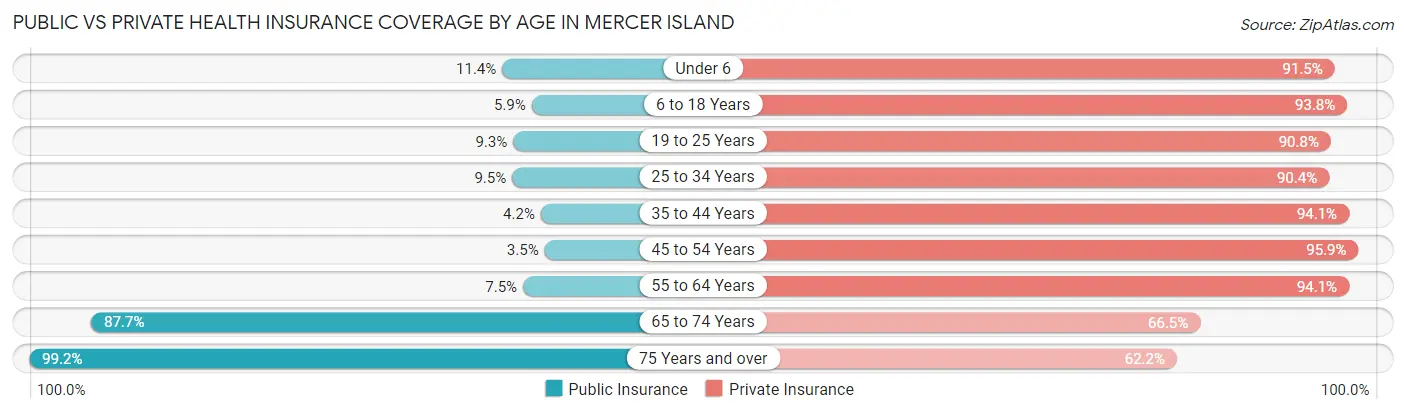
| Age Bracket | Public Insurance | Private Insurance |
| Under 6 | 144 (11.4%) | 1,158 (91.5%) |
| 6 to 18 Years | 302 (5.9%) | 4,799 (93.8%) |
| 19 to 25 Years | 112 (9.3%) | 1,089 (90.7%) |
| 25 to 34 Years | 178 (9.5%) | 1,691 (90.4%) |
| 35 to 44 Years | 131 (4.2%) | 2,934 (94.1%) |
| 45 to 54 Years | 151 (3.5%) | 4,138 (95.9%) |
| 55 to 64 Years | 253 (7.5%) | 3,175 (94.1%) |
| 65 to 74 Years | 2,274 (87.7%) | 1,725 (66.5%) |
| 75 Years and over | 2,483 (99.2%) | 1,557 (62.2%) |
| Total | 6,028 (23.8%) | 22,266 (87.8%) |
Disability Status by Sex by Age in Mercer Island
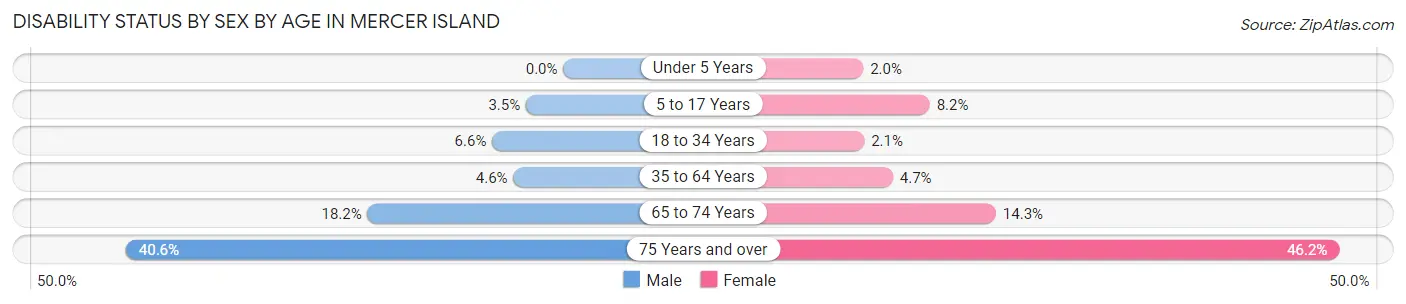
| Age Bracket | Male | Female |
| Under 5 Years | 0 (0.0%) | 12 (2.0%) |
| 5 to 17 Years | 78 (3.5%) | 212 (8.2%) |
| 18 to 34 Years | 128 (6.6%) | 34 (2.1%) |
| 35 to 64 Years | 233 (4.6%) | 274 (4.7%) |
| 65 to 74 Years | 235 (18.2%) | 186 (14.3%) |
| 75 Years and over | 408 (40.6%) | 692 (46.2%) |
Disability Class by Sex by Age in Mercer Island
Disability Class: Hearing Difficulty
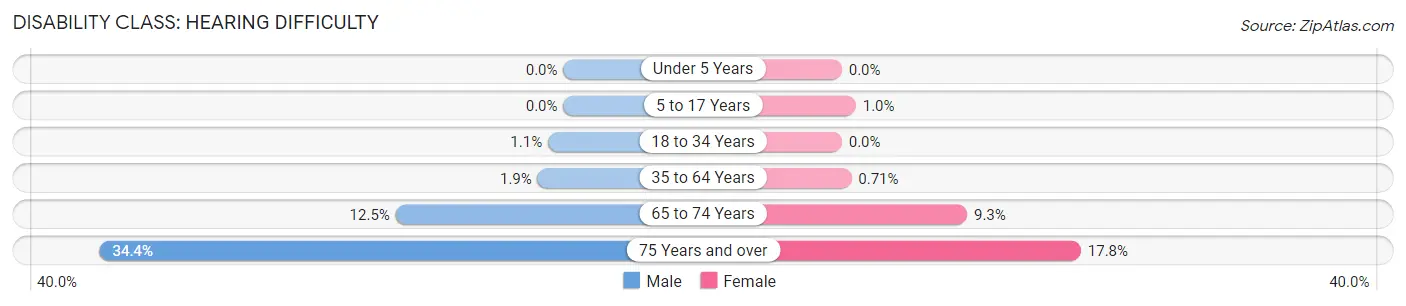
| Age Bracket | Male | Female |
| Under 5 Years | 0 (0.0%) | 0 (0.0%) |
| 5 to 17 Years | 0 (0.0%) | 27 (1.0%) |
| 18 to 34 Years | 22 (1.1%) | 0 (0.0%) |
| 35 to 64 Years | 96 (1.9%) | 41 (0.7%) |
| 65 to 74 Years | 161 (12.4%) | 121 (9.3%) |
| 75 Years and over | 346 (34.4%) | 266 (17.7%) |
Disability Class: Vision Difficulty
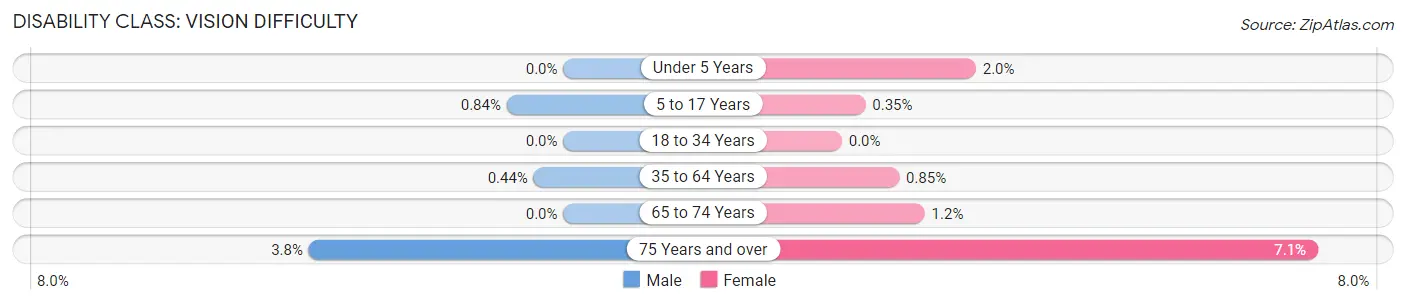
| Age Bracket | Male | Female |
| Under 5 Years | 0 (0.0%) | 12 (2.0%) |
| 5 to 17 Years | 19 (0.8%) | 9 (0.4%) |
| 18 to 34 Years | 0 (0.0%) | 0 (0.0%) |
| 35 to 64 Years | 22 (0.4%) | 49 (0.9%) |
| 65 to 74 Years | 0 (0.0%) | 16 (1.2%) |
| 75 Years and over | 38 (3.8%) | 106 (7.1%) |
Disability Class: Cognitive Difficulty
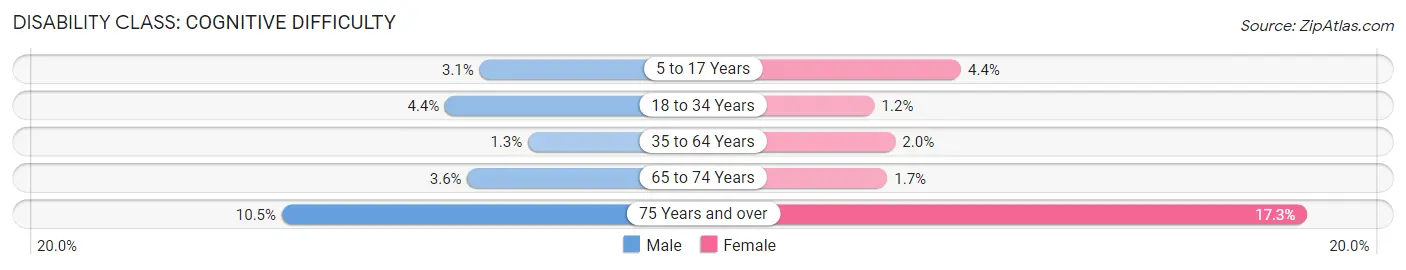
| Age Bracket | Male | Female |
| 5 to 17 Years | 70 (3.1%) | 115 (4.4%) |
| 18 to 34 Years | 85 (4.4%) | 20 (1.2%) |
| 35 to 64 Years | 66 (1.3%) | 115 (2.0%) |
| 65 to 74 Years | 46 (3.6%) | 22 (1.7%) |
| 75 Years and over | 105 (10.4%) | 259 (17.3%) |
Disability Class: Ambulatory Difficulty
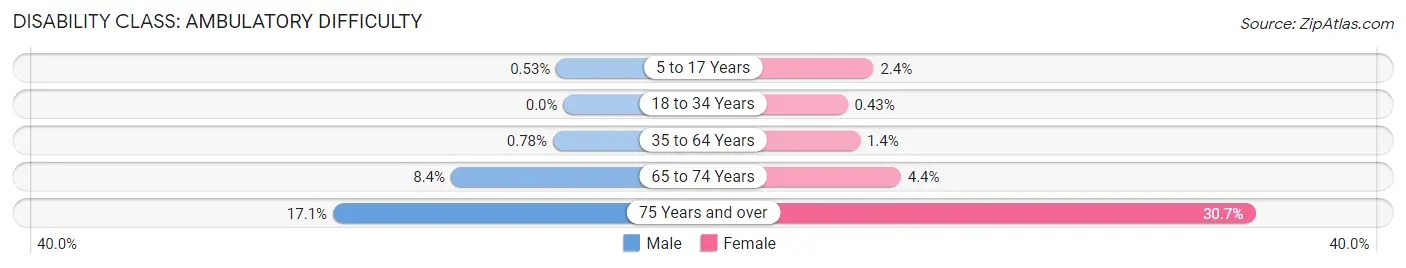
| Age Bracket | Male | Female |
| 5 to 17 Years | 12 (0.5%) | 61 (2.4%) |
| 18 to 34 Years | 0 (0.0%) | 7 (0.4%) |
| 35 to 64 Years | 39 (0.8%) | 78 (1.3%) |
| 65 to 74 Years | 108 (8.4%) | 57 (4.4%) |
| 75 Years and over | 172 (17.1%) | 460 (30.7%) |
Disability Class: Self-Care Difficulty
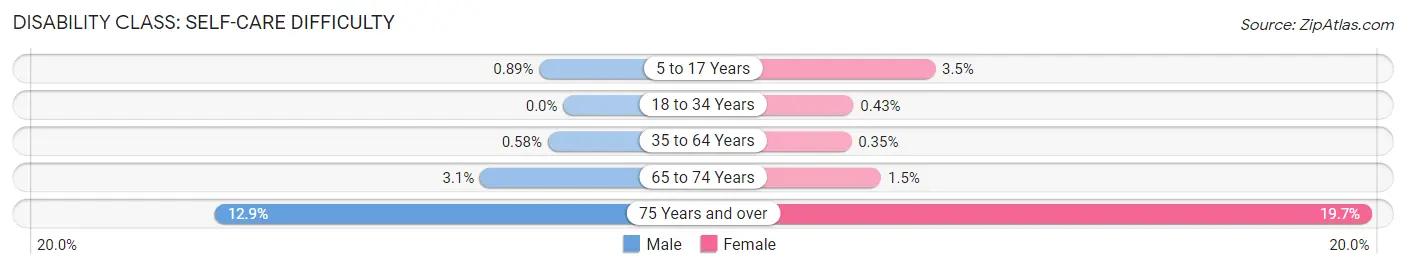
| Age Bracket | Male | Female |
| 5 to 17 Years | 20 (0.9%) | 90 (3.5%) |
| 18 to 34 Years | 0 (0.0%) | 7 (0.4%) |
| 35 to 64 Years | 29 (0.6%) | 20 (0.4%) |
| 65 to 74 Years | 40 (3.1%) | 19 (1.5%) |
| 75 Years and over | 130 (12.9%) | 295 (19.7%) |
Technology Access in Mercer Island
Computing Device Access in Mercer Island
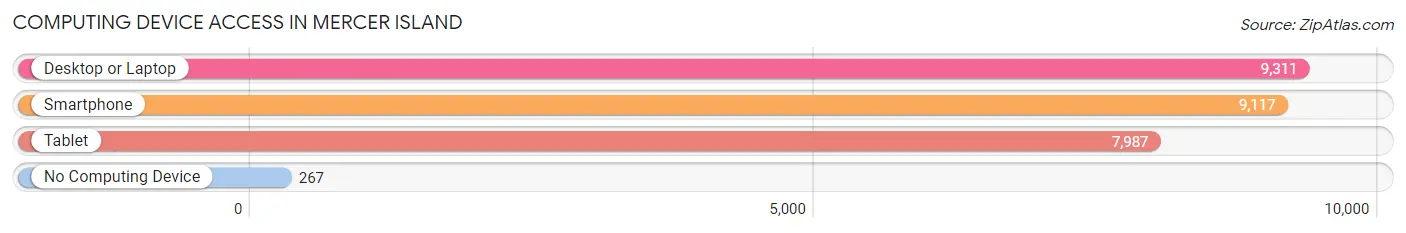
| Device Type | # Households | % Households |
| Desktop or Laptop | 9,311 | 95.2% |
| Smartphone | 9,117 | 93.2% |
| Tablet | 7,987 | 81.7% |
| No Computing Device | 267 | 2.7% |
| Total | 9,782 | 100.0% |
Internet Access in Mercer Island
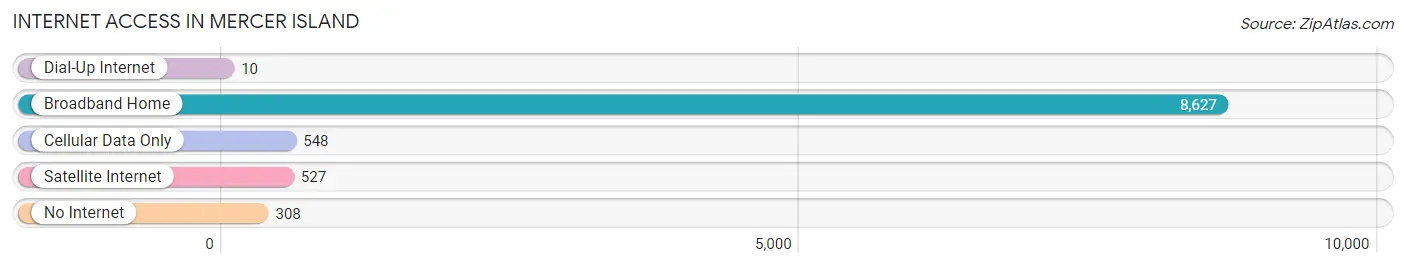
| Internet Type | # Households | % Households |
| Dial-Up Internet | 10 | 0.1% |
| Broadband Home | 8,627 | 88.2% |
| Cellular Data Only | 548 | 5.6% |
| Satellite Internet | 527 | 5.4% |
| No Internet | 308 | 3.2% |
| Total | 9,782 | 100.0% |
Mercer Island Summary
Mercer Island is a city located in King County, Washington, United States. It is situated in the middle of Lake Washington, between Seattle and Bellevue. The city is connected to the mainland by two bridges, the I-90 floating bridge and the East Channel Bridge. Mercer Island is the most populated island in a lake within the United States, with a population of 24,000 as of the 2010 census.
Geography
Mercer Island is located in the middle of Lake Washington, between Seattle and Bellevue. The island is approximately 4.5 miles long and 2.25 miles wide, with a total area of 8.2 square miles. The highest point on the island is the summit of First Hill, which is approximately 300 feet above sea level. The island is surrounded by the lake on all sides, and is connected to the mainland by two bridges, the I-90 floating bridge and the East Channel Bridge.
Climate
Mercer Island has a temperate climate, with mild temperatures year-round. The average high temperature in the summer is around 75°F, and the average low temperature in the winter is around 35°F. The island receives an average of 37 inches of precipitation per year, with most of it falling in the winter months.
History
The first inhabitants of Mercer Island were the Native American tribes of the Duwamish and Suquamish. The island was named after Thomas Mercer, a settler who arrived in the area in 1853. In the late 19th century, the island was used for logging and farming. In the early 20th century, the island was developed as a residential area, and the first bridge connecting the island to the mainland was built in 1940.
Economy
Mercer Island is primarily a residential community, with most of its residents commuting to Seattle or Bellevue for work. The island is home to several businesses, including restaurants, retail stores, and professional services. The island also has a thriving real estate market, with many luxury homes and waterfront properties.
Demographics
As of the 2010 census, the population of Mercer Island was 24,000. The racial makeup of the city was 79.2% White, 8.2% Asian, 6.2% African American, and 4.2% Hispanic or Latino. The median household income was $125,000, and the median home value was $1,000,000.
Conclusion
Mercer Island is a city located in King County, Washington, United States. It is situated in the middle of Lake Washington, between Seattle and Bellevue. The city is connected to the mainland by two bridges, the I-90 floating bridge and the East Channel Bridge. Mercer Island is the most populated island in a lake within the United States, with a population of 24,000 as of the 2010 census. The island has a temperate climate, with mild temperatures year-round. The island is primarily a residential community, with most of its residents commuting to Seattle or Bellevue for work. The racial makeup of the city was 79.2% White, 8.2% Asian, 6.2% African American, and 4.2% Hispanic or Latino. The median household income was $125,000, and the median home value was $1,000,000.
Common Questions
What is Per Capita Income in Mercer Island?
Per Capita income in Mercer Island is $113,575.
What is the Median Family Income in Mercer Island?
Median Family Income in Mercer Island is $250,001.
What is the Median Household income in Mercer Island?
Median Household Income in Mercer Island is $190,985.
What is Income or Wage Gap in Mercer Island?
Income or Wage Gap in Mercer Island is 49.3%.
Women in Mercer Island earn 50.7 cents for every dollar earned by a man.
What is Inequality or Gini Index in Mercer Island?
Inequality or Gini Index in Mercer Island is 0.52.
What is the Total Population of Mercer Island?
Total Population of Mercer Island is 25,464.
What is the Total Male Population of Mercer Island?
Total Male Population of Mercer Island is 12,008.
What is the Total Female Population of Mercer Island?
Total Female Population of Mercer Island is 13,456.
What is the Ratio of Males per 100 Females in Mercer Island?
There are 89.24 Males per 100 Females in Mercer Island.
What is the Ratio of Females per 100 Males in Mercer Island?
There are 112.06 Females per 100 Males in Mercer Island.
What is the Median Population Age in Mercer Island?
Median Population Age in Mercer Island is 45.3 Years.
What is the Average Family Size in Mercer Island
Average Family Size in Mercer Island is 3.1 People.
What is the Average Household Size in Mercer Island
Average Household Size in Mercer Island is 2.6 People.
How Large is the Labor Force in Mercer Island?
There are 12,197 People in the Labor Forcein in Mercer Island.
What is the Percentage of People in the Labor Force in Mercer Island?
59.4% of People are in the Labor Force in Mercer Island.
What is the Unemployment Rate in Mercer Island?
Unemployment Rate in Mercer Island is 2.6%.