Normandy Park, WA Map & Demographics
Normandy Park Map
Normandy Park Overview
$63,421
PER CAPITA INCOME
$145,096
AVG FAMILY INCOME
$122,467
AVG HOUSEHOLD INCOME
54.3%
WAGE / INCOME GAP [ % ]
45.7¢/ $1
WAGE / INCOME GAP [ $ ]
0.44
INEQUALITY / GINI INDEX
6,697
TOTAL POPULATION
3,512
MALE POPULATION
3,185
FEMALE POPULATION
110.27
MALES / 100 FEMALES
90.69
FEMALES / 100 MALES
45.8
MEDIAN AGE
3.0
AVG FAMILY SIZE
2.6
AVG HOUSEHOLD SIZE
3,291
LABOR FORCE [ PEOPLE ]
61.2%
PERCENT IN LABOR FORCE
3.8%
UNEMPLOYMENT RATE
Income in Normandy Park
Income Overview in Normandy Park
Per Capita Income in Normandy Park is $63,421, while median incomes of families and households are $145,096 and $122,467 respectively.
| Characteristic | Number | Measure |
| Per Capita Income | 6,697 | $63,421 |
| Median Family Income | 2,027 | $145,096 |
| Mean Family Income | 2,027 | $181,963 |
| Median Household Income | 2,568 | $122,467 |
| Mean Household Income | 2,568 | $162,927 |
| Income Deficit | 2,027 | $0 |
| Wage / Income Gap (%) | 6,697 | 54.34% |
| Wage / Income Gap ($) | 6,697 | 45.66¢ per $1 |
| Gini / Inequality Index | 6,697 | 0.44 |
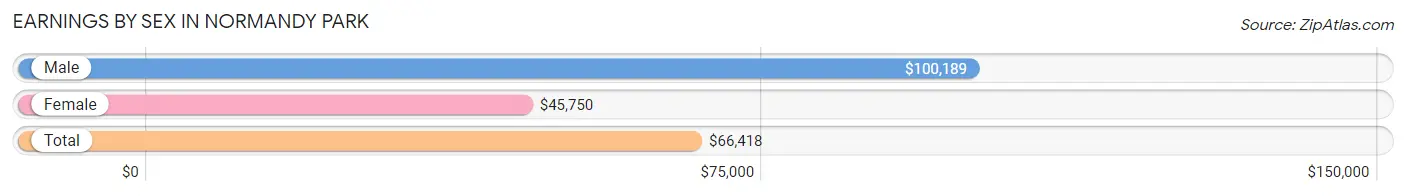
Earnings by Sex in Normandy Park
Average Earnings in Normandy Park are $66,418, $100,189 for men and $45,750 for women, a difference of 54.3%.
| Sex | Number | Average Earnings |
| Male | 2,010 (55.5%) | $100,189 |
| Female | 1,611 (44.5%) | $45,750 |
| Total | 3,621 (100.0%) | $66,418 |
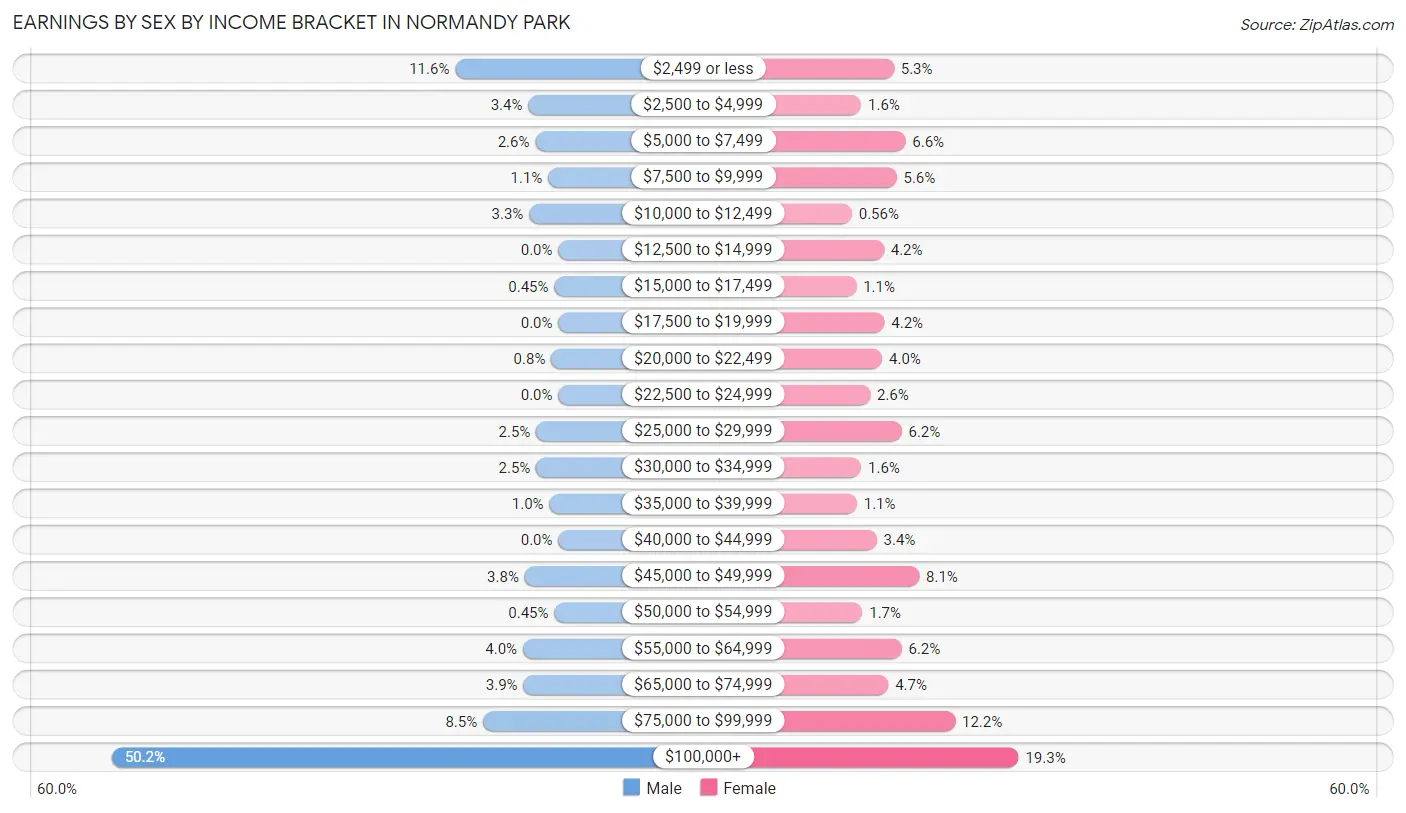
Earnings by Sex by Income Bracket in Normandy Park
The most common earnings brackets in Normandy Park are $100,000+ for men (1,009 | 50.2%) and $100,000+ for women (311 | 19.3%).
| Income | Male | Female |
| $2,499 or less | 233 (11.6%) | 85 (5.3%) |
| $2,500 to $4,999 | 68 (3.4%) | 26 (1.6%) |
| $5,000 to $7,499 | 52 (2.6%) | 106 (6.6%) |
| $7,500 to $9,999 | 23 (1.1%) | 90 (5.6%) |
| $10,000 to $12,499 | 66 (3.3%) | 9 (0.6%) |
| $12,500 to $14,999 | 0 (0.0%) | 67 (4.2%) |
| $15,000 to $17,499 | 9 (0.4%) | 17 (1.1%) |
| $17,500 to $19,999 | 0 (0.0%) | 68 (4.2%) |
| $20,000 to $22,499 | 16 (0.8%) | 64 (4.0%) |
| $22,500 to $24,999 | 0 (0.0%) | 42 (2.6%) |
| $25,000 to $29,999 | 50 (2.5%) | 99 (6.1%) |
| $30,000 to $34,999 | 50 (2.5%) | 26 (1.6%) |
| $35,000 to $39,999 | 20 (1.0%) | 18 (1.1%) |
| $40,000 to $44,999 | 0 (0.0%) | 54 (3.4%) |
| $45,000 to $49,999 | 76 (3.8%) | 131 (8.1%) |
| $50,000 to $54,999 | 9 (0.4%) | 28 (1.7%) |
| $55,000 to $64,999 | 80 (4.0%) | 99 (6.1%) |
| $65,000 to $74,999 | 79 (3.9%) | 75 (4.7%) |
| $75,000 to $99,999 | 170 (8.5%) | 196 (12.2%) |
| $100,000+ | 1,009 (50.2%) | 311 (19.3%) |
| Total | 2,010 (100.0%) | 1,611 (100.0%) |
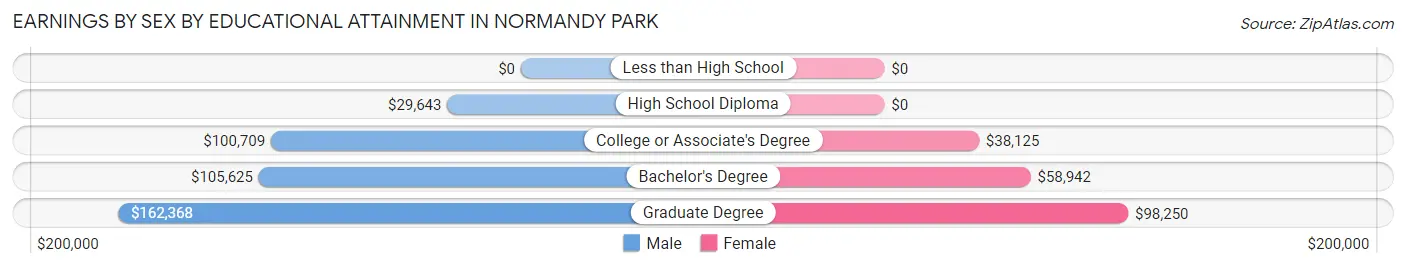
Earnings by Sex by Educational Attainment in Normandy Park
Average earnings in Normandy Park are $103,651 for men and $47,435 for women, a difference of 54.2%. Men with an educational attainment of graduate degree enjoy the highest average annual earnings of $162,368, while those with high school diploma education earn the least with $29,643. Women with an educational attainment of graduate degree earn the most with the average annual earnings of $98,250, while those with college or associate's degree education have the smallest earnings of $38,125.
| Educational Attainment | Male Income | Female Income |
| Less than High School | - | - |
| High School Diploma | $29,643 | $0 |
| College or Associate's Degree | $100,709 | $38,125 |
| Bachelor's Degree | $105,625 | $58,942 |
| Graduate Degree | $162,368 | $98,250 |
| Total | $103,651 | $47,435 |
Family Income in Normandy Park
Family Income Brackets in Normandy Park
According to the Normandy Park family income data, there are 596 families falling into the $200,000+ income range, which is the most common income bracket and makes up 29.4% of all families.
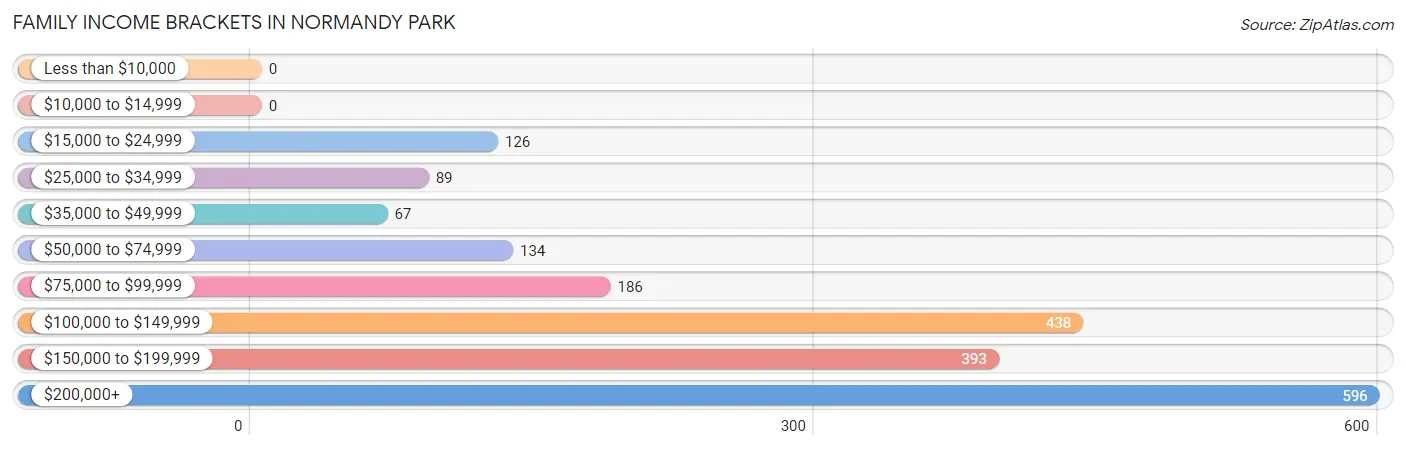
| Income Bracket | # Families | % Families |
| Less than $10,000 | 0 | 0.0% |
| $10,000 to $14,999 | 0 | 0.0% |
| $15,000 to $24,999 | 126 | 6.2% |
| $25,000 to $34,999 | 89 | 4.4% |
| $35,000 to $49,999 | 67 | 3.3% |
| $50,000 to $74,999 | 134 | 6.6% |
| $75,000 to $99,999 | 186 | 9.2% |
| $100,000 to $149,999 | 438 | 21.6% |
| $150,000 to $199,999 | 393 | 19.4% |
| $200,000+ | 596 | 29.4% |
Family Income by Famaliy Size in Normandy Park
6-person families (58 | 2.9%) account for the highest median family income in Normandy Park with $250,001 per family, while 2-person families (873 | 43.1%) have the highest median income of $60,915 per family member.
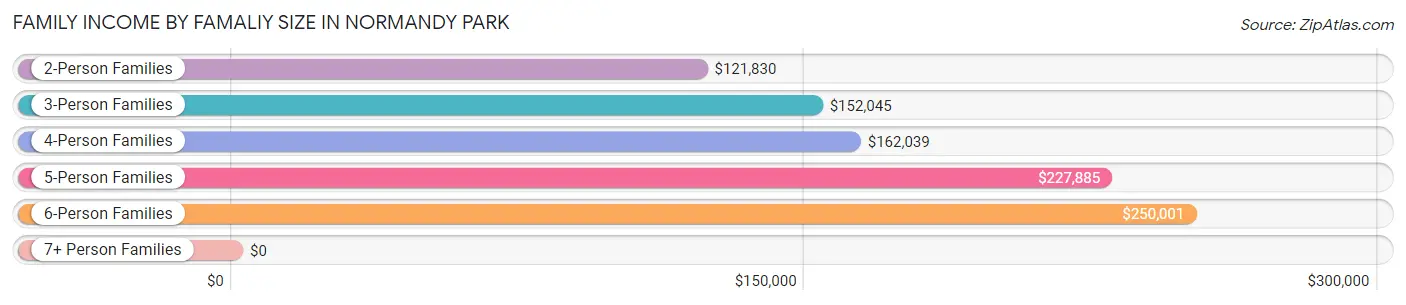
| Income Bracket | # Families | Median Income |
| 2-Person Families | 873 (43.1%) | $121,830 |
| 3-Person Families | 566 (27.9%) | $152,045 |
| 4-Person Families | 468 (23.1%) | $162,039 |
| 5-Person Families | 62 (3.1%) | $227,885 |
| 6-Person Families | 58 (2.9%) | $250,001 |
| 7+ Person Families | 0 (0.0%) | $0 |
| Total | 2,027 (100.0%) | $145,096 |
Family Income by Number of Earners in Normandy Park
The median family income in Normandy Park is $145,096, with families comprising 3+ earners (310) having the highest median family income of $228,077, while families with no earners (282) have the lowest median family income of $86,250, accounting for 15.3% and 13.9% of families, respectively.
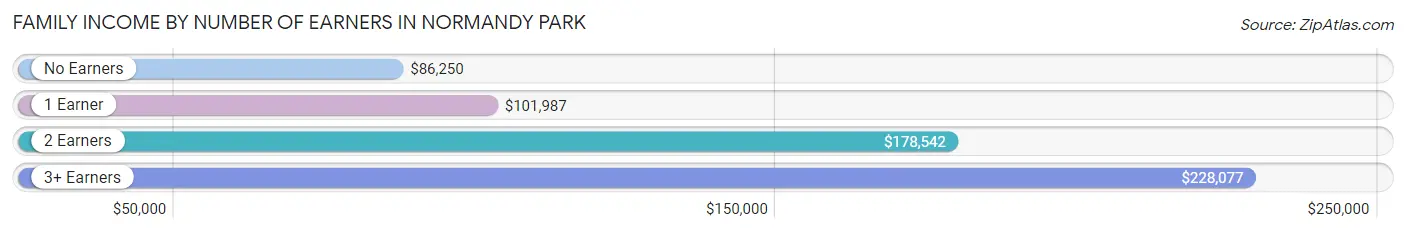
| Number of Earners | # Families | Median Income |
| No Earners | 282 (13.9%) | $86,250 |
| 1 Earner | 582 (28.7%) | $101,987 |
| 2 Earners | 853 (42.1%) | $178,542 |
| 3+ Earners | 310 (15.3%) | $228,077 |
| Total | 2,027 (100.0%) | $145,096 |
Household Income in Normandy Park
Household Income Brackets in Normandy Park
With 642 households falling in the category, the $200,000+ income range is the most frequent in Normandy Park, accounting for 25.0% of all households.
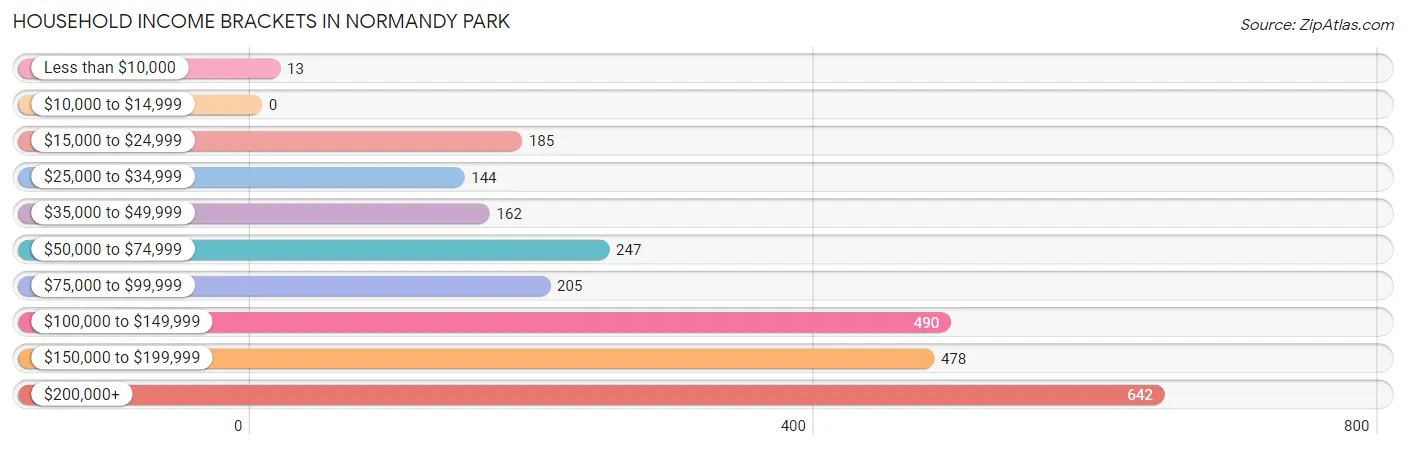
| Income Bracket | # Households | % Households |
| Less than $10,000 | 13 | 0.5% |
| $10,000 to $14,999 | 0 | 0.0% |
| $15,000 to $24,999 | 185 | 7.2% |
| $25,000 to $34,999 | 144 | 5.6% |
| $35,000 to $49,999 | 162 | 6.3% |
| $50,000 to $74,999 | 247 | 9.6% |
| $75,000 to $99,999 | 205 | 8.0% |
| $100,000 to $149,999 | 490 | 19.1% |
| $150,000 to $199,999 | 478 | 18.6% |
| $200,000+ | 642 | 25.0% |
Household Income by Householder Age in Normandy Park
The median household income in Normandy Park is $122,467, with the highest median household income of $191,397 found in the 45 to 64 years age bracket for the primary householder. A total of 937 households (36.5%) fall into this category.
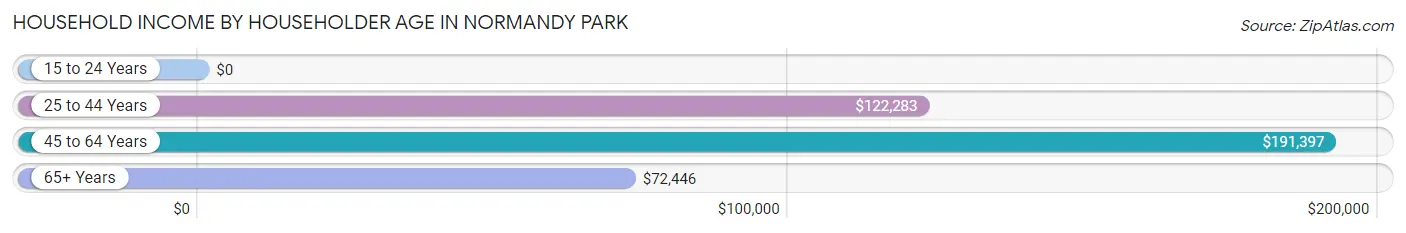
| Income Bracket | # Households | Median Income |
| 15 to 24 Years | 0 (0.0%) | $0 |
| 25 to 44 Years | 665 (25.9%) | $122,283 |
| 45 to 64 Years | 937 (36.5%) | $191,397 |
| 65+ Years | 966 (37.6%) | $72,446 |
| Total | 2,568 (100.0%) | $122,467 |
Poverty in Normandy Park
Income Below Poverty by Sex and Age in Normandy Park
With 5.1% poverty level for males and 8.6% for females among the residents of Normandy Park, 5 year old males and 6 to 11 year old females are the most vulnerable to poverty, with 9 males (50.0%) and 79 females (32.0%) in their respective age groups living below the poverty level.
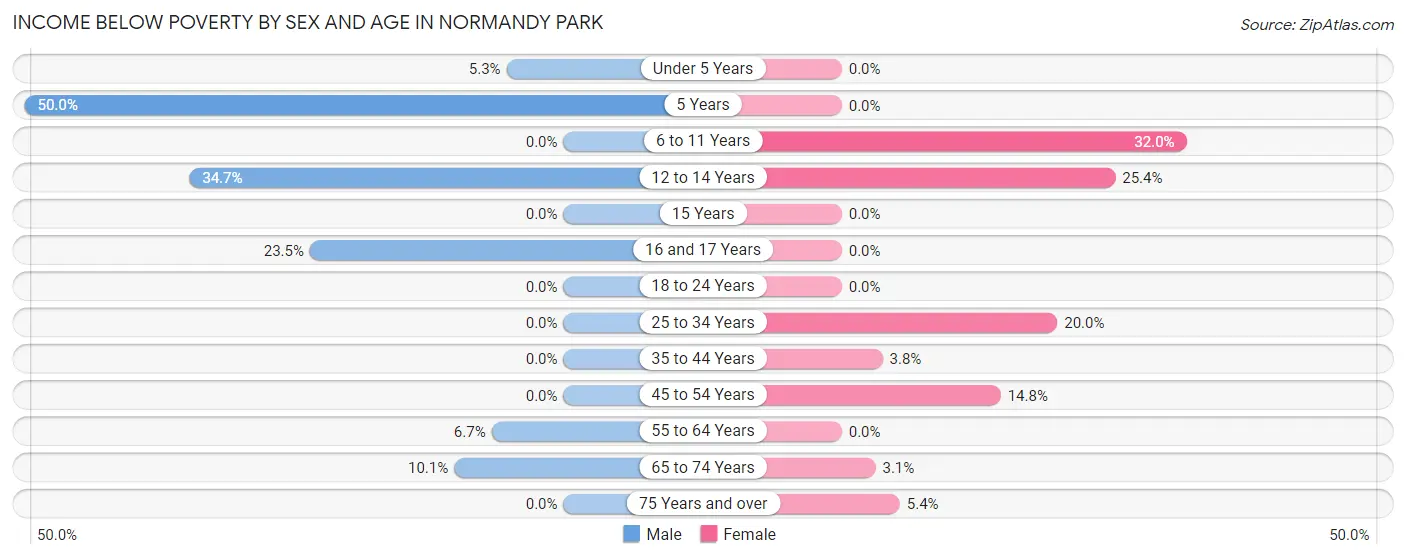
| Age Bracket | Male | Female |
| Under 5 Years | 17 (5.3%) | 0 (0.0%) |
| 5 Years | 9 (50.0%) | 0 (0.0%) |
| 6 to 11 Years | 0 (0.0%) | 79 (32.0%) |
| 12 to 14 Years | 42 (34.7%) | 33 (25.4%) |
| 15 Years | 0 (0.0%) | 0 (0.0%) |
| 16 and 17 Years | 16 (23.5%) | 0 (0.0%) |
| 18 to 24 Years | 0 (0.0%) | 0 (0.0%) |
| 25 to 34 Years | 0 (0.0%) | 57 (20.0%) |
| 35 to 44 Years | 0 (0.0%) | 18 (3.8%) |
| 45 to 54 Years | 0 (0.0%) | 59 (14.7%) |
| 55 to 64 Years | 39 (6.7%) | 0 (0.0%) |
| 65 to 74 Years | 56 (10.1%) | 13 (3.1%) |
| 75 Years and over | 0 (0.0%) | 16 (5.4%) |
| Total | 179 (5.1%) | 275 (8.6%) |
Income Above Poverty by Sex and Age in Normandy Park
According to the poverty statistics in Normandy Park, males aged 6 to 11 years and females aged under 5 years are the age groups that are most secure financially, with 100.0% of males and 100.0% of females in these age groups living above the poverty line.
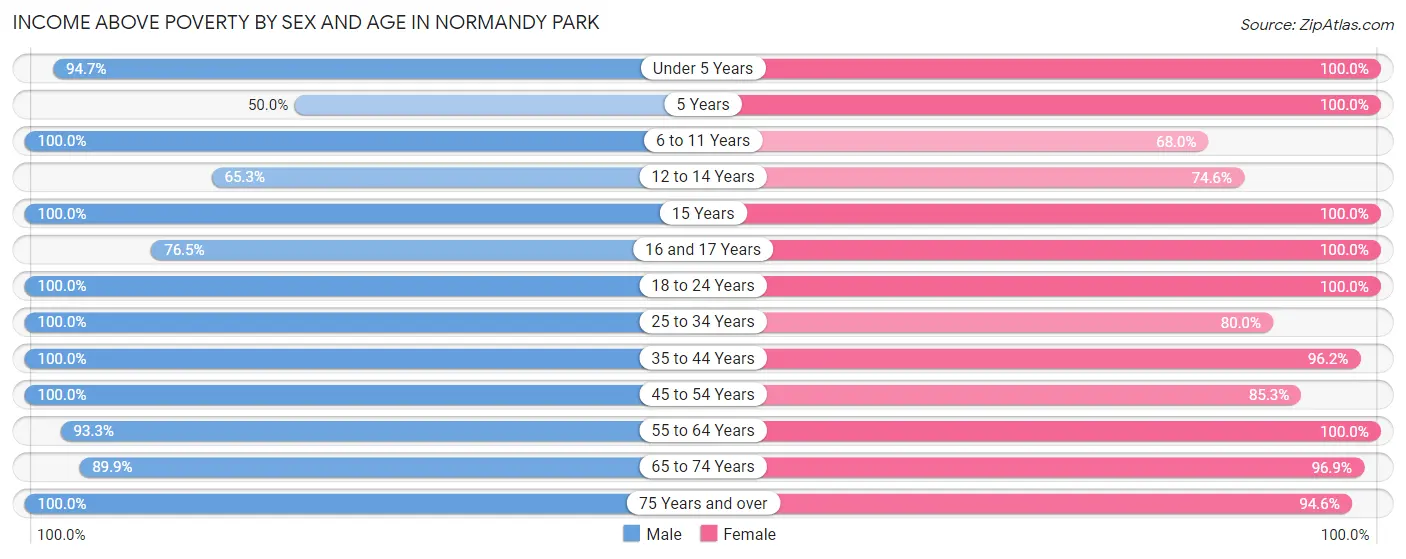
| Age Bracket | Male | Female |
| Under 5 Years | 305 (94.7%) | 175 (100.0%) |
| 5 Years | 9 (50.0%) | 9 (100.0%) |
| 6 to 11 Years | 254 (100.0%) | 168 (68.0%) |
| 12 to 14 Years | 79 (65.3%) | 97 (74.6%) |
| 15 Years | 12 (100.0%) | 31 (100.0%) |
| 16 and 17 Years | 52 (76.5%) | 88 (100.0%) |
| 18 to 24 Years | 216 (100.0%) | 94 (100.0%) |
| 25 to 34 Years | 266 (100.0%) | 228 (80.0%) |
| 35 to 44 Years | 453 (100.0%) | 457 (96.2%) |
| 45 to 54 Years | 342 (100.0%) | 341 (85.3%) |
| 55 to 64 Years | 546 (93.3%) | 533 (100.0%) |
| 65 to 74 Years | 496 (89.9%) | 402 (96.9%) |
| 75 Years and over | 294 (100.0%) | 281 (94.6%) |
| Total | 3,324 (94.9%) | 2,904 (91.3%) |
Income Below Poverty Among Married-Couple Families in Normandy Park
The poverty statistics for married-couple families in Normandy Park show that 1.0% or 17 of the total 1,673 families live below the poverty line. Families with 1 or 2 children have the highest poverty rate of 3.2%, comprising of 17 families. On the other hand, families with no children have the lowest poverty rate of 0.0%, which includes 0 families.
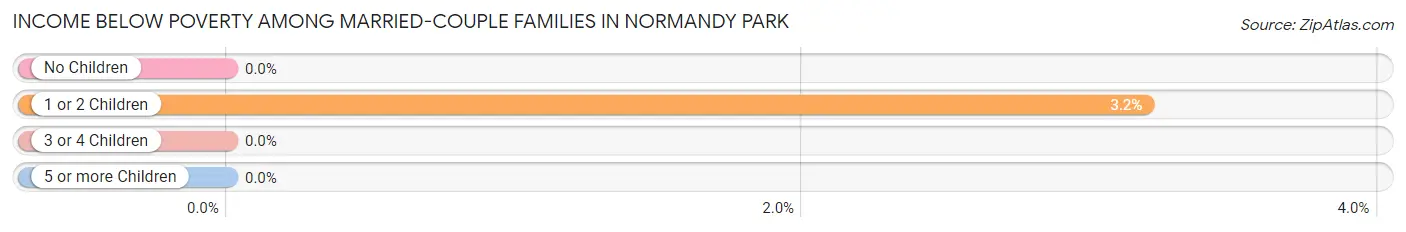
| Children | Above Poverty | Below Poverty |
| No Children | 1,046 (100.0%) | 0 (0.0%) |
| 1 or 2 Children | 516 (96.8%) | 17 (3.2%) |
| 3 or 4 Children | 94 (100.0%) | 0 (0.0%) |
| 5 or more Children | 0 (0.0%) | 0 (0.0%) |
| Total | 1,656 (99.0%) | 17 (1.0%) |
Income Below Poverty Among Single-Parent Households in Normandy Park
According to the poverty data in Normandy Park, 28.1% or 41 single-father households and 26.0% or 54 single-mother households are living below the poverty line. Among single-father households, those with 1 or 2 children have the highest poverty rate, with 41 households (85.4%) experiencing poverty. Likewise, among single-mother households, those with 3 or 4 children have the highest poverty rate, with 12 households (100.0%) falling below the poverty line.
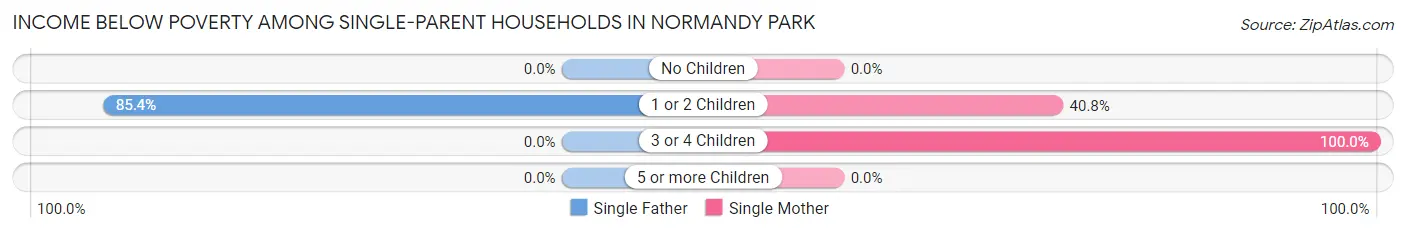
| Children | Single Father | Single Mother |
| No Children | 0 (0.0%) | 0 (0.0%) |
| 1 or 2 Children | 41 (85.4%) | 42 (40.8%) |
| 3 or 4 Children | 0 (0.0%) | 12 (100.0%) |
| 5 or more Children | 0 (0.0%) | 0 (0.0%) |
| Total | 41 (28.1%) | 54 (26.0%) |
Income Below Poverty Among Married-Couple vs Single-Parent Households in Normandy Park
The poverty data for Normandy Park shows that 17 of the married-couple family households (1.0%) and 95 of the single-parent households (26.8%) are living below the poverty level. Within the married-couple family households, those with 1 or 2 children have the highest poverty rate, with 17 households (3.2%) falling below the poverty line. Among the single-parent households, those with 3 or 4 children have the highest poverty rate, with 12 household (100.0%) living below poverty.
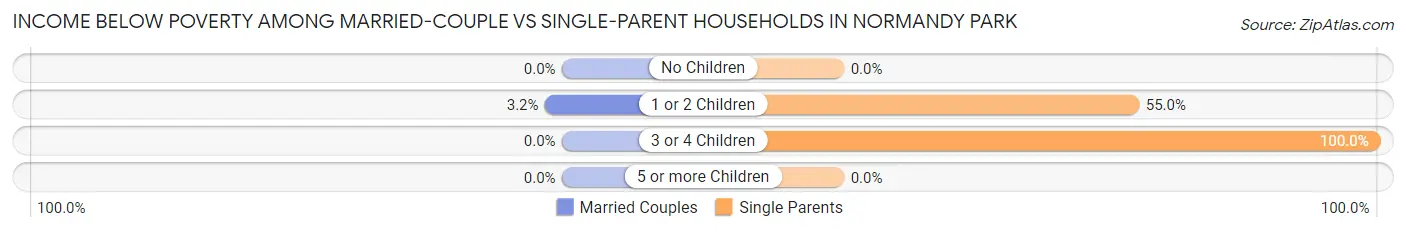
| Children | Married-Couple Families | Single-Parent Households |
| No Children | 0 (0.0%) | 0 (0.0%) |
| 1 or 2 Children | 17 (3.2%) | 83 (55.0%) |
| 3 or 4 Children | 0 (0.0%) | 12 (100.0%) |
| 5 or more Children | 0 (0.0%) | 0 (0.0%) |
| Total | 17 (1.0%) | 95 (26.8%) |
Race in Normandy Park
The most populous races in Normandy Park are White / Caucasian (5,429 | 81.1%), Two or more Races (631 | 9.4%), and Asian (374 | 5.6%).
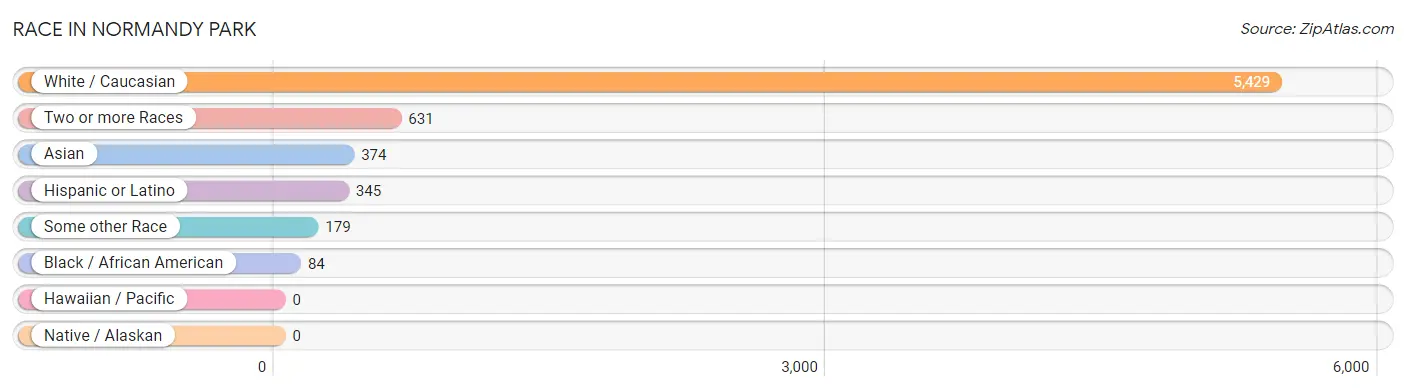
| Race | # Population | % Population |
| Asian | 374 | 5.6% |
| Black / African American | 84 | 1.3% |
| Hawaiian / Pacific | 0 | 0.0% |
| Hispanic or Latino | 345 | 5.1% |
| Native / Alaskan | 0 | 0.0% |
| White / Caucasian | 5,429 | 81.1% |
| Two or more Races | 631 | 9.4% |
| Some other Race | 179 | 2.7% |
| Total | 6,697 | 100.0% |
Ancestry in Normandy Park
The most populous ancestries reported in Normandy Park are English (1,268 | 18.9%), German (1,034 | 15.4%), Irish (959 | 14.3%), Norwegian (497 | 7.4%), and Swedish (489 | 7.3%), together accounting for 63.4% of all Normandy Park residents.
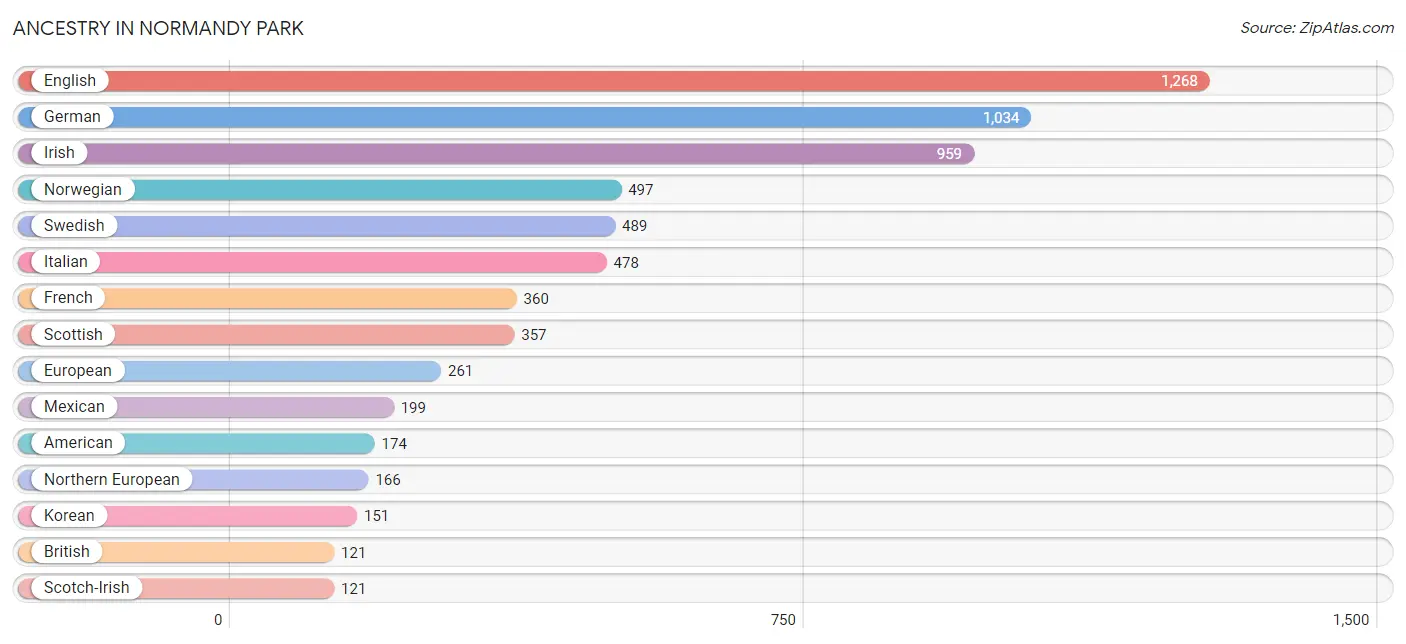
| Ancestry | # Population | % Population |
| Alaska Native | 28 | 0.4% |
| American | 174 | 2.6% |
| Arab | 35 | 0.5% |
| Australian | 23 | 0.3% |
| Basque | 75 | 1.1% |
| Bhutanese | 99 | 1.5% |
| Brazilian | 17 | 0.3% |
| British | 121 | 1.8% |
| Central American | 34 | 0.5% |
| Cherokee | 3 | 0.0% |
| Chippewa | 12 | 0.2% |
| Colombian | 11 | 0.2% |
| Costa Rican | 34 | 0.5% |
| Croatian | 60 | 0.9% |
| Czech | 12 | 0.2% |
| Czechoslovakian | 46 | 0.7% |
| Danish | 104 | 1.5% |
| Dominican | 29 | 0.4% |
| Dutch | 75 | 1.1% |
| English | 1,268 | 18.9% |
| Ethiopian | 71 | 1.1% |
| European | 261 | 3.9% |
| Finnish | 38 | 0.6% |
| French | 360 | 5.4% |
| French Canadian | 5 | 0.1% |
| German | 1,034 | 15.4% |
| Hungarian | 35 | 0.5% |
| Indian (Asian) | 108 | 1.6% |
| Irish | 959 | 14.3% |
| Israeli | 16 | 0.2% |
| Italian | 478 | 7.1% |
| Korean | 151 | 2.2% |
| Lebanese | 19 | 0.3% |
| Malaysian | 20 | 0.3% |
| Mexican | 199 | 3.0% |
| Mexican American Indian | 8 | 0.1% |
| Native Hawaiian | 28 | 0.4% |
| New Zealander | 28 | 0.4% |
| Northern European | 166 | 2.5% |
| Norwegian | 497 | 7.4% |
| Polish | 98 | 1.5% |
| Puerto Rican | 65 | 1.0% |
| Romanian | 24 | 0.4% |
| Russian | 5 | 0.1% |
| Scandinavian | 97 | 1.5% |
| Scotch-Irish | 121 | 1.8% |
| Scottish | 357 | 5.3% |
| Serbian | 49 | 0.7% |
| Slovak | 50 | 0.7% |
| South African | 6 | 0.1% |
| South American | 11 | 0.2% |
| Spanish | 7 | 0.1% |
| Sri Lankan | 110 | 1.6% |
| Subsaharan African | 77 | 1.1% |
| Swedish | 489 | 7.3% |
| Swiss | 34 | 0.5% |
| Ukrainian | 55 | 0.8% |
| Welsh | 16 | 0.2% | View All 58 Rows |
Immigrants in Normandy Park
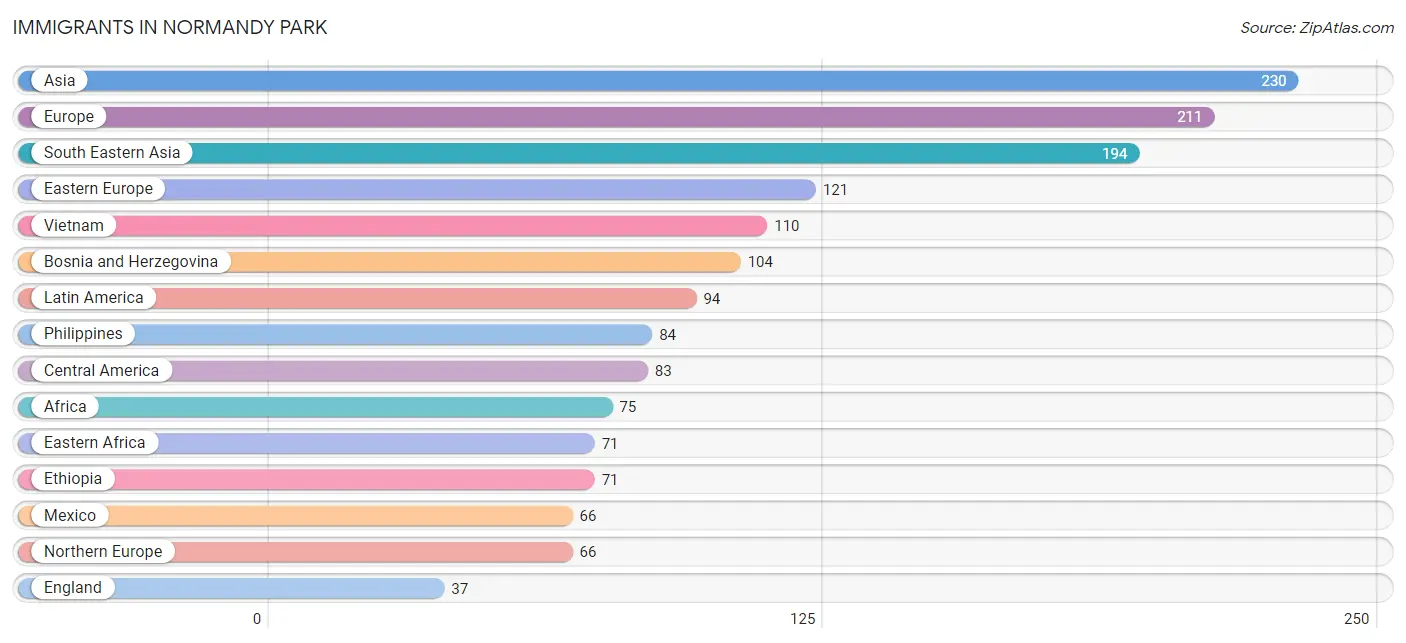
The most numerous immigrant groups reported in Normandy Park came from Asia (230 | 3.4%), Europe (211 | 3.2%), South Eastern Asia (194 | 2.9%), Eastern Europe (121 | 1.8%), and Vietnam (110 | 1.6%), together accounting for 12.9% of all Normandy Park residents.
| Immigration Origin | # Population | % Population |
| Africa | 75 | 1.1% |
| Asia | 230 | 3.4% |
| Australia | 12 | 0.2% |
| Bosnia and Herzegovina | 104 | 1.5% |
| Canada | 27 | 0.4% |
| Central America | 83 | 1.2% |
| China | 36 | 0.5% |
| Colombia | 11 | 0.2% |
| Costa Rica | 17 | 0.3% |
| Czechoslovakia | 17 | 0.3% |
| Eastern Africa | 71 | 1.1% |
| Eastern Asia | 36 | 0.5% |
| Eastern Europe | 121 | 1.8% |
| England | 37 | 0.5% |
| Ethiopia | 71 | 1.1% |
| Europe | 211 | 3.2% |
| France | 8 | 0.1% |
| Germany | 4 | 0.1% |
| Hong Kong | 36 | 0.5% |
| Latin America | 94 | 1.4% |
| Mexico | 66 | 1.0% |
| Netherlands | 12 | 0.2% |
| Northern Europe | 66 | 1.0% |
| Oceania | 21 | 0.3% |
| Philippines | 84 | 1.3% |
| Scotland | 13 | 0.2% |
| South Africa | 4 | 0.1% |
| South America | 11 | 0.2% |
| South Eastern Asia | 194 | 2.9% |
| Sweden | 16 | 0.2% |
| Vietnam | 110 | 1.6% |
| Western Europe | 24 | 0.4% | View All 32 Rows |
Sex and Age in Normandy Park
Sex and Age in Normandy Park
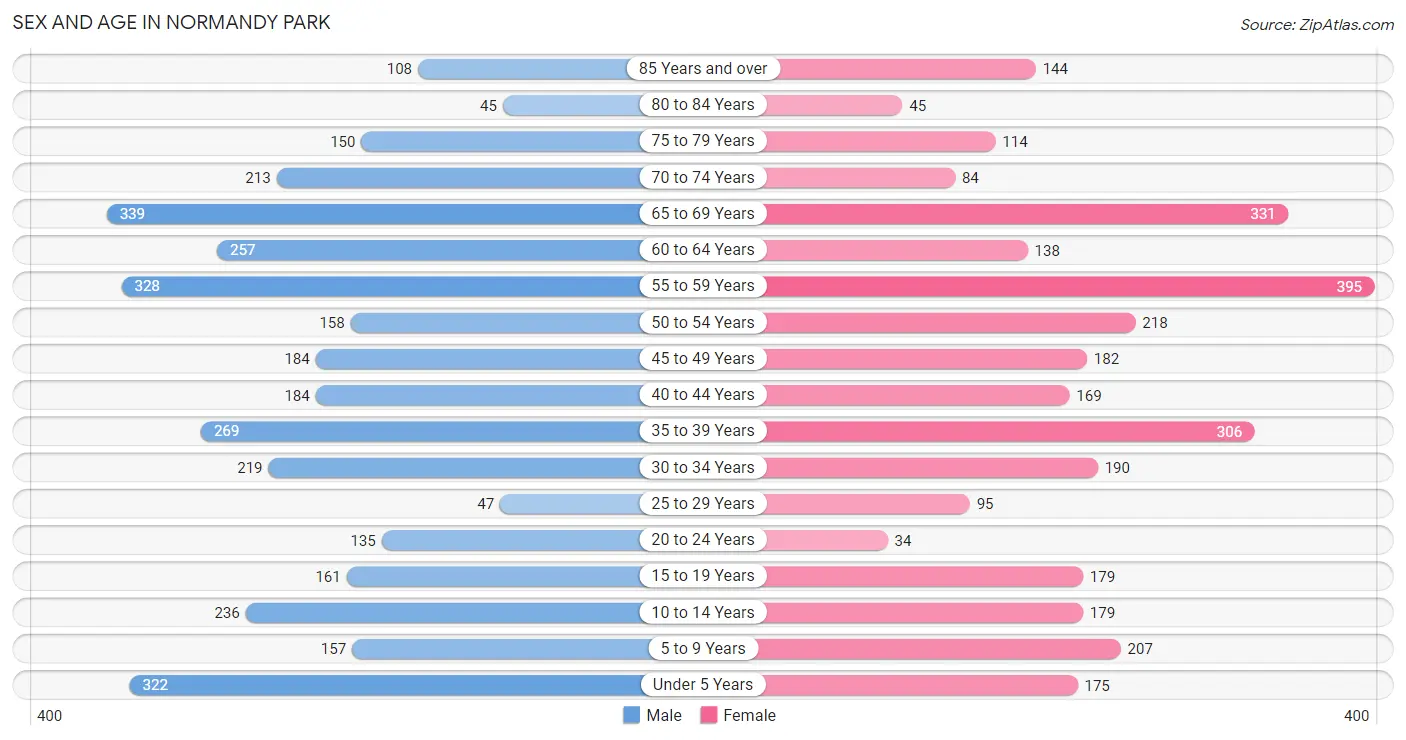
The most populous age groups in Normandy Park are 65 to 69 Years (339 | 9.7%) for men and 55 to 59 Years (395 | 12.4%) for women.
| Age Bracket | Male | Female |
| Under 5 Years | 322 (9.2%) | 175 (5.5%) |
| 5 to 9 Years | 157 (4.5%) | 207 (6.5%) |
| 10 to 14 Years | 236 (6.7%) | 179 (5.6%) |
| 15 to 19 Years | 161 (4.6%) | 179 (5.6%) |
| 20 to 24 Years | 135 (3.8%) | 34 (1.1%) |
| 25 to 29 Years | 47 (1.3%) | 95 (3.0%) |
| 30 to 34 Years | 219 (6.2%) | 190 (6.0%) |
| 35 to 39 Years | 269 (7.7%) | 306 (9.6%) |
| 40 to 44 Years | 184 (5.2%) | 169 (5.3%) |
| 45 to 49 Years | 184 (5.2%) | 182 (5.7%) |
| 50 to 54 Years | 158 (4.5%) | 218 (6.8%) |
| 55 to 59 Years | 328 (9.3%) | 395 (12.4%) |
| 60 to 64 Years | 257 (7.3%) | 138 (4.3%) |
| 65 to 69 Years | 339 (9.7%) | 331 (10.4%) |
| 70 to 74 Years | 213 (6.1%) | 84 (2.6%) |
| 75 to 79 Years | 150 (4.3%) | 114 (3.6%) |
| 80 to 84 Years | 45 (1.3%) | 45 (1.4%) |
| 85 Years and over | 108 (3.1%) | 144 (4.5%) |
| Total | 3,512 (100.0%) | 3,185 (100.0%) |
Families and Households in Normandy Park
Median Family Size in Normandy Park
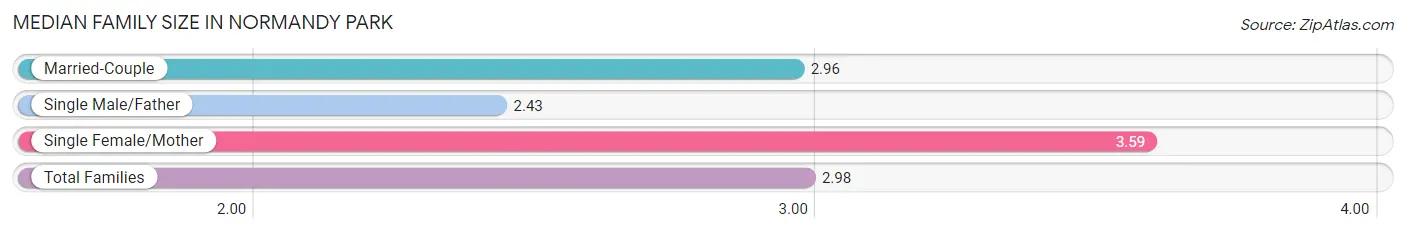
The median family size in Normandy Park is 2.98 persons per family, with single female/mother families (208 | 10.3%) accounting for the largest median family size of 3.59 persons per family. On the other hand, single male/father families (146 | 7.2%) represent the smallest median family size with 2.43 persons per family.
| Family Type | # Families | Family Size |
| Married-Couple | 1,673 (82.5%) | 2.96 |
| Single Male/Father | 146 (7.2%) | 2.43 |
| Single Female/Mother | 208 (10.3%) | 3.59 |
| Total Families | 2,027 (100.0%) | 2.98 |
Median Household Size in Normandy Park
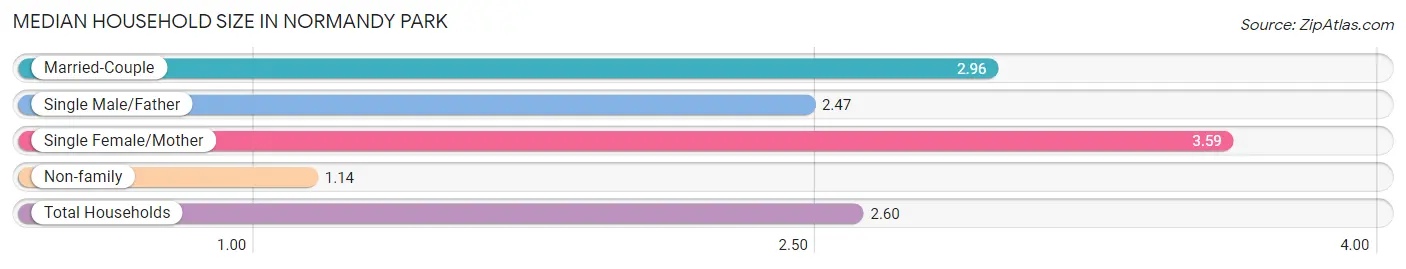
The median household size in Normandy Park is 2.60 persons per household, with single female/mother households (208 | 8.1%) accounting for the largest median household size of 3.59 persons per household. non-family households (541 | 21.1%) represent the smallest median household size with 1.14 persons per household.
| Household Type | # Households | Household Size |
| Married-Couple | 1,673 (65.1%) | 2.96 |
| Single Male/Father | 146 (5.7%) | 2.47 |
| Single Female/Mother | 208 (8.1%) | 3.59 |
| Non-family | 541 (21.1%) | 1.14 |
| Total Households | 2,568 (100.0%) | 2.60 |
Household Size by Marriage Status in Normandy Park
Out of a total of 2,568 households in Normandy Park, 2,027 (78.9%) are family households, while 541 (21.1%) are nonfamily households. The most numerous type of family households are 2-person households, comprising 866, and the most common type of nonfamily households are 1-person households, comprising 467.
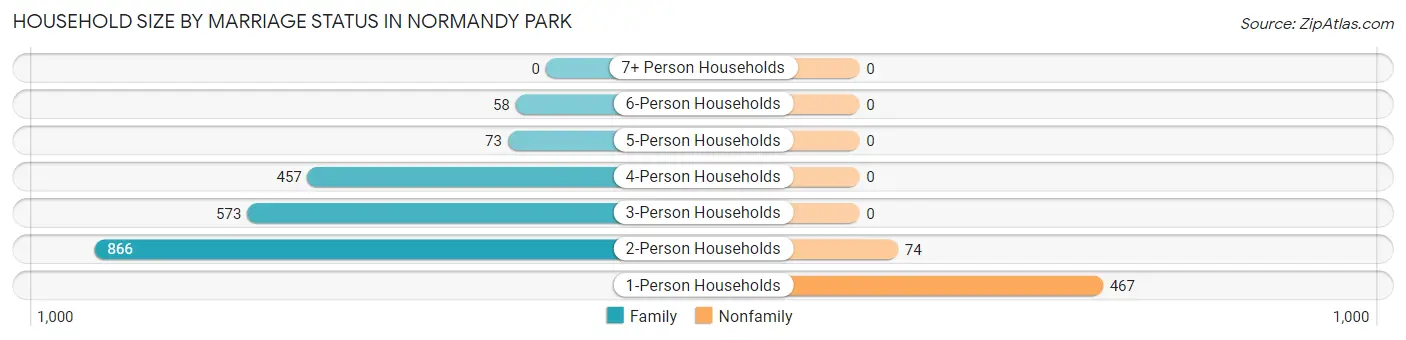
| Household Size | Family Households | Nonfamily Households |
| 1-Person Households | - | 467 (18.2%) |
| 2-Person Households | 866 (33.7%) | 74 (2.9%) |
| 3-Person Households | 573 (22.3%) | 0 (0.0%) |
| 4-Person Households | 457 (17.8%) | 0 (0.0%) |
| 5-Person Households | 73 (2.8%) | 0 (0.0%) |
| 6-Person Households | 58 (2.3%) | 0 (0.0%) |
| 7+ Person Households | 0 (0.0%) | 0 (0.0%) |
| Total | 2,027 (78.9%) | 541 (21.1%) |
Female Fertility in Normandy Park
Fertility by Age in Normandy Park
Average fertility rate in Normandy Park is 111.0 births per 1,000 women. Women in the age bracket of 20 to 34 years have the highest fertility rate with 310.0 births per 1,000 women. Women in the age bracket of 20 to 34 years acount for 74.4% of all women with births.
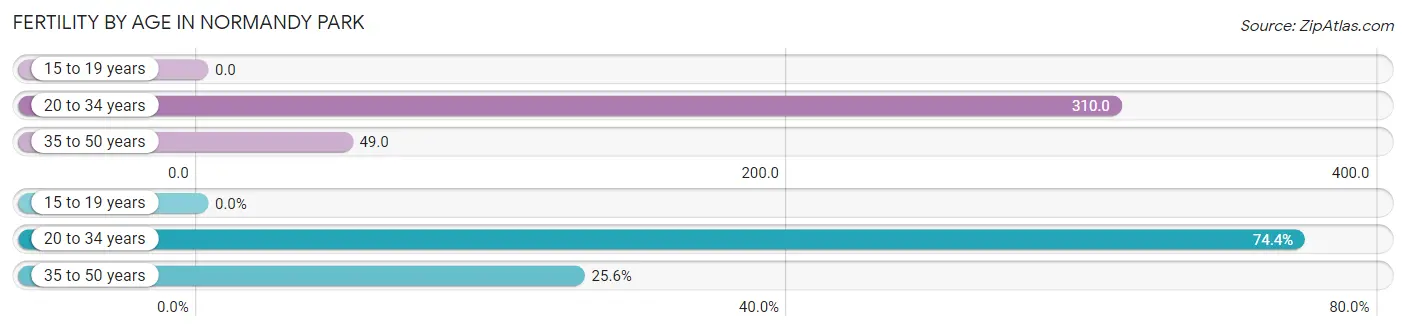
| Age Bracket | Women with Births | Births / 1,000 Women |
| 15 to 19 years | 0 (0.0%) | 0.0 |
| 20 to 34 years | 99 (74.4%) | 310.0 |
| 35 to 50 years | 34 (25.6%) | 49.0 |
| Total | 133 (100.0%) | 111.0 |
Fertility by Age by Marriage Status in Normandy Park
91.0% of women with births (133) in Normandy Park are married. The highest percentage of unmarried women with births falls into 35 to 50 years age bracket with 35.3% of them unmarried at the time of birth, while the lowest percentage of unmarried women with births belong to 20 to 34 years age bracket with 0.0% of them unmarried.
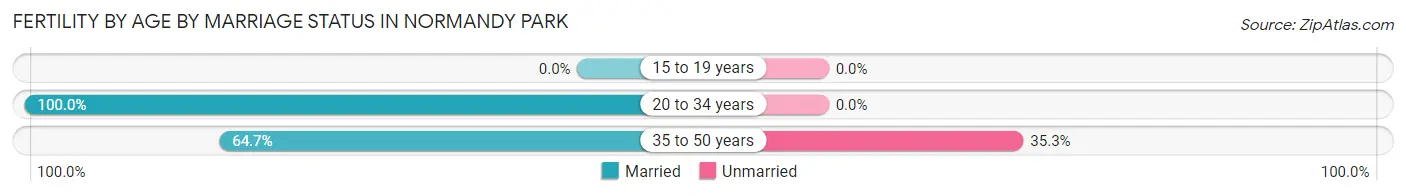
| Age Bracket | Married | Unmarried |
| 15 to 19 years | 0 (0.0%) | 0 (0.0%) |
| 20 to 34 years | 99 (100.0%) | 0 (0.0%) |
| 35 to 50 years | 22 (64.7%) | 12 (35.3%) |
| Total | 121 (91.0%) | 12 (9.0%) |
Fertility by Education in Normandy Park
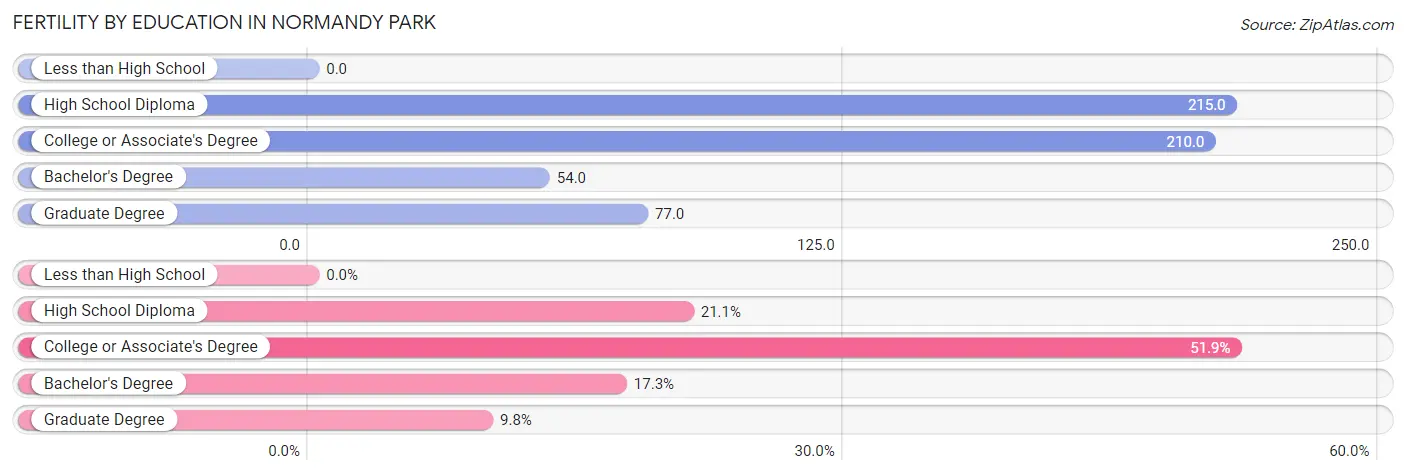
| Educational Attainment | Women with Births | Births / 1,000 Women |
| Less than High School | 0 (0.0%) | 0.0 |
| High School Diploma | 28 (21.0%) | 215.0 |
| College or Associate's Degree | 69 (51.9%) | 210.0 |
| Bachelor's Degree | 23 (17.3%) | 54.0 |
| Graduate Degree | 13 (9.8%) | 77.0 |
| Total | 133 (100.0%) | 111.0 |
Fertility by Education by Marriage Status in Normandy Park
9.0% of women with births in Normandy Park are unmarried. Women with the educational attainment of college or associate's degree are most likely to be married with 100.0% of them married at childbirth, while women with the educational attainment of high school diploma are least likely to be married with 42.9% of them unmarried at childbirth.
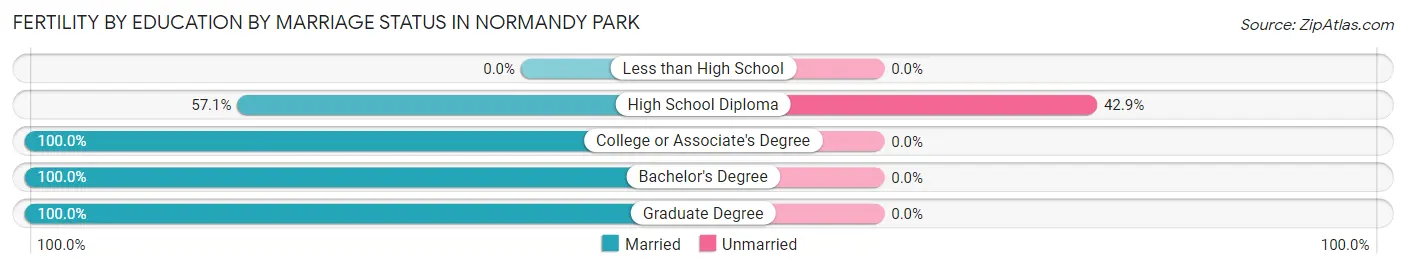
| Educational Attainment | Married | Unmarried |
| Less than High School | 0 (0.0%) | 0 (0.0%) |
| High School Diploma | 16 (57.1%) | 12 (42.9%) |
| College or Associate's Degree | 69 (100.0%) | 0 (0.0%) |
| Bachelor's Degree | 23 (100.0%) | 0 (0.0%) |
| Graduate Degree | 13 (100.0%) | 0 (0.0%) |
| Total | 121 (91.0%) | 12 (9.0%) |
Employment Characteristics in Normandy Park
Employment by Class of Employer in Normandy Park
Among the 3,070 employed individuals in Normandy Park, private company employees (2,213 | 72.1%), self-employed (incorporated) (203 | 6.6%), and local government employees (197 | 6.4%) make up the most common classes of employment.
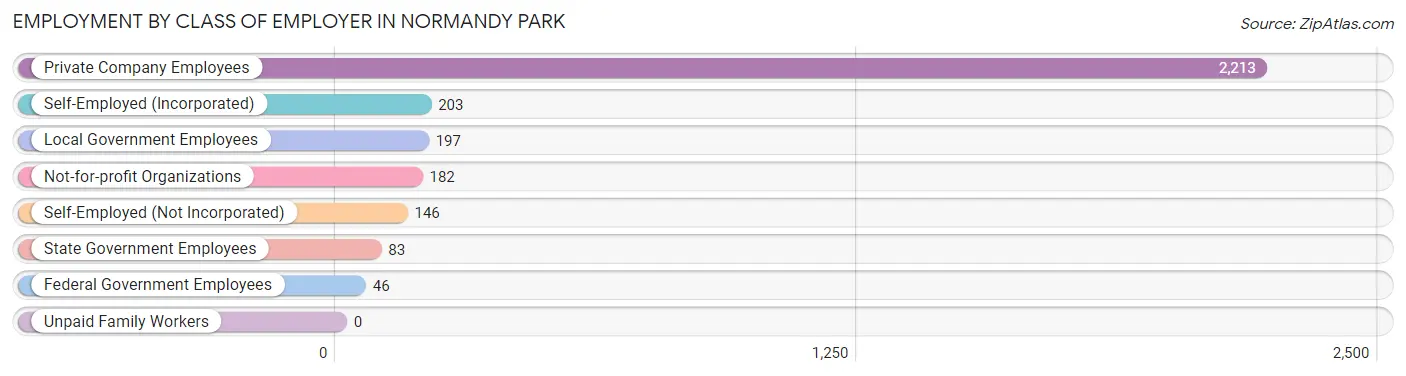
| Employer Class | # Employees | % Employees |
| Private Company Employees | 2,213 | 72.1% |
| Self-Employed (Incorporated) | 203 | 6.6% |
| Self-Employed (Not Incorporated) | 146 | 4.8% |
| Not-for-profit Organizations | 182 | 5.9% |
| Local Government Employees | 197 | 6.4% |
| State Government Employees | 83 | 2.7% |
| Federal Government Employees | 46 | 1.5% |
| Unpaid Family Workers | 0 | 0.0% |
| Total | 3,070 | 100.0% |
Employment Status by Age in Normandy Park
According to the labor force statistics for Normandy Park, out of the total population over 16 years of age (5,378), 61.2% or 3,291 individuals are in the labor force, with 3.8% or 125 of them unemployed. The age group with the highest labor force participation rate is 45 to 54 years, with 92.6% or 687 individuals in the labor force. Within the labor force, the 20 to 24 years age range has the highest percentage of unemployed individuals, with 34.5% or 19 of them being unemployed.
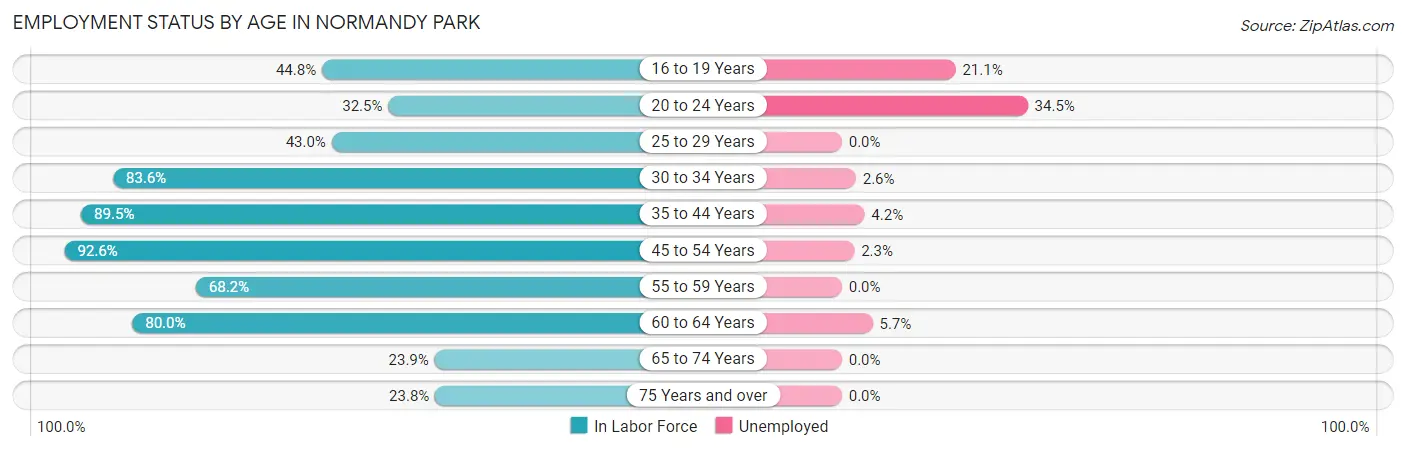
| Age Bracket | In Labor Force | Unemployed |
| 16 to 19 Years | 133 (44.8%) | 28 (21.1%) |
| 20 to 24 Years | 55 (32.5%) | 19 (34.5%) |
| 25 to 29 Years | 61 (43.0%) | 0 (0.0%) |
| 30 to 34 Years | 342 (83.6%) | 9 (2.6%) |
| 35 to 44 Years | 831 (89.5%) | 35 (4.2%) |
| 45 to 54 Years | 687 (92.6%) | 16 (2.3%) |
| 55 to 59 Years | 493 (68.2%) | 0 (0.0%) |
| 60 to 64 Years | 316 (80.0%) | 18 (5.7%) |
| 65 to 74 Years | 231 (23.9%) | 0 (0.0%) |
| 75 Years and over | 144 (23.8%) | 0 (0.0%) |
| Total | 3,291 (61.2%) | 125 (3.8%) |
Employment Status by Educational Attainment in Normandy Park
According to labor force statistics for Normandy Park, 81.8% of individuals (2,731) out of the total population between 25 and 64 years of age (3,339) are in the labor force, with 2.9% or 79 of them being unemployed. The group with the highest labor force participation rate are those with the educational attainment of less than high school, with 100.0% or 39 individuals in the labor force. Within the labor force, individuals with bachelor's degree or higher education have the highest percentage of unemployment, with 4.3% or 65 of them being unemployed.
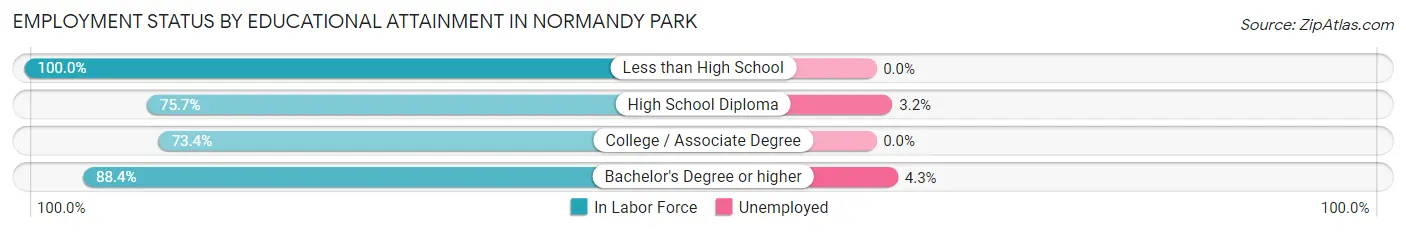
| Educational Attainment | In Labor Force | Unemployed |
| Less than High School | 39 (100.0%) | 0 (0.0%) |
| High School Diploma | 409 (75.7%) | 17 (3.2%) |
| College / Associate Degree | 774 (73.4%) | 0 (0.0%) |
| Bachelor's Degree or higher | 1,507 (88.4%) | 73 (4.3%) |
| Total | 2,731 (81.8%) | 97 (2.9%) |
Employment Occupations by Sex in Normandy Park
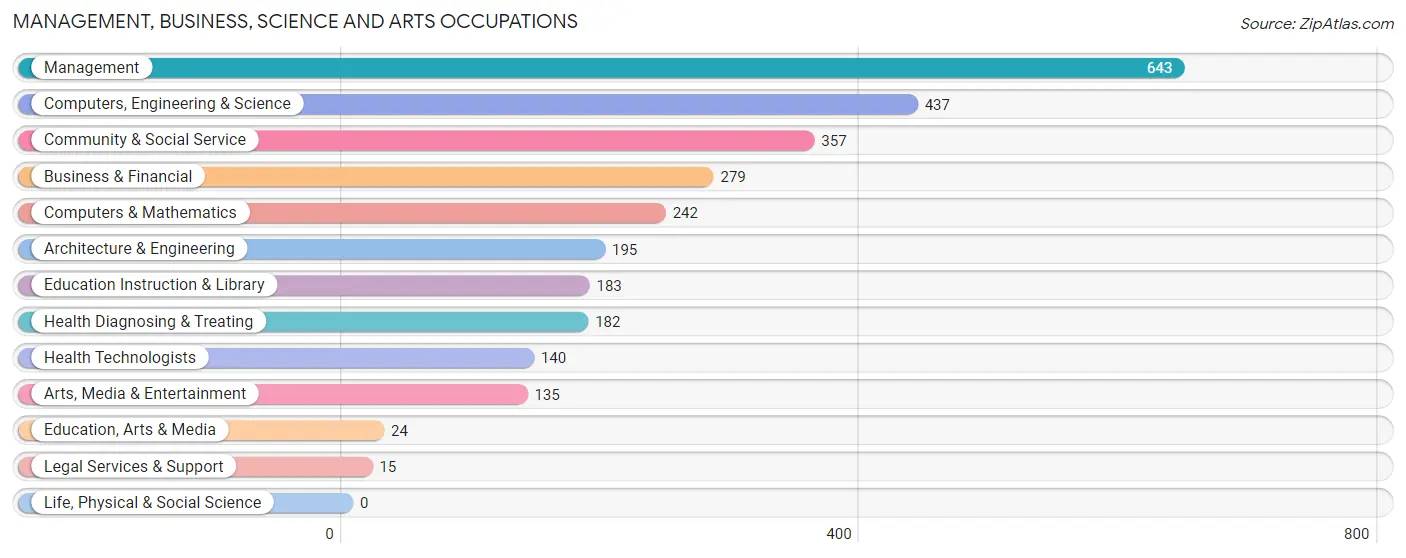
Management, Business, Science and Arts Occupations
The most common Management, Business, Science and Arts occupations in Normandy Park are Management (643 | 20.3%), Computers, Engineering & Science (437 | 13.8%), Community & Social Service (357 | 11.3%), Business & Financial (279 | 8.8%), and Computers & Mathematics (242 | 7.6%).
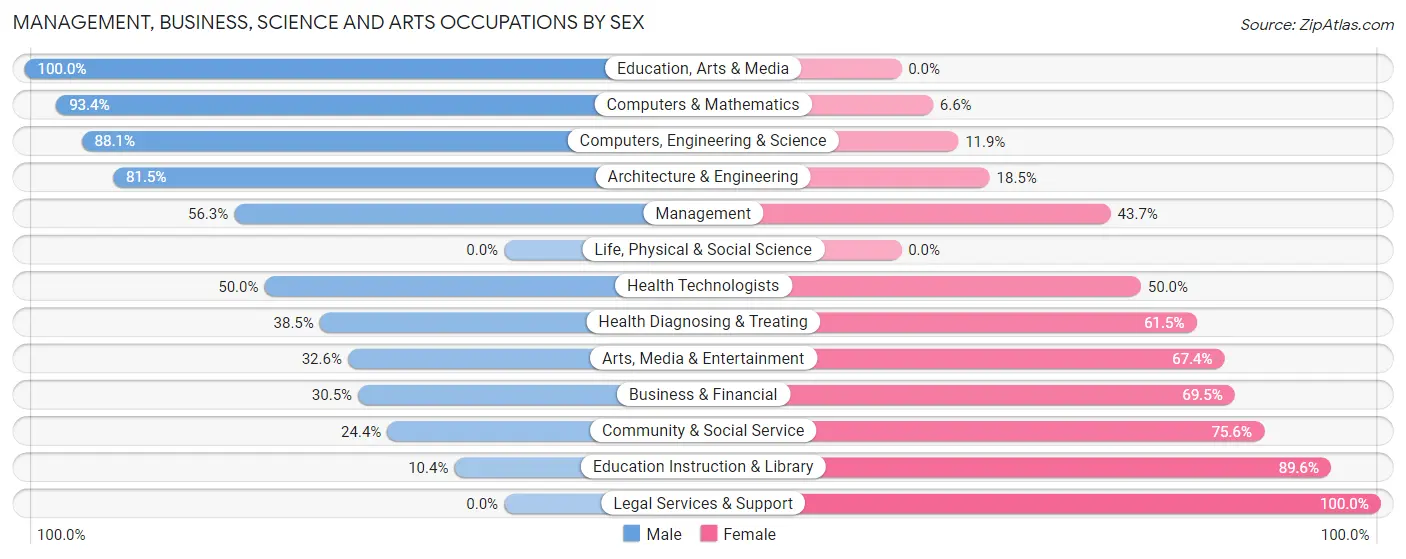
Management, Business, Science and Arts Occupations by Sex
Within the Management, Business, Science and Arts occupations in Normandy Park, the most male-oriented occupations are Education, Arts & Media (100.0%), Computers & Mathematics (93.4%), and Computers, Engineering & Science (88.1%), while the most female-oriented occupations are Legal Services & Support (100.0%), Education Instruction & Library (89.6%), and Community & Social Service (75.6%).
| Occupation | Male | Female |
| Management | 362 (56.3%) | 281 (43.7%) |
| Business & Financial | 85 (30.5%) | 194 (69.5%) |
| Computers, Engineering & Science | 385 (88.1%) | 52 (11.9%) |
| Computers & Mathematics | 226 (93.4%) | 16 (6.6%) |
| Architecture & Engineering | 159 (81.5%) | 36 (18.5%) |
| Life, Physical & Social Science | 0 (0.0%) | 0 (0.0%) |
| Community & Social Service | 87 (24.4%) | 270 (75.6%) |
| Education, Arts & Media | 24 (100.0%) | 0 (0.0%) |
| Legal Services & Support | 0 (0.0%) | 15 (100.0%) |
| Education Instruction & Library | 19 (10.4%) | 164 (89.6%) |
| Arts, Media & Entertainment | 44 (32.6%) | 91 (67.4%) |
| Health Diagnosing & Treating | 70 (38.5%) | 112 (61.5%) |
| Health Technologists | 70 (50.0%) | 70 (50.0%) |
| Total (Category) | 989 (52.1%) | 909 (47.9%) |
| Total (Overall) | 1,749 (55.2%) | 1,419 (44.8%) |
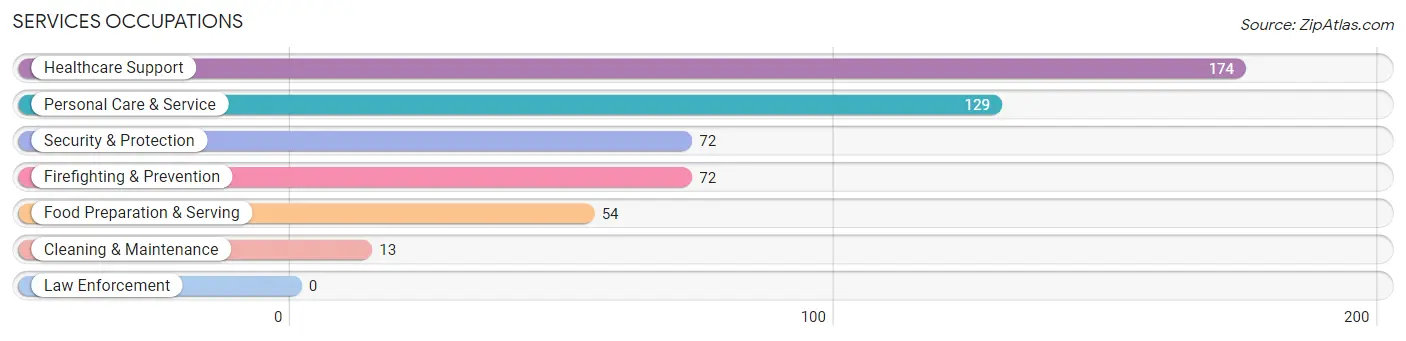
Services Occupations
The most common Services occupations in Normandy Park are Healthcare Support (174 | 5.5%), Personal Care & Service (129 | 4.1%), Security & Protection (72 | 2.3%), Firefighting & Prevention (72 | 2.3%), and Food Preparation & Serving (54 | 1.7%).
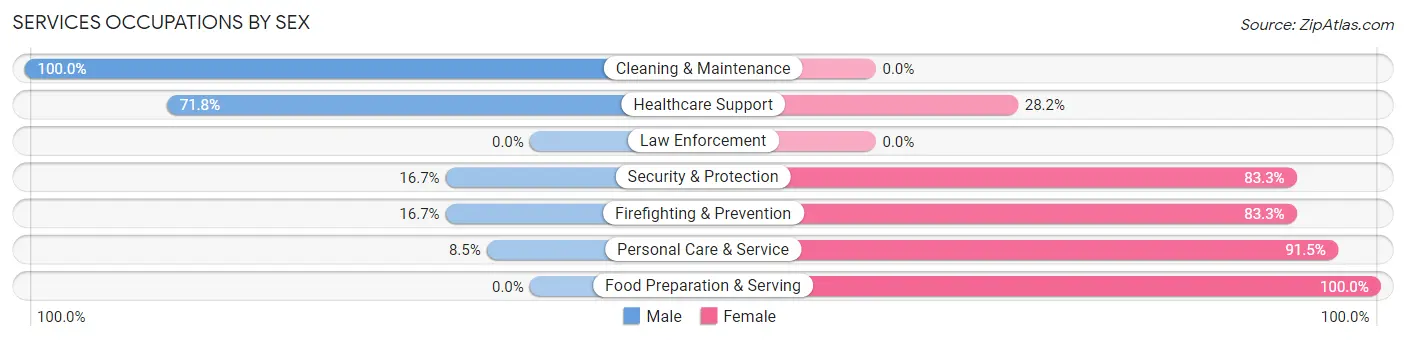
Services Occupations by Sex
Within the Services occupations in Normandy Park, the most male-oriented occupations are Cleaning & Maintenance (100.0%), Healthcare Support (71.8%), and Security & Protection (16.7%), while the most female-oriented occupations are Food Preparation & Serving (100.0%), Personal Care & Service (91.5%), and Security & Protection (83.3%).
| Occupation | Male | Female |
| Healthcare Support | 125 (71.8%) | 49 (28.2%) |
| Security & Protection | 12 (16.7%) | 60 (83.3%) |
| Firefighting & Prevention | 12 (16.7%) | 60 (83.3%) |
| Law Enforcement | 0 (0.0%) | 0 (0.0%) |
| Food Preparation & Serving | 0 (0.0%) | 54 (100.0%) |
| Cleaning & Maintenance | 13 (100.0%) | 0 (0.0%) |
| Personal Care & Service | 11 (8.5%) | 118 (91.5%) |
| Total (Category) | 161 (36.4%) | 281 (63.6%) |
| Total (Overall) | 1,749 (55.2%) | 1,419 (44.8%) |
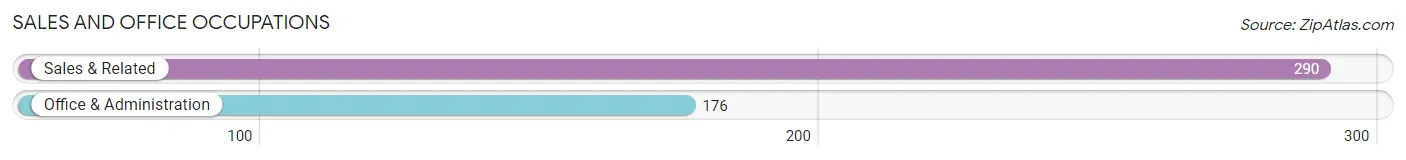
Sales and Office Occupations
The most common Sales and Office occupations in Normandy Park are Sales & Related (290 | 9.1%), and Office & Administration (176 | 5.6%).
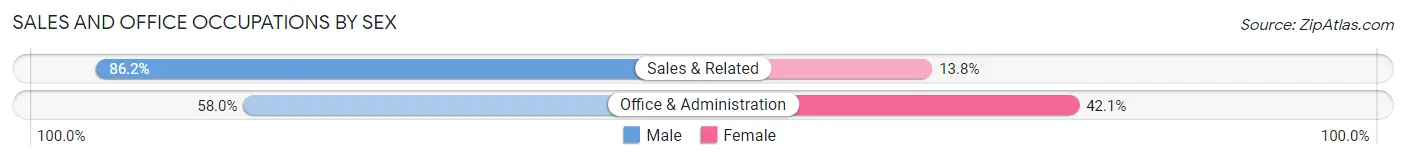
Sales and Office Occupations by Sex
| Occupation | Male | Female |
| Sales & Related | 250 (86.2%) | 40 (13.8%) |
| Office & Administration | 102 (58.0%) | 74 (42.0%) |
| Total (Category) | 352 (75.5%) | 114 (24.5%) |
| Total (Overall) | 1,749 (55.2%) | 1,419 (44.8%) |
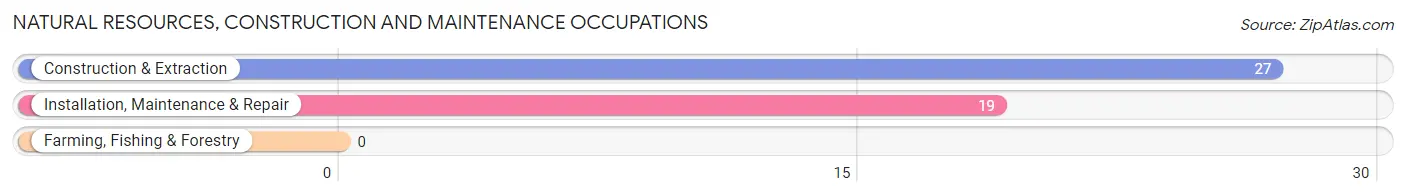
Natural Resources, Construction and Maintenance Occupations
The most common Natural Resources, Construction and Maintenance occupations in Normandy Park are Construction & Extraction (27 | 0.9%), and Installation, Maintenance & Repair (19 | 0.6%).
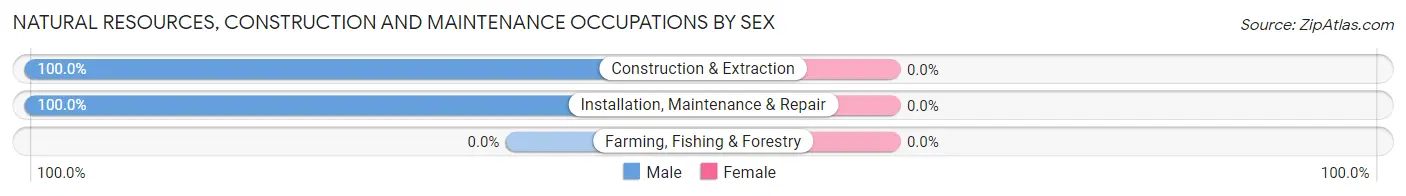
Natural Resources, Construction and Maintenance Occupations by Sex
| Occupation | Male | Female |
| Farming, Fishing & Forestry | 0 (0.0%) | 0 (0.0%) |
| Construction & Extraction | 27 (100.0%) | 0 (0.0%) |
| Installation, Maintenance & Repair | 19 (100.0%) | 0 (0.0%) |
| Total (Category) | 46 (100.0%) | 0 (0.0%) |
| Total (Overall) | 1,749 (55.2%) | 1,419 (44.8%) |
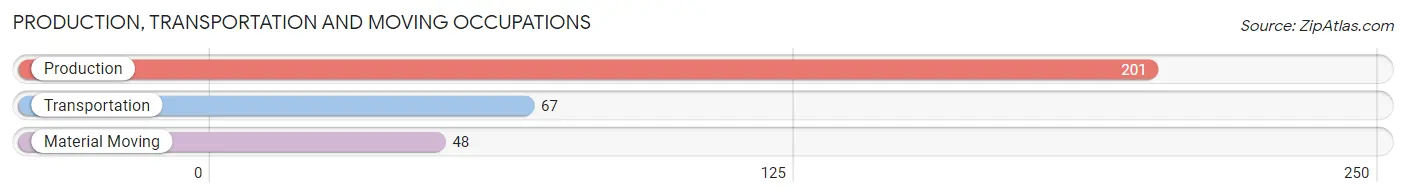
Production, Transportation and Moving Occupations
The most common Production, Transportation and Moving occupations in Normandy Park are Production (201 | 6.3%), Transportation (67 | 2.1%), and Material Moving (48 | 1.5%).
Production, Transportation and Moving Occupations by Sex
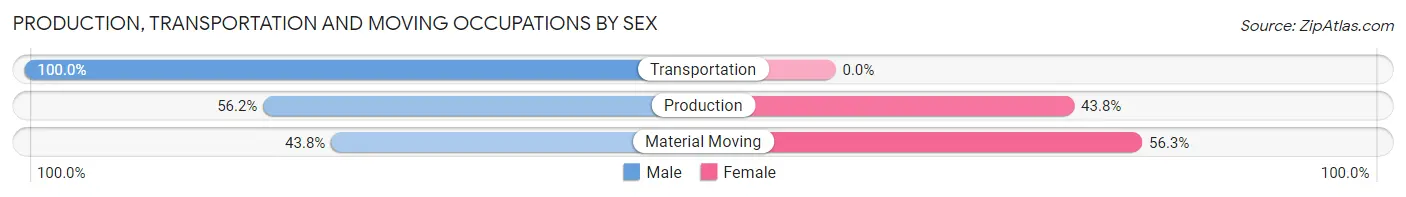
| Occupation | Male | Female |
| Production | 113 (56.2%) | 88 (43.8%) |
| Transportation | 67 (100.0%) | 0 (0.0%) |
| Material Moving | 21 (43.8%) | 27 (56.2%) |
| Total (Category) | 201 (63.6%) | 115 (36.4%) |
| Total (Overall) | 1,749 (55.2%) | 1,419 (44.8%) |
Employment Industries by Sex in Normandy Park
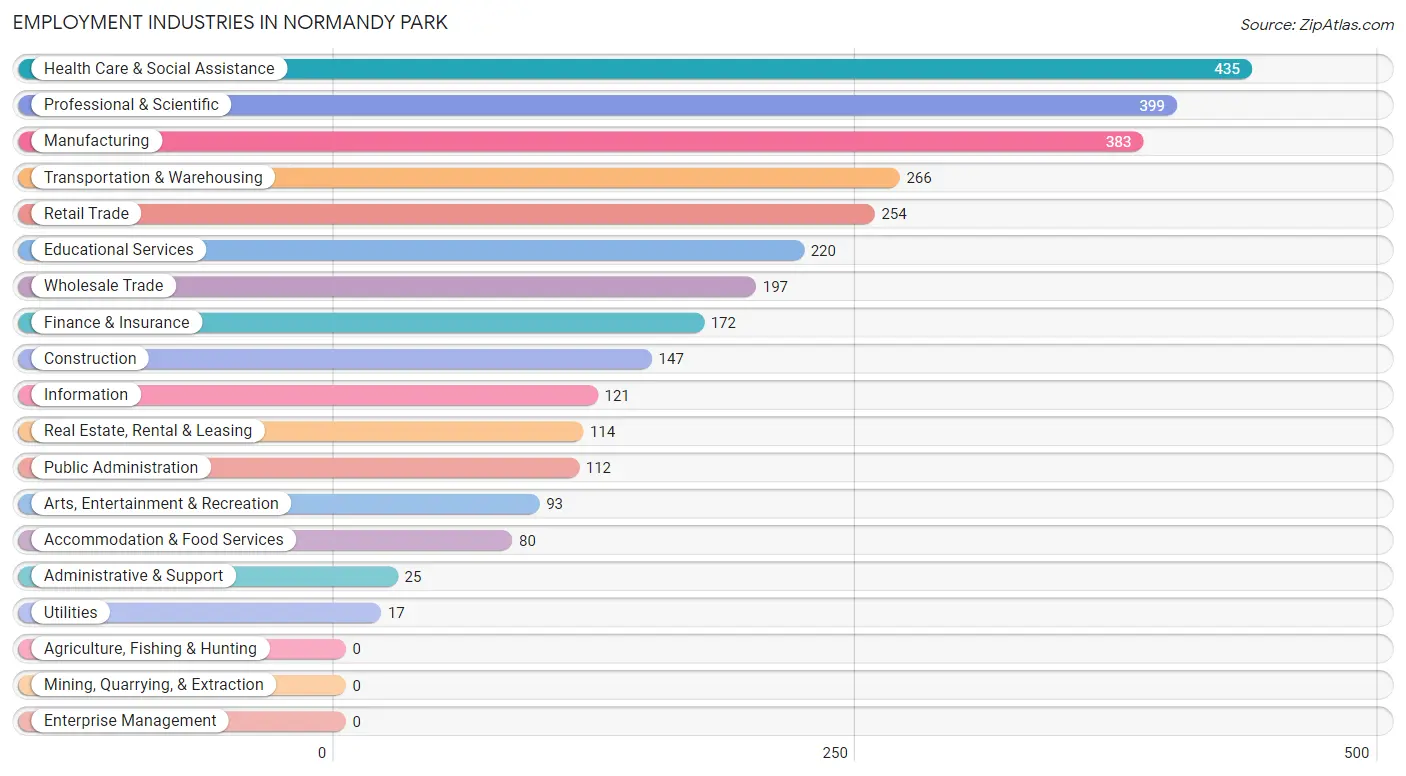
Employment Industries in Normandy Park
The major employment industries in Normandy Park include Health Care & Social Assistance (435 | 13.7%), Professional & Scientific (399 | 12.6%), Manufacturing (383 | 12.1%), Transportation & Warehousing (266 | 8.4%), and Retail Trade (254 | 8.0%).
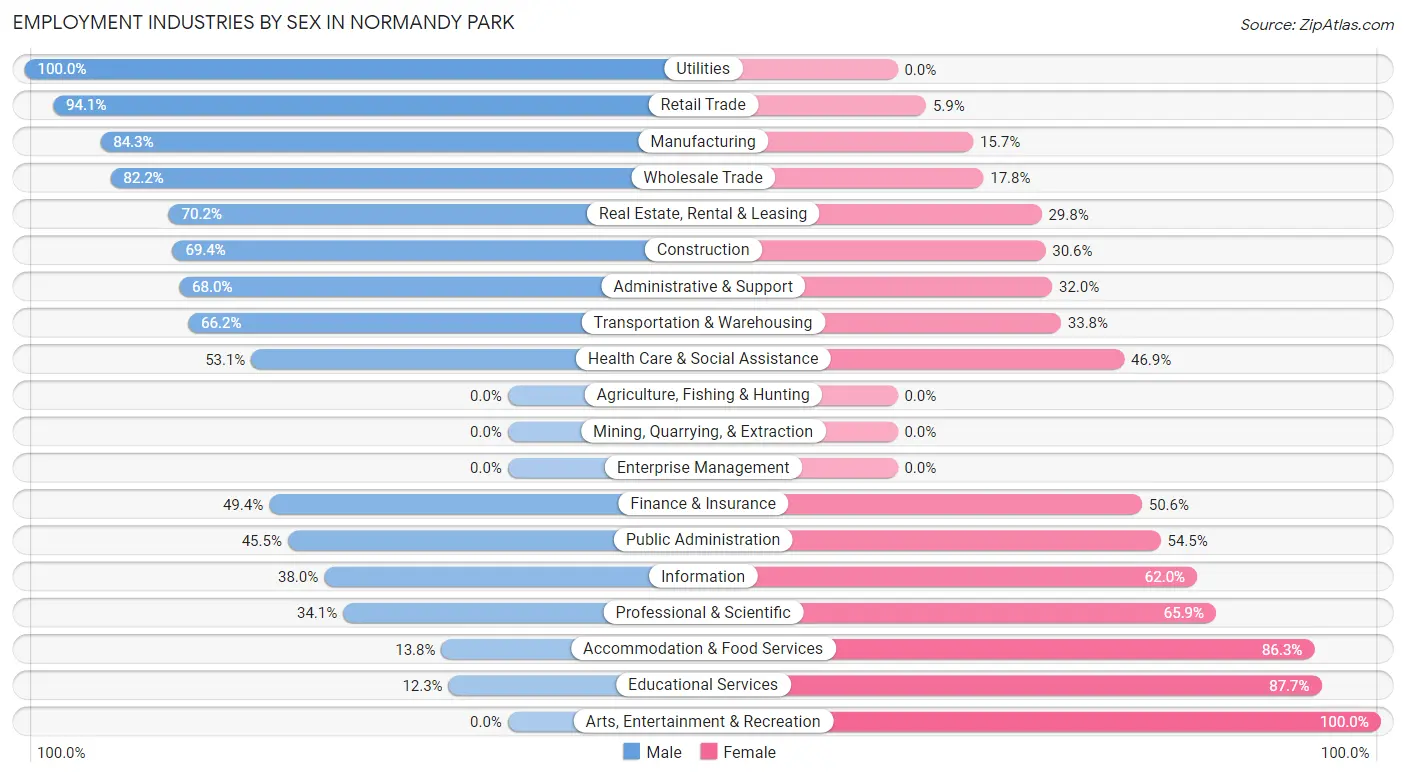
Employment Industries by Sex in Normandy Park
The Normandy Park industries that see more men than women are Utilities (100.0%), Retail Trade (94.1%), and Manufacturing (84.3%), whereas the industries that tend to have a higher number of women are Arts, Entertainment & Recreation (100.0%), Educational Services (87.7%), and Accommodation & Food Services (86.3%).
| Industry | Male | Female |
| Agriculture, Fishing & Hunting | 0 (0.0%) | 0 (0.0%) |
| Mining, Quarrying, & Extraction | 0 (0.0%) | 0 (0.0%) |
| Construction | 102 (69.4%) | 45 (30.6%) |
| Manufacturing | 323 (84.3%) | 60 (15.7%) |
| Wholesale Trade | 162 (82.2%) | 35 (17.8%) |
| Retail Trade | 239 (94.1%) | 15 (5.9%) |
| Transportation & Warehousing | 176 (66.2%) | 90 (33.8%) |
| Utilities | 17 (100.0%) | 0 (0.0%) |
| Information | 46 (38.0%) | 75 (62.0%) |
| Finance & Insurance | 85 (49.4%) | 87 (50.6%) |
| Real Estate, Rental & Leasing | 80 (70.2%) | 34 (29.8%) |
| Professional & Scientific | 136 (34.1%) | 263 (65.9%) |
| Enterprise Management | 0 (0.0%) | 0 (0.0%) |
| Administrative & Support | 17 (68.0%) | 8 (32.0%) |
| Educational Services | 27 (12.3%) | 193 (87.7%) |
| Health Care & Social Assistance | 231 (53.1%) | 204 (46.9%) |
| Arts, Entertainment & Recreation | 0 (0.0%) | 93 (100.0%) |
| Accommodation & Food Services | 11 (13.8%) | 69 (86.3%) |
| Public Administration | 51 (45.5%) | 61 (54.5%) |
| Total | 1,749 (55.2%) | 1,419 (44.8%) |
Education in Normandy Park
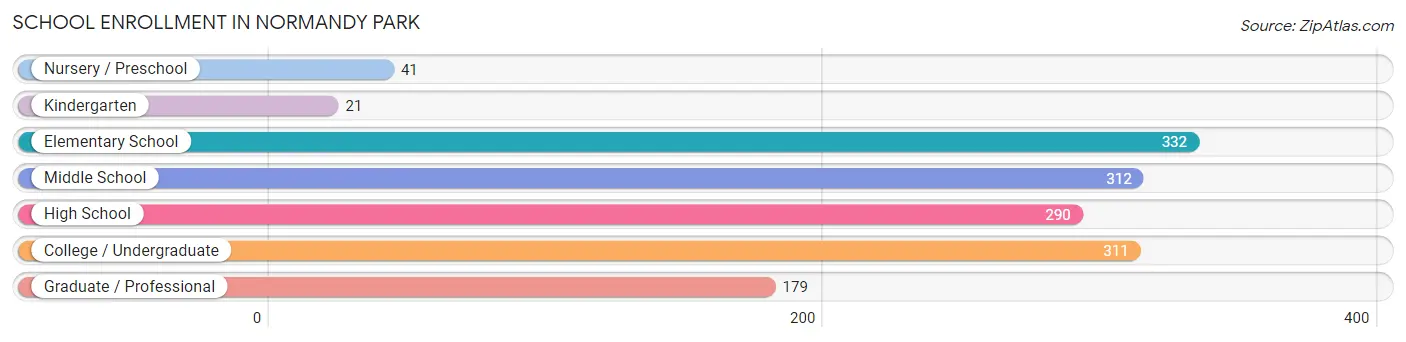
School Enrollment in Normandy Park
The most common levels of schooling among the 1,486 students in Normandy Park are elementary school (332 | 22.3%), middle school (312 | 21.0%), and college / undergraduate (311 | 20.9%).
| School Level | # Students | % Students |
| Nursery / Preschool | 41 | 2.8% |
| Kindergarten | 21 | 1.4% |
| Elementary School | 332 | 22.3% |
| Middle School | 312 | 21.0% |
| High School | 290 | 19.5% |
| College / Undergraduate | 311 | 20.9% |
| Graduate / Professional | 179 | 12.0% |
| Total | 1,486 | 100.0% |
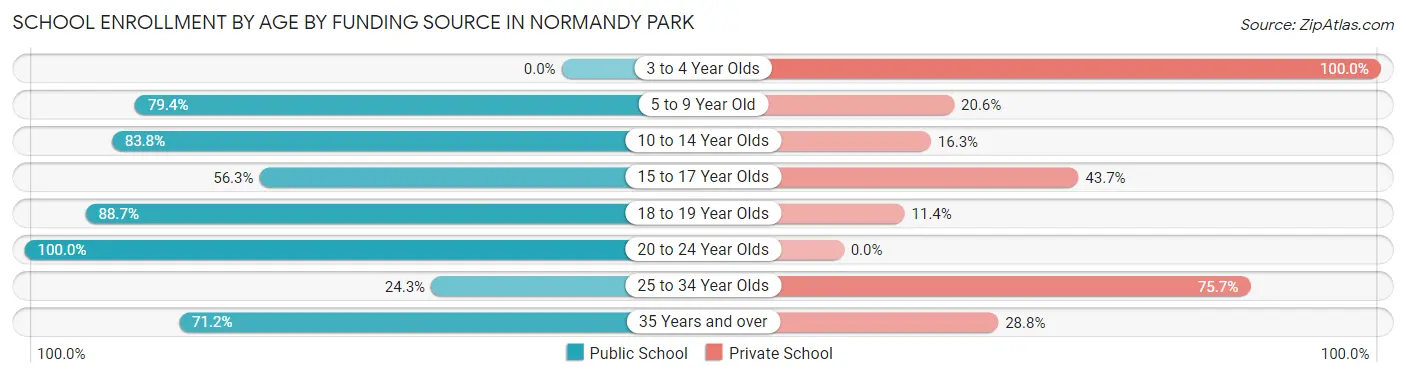
School Enrollment by Age by Funding Source in Normandy Park
Out of a total of 1,486 students who are enrolled in schools in Normandy Park, 351 (23.6%) attend a private institution, while the remaining 1,135 (76.4%) are enrolled in public schools. The age group of 3 to 4 year olds has the highest likelihood of being enrolled in private schools, with 23 (100.0% in the age bracket) enrolled. Conversely, the age group of 20 to 24 year olds has the lowest likelihood of being enrolled in a private school, with 129 (100.0% in the age bracket) attending a public institution.
| Age Bracket | Public School | Private School |
| 3 to 4 Year Olds | 0 (0.0%) | 23 (100.0%) |
| 5 to 9 Year Old | 251 (79.4%) | 65 (20.6%) |
| 10 to 14 Year Olds | 335 (83.8%) | 65 (16.3%) |
| 15 to 17 Year Olds | 103 (56.3%) | 80 (43.7%) |
| 18 to 19 Year Olds | 125 (88.6%) | 16 (11.4%) |
| 20 to 24 Year Olds | 129 (100.0%) | 0 (0.0%) |
| 25 to 34 Year Olds | 9 (24.3%) | 28 (75.7%) |
| 35 Years and over | 183 (71.2%) | 74 (28.8%) |
| Total | 1,135 (76.4%) | 351 (23.6%) |
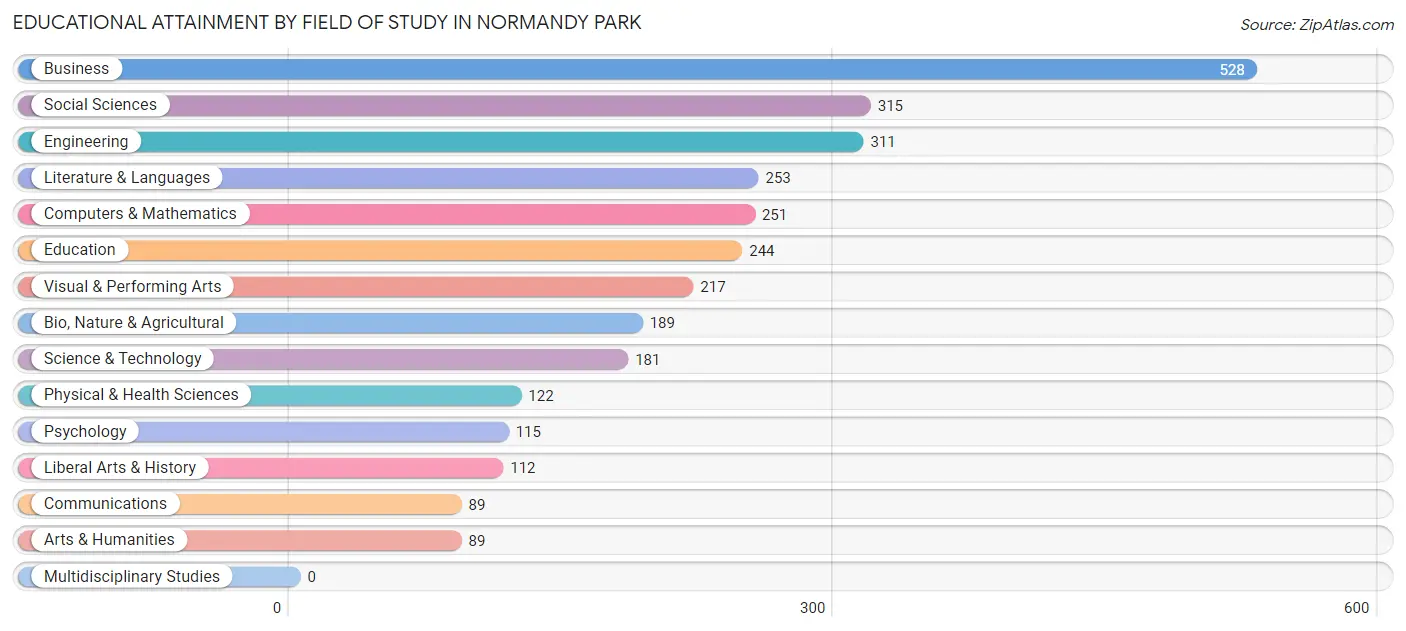
Educational Attainment by Field of Study in Normandy Park
Business (528 | 17.5%), social sciences (315 | 10.4%), engineering (311 | 10.3%), literature & languages (253 | 8.4%), and computers & mathematics (251 | 8.3%) are the most common fields of study among 3,016 individuals in Normandy Park who have obtained a bachelor's degree or higher.
| Field of Study | # Graduates | % Graduates |
| Computers & Mathematics | 251 | 8.3% |
| Bio, Nature & Agricultural | 189 | 6.3% |
| Physical & Health Sciences | 122 | 4.1% |
| Psychology | 115 | 3.8% |
| Social Sciences | 315 | 10.4% |
| Engineering | 311 | 10.3% |
| Multidisciplinary Studies | 0 | 0.0% |
| Science & Technology | 181 | 6.0% |
| Business | 528 | 17.5% |
| Education | 244 | 8.1% |
| Literature & Languages | 253 | 8.4% |
| Liberal Arts & History | 112 | 3.7% |
| Visual & Performing Arts | 217 | 7.2% |
| Communications | 89 | 2.9% |
| Arts & Humanities | 89 | 2.9% |
| Total | 3,016 | 100.0% |
Transportation & Commute in Normandy Park
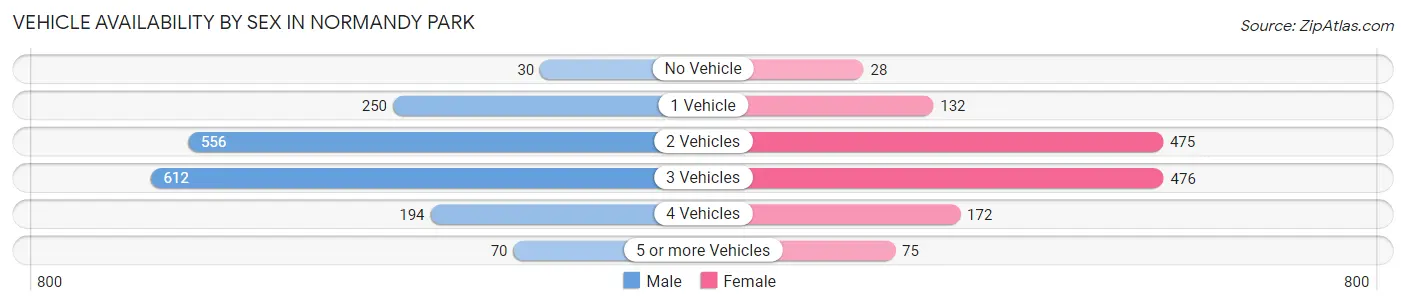
Vehicle Availability by Sex in Normandy Park
The most prevalent vehicle ownership categories in Normandy Park are males with 3 vehicles (612, accounting for 35.7%) and females with 3 vehicles (476, making up 45.1%).
| Vehicles Available | Male | Female |
| No Vehicle | 30 (1.8%) | 28 (2.1%) |
| 1 Vehicle | 250 (14.6%) | 132 (9.7%) |
| 2 Vehicles | 556 (32.5%) | 475 (35.0%) |
| 3 Vehicles | 612 (35.7%) | 476 (35.0%) |
| 4 Vehicles | 194 (11.3%) | 172 (12.7%) |
| 5 or more Vehicles | 70 (4.1%) | 75 (5.5%) |
| Total | 1,712 (100.0%) | 1,358 (100.0%) |
Commute Time in Normandy Park
The most frequently occuring commute durations in Normandy Park are 20 to 24 minutes (477 commuters, 20.2%), 30 to 34 minutes (402 commuters, 17.0%), and 10 to 14 minutes (336 commuters, 14.2%).
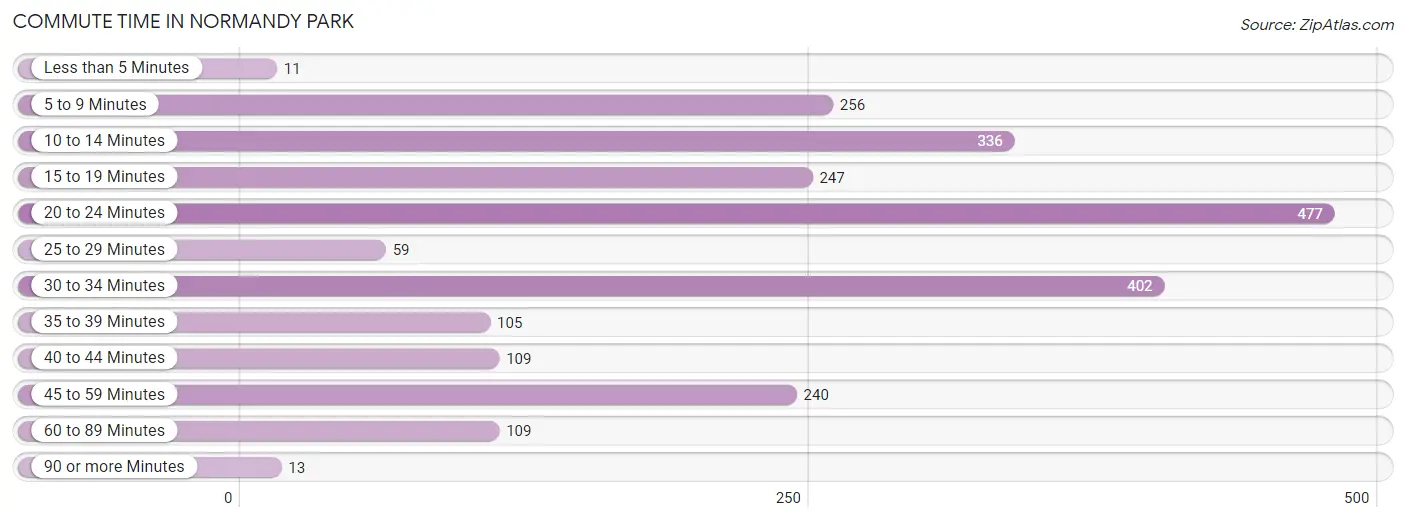
| Commute Time | # Commuters | % Commuters |
| Less than 5 Minutes | 11 | 0.5% |
| 5 to 9 Minutes | 256 | 10.8% |
| 10 to 14 Minutes | 336 | 14.2% |
| 15 to 19 Minutes | 247 | 10.4% |
| 20 to 24 Minutes | 477 | 20.2% |
| 25 to 29 Minutes | 59 | 2.5% |
| 30 to 34 Minutes | 402 | 17.0% |
| 35 to 39 Minutes | 105 | 4.4% |
| 40 to 44 Minutes | 109 | 4.6% |
| 45 to 59 Minutes | 240 | 10.2% |
| 60 to 89 Minutes | 109 | 4.6% |
| 90 or more Minutes | 13 | 0.5% |
Commute Time by Sex in Normandy Park
The most common commute times in Normandy Park are 30 to 34 minutes (317 commuters, 22.1%) for males and 20 to 24 minutes (182 commuters, 19.5%) for females.
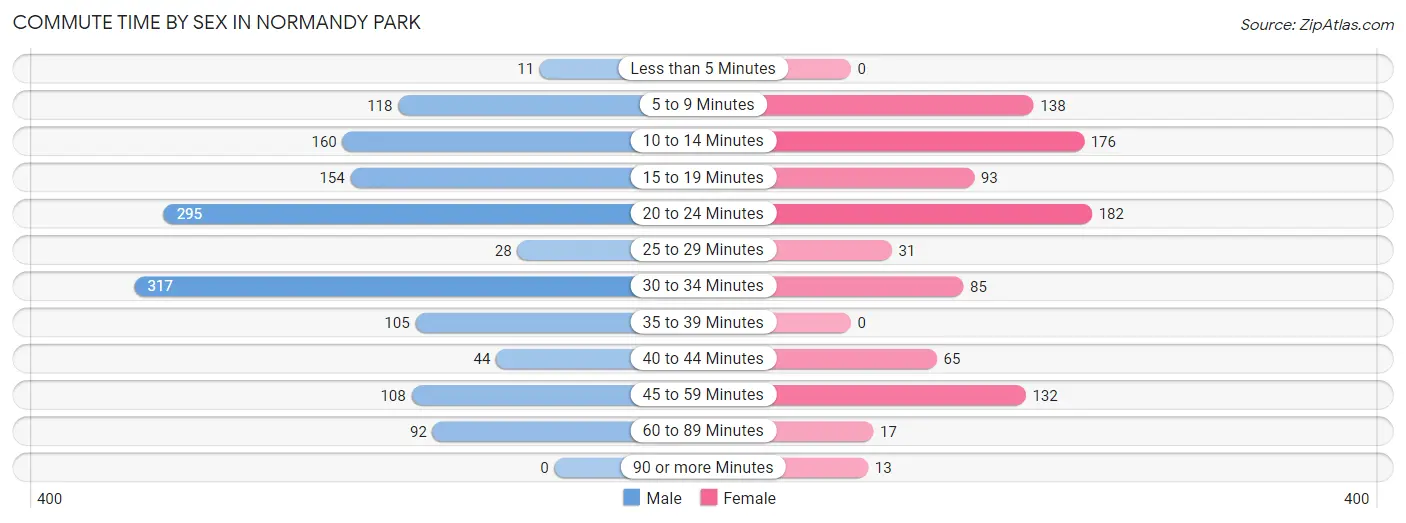
| Commute Time | Male | Female |
| Less than 5 Minutes | 11 (0.8%) | 0 (0.0%) |
| 5 to 9 Minutes | 118 (8.2%) | 138 (14.8%) |
| 10 to 14 Minutes | 160 (11.2%) | 176 (18.9%) |
| 15 to 19 Minutes | 154 (10.7%) | 93 (10.0%) |
| 20 to 24 Minutes | 295 (20.6%) | 182 (19.5%) |
| 25 to 29 Minutes | 28 (2.0%) | 31 (3.3%) |
| 30 to 34 Minutes | 317 (22.1%) | 85 (9.1%) |
| 35 to 39 Minutes | 105 (7.3%) | 0 (0.0%) |
| 40 to 44 Minutes | 44 (3.1%) | 65 (7.0%) |
| 45 to 59 Minutes | 108 (7.5%) | 132 (14.2%) |
| 60 to 89 Minutes | 92 (6.4%) | 17 (1.8%) |
| 90 or more Minutes | 0 (0.0%) | 13 (1.4%) |
Time of Departure to Work by Sex in Normandy Park
The most frequent times of departure to work in Normandy Park are 6:30 AM to 6:59 AM (232, 16.2%) for males and 7:30 AM to 7:59 AM (206, 22.1%) for females.
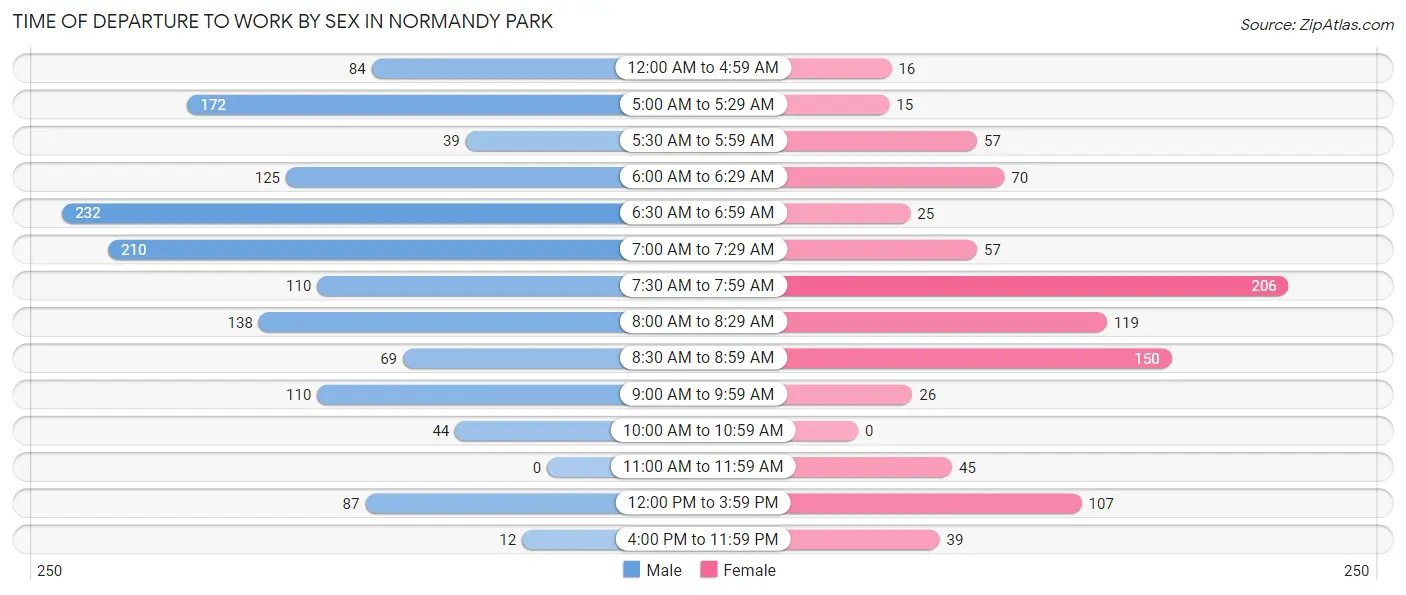
| Time of Departure | Male | Female |
| 12:00 AM to 4:59 AM | 84 (5.9%) | 16 (1.7%) |
| 5:00 AM to 5:29 AM | 172 (12.0%) | 15 (1.6%) |
| 5:30 AM to 5:59 AM | 39 (2.7%) | 57 (6.1%) |
| 6:00 AM to 6:29 AM | 125 (8.7%) | 70 (7.5%) |
| 6:30 AM to 6:59 AM | 232 (16.2%) | 25 (2.7%) |
| 7:00 AM to 7:29 AM | 210 (14.7%) | 57 (6.1%) |
| 7:30 AM to 7:59 AM | 110 (7.7%) | 206 (22.1%) |
| 8:00 AM to 8:29 AM | 138 (9.6%) | 119 (12.8%) |
| 8:30 AM to 8:59 AM | 69 (4.8%) | 150 (16.1%) |
| 9:00 AM to 9:59 AM | 110 (7.7%) | 26 (2.8%) |
| 10:00 AM to 10:59 AM | 44 (3.1%) | 0 (0.0%) |
| 11:00 AM to 11:59 AM | 0 (0.0%) | 45 (4.8%) |
| 12:00 PM to 3:59 PM | 87 (6.1%) | 107 (11.5%) |
| 4:00 PM to 11:59 PM | 12 (0.8%) | 39 (4.2%) |
| Total | 1,432 (100.0%) | 932 (100.0%) |
Housing Occupancy in Normandy Park
Occupancy by Ownership in Normandy Park
Of the total 2,568 dwellings in Normandy Park, owner-occupied units account for 2,059 (80.2%), while renter-occupied units make up 509 (19.8%).
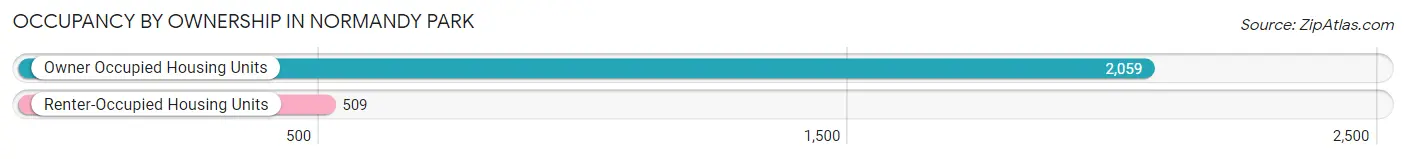
| Occupancy | # Housing Units | % Housing Units |
| Owner Occupied Housing Units | 2,059 | 80.2% |
| Renter-Occupied Housing Units | 509 | 19.8% |
| Total Occupied Housing Units | 2,568 | 100.0% |
Occupancy by Household Size in Normandy Park
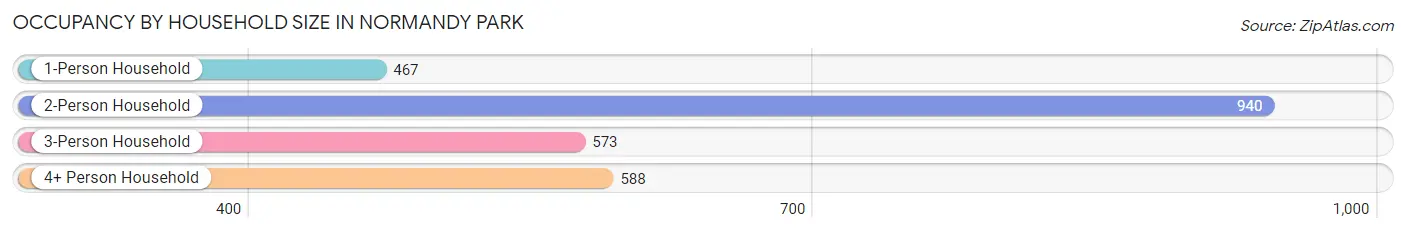
| Household Size | # Housing Units | % Housing Units |
| 1-Person Household | 467 | 18.2% |
| 2-Person Household | 940 | 36.6% |
| 3-Person Household | 573 | 22.3% |
| 4+ Person Household | 588 | 22.9% |
| Total Housing Units | 2,568 | 100.0% |
Occupancy by Ownership by Household Size in Normandy Park
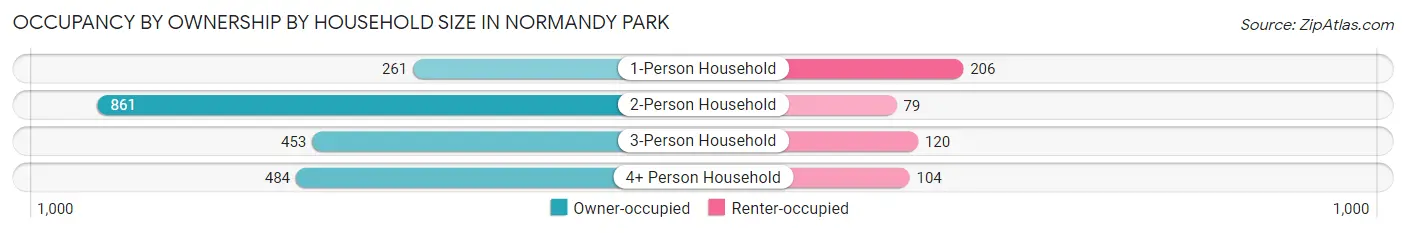
| Household Size | Owner-occupied | Renter-occupied |
| 1-Person Household | 261 (55.9%) | 206 (44.1%) |
| 2-Person Household | 861 (91.6%) | 79 (8.4%) |
| 3-Person Household | 453 (79.1%) | 120 (20.9%) |
| 4+ Person Household | 484 (82.3%) | 104 (17.7%) |
| Total Housing Units | 2,059 (80.2%) | 509 (19.8%) |
Occupancy by Educational Attainment in Normandy Park
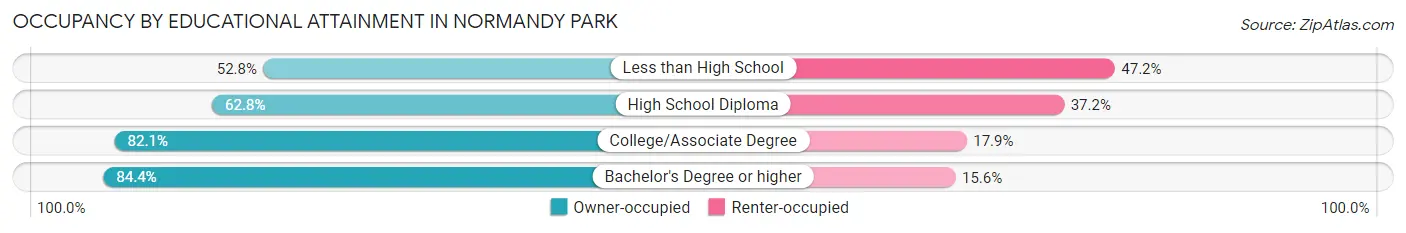
| Household Size | Owner-occupied | Renter-occupied |
| Less than High School | 38 (52.8%) | 34 (47.2%) |
| High School Diploma | 201 (62.8%) | 119 (37.2%) |
| College/Associate Degree | 584 (82.1%) | 127 (17.9%) |
| Bachelor's Degree or higher | 1,236 (84.4%) | 229 (15.6%) |
Occupancy by Age of Householder in Normandy Park
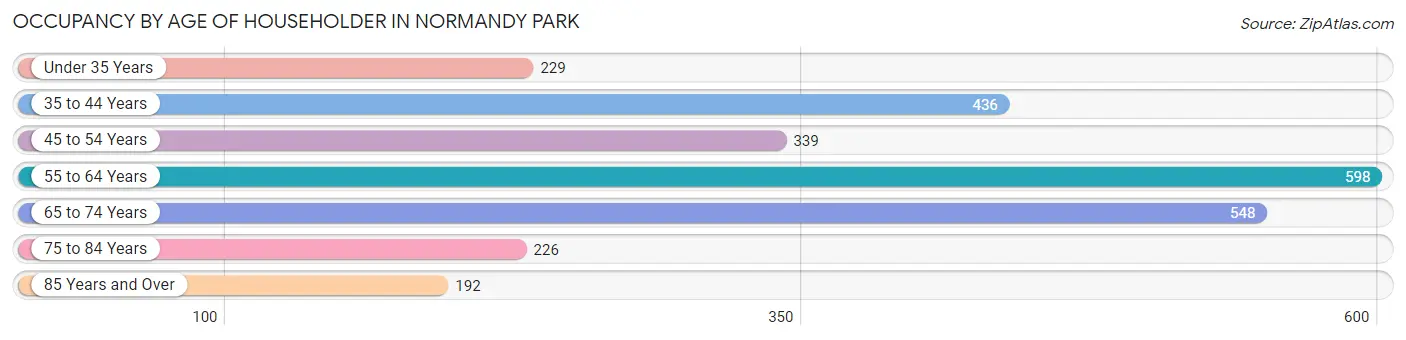
| Age Bracket | # Households | % Households |
| Under 35 Years | 229 | 8.9% |
| 35 to 44 Years | 436 | 17.0% |
| 45 to 54 Years | 339 | 13.2% |
| 55 to 64 Years | 598 | 23.3% |
| 65 to 74 Years | 548 | 21.3% |
| 75 to 84 Years | 226 | 8.8% |
| 85 Years and Over | 192 | 7.5% |
| Total | 2,568 | 100.0% |
Housing Finances in Normandy Park
Median Income by Occupancy in Normandy Park
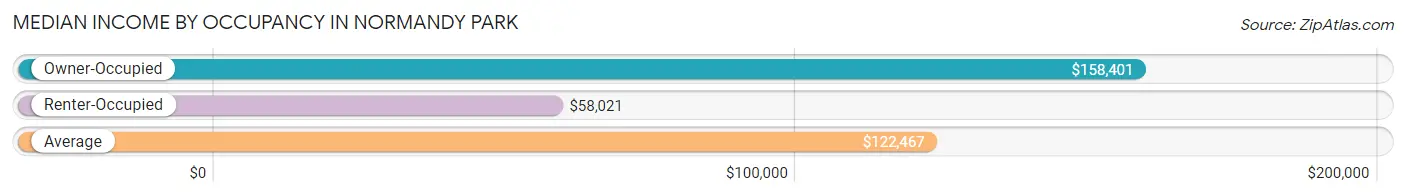
| Occupancy Type | # Households | Median Income |
| Owner-Occupied | 2,059 (80.2%) | $158,401 |
| Renter-Occupied | 509 (19.8%) | $58,021 |
| Average | 2,568 (100.0%) | $122,467 |
Occupancy by Householder Income Bracket in Normandy Park
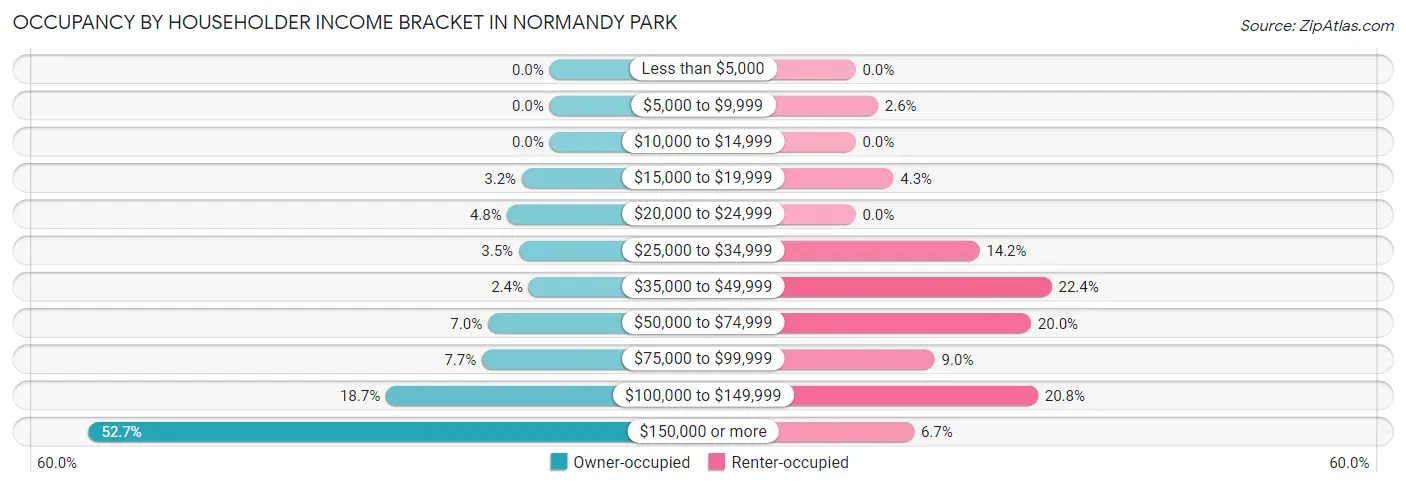
| Income Bracket | Owner-occupied | Renter-occupied |
| Less than $5,000 | 0 (0.0%) | 0 (0.0%) |
| $5,000 to $9,999 | 0 (0.0%) | 13 (2.5%) |
| $10,000 to $14,999 | 0 (0.0%) | 0 (0.0%) |
| $15,000 to $19,999 | 65 (3.2%) | 22 (4.3%) |
| $20,000 to $24,999 | 99 (4.8%) | 0 (0.0%) |
| $25,000 to $34,999 | 72 (3.5%) | 72 (14.1%) |
| $35,000 to $49,999 | 49 (2.4%) | 114 (22.4%) |
| $50,000 to $74,999 | 145 (7.0%) | 102 (20.0%) |
| $75,000 to $99,999 | 159 (7.7%) | 46 (9.0%) |
| $100,000 to $149,999 | 385 (18.7%) | 106 (20.8%) |
| $150,000 or more | 1,085 (52.7%) | 34 (6.7%) |
| Total | 2,059 (100.0%) | 509 (100.0%) |
Monthly Housing Cost Tiers in Normandy Park
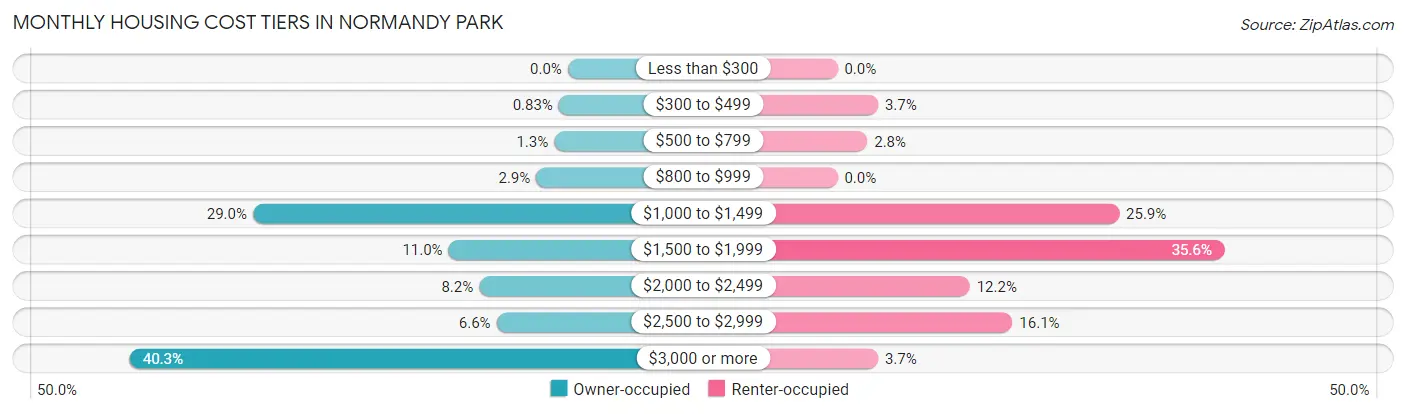
| Monthly Cost | Owner-occupied | Renter-occupied |
| Less than $300 | 0 (0.0%) | 0 (0.0%) |
| $300 to $499 | 17 (0.8%) | 19 (3.7%) |
| $500 to $799 | 26 (1.3%) | 14 (2.8%) |
| $800 to $999 | 60 (2.9%) | 0 (0.0%) |
| $1,000 to $1,499 | 597 (29.0%) | 132 (25.9%) |
| $1,500 to $1,999 | 226 (11.0%) | 181 (35.6%) |
| $2,000 to $2,499 | 168 (8.2%) | 62 (12.2%) |
| $2,500 to $2,999 | 135 (6.6%) | 82 (16.1%) |
| $3,000 or more | 830 (40.3%) | 19 (3.7%) |
| Total | 2,059 (100.0%) | 509 (100.0%) |
Physical Housing Characteristics in Normandy Park
Housing Structures in Normandy Park
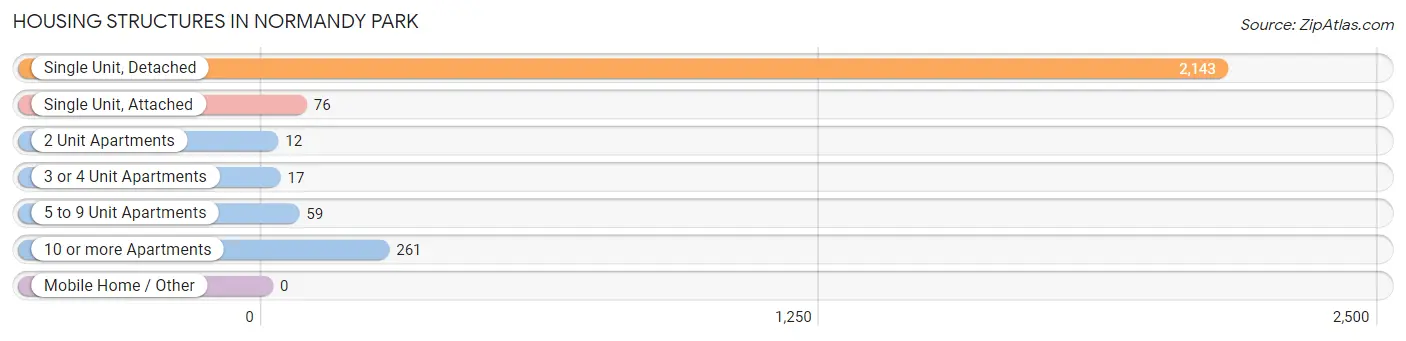
| Structure Type | # Housing Units | % Housing Units |
| Single Unit, Detached | 2,143 | 83.5% |
| Single Unit, Attached | 76 | 3.0% |
| 2 Unit Apartments | 12 | 0.5% |
| 3 or 4 Unit Apartments | 17 | 0.7% |
| 5 to 9 Unit Apartments | 59 | 2.3% |
| 10 or more Apartments | 261 | 10.2% |
| Mobile Home / Other | 0 | 0.0% |
| Total | 2,568 | 100.0% |
Housing Structures by Occupancy in Normandy Park
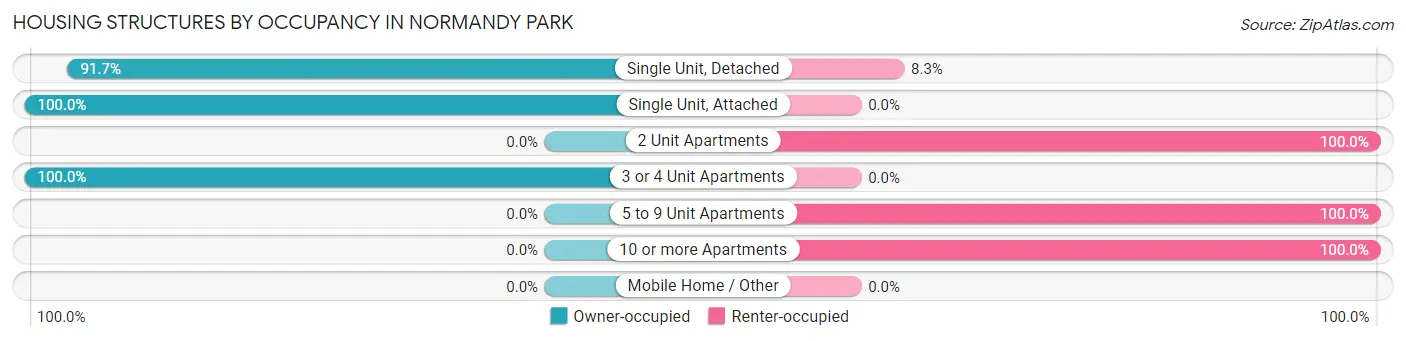
| Structure Type | Owner-occupied | Renter-occupied |
| Single Unit, Detached | 1,966 (91.7%) | 177 (8.3%) |
| Single Unit, Attached | 76 (100.0%) | 0 (0.0%) |
| 2 Unit Apartments | 0 (0.0%) | 12 (100.0%) |
| 3 or 4 Unit Apartments | 17 (100.0%) | 0 (0.0%) |
| 5 to 9 Unit Apartments | 0 (0.0%) | 59 (100.0%) |
| 10 or more Apartments | 0 (0.0%) | 261 (100.0%) |
| Mobile Home / Other | 0 (0.0%) | 0 (0.0%) |
| Total | 2,059 (80.2%) | 509 (19.8%) |
Housing Structures by Number of Rooms in Normandy Park
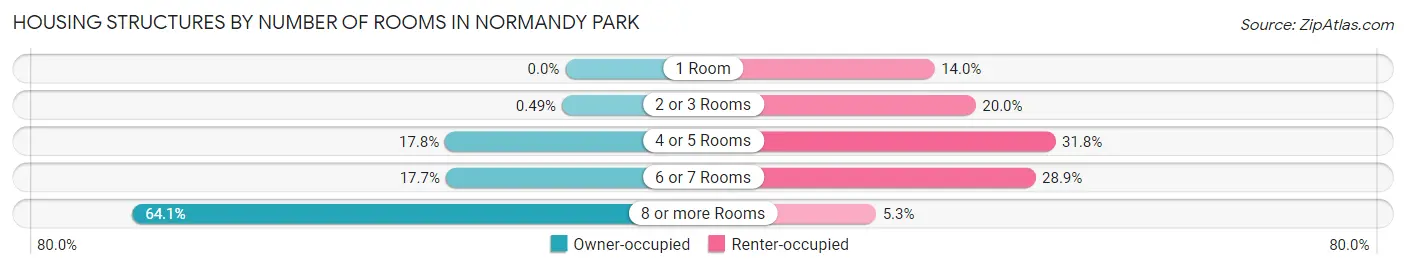
| Number of Rooms | Owner-occupied | Renter-occupied |
| 1 Room | 0 (0.0%) | 71 (14.0%) |
| 2 or 3 Rooms | 10 (0.5%) | 102 (20.0%) |
| 4 or 5 Rooms | 366 (17.8%) | 162 (31.8%) |
| 6 or 7 Rooms | 364 (17.7%) | 147 (28.9%) |
| 8 or more Rooms | 1,319 (64.1%) | 27 (5.3%) |
| Total | 2,059 (100.0%) | 509 (100.0%) |
Housing Structure by Heating Type in Normandy Park
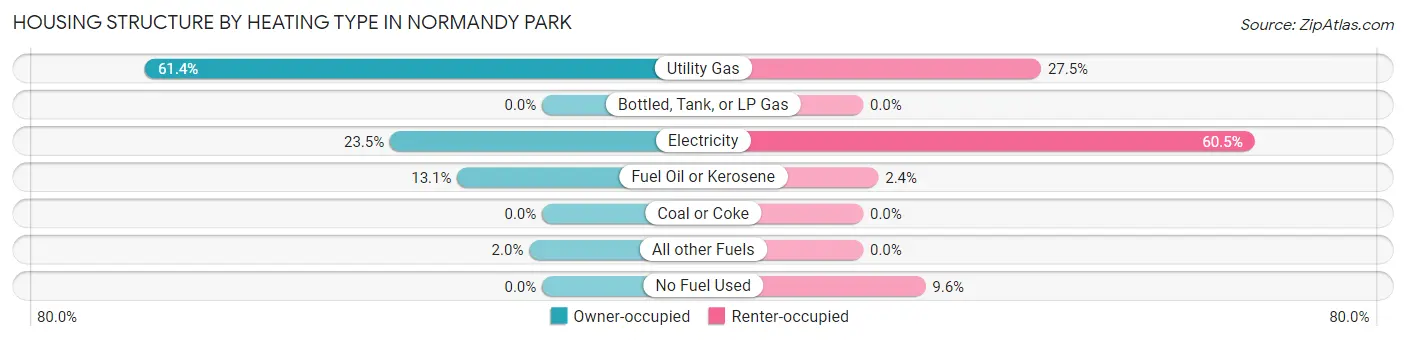
| Heating Type | Owner-occupied | Renter-occupied |
| Utility Gas | 1,264 (61.4%) | 140 (27.5%) |
| Bottled, Tank, or LP Gas | 0 (0.0%) | 0 (0.0%) |
| Electricity | 484 (23.5%) | 308 (60.5%) |
| Fuel Oil or Kerosene | 270 (13.1%) | 12 (2.4%) |
| Coal or Coke | 0 (0.0%) | 0 (0.0%) |
| All other Fuels | 41 (2.0%) | 0 (0.0%) |
| No Fuel Used | 0 (0.0%) | 49 (9.6%) |
| Total | 2,059 (100.0%) | 509 (100.0%) |
Household Vehicle Usage in Normandy Park
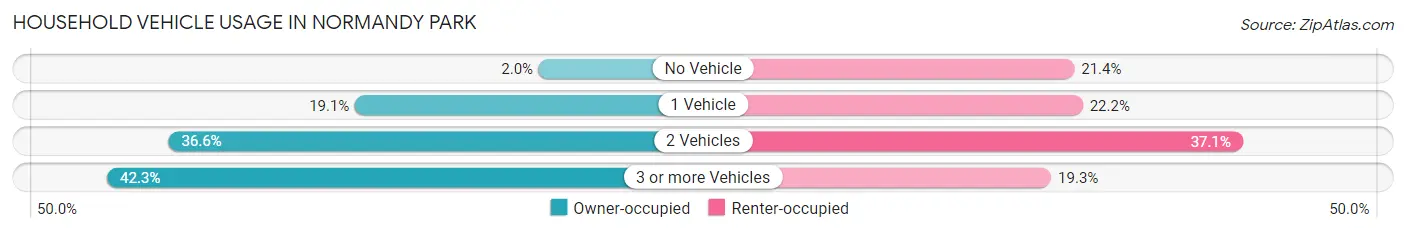
| Vehicles per Household | Owner-occupied | Renter-occupied |
| No Vehicle | 41 (2.0%) | 109 (21.4%) |
| 1 Vehicle | 394 (19.1%) | 113 (22.2%) |
| 2 Vehicles | 753 (36.6%) | 189 (37.1%) |
| 3 or more Vehicles | 871 (42.3%) | 98 (19.3%) |
| Total | 2,059 (100.0%) | 509 (100.0%) |
Real Estate & Mortgages in Normandy Park
Real Estate and Mortgage Overview in Normandy Park
| Characteristic | Without Mortgage | With Mortgage |
| Housing Units | 882 | 1,177 |
| Median Property Value | $903,500 | $843,200 |
| Median Household Income | $103,278 | $757 |
| Monthly Housing Costs | $1,172 | $830 |
| Real Estate Taxes | $9,148 | $0 |
Property Value by Mortgage Status in Normandy Park
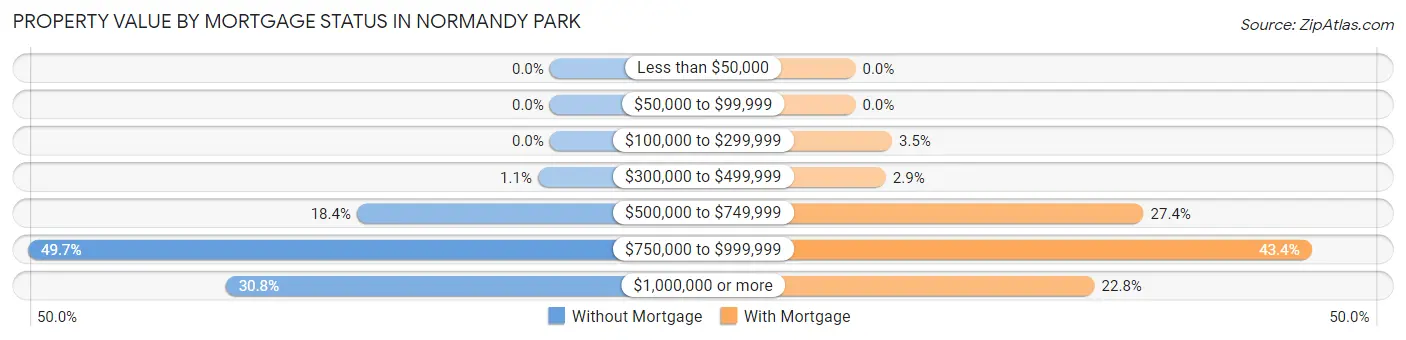
| Property Value | Without Mortgage | With Mortgage |
| Less than $50,000 | 0 (0.0%) | 0 (0.0%) |
| $50,000 to $99,999 | 0 (0.0%) | 0 (0.0%) |
| $100,000 to $299,999 | 0 (0.0%) | 41 (3.5%) |
| $300,000 to $499,999 | 10 (1.1%) | 34 (2.9%) |
| $500,000 to $749,999 | 162 (18.4%) | 323 (27.4%) |
| $750,000 to $999,999 | 438 (49.7%) | 511 (43.4%) |
| $1,000,000 or more | 272 (30.8%) | 268 (22.8%) |
| Total | 882 (100.0%) | 1,177 (100.0%) |
Household Income by Mortgage Status in Normandy Park
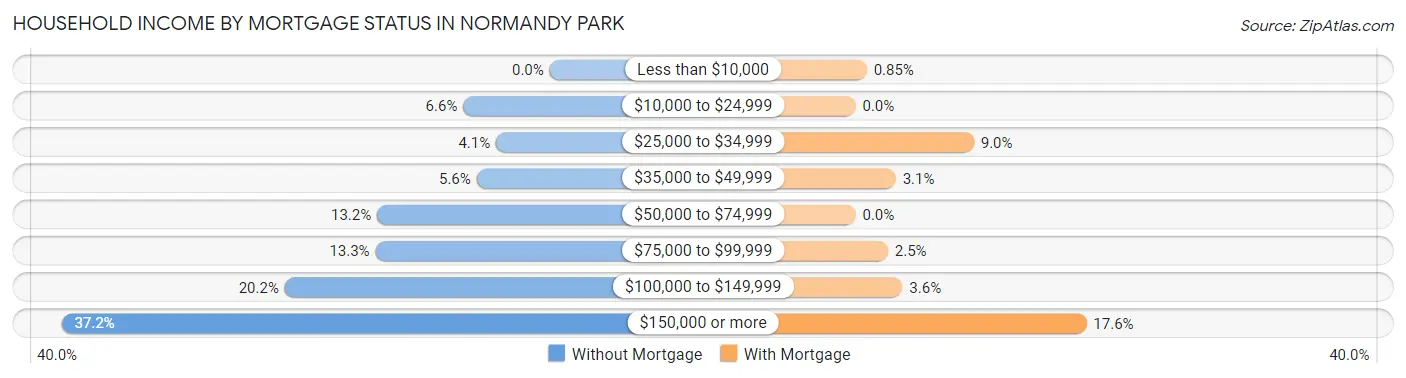
| Household Income | Without Mortgage | With Mortgage |
| Less than $10,000 | 0 (0.0%) | 10 (0.9%) |
| $10,000 to $24,999 | 58 (6.6%) | 0 (0.0%) |
| $25,000 to $34,999 | 36 (4.1%) | 106 (9.0%) |
| $35,000 to $49,999 | 49 (5.6%) | 36 (3.1%) |
| $50,000 to $74,999 | 116 (13.2%) | 0 (0.0%) |
| $75,000 to $99,999 | 117 (13.3%) | 29 (2.5%) |
| $100,000 to $149,999 | 178 (20.2%) | 42 (3.6%) |
| $150,000 or more | 328 (37.2%) | 207 (17.6%) |
| Total | 882 (100.0%) | 1,177 (100.0%) |
Property Value to Household Income Ratio in Normandy Park
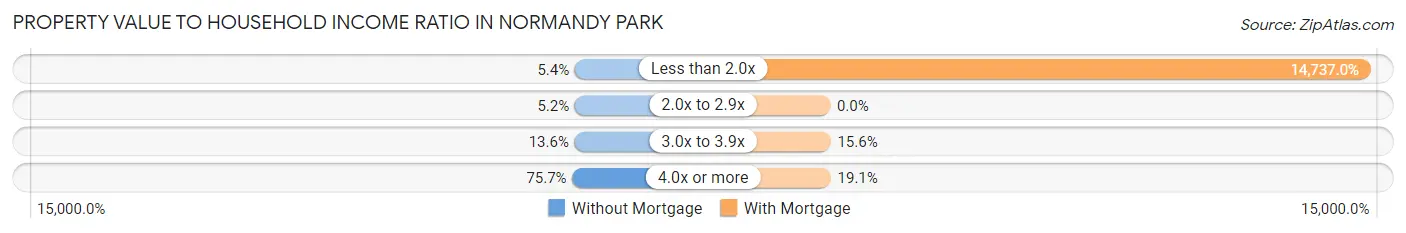
| Value-to-Income Ratio | Without Mortgage | With Mortgage |
| Less than 2.0x | 48 (5.4%) | 173,454 (14,737.0%) |
| 2.0x to 2.9x | 46 (5.2%) | 0 (0.0%) |
| 3.0x to 3.9x | 120 (13.6%) | 184 (15.6%) |
| 4.0x or more | 668 (75.7%) | 225 (19.1%) |
| Total | 882 (100.0%) | 1,177 (100.0%) |
Real Estate Taxes by Mortgage Status in Normandy Park
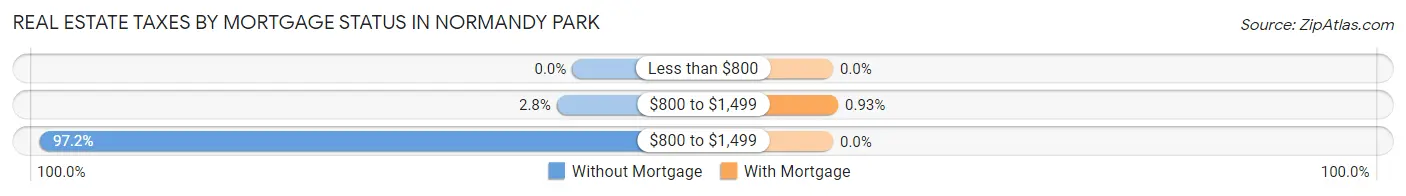
| Property Taxes | Without Mortgage | With Mortgage |
| Less than $800 | 0 (0.0%) | 0 (0.0%) |
| $800 to $1,499 | 25 (2.8%) | 11 (0.9%) |
| $800 to $1,499 | 857 (97.2%) | 0 (0.0%) |
| Total | 882 (100.0%) | 1,177 (100.0%) |
Health & Disability in Normandy Park
Health Insurance Coverage by Age in Normandy Park
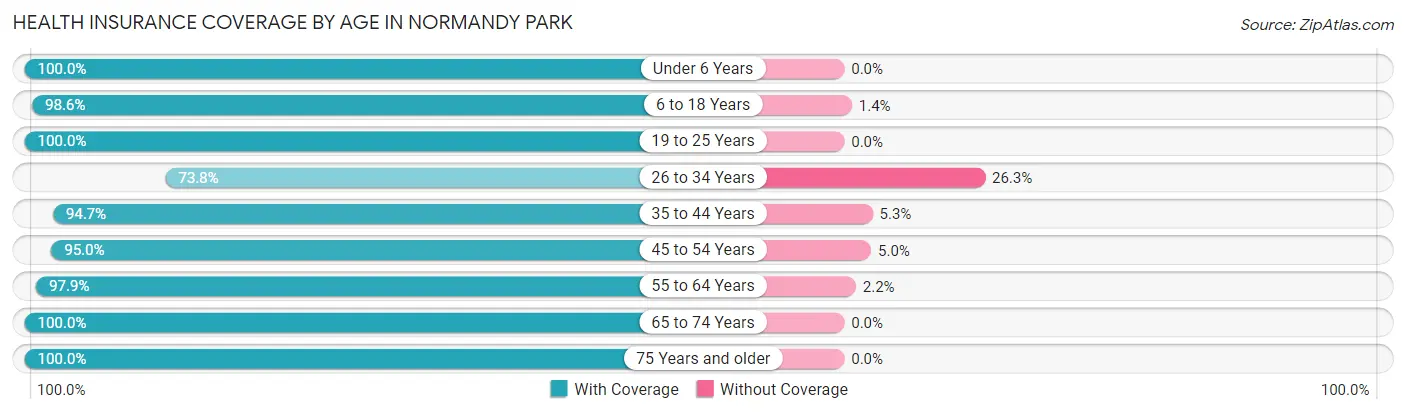
| Age Bracket | With Coverage | Without Coverage |
| Under 6 Years | 524 (100.0%) | 0 (0.0%) |
| 6 to 18 Years | 1,050 (98.6%) | 15 (1.4%) |
| 19 to 25 Years | 229 (100.0%) | 0 (0.0%) |
| 26 to 34 Years | 382 (73.8%) | 136 (26.3%) |
| 35 to 44 Years | 879 (94.7%) | 49 (5.3%) |
| 45 to 54 Years | 705 (95.0%) | 37 (5.0%) |
| 55 to 64 Years | 1,094 (97.9%) | 24 (2.1%) |
| 65 to 74 Years | 967 (100.0%) | 0 (0.0%) |
| 75 Years and older | 591 (100.0%) | 0 (0.0%) |
| Total | 6,421 (96.1%) | 261 (3.9%) |
Health Insurance Coverage by Citizenship Status in Normandy Park
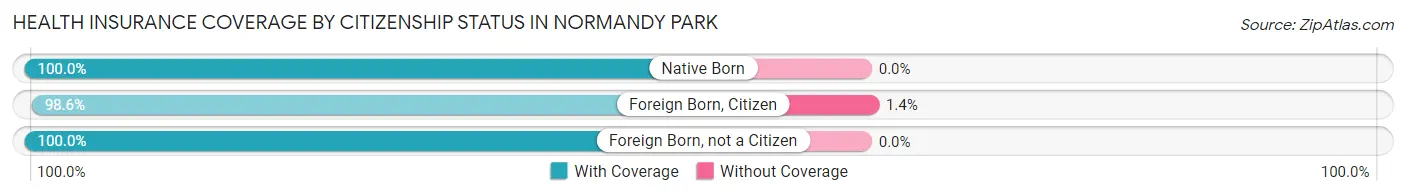
| Citizenship Status | With Coverage | Without Coverage |
| Native Born | 524 (100.0%) | 0 (0.0%) |
| Foreign Born, Citizen | 1,050 (98.6%) | 15 (1.4%) |
| Foreign Born, not a Citizen | 229 (100.0%) | 0 (0.0%) |
Health Insurance Coverage by Household Income in Normandy Park
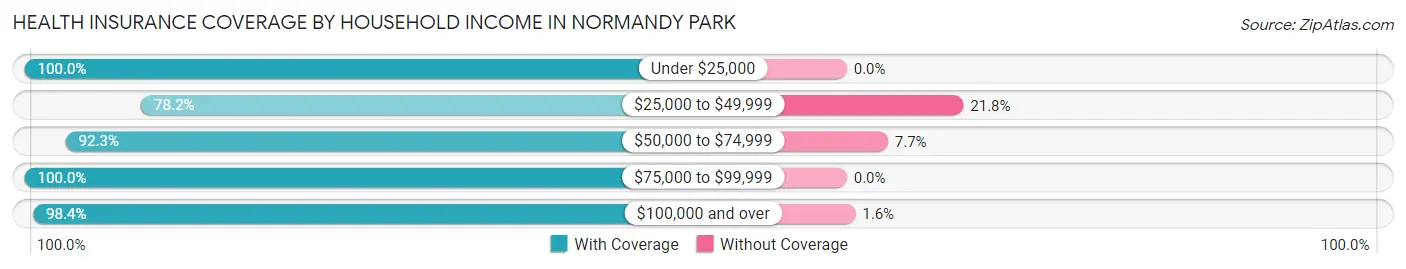
| Household Income | With Coverage | Without Coverage |
| Under $25,000 | 409 (100.0%) | 0 (0.0%) |
| $25,000 to $49,999 | 551 (78.2%) | 154 (21.8%) |
| $50,000 to $74,999 | 384 (92.3%) | 32 (7.7%) |
| $75,000 to $99,999 | 474 (100.0%) | 0 (0.0%) |
| $100,000 and over | 4,600 (98.4%) | 75 (1.6%) |
Public vs Private Health Insurance Coverage by Age in Normandy Park
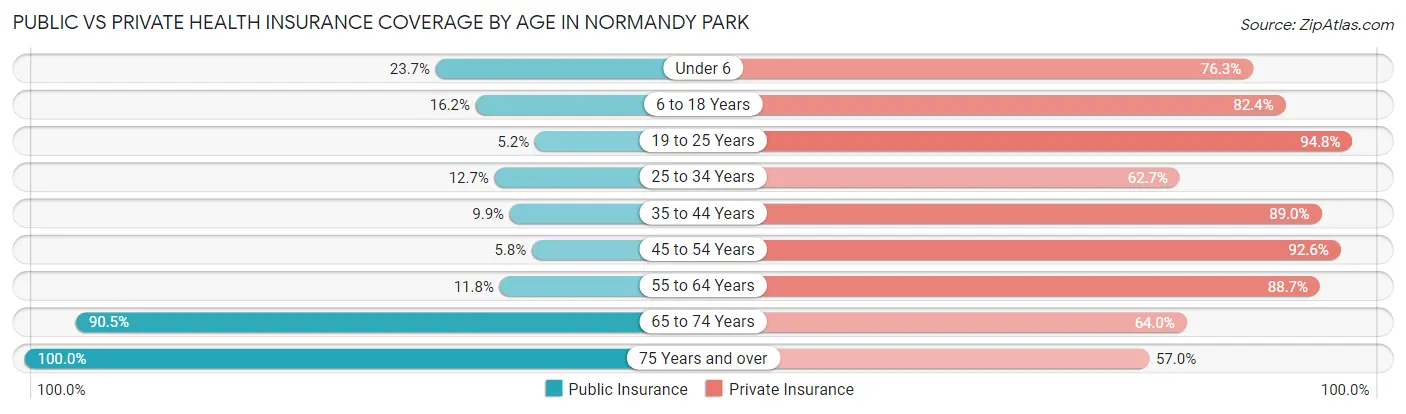
| Age Bracket | Public Insurance | Private Insurance |
| Under 6 | 124 (23.7%) | 400 (76.3%) |
| 6 to 18 Years | 173 (16.2%) | 877 (82.4%) |
| 19 to 25 Years | 12 (5.2%) | 217 (94.8%) |
| 25 to 34 Years | 66 (12.7%) | 325 (62.7%) |
| 35 to 44 Years | 92 (9.9%) | 826 (89.0%) |
| 45 to 54 Years | 43 (5.8%) | 687 (92.6%) |
| 55 to 64 Years | 132 (11.8%) | 992 (88.7%) |
| 65 to 74 Years | 875 (90.5%) | 619 (64.0%) |
| 75 Years and over | 591 (100.0%) | 337 (57.0%) |
| Total | 2,108 (31.6%) | 5,280 (79.0%) |
Disability Status by Sex by Age in Normandy Park
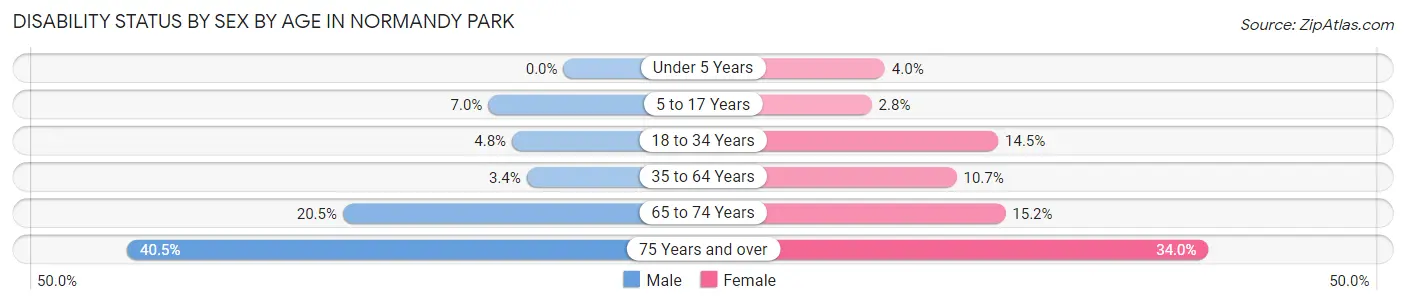
| Age Bracket | Male | Female |
| Under 5 Years | 0 (0.0%) | 7 (4.0%) |
| 5 to 17 Years | 33 (7.0%) | 14 (2.8%) |
| 18 to 34 Years | 23 (4.8%) | 55 (14.5%) |
| 35 to 64 Years | 47 (3.4%) | 150 (10.6%) |
| 65 to 74 Years | 113 (20.5%) | 63 (15.2%) |
| 75 Years and over | 119 (40.5%) | 101 (34.0%) |
Disability Class by Sex by Age in Normandy Park
Disability Class: Hearing Difficulty
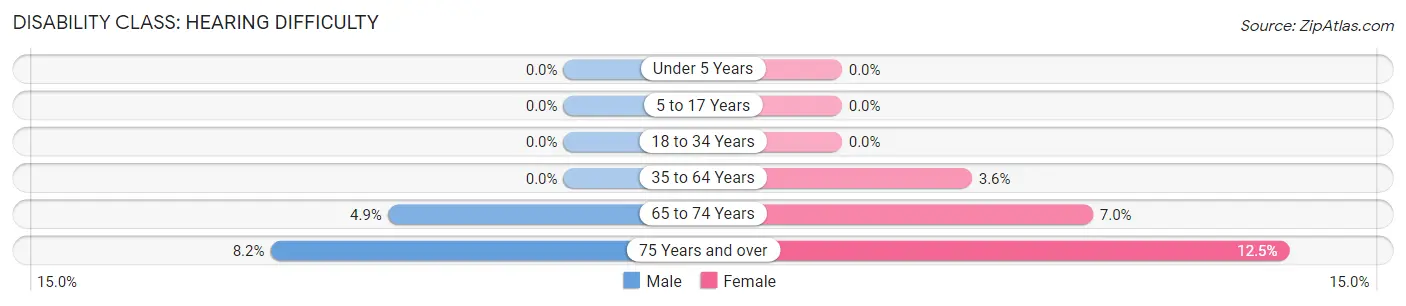
| Age Bracket | Male | Female |
| Under 5 Years | 0 (0.0%) | 0 (0.0%) |
| 5 to 17 Years | 0 (0.0%) | 0 (0.0%) |
| 18 to 34 Years | 0 (0.0%) | 0 (0.0%) |
| 35 to 64 Years | 0 (0.0%) | 51 (3.6%) |
| 65 to 74 Years | 27 (4.9%) | 29 (7.0%) |
| 75 Years and over | 24 (8.2%) | 37 (12.5%) |
Disability Class: Vision Difficulty
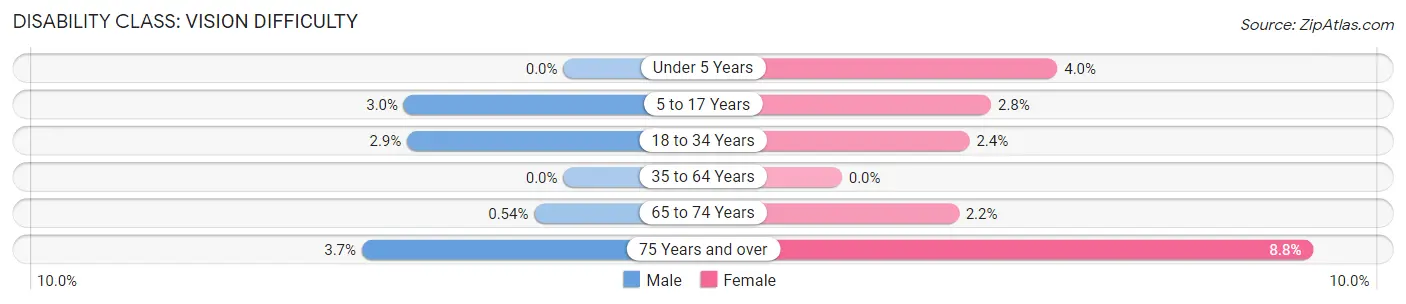
| Age Bracket | Male | Female |
| Under 5 Years | 0 (0.0%) | 7 (4.0%) |
| 5 to 17 Years | 14 (3.0%) | 14 (2.8%) |
| 18 to 34 Years | 14 (2.9%) | 9 (2.4%) |
| 35 to 64 Years | 0 (0.0%) | 0 (0.0%) |
| 65 to 74 Years | 3 (0.5%) | 9 (2.2%) |
| 75 Years and over | 11 (3.7%) | 26 (8.7%) |
Disability Class: Cognitive Difficulty
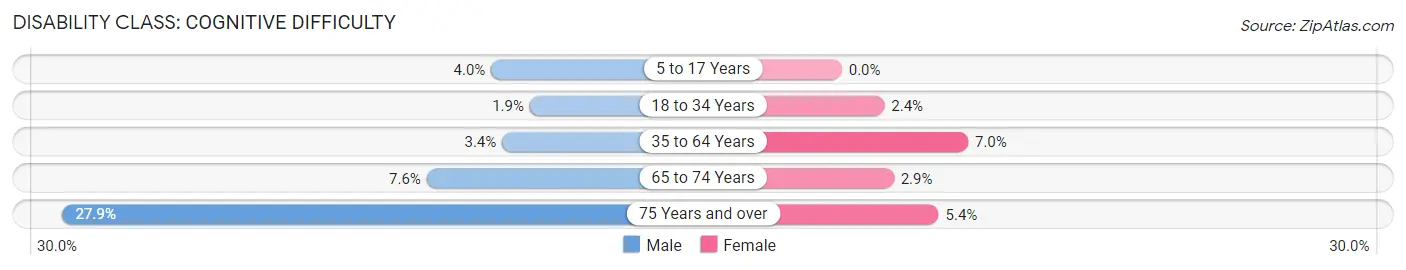
| Age Bracket | Male | Female |
| 5 to 17 Years | 19 (4.0%) | 0 (0.0%) |
| 18 to 34 Years | 9 (1.9%) | 9 (2.4%) |
| 35 to 64 Years | 47 (3.4%) | 99 (7.0%) |
| 65 to 74 Years | 42 (7.6%) | 12 (2.9%) |
| 75 Years and over | 82 (27.9%) | 16 (5.4%) |
Disability Class: Ambulatory Difficulty
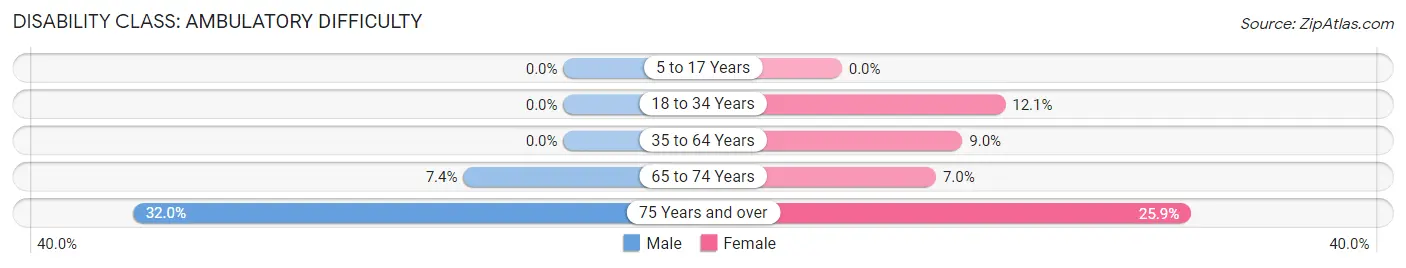
| Age Bracket | Male | Female |
| 5 to 17 Years | 0 (0.0%) | 0 (0.0%) |
| 18 to 34 Years | 0 (0.0%) | 46 (12.1%) |
| 35 to 64 Years | 0 (0.0%) | 126 (8.9%) |
| 65 to 74 Years | 41 (7.4%) | 29 (7.0%) |
| 75 Years and over | 94 (32.0%) | 77 (25.9%) |
Disability Class: Self-Care Difficulty
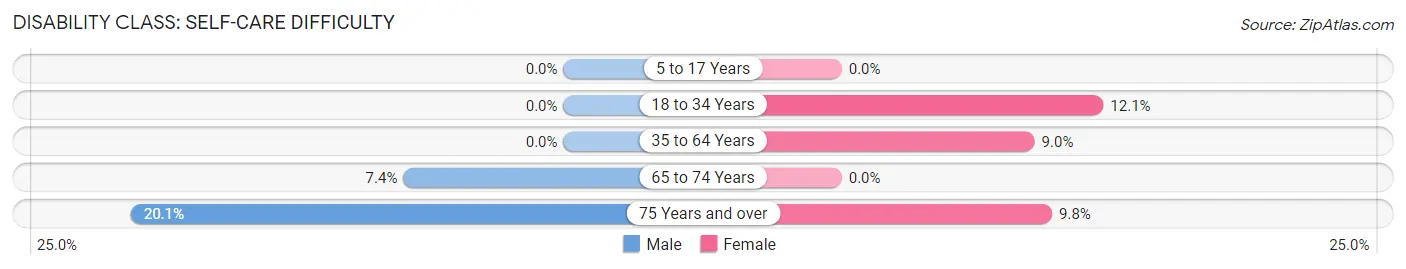
| Age Bracket | Male | Female |
| 5 to 17 Years | 0 (0.0%) | 0 (0.0%) |
| 18 to 34 Years | 0 (0.0%) | 46 (12.1%) |
| 35 to 64 Years | 0 (0.0%) | 126 (8.9%) |
| 65 to 74 Years | 41 (7.4%) | 0 (0.0%) |
| 75 Years and over | 59 (20.1%) | 29 (9.8%) |
Technology Access in Normandy Park
Computing Device Access in Normandy Park
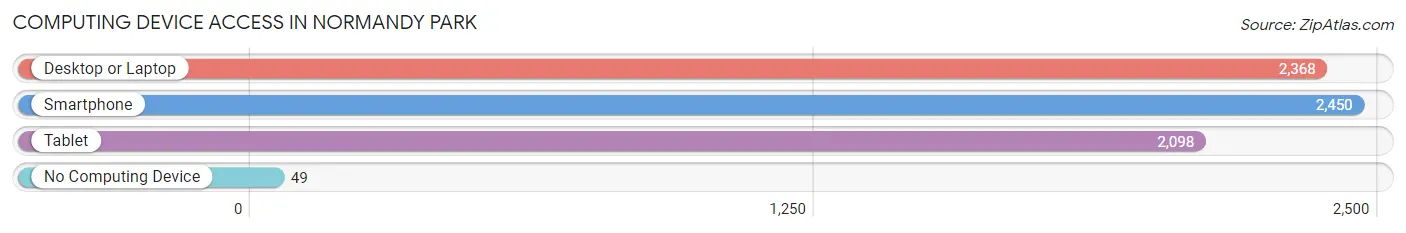
| Device Type | # Households | % Households |
| Desktop or Laptop | 2,368 | 92.2% |
| Smartphone | 2,450 | 95.4% |
| Tablet | 2,098 | 81.7% |
| No Computing Device | 49 | 1.9% |
| Total | 2,568 | 100.0% |
Internet Access in Normandy Park
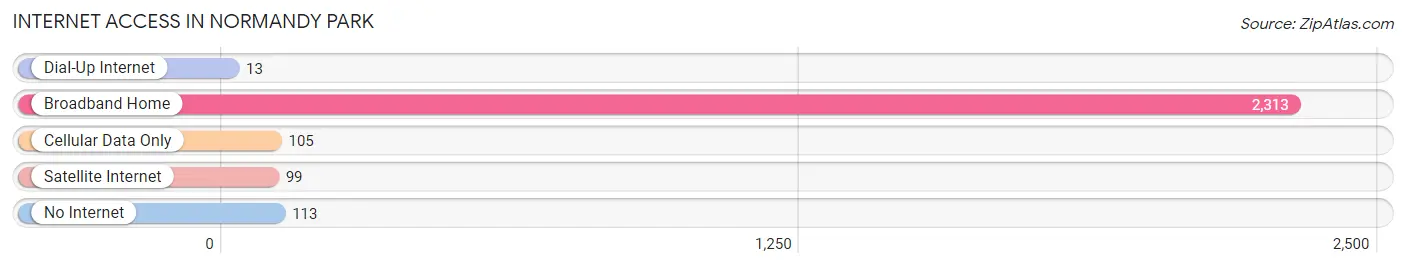
| Internet Type | # Households | % Households |
| Dial-Up Internet | 13 | 0.5% |
| Broadband Home | 2,313 | 90.1% |
| Cellular Data Only | 105 | 4.1% |
| Satellite Internet | 99 | 3.9% |
| No Internet | 113 | 4.4% |
| Total | 2,568 | 100.0% |
Normandy Park Summary
Normandy Park is a city located in King County, Washington, United States. It is located in the Seattle metropolitan area, and is bordered by Des Moines to the north, Burien to the east, and Federal Way to the south. The population was 6,335 at the 2010 census.
History
The area now known as Normandy Park was originally inhabited by the Duwamish people. The first European settlers arrived in the area in the late 1800s, and the area was officially incorporated as a city in 1953. The city was named after the Normandy region of France, in honor of the Allied forces who fought in World War II.
Geography
Normandy Park is located at 47°25'25" North, 122°19'45" West (47.423, -122.329). According to the United States Census Bureau, the city has a total area of 2.3 square miles, all of it land.
Economy
Normandy Park is primarily a residential community, with most of its residents employed in the nearby cities of Seattle and Tacoma. The city does have a few businesses, including a grocery store, a few restaurants, and a few retail stores.
Demographics
As of the 2010 census, there were 6,335 people, 2,541 households, and 1,717 families residing in the city. The population density was 2,741.7 people per square mile. The racial makeup of the city was 79.2% White, 8.2% Asian, 6.2% African American, 0.7% Native American, 0.2% Pacific Islander, 2.3% from other races, and 3.2% from two or more races. Hispanic or Latino of any race were 6.2% of the population.
The median income for a household in the city was $68,958, and the median income for a family was $77,917. The per capita income for the city was $32,945. About 4.2% of families and 5.7% of the population were below the poverty line, including 6.3% of those under age 18 and 4.2% of those age 65 or over.
Conclusion
Normandy Park is a small city located in King County, Washington. It is located in the Seattle metropolitan area, and is bordered by Des Moines to the north, Burien to the east, and Federal Way to the south. The city was named after the Normandy region of France, in honor of the Allied forces who fought in World War II. Normandy Park is primarily a residential community, with most of its residents employed in the nearby cities of Seattle and Tacoma. The population of the city was 6,335 at the 2010 census, with a median household income of $68,958 and a median family income of $77,917.
Common Questions
What is Per Capita Income in Normandy Park?
Per Capita income in Normandy Park is $63,421.
What is the Median Family Income in Normandy Park?
Median Family Income in Normandy Park is $145,096.
What is the Median Household income in Normandy Park?
Median Household Income in Normandy Park is $122,467.
What is Income or Wage Gap in Normandy Park?
Income or Wage Gap in Normandy Park is 54.3%.
Women in Normandy Park earn 45.7 cents for every dollar earned by a man.
What is Inequality or Gini Index in Normandy Park?
Inequality or Gini Index in Normandy Park is 0.44.
What is the Total Population of Normandy Park?
Total Population of Normandy Park is 6,697.
What is the Total Male Population of Normandy Park?
Total Male Population of Normandy Park is 3,512.
What is the Total Female Population of Normandy Park?
Total Female Population of Normandy Park is 3,185.
What is the Ratio of Males per 100 Females in Normandy Park?
There are 110.27 Males per 100 Females in Normandy Park.
What is the Ratio of Females per 100 Males in Normandy Park?
There are 90.69 Females per 100 Males in Normandy Park.
What is the Median Population Age in Normandy Park?
Median Population Age in Normandy Park is 45.8 Years.
What is the Average Family Size in Normandy Park
Average Family Size in Normandy Park is 3.0 People.
What is the Average Household Size in Normandy Park
Average Household Size in Normandy Park is 2.6 People.
How Large is the Labor Force in Normandy Park?
There are 3,291 People in the Labor Forcein in Normandy Park.
What is the Percentage of People in the Labor Force in Normandy Park?
61.2% of People are in the Labor Force in Normandy Park.
What is the Unemployment Rate in Normandy Park?
Unemployment Rate in Normandy Park is 3.8%.