Zip Codes with the Highest Percentage of Population Employed in Architecture & Engineering in Kirkland, WA
RELATED REPORTS & OPTIONS
Architecture & Engineering
Kirkland
Compare Zip Codes
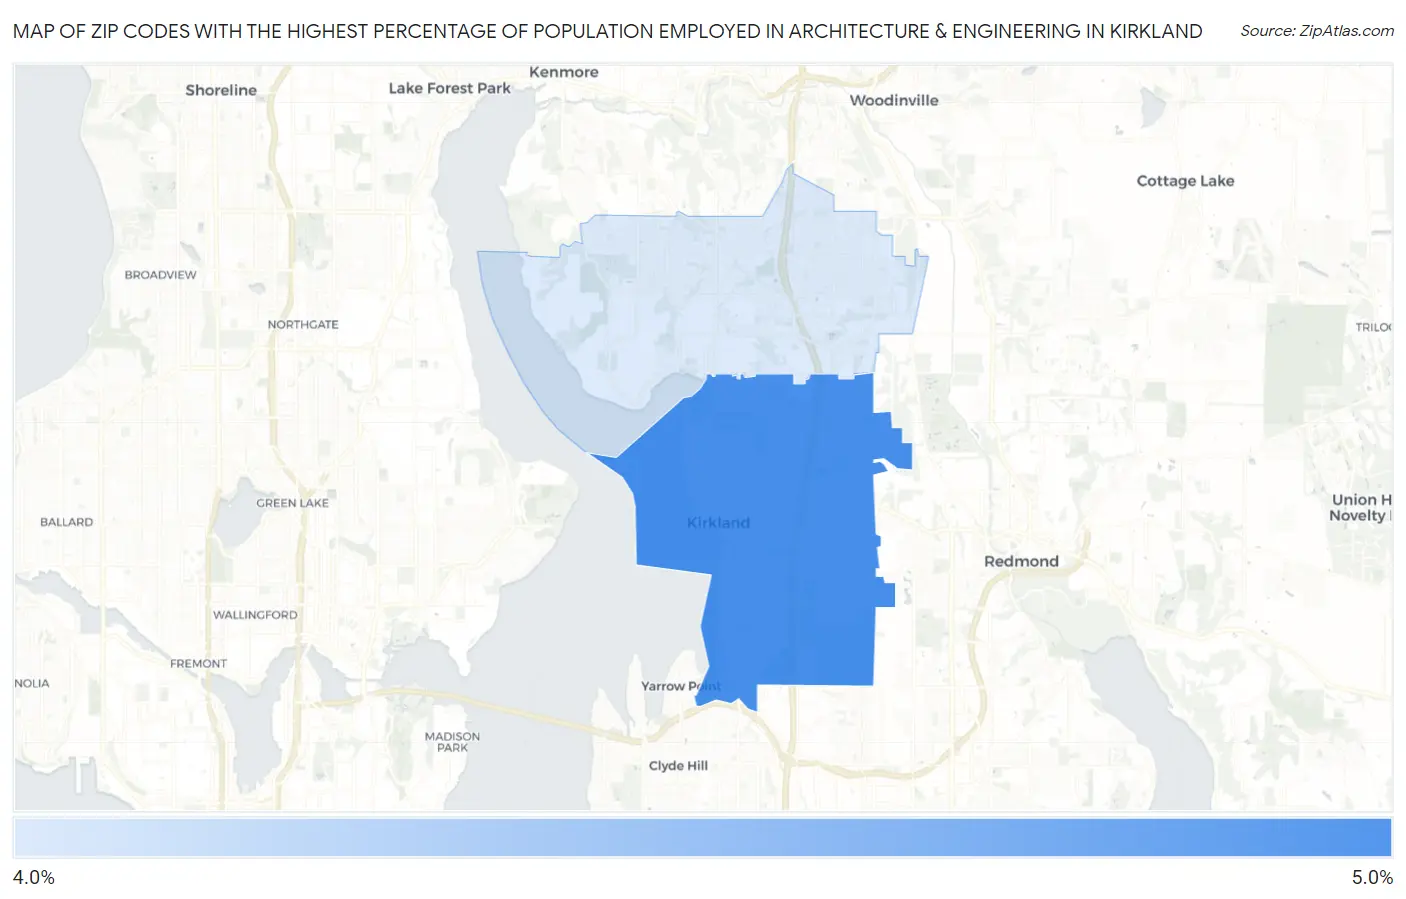
Map of Zip Codes with the Highest Percentage of Population Employed in Architecture & Engineering in Kirkland
4.3%
4.8%
Zip Codes with the Highest Percentage of Population Employed in Architecture & Engineering in Kirkland, WA
| Zip Code | % Employed | vs State | vs National | |
| 1. | 98033 | 4.8% | 2.8%(+2.01)#51 | 2.1%(+2.65)#1,836 |
| 2. | 98034 | 4.3% | 2.8%(+1.49)#65 | 2.1%(+2.14)#2,384 |
1
Common Questions
What are the Top Zip Codes with the Highest Percentage of Population Employed in Architecture & Engineering in Kirkland, WA?
Top Zip Codes with the Highest Percentage of Population Employed in Architecture & Engineering in Kirkland, WA are:
What zip code has the Highest Percentage of Population Employed in Architecture & Engineering in Kirkland, WA?
98033 has the Highest Percentage of Population Employed in Architecture & Engineering in Kirkland, WA with 4.8%.
What is the Percentage of Population Employed in Architecture & Engineering in Kirkland, WA?
Percentage of Population Employed in Architecture & Engineering in Kirkland is 4.6%.
What is the Percentage of Population Employed in Architecture & Engineering in Washington?
Percentage of Population Employed in Architecture & Engineering in Washington is 2.8%.
What is the Percentage of Population Employed in Architecture & Engineering in the United States?
Percentage of Population Employed in Architecture & Engineering in the United States is 2.1%.