Dash Point, WA Map & Demographics
Dash Point Map
Dash Point Overview
$76,851
PER CAPITA INCOME
$176,957
AVG FAMILY INCOME
$134,896
AVG HOUSEHOLD INCOME
30.8%
WAGE / INCOME GAP [ % ]
69.2¢/ $1
WAGE / INCOME GAP [ $ ]
0.43
INEQUALITY / GINI INDEX
923
TOTAL POPULATION
433
MALE POPULATION
490
FEMALE POPULATION
88.37
MALES / 100 FEMALES
113.16
FEMALES / 100 MALES
56.3
MEDIAN AGE
2.9
AVG FAMILY SIZE
2.3
AVG HOUSEHOLD SIZE
442
LABOR FORCE [ PEOPLE ]
54.8%
PERCENT IN LABOR FORCE
4.3%
UNEMPLOYMENT RATE
Income in Dash Point
Income Overview in Dash Point
Per Capita Income in Dash Point is $76,851, while median incomes of families and households are $176,957 and $134,896 respectively.
| Characteristic | Number | Measure |
| Per Capita Income | 923 | $76,851 |
| Median Family Income | 252 | $176,957 |
| Mean Family Income | 252 | $205,273 |
| Median Household Income | 395 | $134,896 |
| Mean Household Income | 395 | $172,977 |
| Income Deficit | 252 | $0 |
| Wage / Income Gap (%) | 923 | 30.77% |
| Wage / Income Gap ($) | 923 | 69.23¢ per $1 |
| Gini / Inequality Index | 923 | 0.43 |
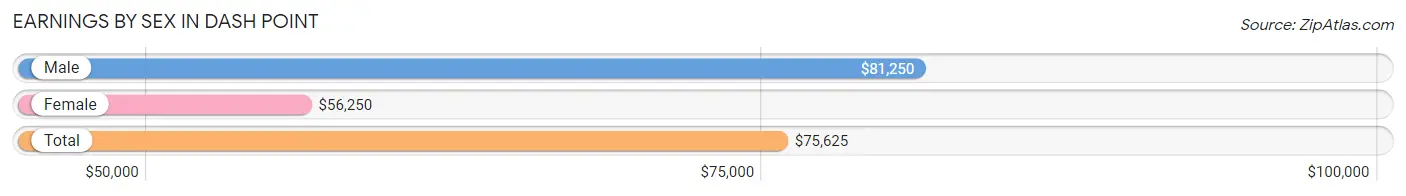
Earnings by Sex in Dash Point
Average Earnings in Dash Point are $75,625, $81,250 for men and $56,250 for women, a difference of 30.8%.
| Sex | Number | Average Earnings |
| Male | 245 (52.9%) | $81,250 |
| Female | 218 (47.1%) | $56,250 |
| Total | 463 (100.0%) | $75,625 |
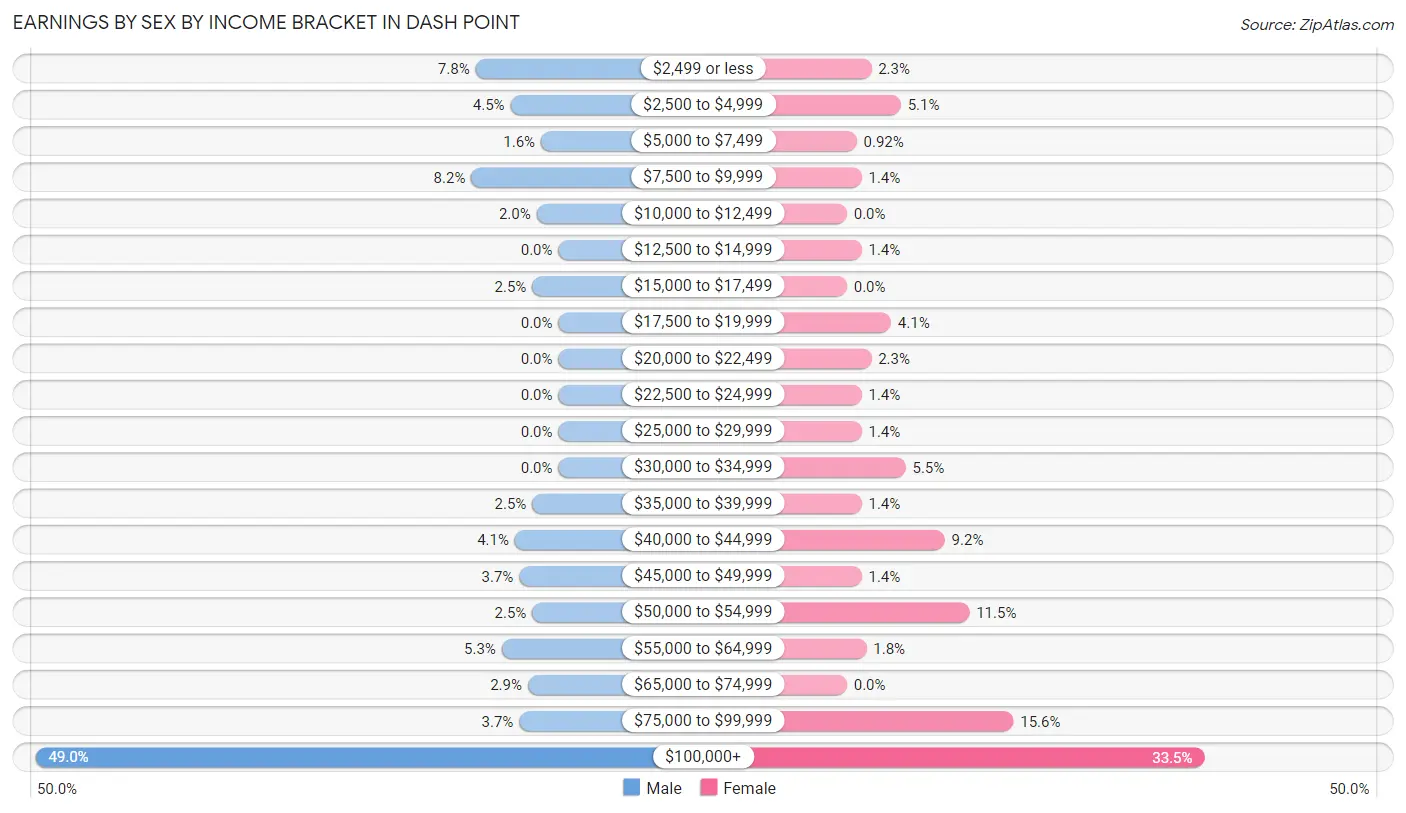
Earnings by Sex by Income Bracket in Dash Point
The most common earnings brackets in Dash Point are $100,000+ for men (120 | 49.0%) and $100,000+ for women (73 | 33.5%).
| Income | Male | Female |
| $2,499 or less | 19 (7.8%) | 5 (2.3%) |
| $2,500 to $4,999 | 11 (4.5%) | 11 (5.1%) |
| $5,000 to $7,499 | 4 (1.6%) | 2 (0.9%) |
| $7,500 to $9,999 | 20 (8.2%) | 3 (1.4%) |
| $10,000 to $12,499 | 5 (2.0%) | 0 (0.0%) |
| $12,500 to $14,999 | 0 (0.0%) | 3 (1.4%) |
| $15,000 to $17,499 | 6 (2.5%) | 0 (0.0%) |
| $17,500 to $19,999 | 0 (0.0%) | 9 (4.1%) |
| $20,000 to $22,499 | 0 (0.0%) | 5 (2.3%) |
| $22,500 to $24,999 | 0 (0.0%) | 3 (1.4%) |
| $25,000 to $29,999 | 0 (0.0%) | 3 (1.4%) |
| $30,000 to $34,999 | 0 (0.0%) | 12 (5.5%) |
| $35,000 to $39,999 | 6 (2.5%) | 3 (1.4%) |
| $40,000 to $44,999 | 10 (4.1%) | 20 (9.2%) |
| $45,000 to $49,999 | 9 (3.7%) | 3 (1.4%) |
| $50,000 to $54,999 | 6 (2.5%) | 25 (11.5%) |
| $55,000 to $64,999 | 13 (5.3%) | 4 (1.8%) |
| $65,000 to $74,999 | 7 (2.9%) | 0 (0.0%) |
| $75,000 to $99,999 | 9 (3.7%) | 34 (15.6%) |
| $100,000+ | 120 (49.0%) | 73 (33.5%) |
| Total | 245 (100.0%) | 218 (100.0%) |
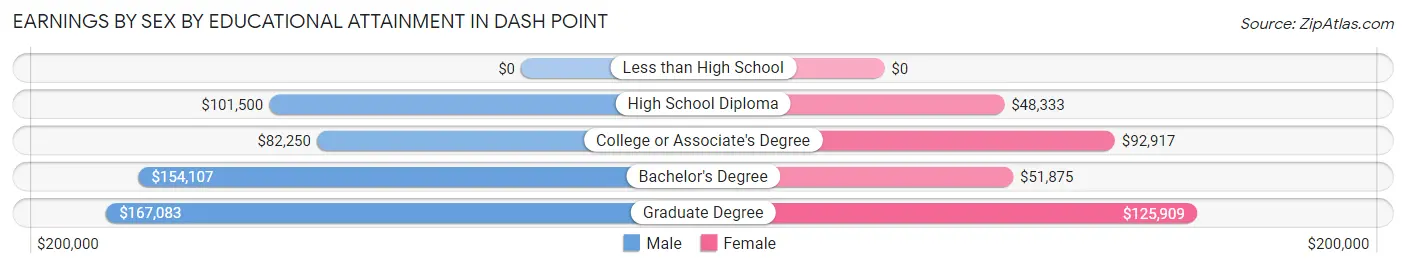
Earnings by Sex by Educational Attainment in Dash Point
Average earnings in Dash Point are $116,875 for men and $76,250 for women, a difference of 34.8%. Men with an educational attainment of graduate degree enjoy the highest average annual earnings of $167,083, while those with college or associate's degree education earn the least with $82,250. Women with an educational attainment of graduate degree earn the most with the average annual earnings of $125,909, while those with high school diploma education have the smallest earnings of $48,333.
| Educational Attainment | Male Income | Female Income |
| Less than High School | - | - |
| High School Diploma | $101,500 | $48,333 |
| College or Associate's Degree | $82,250 | $92,917 |
| Bachelor's Degree | $154,107 | $51,875 |
| Graduate Degree | $167,083 | $125,909 |
| Total | $116,875 | $76,250 |
Family Income in Dash Point
Family Income Brackets in Dash Point
According to the Dash Point family income data, there are 78 families falling into the $150,000 to $199,999 income range, which is the most common income bracket and makes up 30.9% of all families.
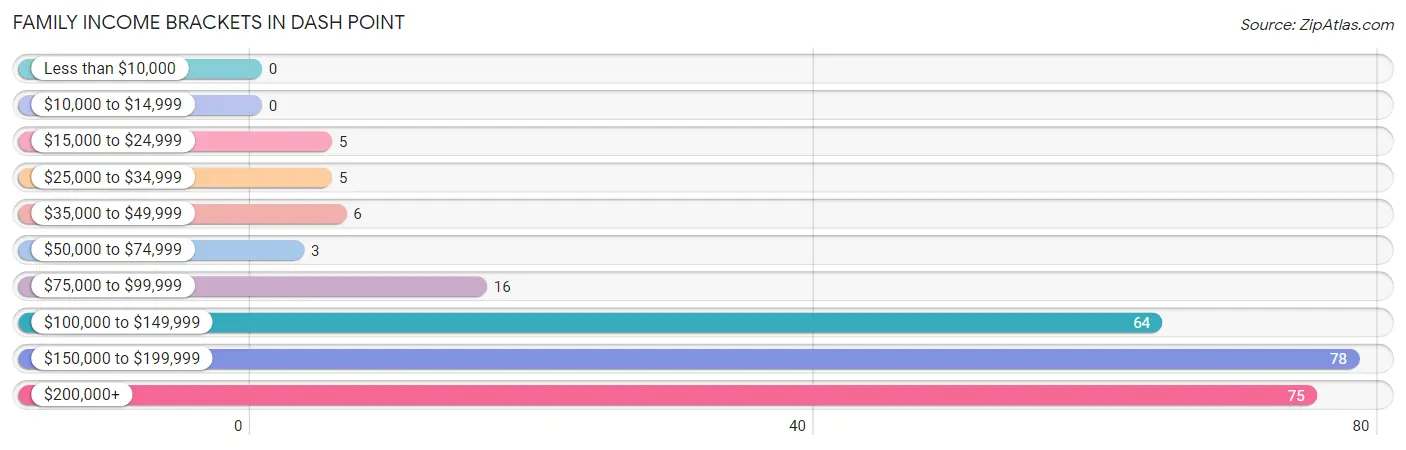
| Income Bracket | # Families | % Families |
| Less than $10,000 | 0 | 0.0% |
| $10,000 to $14,999 | 0 | 0.0% |
| $15,000 to $24,999 | 5 | 2.0% |
| $25,000 to $34,999 | 5 | 2.0% |
| $35,000 to $49,999 | 6 | 2.4% |
| $50,000 to $74,999 | 3 | 1.2% |
| $75,000 to $99,999 | 16 | 6.3% |
| $100,000 to $149,999 | 64 | 25.4% |
| $150,000 to $199,999 | 78 | 31.0% |
| $200,000+ | 75 | 29.8% |
Family Income by Famaliy Size in Dash Point
4-person families (38 | 15.1%) account for the highest median family income in Dash Point with $250,001 per family, while 2-person families (140 | 55.6%) have the highest median income of $92,014 per family member.
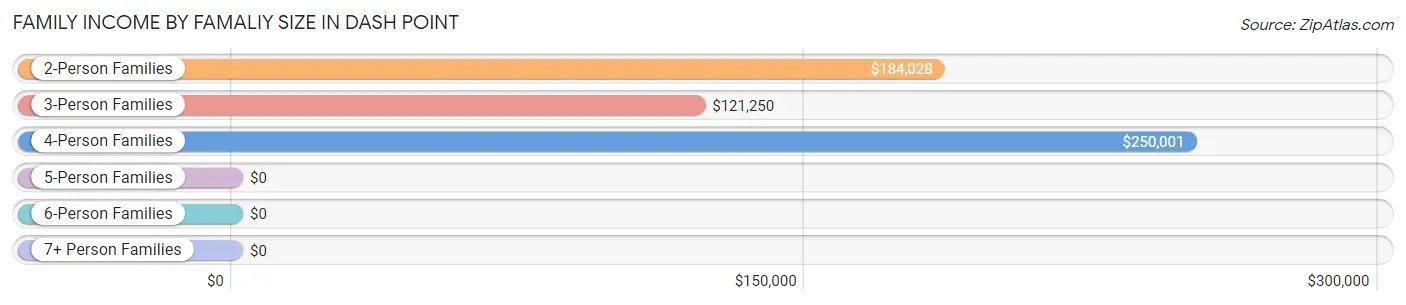
| Income Bracket | # Families | Median Income |
| 2-Person Families | 140 (55.6%) | $184,028 |
| 3-Person Families | 50 (19.8%) | $121,250 |
| 4-Person Families | 38 (15.1%) | $250,001 |
| 5-Person Families | 15 (5.9%) | $0 |
| 6-Person Families | 6 (2.4%) | $0 |
| 7+ Person Families | 3 (1.2%) | $0 |
| Total | 252 (100.0%) | $176,957 |
Family Income by Number of Earners in Dash Point
The median family income in Dash Point is $176,957, with families comprising 3+ earners (26) having the highest median family income of $204,167, while families with 1 earner (97) have the lowest median family income of $102,434, accounting for 10.3% and 38.5% of families, respectively.
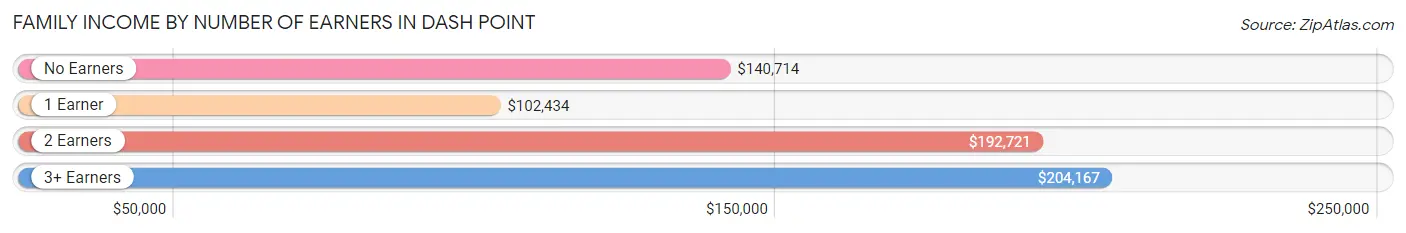
| Number of Earners | # Families | Median Income |
| No Earners | 40 (15.9%) | $140,714 |
| 1 Earner | 97 (38.5%) | $102,434 |
| 2 Earners | 89 (35.3%) | $192,721 |
| 3+ Earners | 26 (10.3%) | $204,167 |
| Total | 252 (100.0%) | $176,957 |
Household Income in Dash Point
Household Income Brackets in Dash Point
With 102 households falling in the category, the $100,000 to $149,999 income range is the most frequent in Dash Point, accounting for 25.8% of all households.
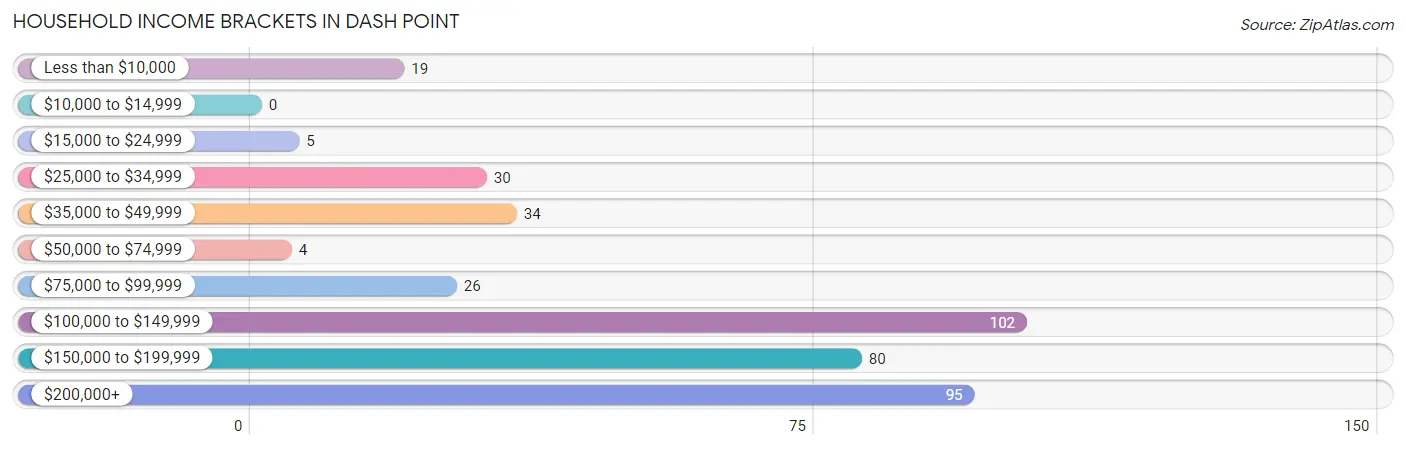
| Income Bracket | # Households | % Households |
| Less than $10,000 | 19 | 4.8% |
| $10,000 to $14,999 | 0 | 0.0% |
| $15,000 to $24,999 | 5 | 1.3% |
| $25,000 to $34,999 | 30 | 7.6% |
| $35,000 to $49,999 | 34 | 8.6% |
| $50,000 to $74,999 | 4 | 1.0% |
| $75,000 to $99,999 | 26 | 6.6% |
| $100,000 to $149,999 | 102 | 25.8% |
| $150,000 to $199,999 | 80 | 20.3% |
| $200,000+ | 95 | 24.1% |
Household Income by Householder Age in Dash Point
The median household income in Dash Point is $134,896, with the highest median household income of $193,571 found in the 25 to 44 years age bracket for the primary householder. A total of 56 households (14.2%) fall into this category.
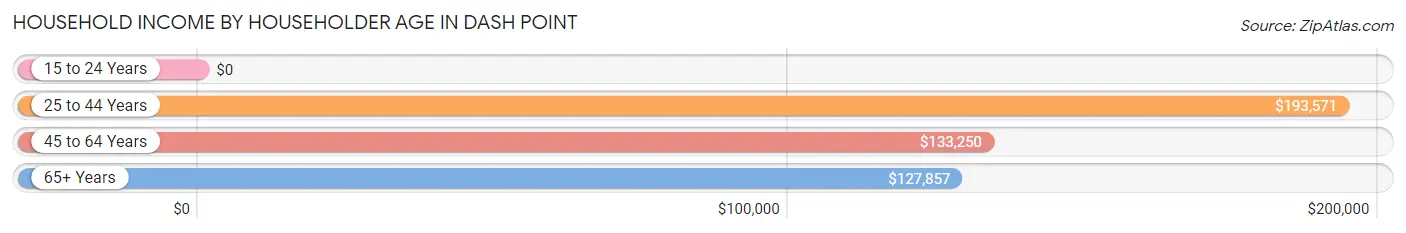
| Income Bracket | # Households | Median Income |
| 15 to 24 Years | 0 (0.0%) | $0 |
| 25 to 44 Years | 56 (14.2%) | $193,571 |
| 45 to 64 Years | 165 (41.8%) | $133,250 |
| 65+ Years | 174 (44.1%) | $127,857 |
| Total | 395 (100.0%) | $134,896 |
Poverty in Dash Point
Income Below Poverty by Sex and Age in Dash Point
With 2.1% poverty level for males and 4.9% for females among the residents of Dash Point, 35 to 44 year old males and 65 to 74 year old females are the most vulnerable to poverty, with 4 males (6.8%) and 12 females (13.3%) in their respective age groups living below the poverty level.
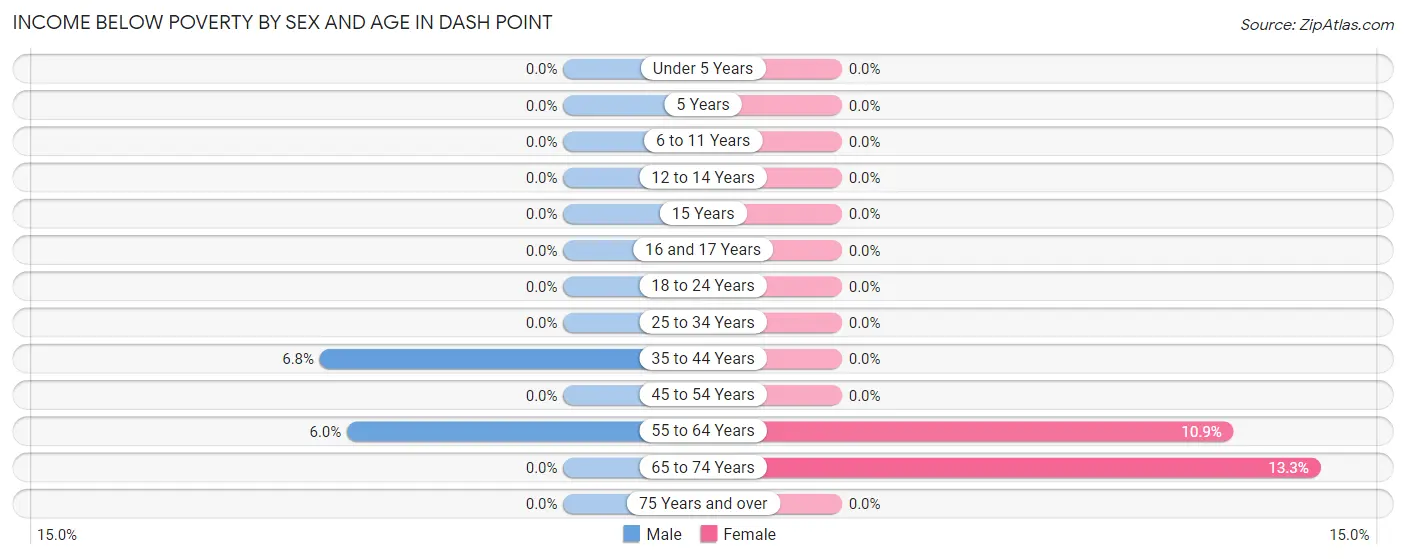
| Age Bracket | Male | Female |
| Under 5 Years | 0 (0.0%) | 0 (0.0%) |
| 5 Years | 0 (0.0%) | 0 (0.0%) |
| 6 to 11 Years | 0 (0.0%) | 0 (0.0%) |
| 12 to 14 Years | 0 (0.0%) | 0 (0.0%) |
| 15 Years | 0 (0.0%) | 0 (0.0%) |
| 16 and 17 Years | 0 (0.0%) | 0 (0.0%) |
| 18 to 24 Years | 0 (0.0%) | 0 (0.0%) |
| 25 to 34 Years | 0 (0.0%) | 0 (0.0%) |
| 35 to 44 Years | 4 (6.8%) | 0 (0.0%) |
| 45 to 54 Years | 0 (0.0%) | 0 (0.0%) |
| 55 to 64 Years | 5 (6.0%) | 12 (10.9%) |
| 65 to 74 Years | 0 (0.0%) | 12 (13.3%) |
| 75 Years and over | 0 (0.0%) | 0 (0.0%) |
| Total | 9 (2.1%) | 24 (4.9%) |
Income Above Poverty by Sex and Age in Dash Point
According to the poverty statistics in Dash Point, males aged under 5 years and females aged under 5 years are the age groups that are most secure financially, with 100.0% of males and 100.0% of females in these age groups living above the poverty line.
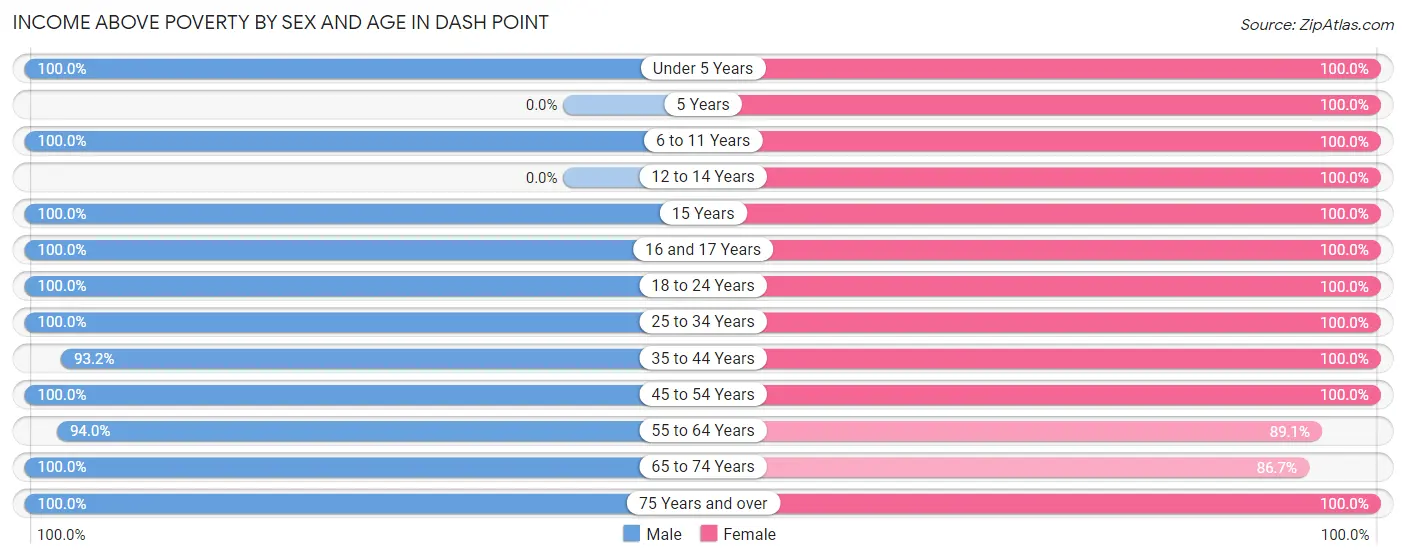
| Age Bracket | Male | Female |
| Under 5 Years | 21 (100.0%) | 18 (100.0%) |
| 5 Years | 0 (0.0%) | 6 (100.0%) |
| 6 to 11 Years | 22 (100.0%) | 19 (100.0%) |
| 12 to 14 Years | 0 (0.0%) | 16 (100.0%) |
| 15 Years | 3 (100.0%) | 11 (100.0%) |
| 16 and 17 Years | 13 (100.0%) | 4 (100.0%) |
| 18 to 24 Years | 37 (100.0%) | 26 (100.0%) |
| 25 to 34 Years | 16 (100.0%) | 33 (100.0%) |
| 35 to 44 Years | 55 (93.2%) | 55 (100.0%) |
| 45 to 54 Years | 61 (100.0%) | 29 (100.0%) |
| 55 to 64 Years | 78 (94.0%) | 98 (89.1%) |
| 65 to 74 Years | 76 (100.0%) | 78 (86.7%) |
| 75 Years and over | 42 (100.0%) | 73 (100.0%) |
| Total | 424 (97.9%) | 466 (95.1%) |
Income Below Poverty Among Married-Couple Families in Dash Point
The poverty statistics for married-couple families in Dash Point show that 2.1% or 5 of the total 239 families live below the poverty line. Families with no children have the highest poverty rate of 3.0%, comprising of 5 families. On the other hand, families with 1 or 2 children have the lowest poverty rate of 0.0%, which includes 0 families.
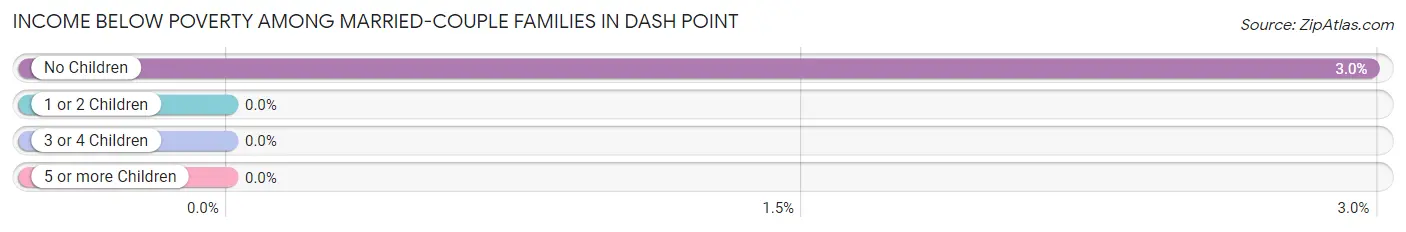
| Children | Above Poverty | Below Poverty |
| No Children | 163 (97.0%) | 5 (3.0%) |
| 1 or 2 Children | 65 (100.0%) | 0 (0.0%) |
| 3 or 4 Children | 6 (100.0%) | 0 (0.0%) |
| 5 or more Children | 0 (0.0%) | 0 (0.0%) |
| Total | 234 (97.9%) | 5 (2.1%) |
Income Below Poverty Among Single-Parent Households in Dash Point
| Children | Single Father | Single Mother |
| No Children | 0 (0.0%) | 0 (0.0%) |
| 1 or 2 Children | 0 (0.0%) | 0 (0.0%) |
| 3 or 4 Children | 0 (0.0%) | 0 (0.0%) |
| 5 or more Children | 0 (0.0%) | 0 (0.0%) |
| Total | 0 (0.0%) | 0 (0.0%) |
Income Below Poverty Among Married-Couple vs Single-Parent Households in Dash Point
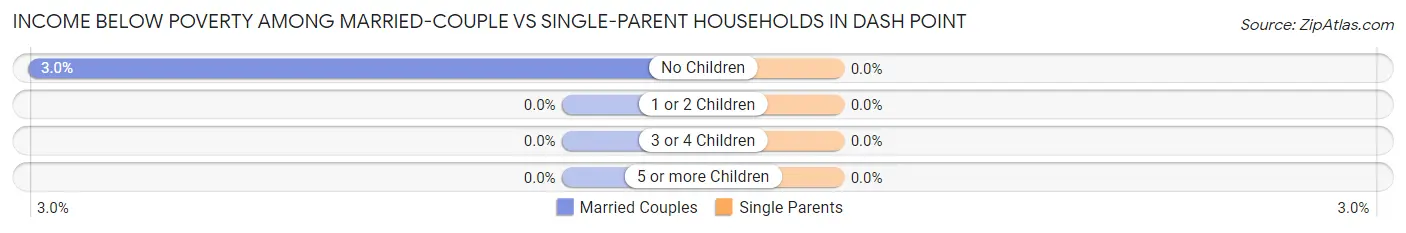
| Children | Married-Couple Families | Single-Parent Households |
| No Children | 5 (3.0%) | 0 (0.0%) |
| 1 or 2 Children | 0 (0.0%) | 0 (0.0%) |
| 3 or 4 Children | 0 (0.0%) | 0 (0.0%) |
| 5 or more Children | 0 (0.0%) | 0 (0.0%) |
| Total | 5 (2.1%) | 0 (0.0%) |
Race in Dash Point
The most populous races in Dash Point are White / Caucasian (750 | 81.3%), Two or more Races (88 | 9.5%), and Asian (34 | 3.7%).
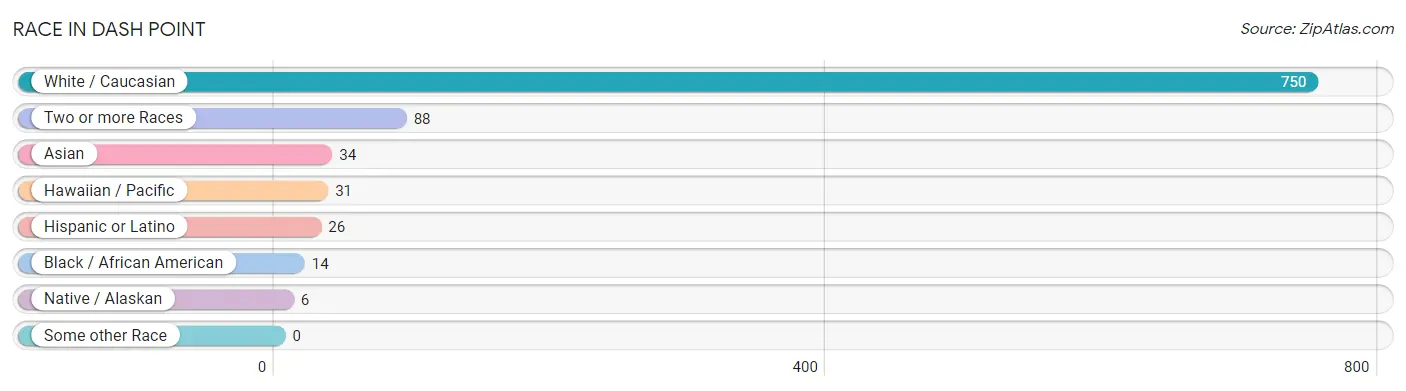
| Race | # Population | % Population |
| Asian | 34 | 3.7% |
| Black / African American | 14 | 1.5% |
| Hawaiian / Pacific | 31 | 3.4% |
| Hispanic or Latino | 26 | 2.8% |
| Native / Alaskan | 6 | 0.6% |
| White / Caucasian | 750 | 81.3% |
| Two or more Races | 88 | 9.5% |
| Some other Race | 0 | 0.0% |
| Total | 923 | 100.0% |
Ancestry in Dash Point
The most populous ancestries reported in Dash Point are English (245 | 26.5%), German (196 | 21.2%), Irish (168 | 18.2%), Norwegian (96 | 10.4%), and European (57 | 6.2%), together accounting for 82.6% of all Dash Point residents.
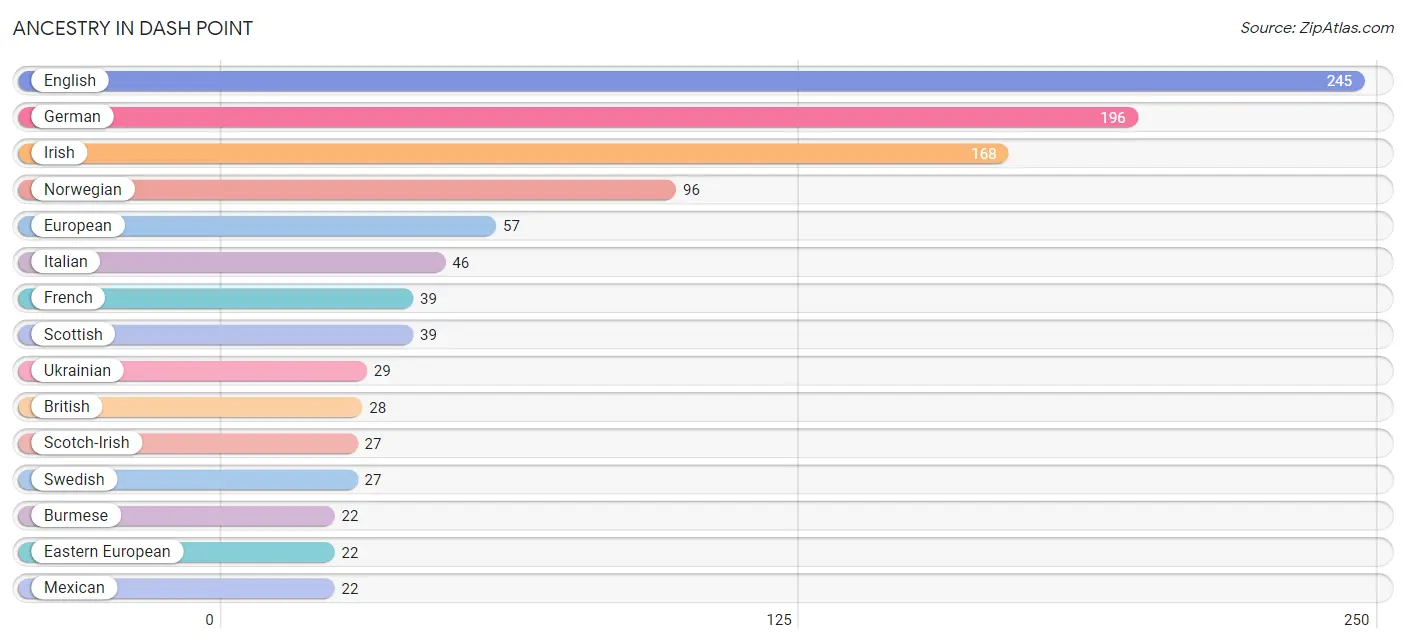
| Ancestry | # Population | % Population |
| American | 12 | 1.3% |
| British | 28 | 3.0% |
| Burmese | 22 | 2.4% |
| Canadian | 6 | 0.6% |
| Chippewa | 6 | 0.6% |
| Czech | 6 | 0.6% |
| Danish | 6 | 0.6% |
| Eastern European | 22 | 2.4% |
| English | 245 | 26.5% |
| European | 57 | 6.2% |
| French | 39 | 4.2% |
| French Canadian | 19 | 2.1% |
| German | 196 | 21.2% |
| Guamanian / Chamorro | 14 | 1.5% |
| Irish | 168 | 18.2% |
| Italian | 46 | 5.0% |
| Japanese | 13 | 1.4% |
| Korean | 12 | 1.3% |
| Mexican | 22 | 2.4% |
| Norwegian | 96 | 10.4% |
| Polish | 16 | 1.7% |
| Russian | 15 | 1.6% |
| Scandinavian | 5 | 0.5% |
| Scotch-Irish | 27 | 2.9% |
| Scottish | 39 | 4.2% |
| Spanish | 4 | 0.4% |
| Sri Lankan | 6 | 0.6% |
| Swedish | 27 | 2.9% |
| Swiss | 3 | 0.3% |
| Thai | 4 | 0.4% |
| Ukrainian | 29 | 3.1% |
| Welsh | 6 | 0.6% | View All 32 Rows |
Immigrants in Dash Point
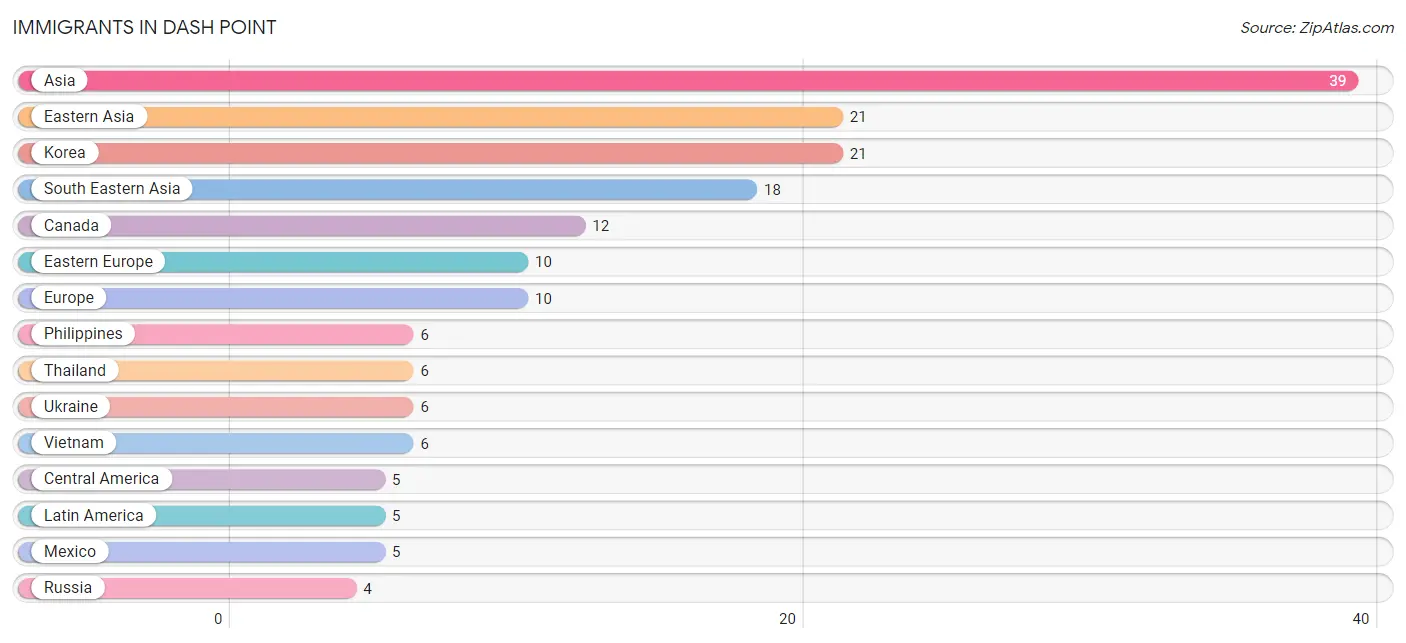
The most numerous immigrant groups reported in Dash Point came from Asia (39 | 4.2%), Eastern Asia (21 | 2.3%), Korea (21 | 2.3%), South Eastern Asia (18 | 1.9%), and Canada (12 | 1.3%), together accounting for 12.0% of all Dash Point residents.
| Immigration Origin | # Population | % Population |
| Asia | 39 | 4.2% |
| Canada | 12 | 1.3% |
| Central America | 5 | 0.5% |
| Eastern Asia | 21 | 2.3% |
| Eastern Europe | 10 | 1.1% |
| Europe | 10 | 1.1% |
| Korea | 21 | 2.3% |
| Latin America | 5 | 0.5% |
| Mexico | 5 | 0.5% |
| Philippines | 6 | 0.6% |
| Russia | 4 | 0.4% |
| South Eastern Asia | 18 | 1.9% |
| Thailand | 6 | 0.6% |
| Ukraine | 6 | 0.6% |
| Vietnam | 6 | 0.6% | View All 15 Rows |
Sex and Age in Dash Point
Sex and Age in Dash Point
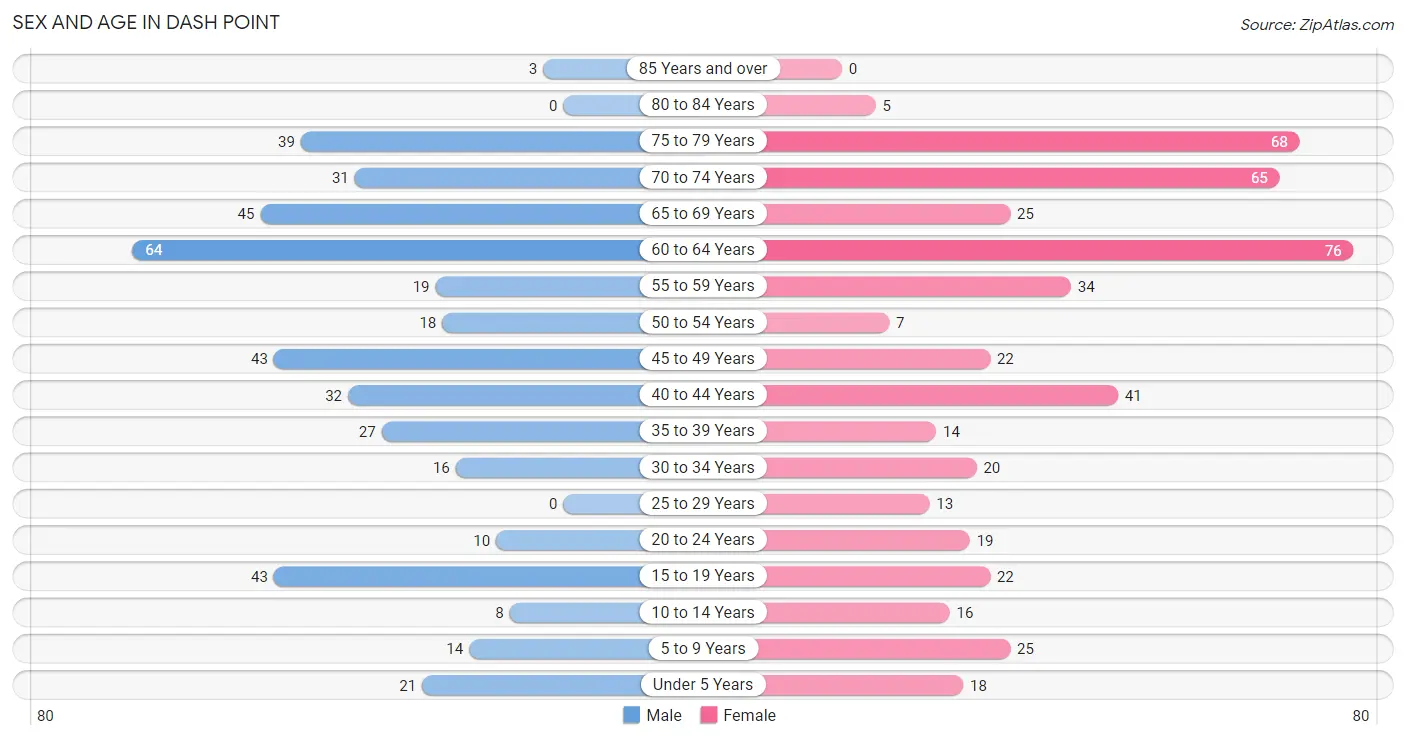
The most populous age groups in Dash Point are 60 to 64 Years (64 | 14.8%) for men and 60 to 64 Years (76 | 15.5%) for women.
| Age Bracket | Male | Female |
| Under 5 Years | 21 (4.9%) | 18 (3.7%) |
| 5 to 9 Years | 14 (3.2%) | 25 (5.1%) |
| 10 to 14 Years | 8 (1.8%) | 16 (3.3%) |
| 15 to 19 Years | 43 (9.9%) | 22 (4.5%) |
| 20 to 24 Years | 10 (2.3%) | 19 (3.9%) |
| 25 to 29 Years | 0 (0.0%) | 13 (2.6%) |
| 30 to 34 Years | 16 (3.7%) | 20 (4.1%) |
| 35 to 39 Years | 27 (6.2%) | 14 (2.9%) |
| 40 to 44 Years | 32 (7.4%) | 41 (8.4%) |
| 45 to 49 Years | 43 (9.9%) | 22 (4.5%) |
| 50 to 54 Years | 18 (4.2%) | 7 (1.4%) |
| 55 to 59 Years | 19 (4.4%) | 34 (6.9%) |
| 60 to 64 Years | 64 (14.8%) | 76 (15.5%) |
| 65 to 69 Years | 45 (10.4%) | 25 (5.1%) |
| 70 to 74 Years | 31 (7.2%) | 65 (13.3%) |
| 75 to 79 Years | 39 (9.0%) | 68 (13.9%) |
| 80 to 84 Years | 0 (0.0%) | 5 (1.0%) |
| 85 Years and over | 3 (0.7%) | 0 (0.0%) |
| Total | 433 (100.0%) | 490 (100.0%) |
Families and Households in Dash Point
Median Family Size in Dash Point
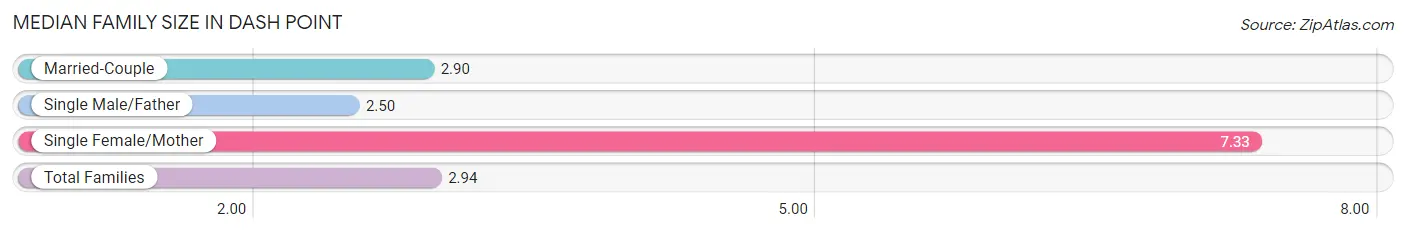
The median family size in Dash Point is 2.94 persons per family, with single female/mother families (3 | 1.2%) accounting for the largest median family size of 7.33 persons per family. On the other hand, single male/father families (10 | 4.0%) represent the smallest median family size with 2.50 persons per family.
| Family Type | # Families | Family Size |
| Married-Couple | 239 (94.8%) | 2.90 |
| Single Male/Father | 10 (4.0%) | 2.50 |
| Single Female/Mother | 3 (1.2%) | 7.33 |
| Total Families | 252 (100.0%) | 2.94 |
Median Household Size in Dash Point
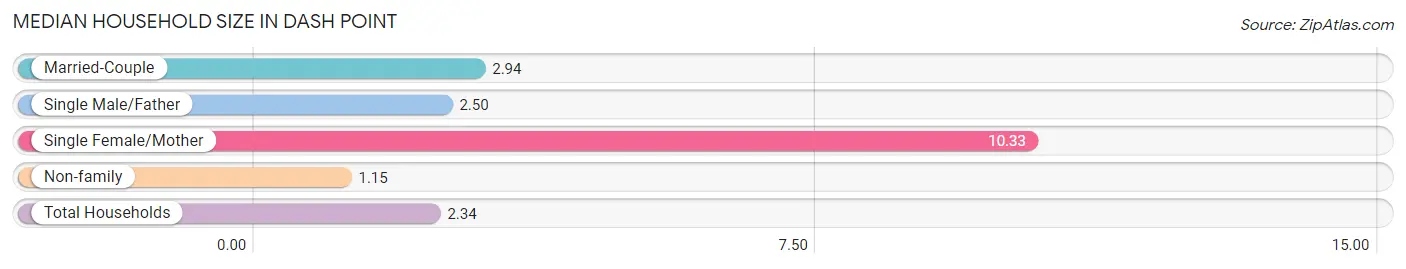
The median household size in Dash Point is 2.34 persons per household, with single female/mother households (3 | 0.8%) accounting for the largest median household size of 10.33 persons per household. non-family households (143 | 36.2%) represent the smallest median household size with 1.15 persons per household.
| Household Type | # Households | Household Size |
| Married-Couple | 239 (60.5%) | 2.94 |
| Single Male/Father | 10 (2.5%) | 2.50 |
| Single Female/Mother | 3 (0.8%) | 10.33 |
| Non-family | 143 (36.2%) | 1.15 |
| Total Households | 395 (100.0%) | 2.34 |
Household Size by Marriage Status in Dash Point
Out of a total of 395 households in Dash Point, 252 (63.8%) are family households, while 143 (36.2%) are nonfamily households. The most numerous type of family households are 2-person households, comprising 140, and the most common type of nonfamily households are 1-person households, comprising 123.
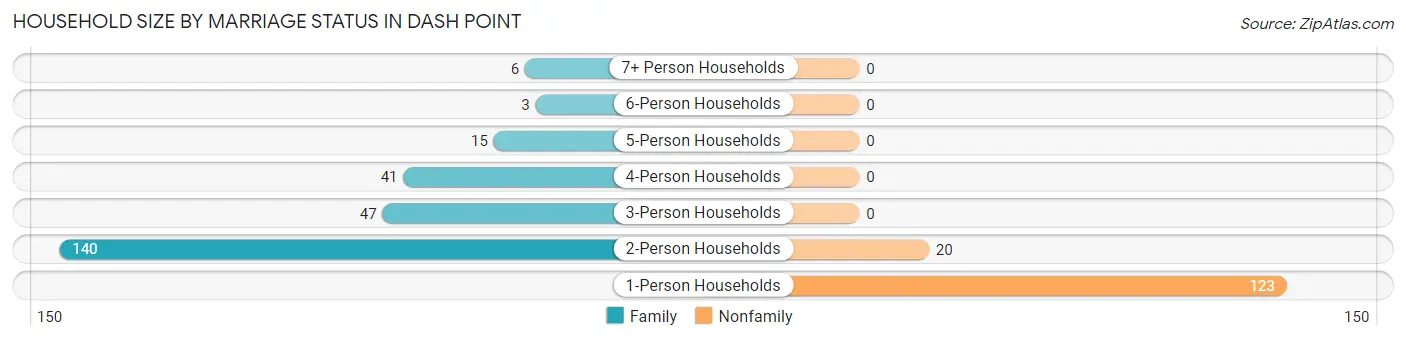
| Household Size | Family Households | Nonfamily Households |
| 1-Person Households | - | 123 (31.1%) |
| 2-Person Households | 140 (35.4%) | 20 (5.1%) |
| 3-Person Households | 47 (11.9%) | 0 (0.0%) |
| 4-Person Households | 41 (10.4%) | 0 (0.0%) |
| 5-Person Households | 15 (3.8%) | 0 (0.0%) |
| 6-Person Households | 3 (0.8%) | 0 (0.0%) |
| 7+ Person Households | 6 (1.5%) | 0 (0.0%) |
| Total | 252 (63.8%) | 143 (36.2%) |
Female Fertility in Dash Point
Fertility by Age in Dash Point
Average fertility rate in Dash Point is 60.0 births per 1,000 women. Women in the age bracket of 35 to 50 years have the highest fertility rate with 117.0 births per 1,000 women. Women in the age bracket of 35 to 50 years acount for 100.0% of all women with births.
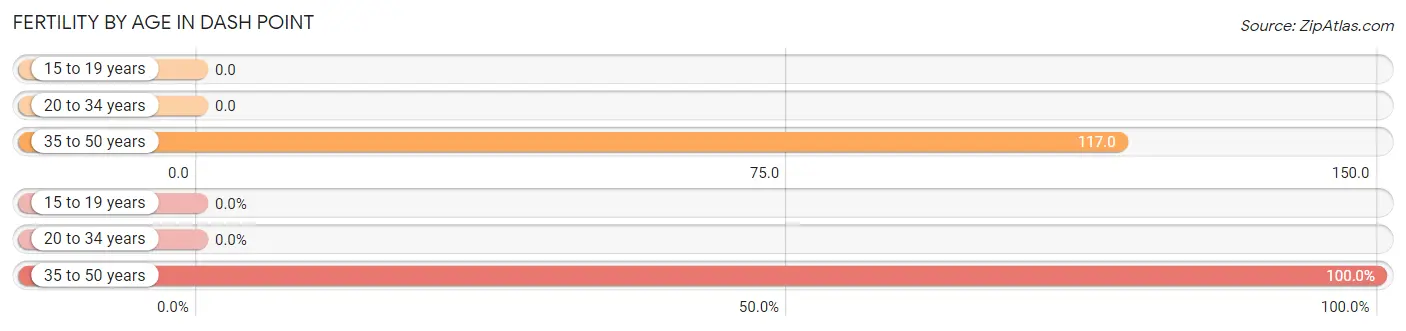
| Age Bracket | Women with Births | Births / 1,000 Women |
| 15 to 19 years | 0 (0.0%) | 0.0 |
| 20 to 34 years | 0 (0.0%) | 0.0 |
| 35 to 50 years | 9 (100.0%) | 117.0 |
| Total | 9 (100.0%) | 60.0 |
Fertility by Age by Marriage Status in Dash Point
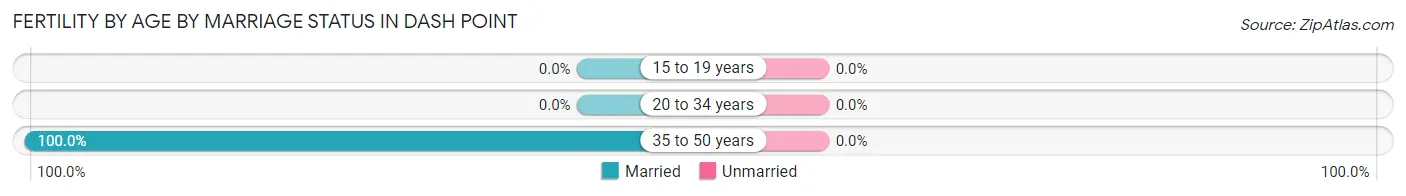
| Age Bracket | Married | Unmarried |
| 15 to 19 years | 0 (0.0%) | 0 (0.0%) |
| 20 to 34 years | 0 (0.0%) | 0 (0.0%) |
| 35 to 50 years | 9 (100.0%) | 0 (0.0%) |
| Total | 9 (100.0%) | 0 (0.0%) |
Fertility by Education in Dash Point
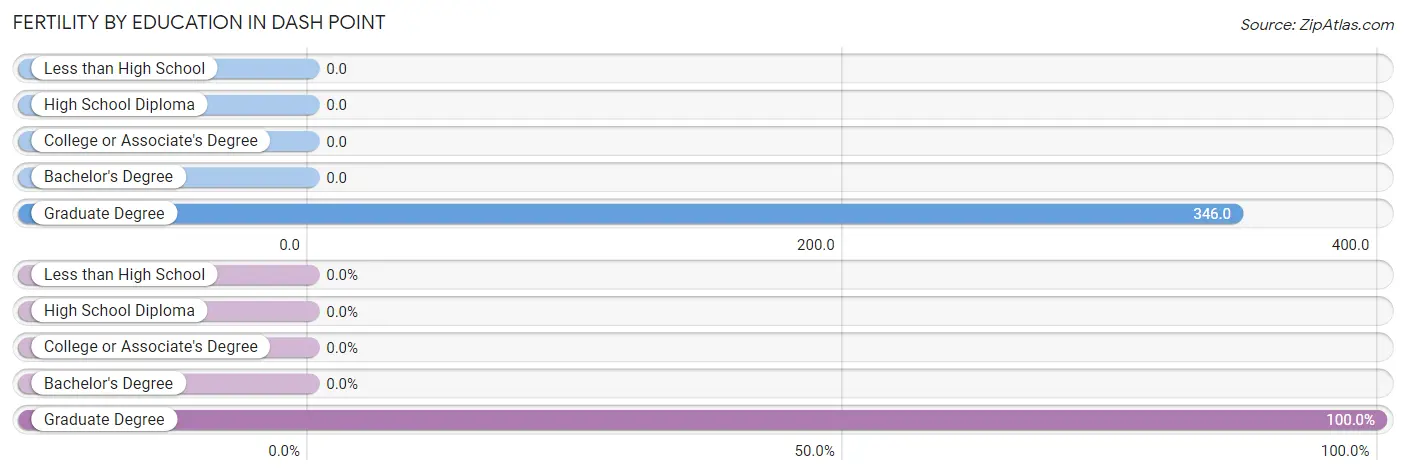
| Educational Attainment | Women with Births | Births / 1,000 Women |
| Less than High School | 0 (0.0%) | 0.0 |
| High School Diploma | 0 (0.0%) | 0.0 |
| College or Associate's Degree | 0 (0.0%) | 0.0 |
| Bachelor's Degree | 0 (0.0%) | 0.0 |
| Graduate Degree | 9 (100.0%) | 346.0 |
| Total | 9 (100.0%) | 60.0 |
Fertility by Education by Marriage Status in Dash Point
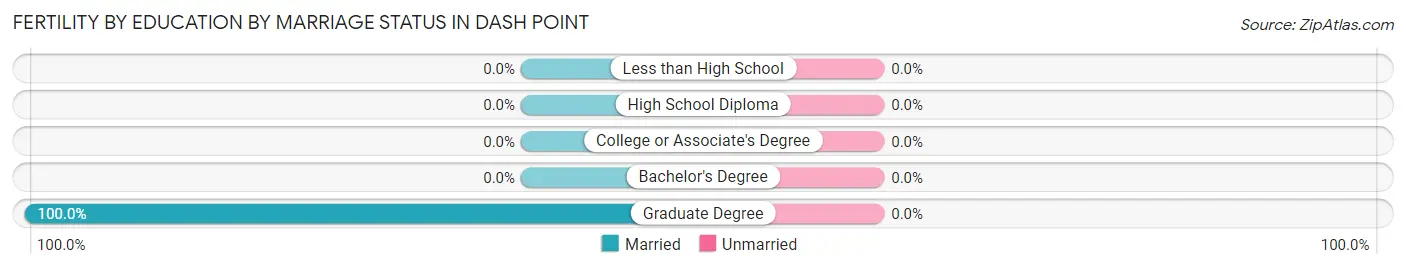
| Educational Attainment | Married | Unmarried |
| Less than High School | 0 (0.0%) | 0 (0.0%) |
| High School Diploma | 0 (0.0%) | 0 (0.0%) |
| College or Associate's Degree | 0 (0.0%) | 0 (0.0%) |
| Bachelor's Degree | 0 (0.0%) | 0 (0.0%) |
| Graduate Degree | 9 (100.0%) | 0 (0.0%) |
| Total | 9 (100.0%) | 0 (0.0%) |
Employment Characteristics in Dash Point
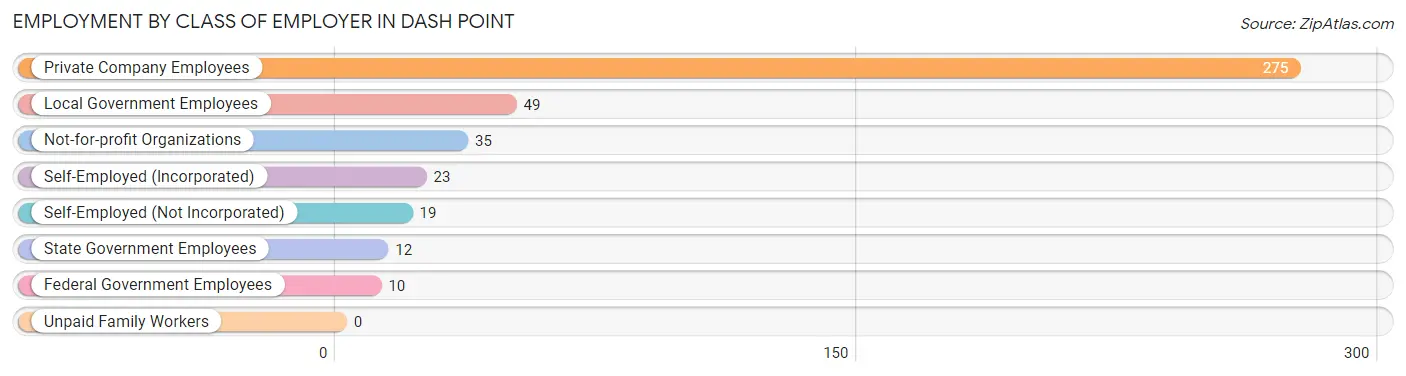
Employment by Class of Employer in Dash Point
Among the 423 employed individuals in Dash Point, private company employees (275 | 65.0%), local government employees (49 | 11.6%), and not-for-profit organizations (35 | 8.3%) make up the most common classes of employment.
| Employer Class | # Employees | % Employees |
| Private Company Employees | 275 | 65.0% |
| Self-Employed (Incorporated) | 23 | 5.4% |
| Self-Employed (Not Incorporated) | 19 | 4.5% |
| Not-for-profit Organizations | 35 | 8.3% |
| Local Government Employees | 49 | 11.6% |
| State Government Employees | 12 | 2.8% |
| Federal Government Employees | 10 | 2.4% |
| Unpaid Family Workers | 0 | 0.0% |
| Total | 423 | 100.0% |
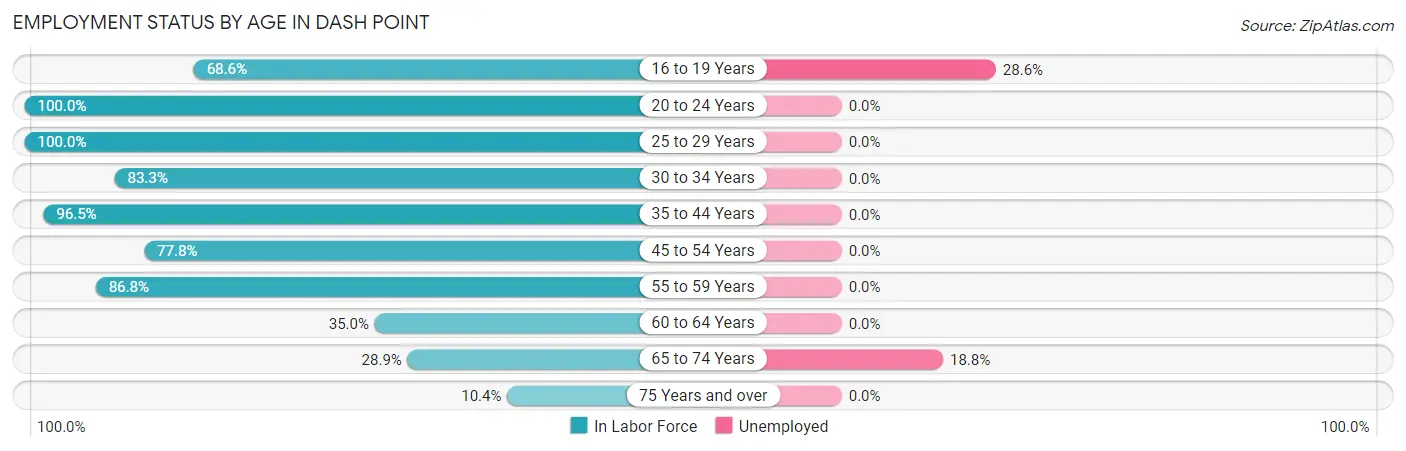
Employment Status by Age in Dash Point
According to the labor force statistics for Dash Point, out of the total population over 16 years of age (807), 54.8% or 442 individuals are in the labor force, with 4.3% or 19 of them unemployed. The age group with the highest labor force participation rate is 20 to 24 years, with 100.0% or 29 individuals in the labor force. Within the labor force, the 16 to 19 years age range has the highest percentage of unemployed individuals, with 28.6% or 10 of them being unemployed.
| Age Bracket | In Labor Force | Unemployed |
| 16 to 19 Years | 35 (68.6%) | 10 (28.6%) |
| 20 to 24 Years | 29 (100.0%) | 0 (0.0%) |
| 25 to 29 Years | 13 (100.0%) | 0 (0.0%) |
| 30 to 34 Years | 30 (83.3%) | 0 (0.0%) |
| 35 to 44 Years | 110 (96.5%) | 0 (0.0%) |
| 45 to 54 Years | 70 (77.8%) | 0 (0.0%) |
| 55 to 59 Years | 46 (86.8%) | 0 (0.0%) |
| 60 to 64 Years | 49 (35.0%) | 0 (0.0%) |
| 65 to 74 Years | 48 (28.9%) | 9 (18.8%) |
| 75 Years and over | 12 (10.4%) | 0 (0.0%) |
| Total | 442 (54.8%) | 19 (4.3%) |
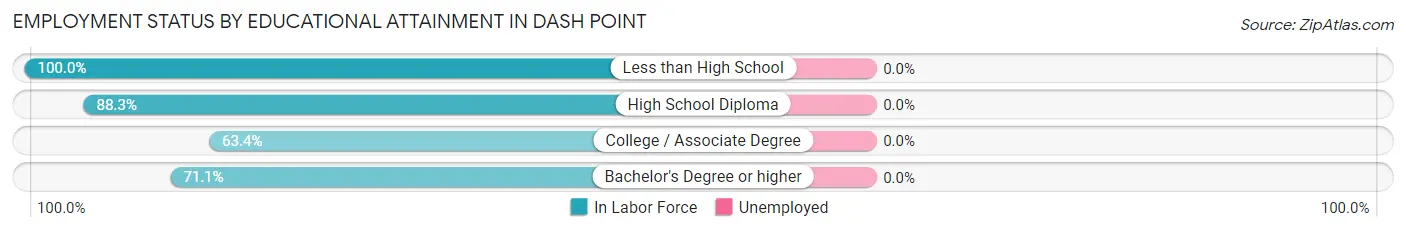
Employment Status by Educational Attainment in Dash Point
| Educational Attainment | In Labor Force | Unemployed |
| Less than High School | 4 (100.0%) | 0 (0.0%) |
| High School Diploma | 68 (88.3%) | 0 (0.0%) |
| College / Associate Degree | 111 (63.4%) | 0 (0.0%) |
| Bachelor's Degree or higher | 135 (71.1%) | 0 (0.0%) |
| Total | 318 (71.3%) | 0 (0.0%) |
Employment Occupations by Sex in Dash Point
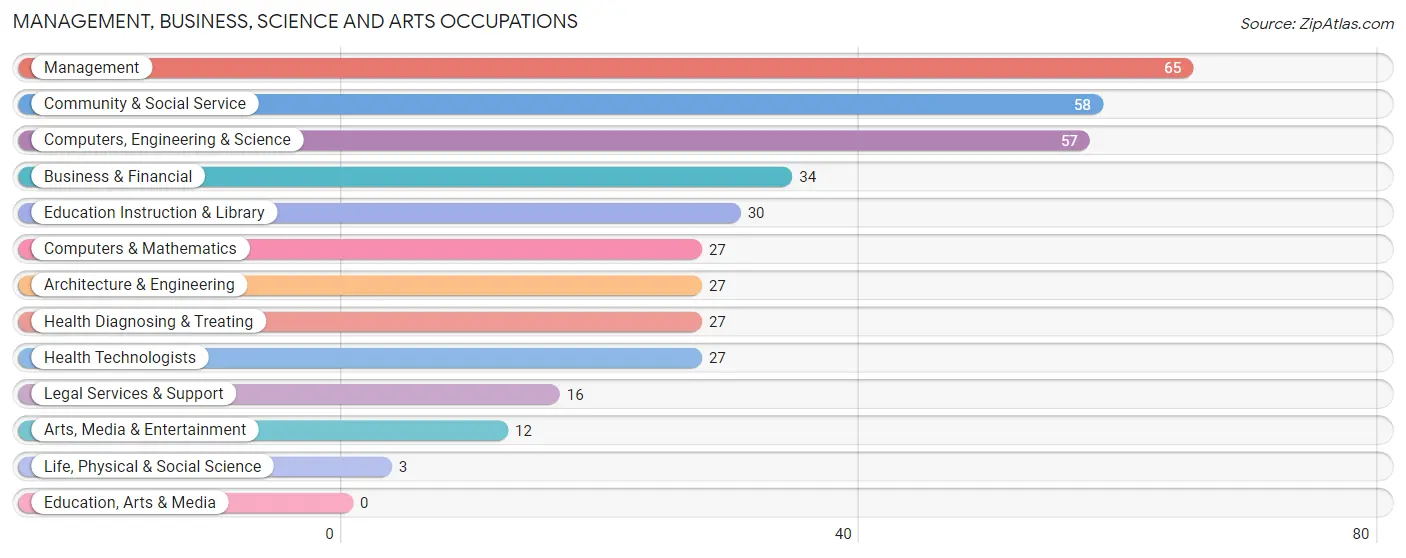
Management, Business, Science and Arts Occupations
The most common Management, Business, Science and Arts occupations in Dash Point are Management (65 | 15.4%), Community & Social Service (58 | 13.7%), Computers, Engineering & Science (57 | 13.5%), Business & Financial (34 | 8.0%), and Education Instruction & Library (30 | 7.1%).
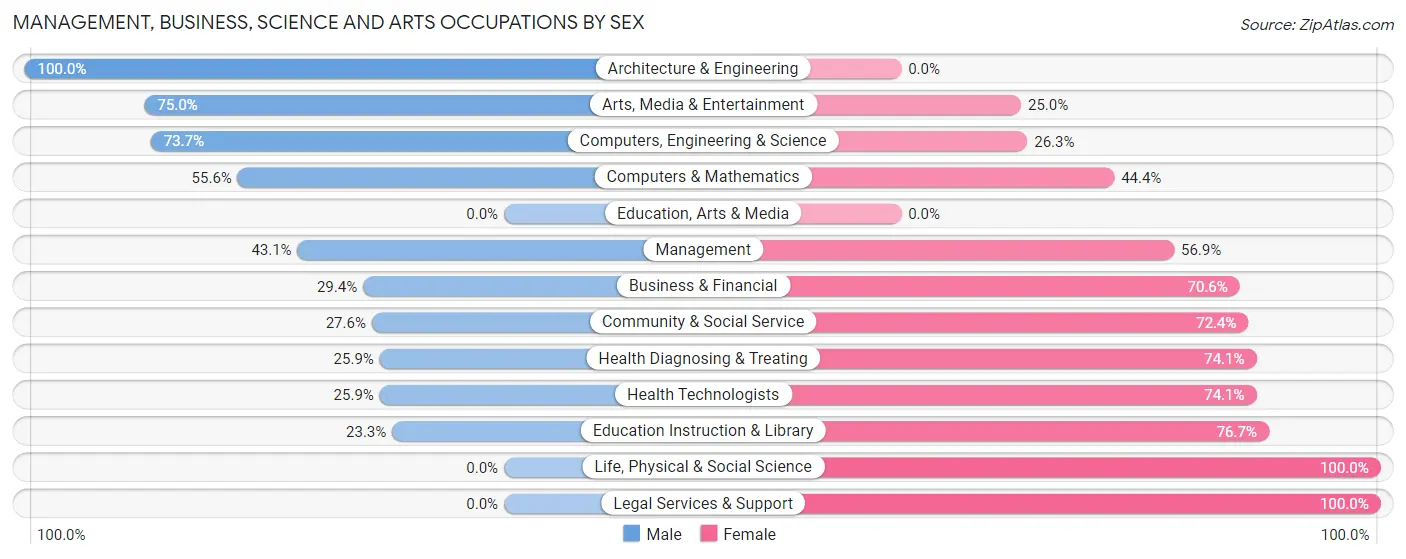
Management, Business, Science and Arts Occupations by Sex
Within the Management, Business, Science and Arts occupations in Dash Point, the most male-oriented occupations are Architecture & Engineering (100.0%), Arts, Media & Entertainment (75.0%), and Computers, Engineering & Science (73.7%), while the most female-oriented occupations are Life, Physical & Social Science (100.0%), Legal Services & Support (100.0%), and Education Instruction & Library (76.7%).
| Occupation | Male | Female |
| Management | 28 (43.1%) | 37 (56.9%) |
| Business & Financial | 10 (29.4%) | 24 (70.6%) |
| Computers, Engineering & Science | 42 (73.7%) | 15 (26.3%) |
| Computers & Mathematics | 15 (55.6%) | 12 (44.4%) |
| Architecture & Engineering | 27 (100.0%) | 0 (0.0%) |
| Life, Physical & Social Science | 0 (0.0%) | 3 (100.0%) |
| Community & Social Service | 16 (27.6%) | 42 (72.4%) |
| Education, Arts & Media | 0 (0.0%) | 0 (0.0%) |
| Legal Services & Support | 0 (0.0%) | 16 (100.0%) |
| Education Instruction & Library | 7 (23.3%) | 23 (76.7%) |
| Arts, Media & Entertainment | 9 (75.0%) | 3 (25.0%) |
| Health Diagnosing & Treating | 7 (25.9%) | 20 (74.1%) |
| Health Technologists | 7 (25.9%) | 20 (74.1%) |
| Total (Category) | 103 (42.7%) | 138 (57.3%) |
| Total (Overall) | 222 (52.5%) | 201 (47.5%) |
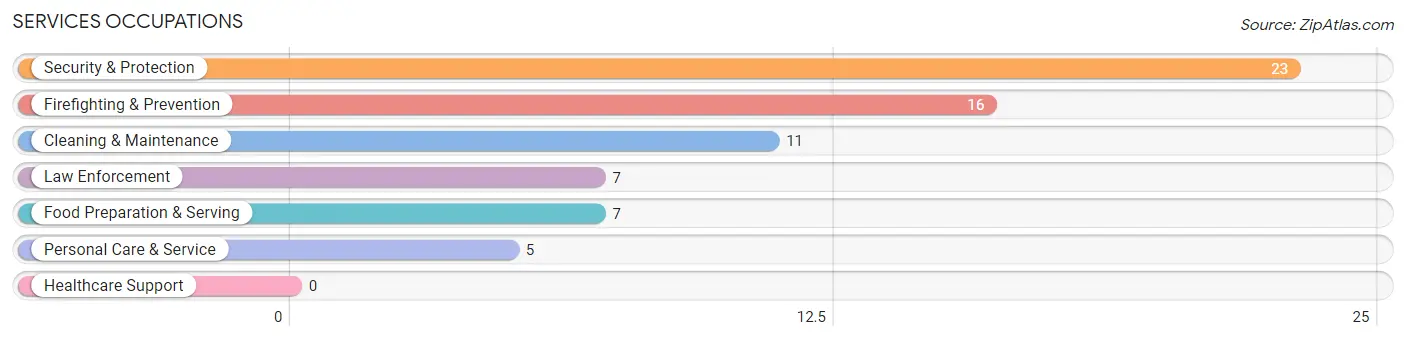
Services Occupations
The most common Services occupations in Dash Point are Security & Protection (23 | 5.4%), Firefighting & Prevention (16 | 3.8%), Cleaning & Maintenance (11 | 2.6%), Law Enforcement (7 | 1.7%), and Food Preparation & Serving (7 | 1.7%).
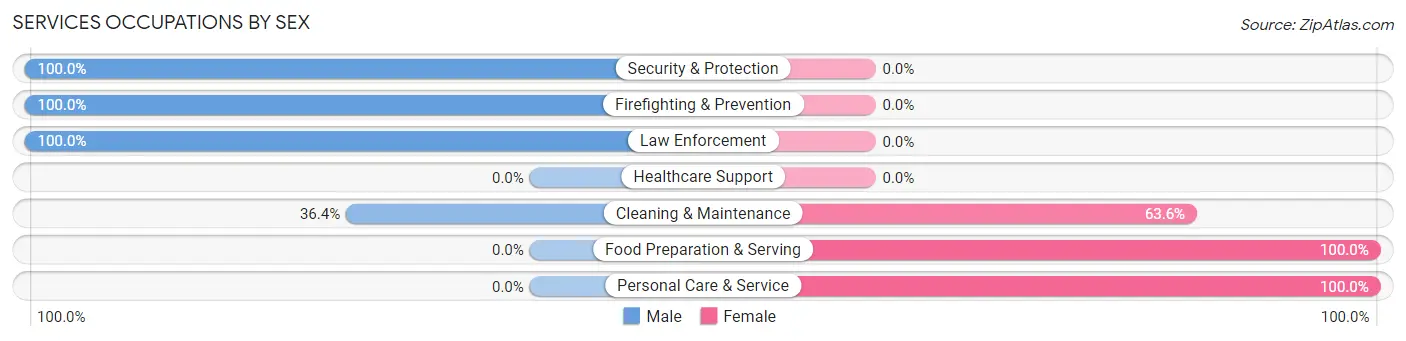
Services Occupations by Sex
Within the Services occupations in Dash Point, the most male-oriented occupations are Security & Protection (100.0%), Firefighting & Prevention (100.0%), and Law Enforcement (100.0%), while the most female-oriented occupations are Food Preparation & Serving (100.0%), Personal Care & Service (100.0%), and Cleaning & Maintenance (63.6%).
| Occupation | Male | Female |
| Healthcare Support | 0 (0.0%) | 0 (0.0%) |
| Security & Protection | 23 (100.0%) | 0 (0.0%) |
| Firefighting & Prevention | 16 (100.0%) | 0 (0.0%) |
| Law Enforcement | 7 (100.0%) | 0 (0.0%) |
| Food Preparation & Serving | 0 (0.0%) | 7 (100.0%) |
| Cleaning & Maintenance | 4 (36.4%) | 7 (63.6%) |
| Personal Care & Service | 0 (0.0%) | 5 (100.0%) |
| Total (Category) | 27 (58.7%) | 19 (41.3%) |
| Total (Overall) | 222 (52.5%) | 201 (47.5%) |
Sales and Office Occupations
The most common Sales and Office occupations in Dash Point are Office & Administration (52 | 12.3%), and Sales & Related (50 | 11.8%).
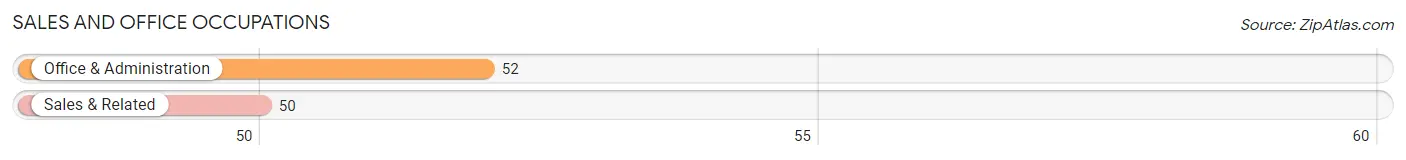
Sales and Office Occupations by Sex
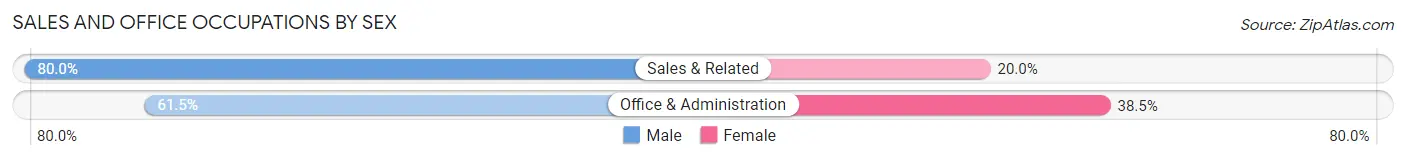
| Occupation | Male | Female |
| Sales & Related | 40 (80.0%) | 10 (20.0%) |
| Office & Administration | 32 (61.5%) | 20 (38.5%) |
| Total (Category) | 72 (70.6%) | 30 (29.4%) |
| Total (Overall) | 222 (52.5%) | 201 (47.5%) |
Natural Resources, Construction and Maintenance Occupations
The most common Natural Resources, Construction and Maintenance occupations in Dash Point are , and Installation, Maintenance & Repair (2 | 0.5%).
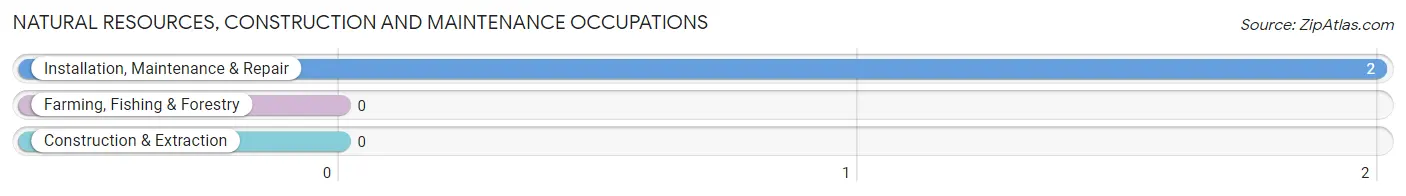
Natural Resources, Construction and Maintenance Occupations by Sex
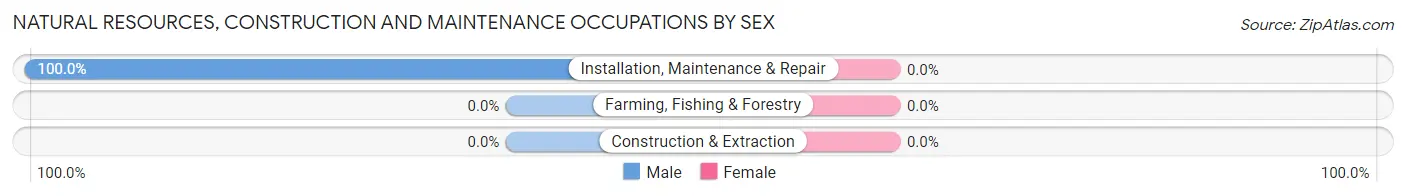
| Occupation | Male | Female |
| Farming, Fishing & Forestry | 0 (0.0%) | 0 (0.0%) |
| Construction & Extraction | 0 (0.0%) | 0 (0.0%) |
| Installation, Maintenance & Repair | 2 (100.0%) | 0 (0.0%) |
| Total (Category) | 2 (100.0%) | 0 (0.0%) |
| Total (Overall) | 222 (52.5%) | 201 (47.5%) |
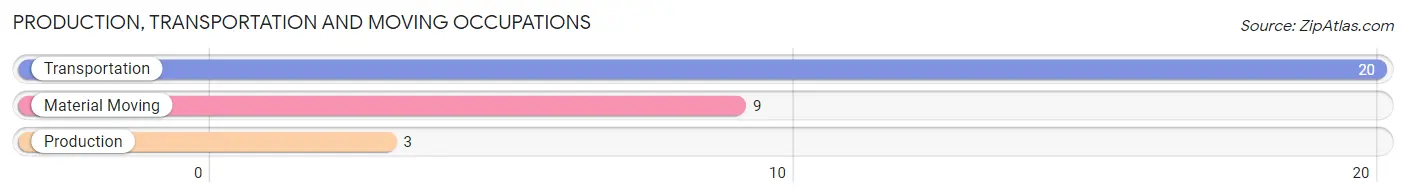
Production, Transportation and Moving Occupations
The most common Production, Transportation and Moving occupations in Dash Point are Transportation (20 | 4.7%), Material Moving (9 | 2.1%), and Production (3 | 0.7%).
Production, Transportation and Moving Occupations by Sex
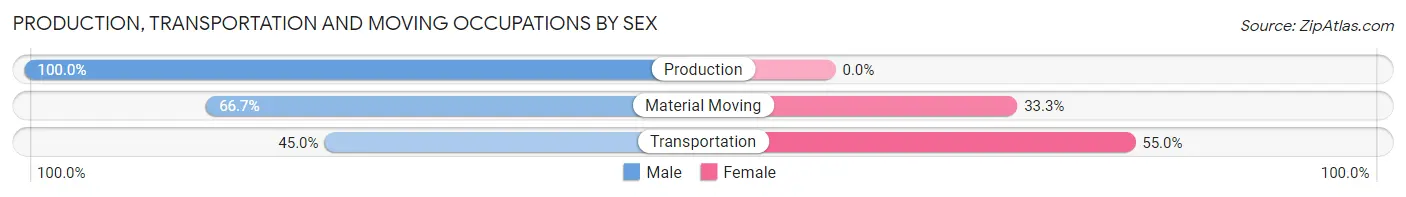
| Occupation | Male | Female |
| Production | 3 (100.0%) | 0 (0.0%) |
| Transportation | 9 (45.0%) | 11 (55.0%) |
| Material Moving | 6 (66.7%) | 3 (33.3%) |
| Total (Category) | 18 (56.2%) | 14 (43.8%) |
| Total (Overall) | 222 (52.5%) | 201 (47.5%) |
Employment Industries by Sex in Dash Point
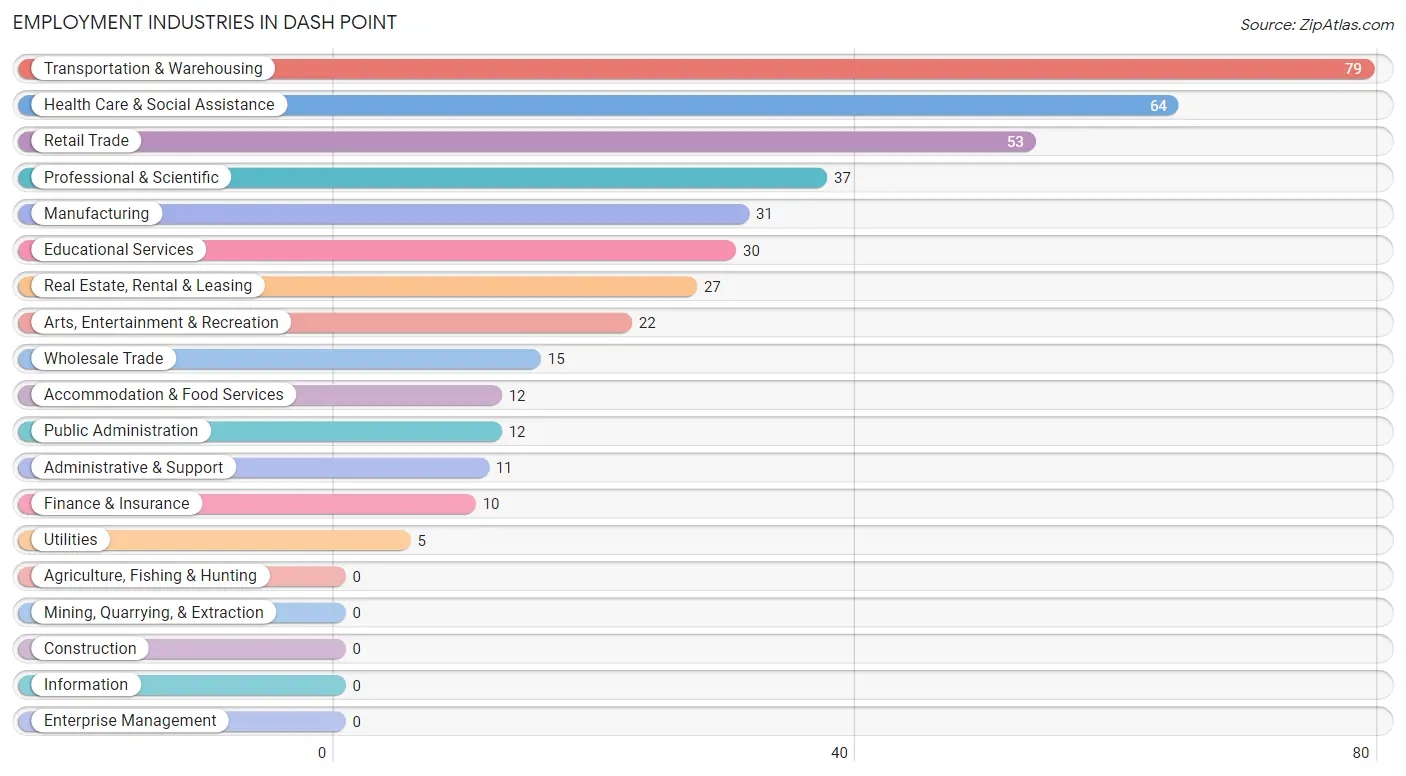
Employment Industries in Dash Point
The major employment industries in Dash Point include Transportation & Warehousing (79 | 18.7%), Health Care & Social Assistance (64 | 15.1%), Retail Trade (53 | 12.5%), Professional & Scientific (37 | 8.7%), and Manufacturing (31 | 7.3%).
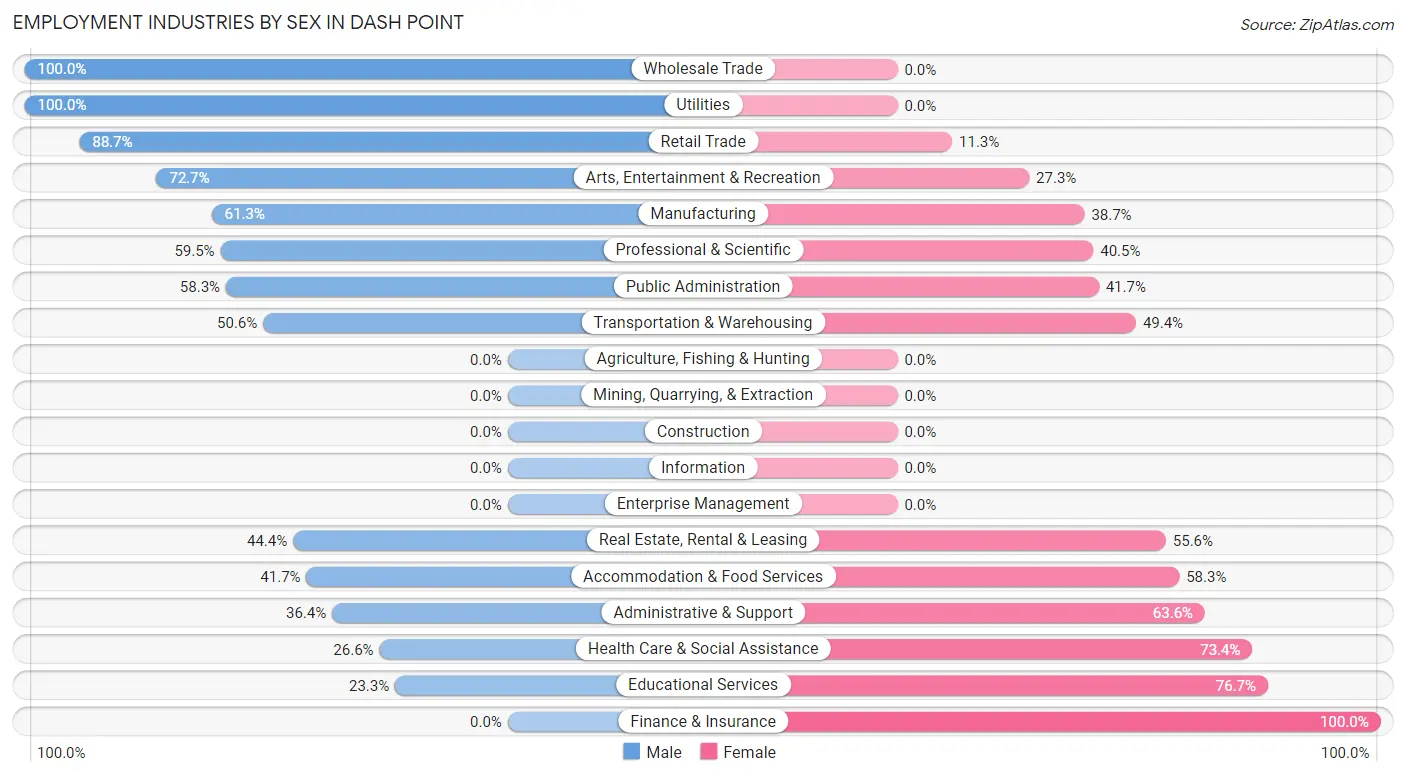
Employment Industries by Sex in Dash Point
The Dash Point industries that see more men than women are Wholesale Trade (100.0%), Utilities (100.0%), and Retail Trade (88.7%), whereas the industries that tend to have a higher number of women are Finance & Insurance (100.0%), Educational Services (76.7%), and Health Care & Social Assistance (73.4%).
| Industry | Male | Female |
| Agriculture, Fishing & Hunting | 0 (0.0%) | 0 (0.0%) |
| Mining, Quarrying, & Extraction | 0 (0.0%) | 0 (0.0%) |
| Construction | 0 (0.0%) | 0 (0.0%) |
| Manufacturing | 19 (61.3%) | 12 (38.7%) |
| Wholesale Trade | 15 (100.0%) | 0 (0.0%) |
| Retail Trade | 47 (88.7%) | 6 (11.3%) |
| Transportation & Warehousing | 40 (50.6%) | 39 (49.4%) |
| Utilities | 5 (100.0%) | 0 (0.0%) |
| Information | 0 (0.0%) | 0 (0.0%) |
| Finance & Insurance | 0 (0.0%) | 10 (100.0%) |
| Real Estate, Rental & Leasing | 12 (44.4%) | 15 (55.6%) |
| Professional & Scientific | 22 (59.5%) | 15 (40.5%) |
| Enterprise Management | 0 (0.0%) | 0 (0.0%) |
| Administrative & Support | 4 (36.4%) | 7 (63.6%) |
| Educational Services | 7 (23.3%) | 23 (76.7%) |
| Health Care & Social Assistance | 17 (26.6%) | 47 (73.4%) |
| Arts, Entertainment & Recreation | 16 (72.7%) | 6 (27.3%) |
| Accommodation & Food Services | 5 (41.7%) | 7 (58.3%) |
| Public Administration | 7 (58.3%) | 5 (41.7%) |
| Total | 222 (52.5%) | 201 (47.5%) |
Education in Dash Point
School Enrollment in Dash Point
The most common levels of schooling among the 180 students in Dash Point are high school (63 | 35.0%), nursery / preschool (26 | 14.4%), and college / undergraduate (26 | 14.4%).
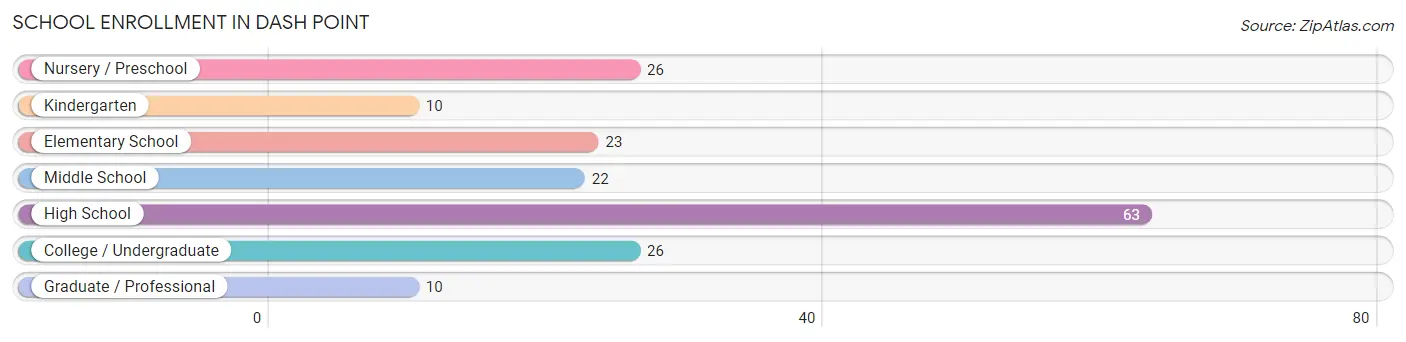
| School Level | # Students | % Students |
| Nursery / Preschool | 26 | 14.4% |
| Kindergarten | 10 | 5.6% |
| Elementary School | 23 | 12.8% |
| Middle School | 22 | 12.2% |
| High School | 63 | 35.0% |
| College / Undergraduate | 26 | 14.4% |
| Graduate / Professional | 10 | 5.6% |
| Total | 180 | 100.0% |
School Enrollment by Age by Funding Source in Dash Point
Out of a total of 180 students who are enrolled in schools in Dash Point, 34 (18.9%) attend a private institution, while the remaining 146 (81.1%) are enrolled in public schools. The age group of 3 to 4 year olds has the highest likelihood of being enrolled in private schools, with 13 (65.0% in the age bracket) enrolled. Conversely, the age group of 10 to 14 year olds has the lowest likelihood of being enrolled in a private school, with 24 (100.0% in the age bracket) attending a public institution.
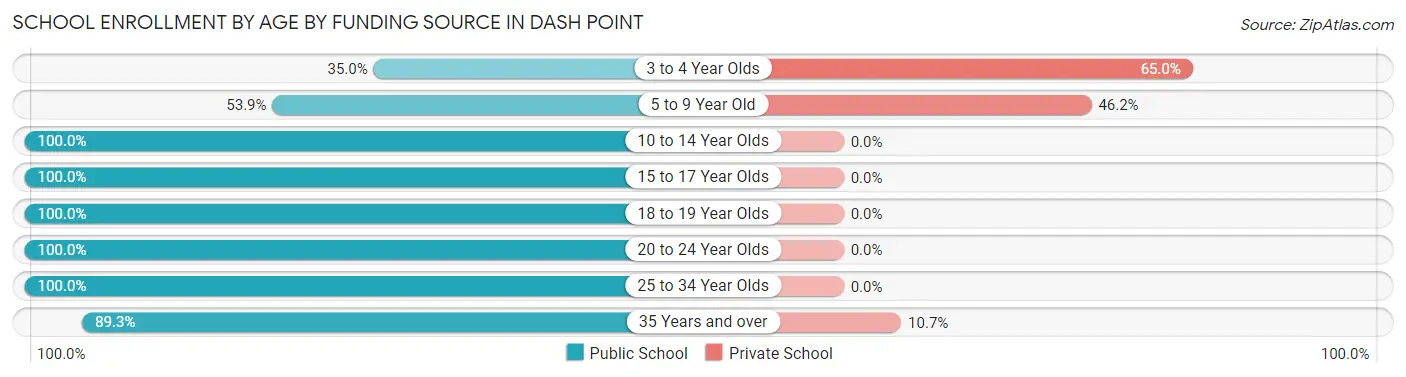
| Age Bracket | Public School | Private School |
| 3 to 4 Year Olds | 7 (35.0%) | 13 (65.0%) |
| 5 to 9 Year Old | 21 (53.8%) | 18 (46.2%) |
| 10 to 14 Year Olds | 24 (100.0%) | 0 (0.0%) |
| 15 to 17 Year Olds | 31 (100.0%) | 0 (0.0%) |
| 18 to 19 Year Olds | 30 (100.0%) | 0 (0.0%) |
| 20 to 24 Year Olds | 2 (100.0%) | 0 (0.0%) |
| 25 to 34 Year Olds | 6 (100.0%) | 0 (0.0%) |
| 35 Years and over | 25 (89.3%) | 3 (10.7%) |
| Total | 146 (81.1%) | 34 (18.9%) |
Educational Attainment by Field of Study in Dash Point
Business (63 | 17.1%), education (50 | 13.6%), engineering (48 | 13.0%), science & technology (44 | 12.0%), and visual & performing arts (25 | 6.8%) are the most common fields of study among 368 individuals in Dash Point who have obtained a bachelor's degree or higher.
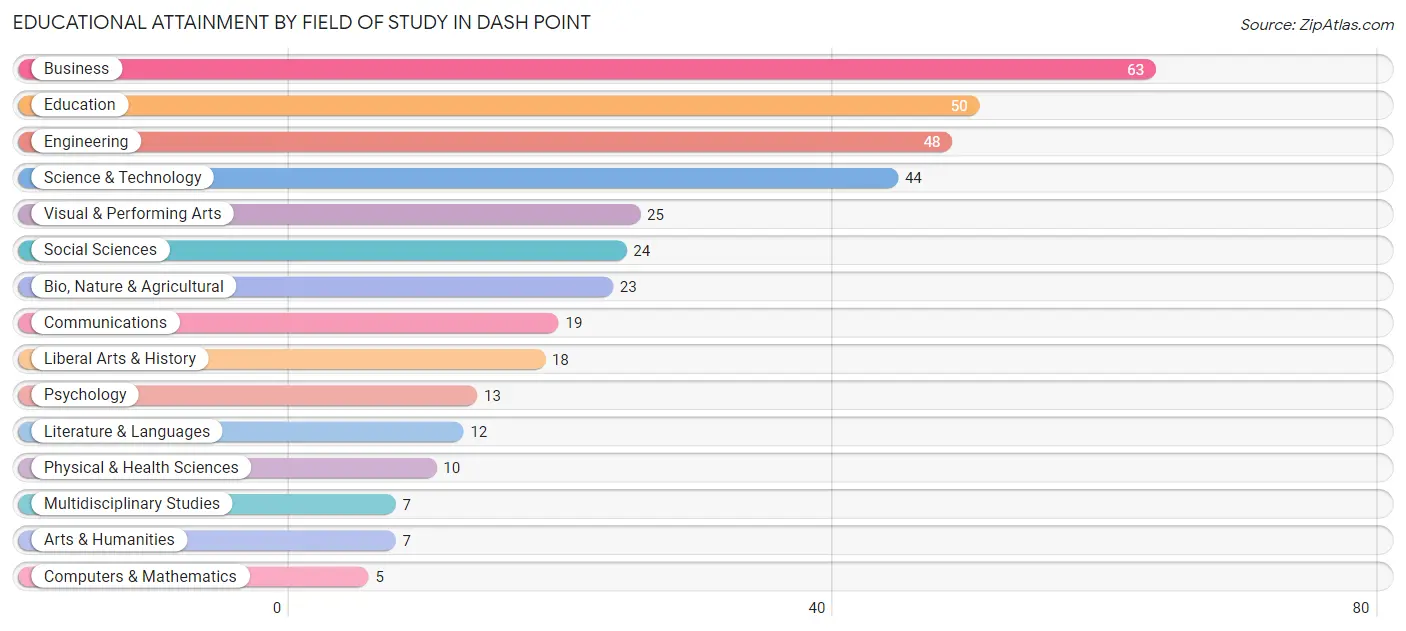
| Field of Study | # Graduates | % Graduates |
| Computers & Mathematics | 5 | 1.4% |
| Bio, Nature & Agricultural | 23 | 6.2% |
| Physical & Health Sciences | 10 | 2.7% |
| Psychology | 13 | 3.5% |
| Social Sciences | 24 | 6.5% |
| Engineering | 48 | 13.0% |
| Multidisciplinary Studies | 7 | 1.9% |
| Science & Technology | 44 | 12.0% |
| Business | 63 | 17.1% |
| Education | 50 | 13.6% |
| Literature & Languages | 12 | 3.3% |
| Liberal Arts & History | 18 | 4.9% |
| Visual & Performing Arts | 25 | 6.8% |
| Communications | 19 | 5.2% |
| Arts & Humanities | 7 | 1.9% |
| Total | 368 | 100.0% |
Transportation & Commute in Dash Point
Vehicle Availability by Sex in Dash Point
The most prevalent vehicle ownership categories in Dash Point are males with 2 vehicles (97, accounting for 43.7%) and females with 2 vehicles (75, making up 48.3%).
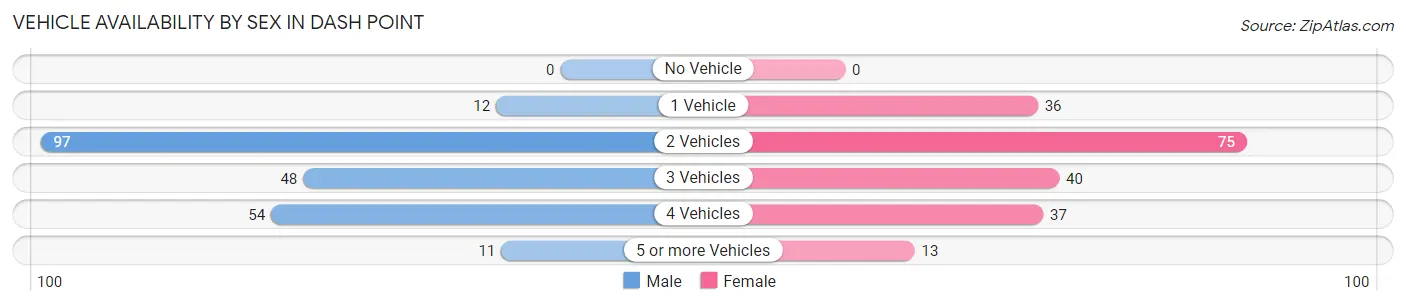
| Vehicles Available | Male | Female |
| No Vehicle | 0 (0.0%) | 0 (0.0%) |
| 1 Vehicle | 12 (5.4%) | 36 (17.9%) |
| 2 Vehicles | 97 (43.7%) | 75 (37.3%) |
| 3 Vehicles | 48 (21.6%) | 40 (19.9%) |
| 4 Vehicles | 54 (24.3%) | 37 (18.4%) |
| 5 or more Vehicles | 11 (5.0%) | 13 (6.5%) |
| Total | 222 (100.0%) | 201 (100.0%) |
Commute Time in Dash Point
The most frequently occuring commute durations in Dash Point are 45 to 59 minutes (62 commuters, 17.6%), 20 to 24 minutes (53 commuters, 15.1%), and 30 to 34 minutes (36 commuters, 10.2%).
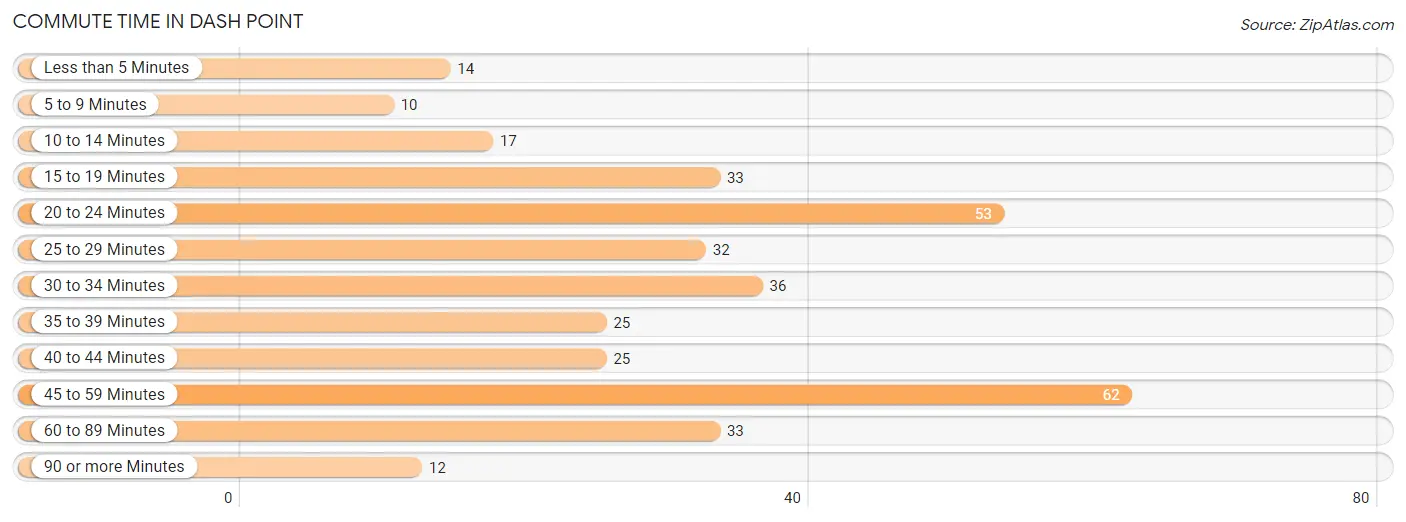
| Commute Time | # Commuters | % Commuters |
| Less than 5 Minutes | 14 | 4.0% |
| 5 to 9 Minutes | 10 | 2.8% |
| 10 to 14 Minutes | 17 | 4.8% |
| 15 to 19 Minutes | 33 | 9.4% |
| 20 to 24 Minutes | 53 | 15.1% |
| 25 to 29 Minutes | 32 | 9.1% |
| 30 to 34 Minutes | 36 | 10.2% |
| 35 to 39 Minutes | 25 | 7.1% |
| 40 to 44 Minutes | 25 | 7.1% |
| 45 to 59 Minutes | 62 | 17.6% |
| 60 to 89 Minutes | 33 | 9.4% |
| 90 or more Minutes | 12 | 3.4% |
Commute Time by Sex in Dash Point
The most common commute times in Dash Point are 20 to 24 minutes (34 commuters, 17.8%) for males and 45 to 59 minutes (34 commuters, 21.1%) for females.
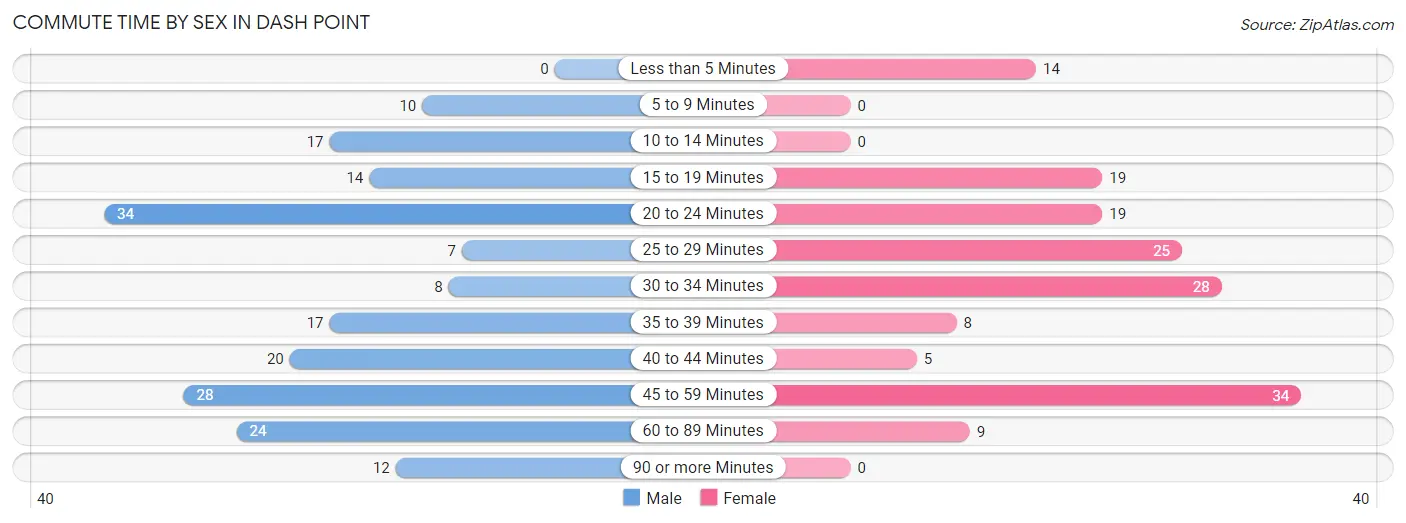
| Commute Time | Male | Female |
| Less than 5 Minutes | 0 (0.0%) | 14 (8.7%) |
| 5 to 9 Minutes | 10 (5.2%) | 0 (0.0%) |
| 10 to 14 Minutes | 17 (8.9%) | 0 (0.0%) |
| 15 to 19 Minutes | 14 (7.3%) | 19 (11.8%) |
| 20 to 24 Minutes | 34 (17.8%) | 19 (11.8%) |
| 25 to 29 Minutes | 7 (3.7%) | 25 (15.5%) |
| 30 to 34 Minutes | 8 (4.2%) | 28 (17.4%) |
| 35 to 39 Minutes | 17 (8.9%) | 8 (5.0%) |
| 40 to 44 Minutes | 20 (10.5%) | 5 (3.1%) |
| 45 to 59 Minutes | 28 (14.7%) | 34 (21.1%) |
| 60 to 89 Minutes | 24 (12.6%) | 9 (5.6%) |
| 90 or more Minutes | 12 (6.3%) | 0 (0.0%) |
Time of Departure to Work by Sex in Dash Point
The most frequent times of departure to work in Dash Point are 8:00 AM to 8:29 AM (24, 12.6%) for males and 7:30 AM to 7:59 AM (30, 18.6%) for females.
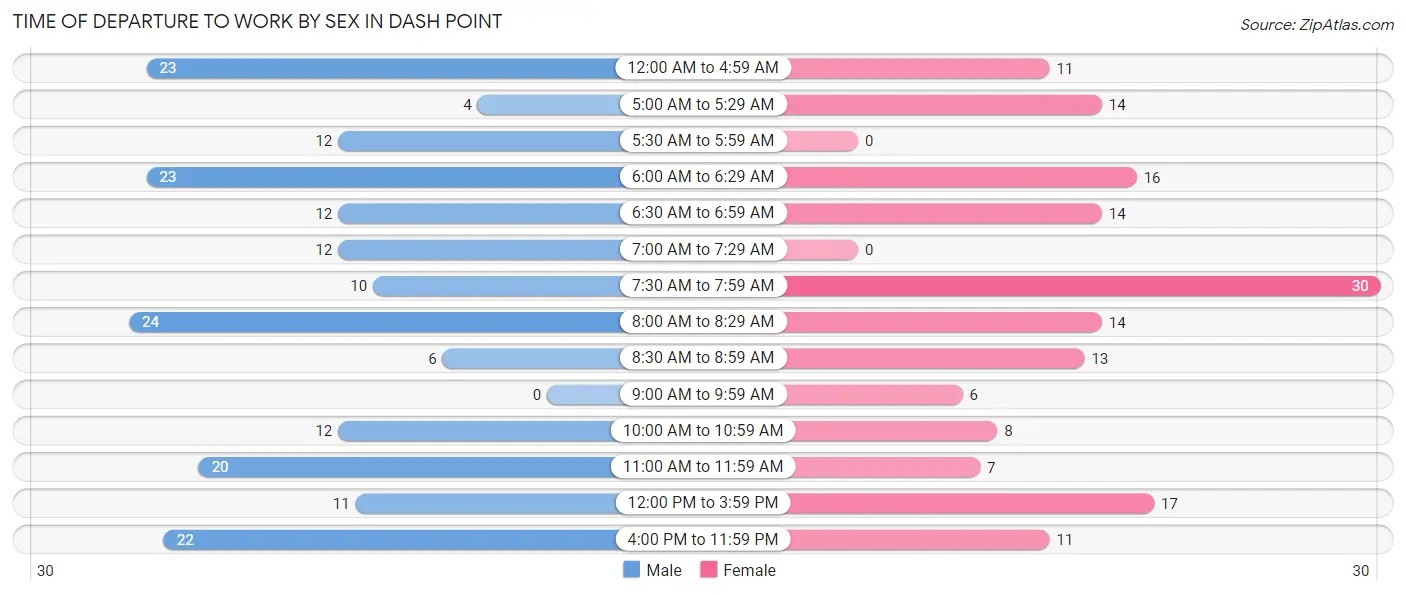
| Time of Departure | Male | Female |
| 12:00 AM to 4:59 AM | 23 (12.0%) | 11 (6.8%) |
| 5:00 AM to 5:29 AM | 4 (2.1%) | 14 (8.7%) |
| 5:30 AM to 5:59 AM | 12 (6.3%) | 0 (0.0%) |
| 6:00 AM to 6:29 AM | 23 (12.0%) | 16 (9.9%) |
| 6:30 AM to 6:59 AM | 12 (6.3%) | 14 (8.7%) |
| 7:00 AM to 7:29 AM | 12 (6.3%) | 0 (0.0%) |
| 7:30 AM to 7:59 AM | 10 (5.2%) | 30 (18.6%) |
| 8:00 AM to 8:29 AM | 24 (12.6%) | 14 (8.7%) |
| 8:30 AM to 8:59 AM | 6 (3.1%) | 13 (8.1%) |
| 9:00 AM to 9:59 AM | 0 (0.0%) | 6 (3.7%) |
| 10:00 AM to 10:59 AM | 12 (6.3%) | 8 (5.0%) |
| 11:00 AM to 11:59 AM | 20 (10.5%) | 7 (4.3%) |
| 12:00 PM to 3:59 PM | 11 (5.8%) | 17 (10.6%) |
| 4:00 PM to 11:59 PM | 22 (11.5%) | 11 (6.8%) |
| Total | 191 (100.0%) | 161 (100.0%) |
Housing Occupancy in Dash Point
Occupancy by Ownership in Dash Point
Of the total 395 dwellings in Dash Point, owner-occupied units account for 341 (86.3%), while renter-occupied units make up 54 (13.7%).
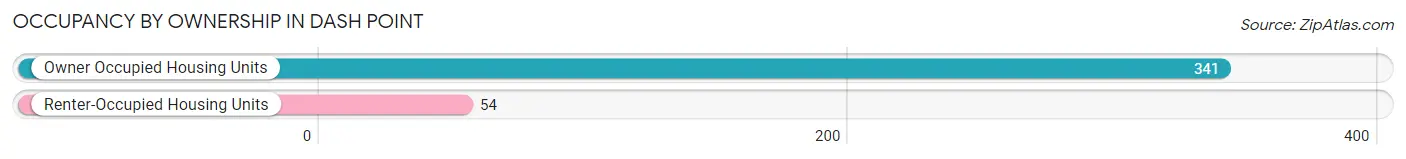
| Occupancy | # Housing Units | % Housing Units |
| Owner Occupied Housing Units | 341 | 86.3% |
| Renter-Occupied Housing Units | 54 | 13.7% |
| Total Occupied Housing Units | 395 | 100.0% |
Occupancy by Household Size in Dash Point
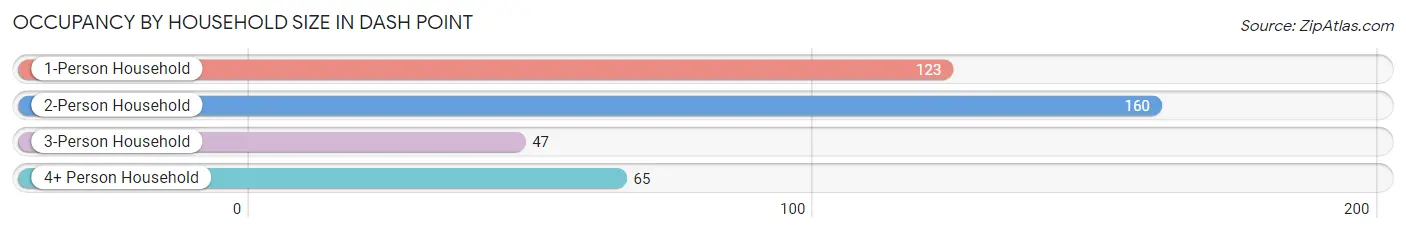
| Household Size | # Housing Units | % Housing Units |
| 1-Person Household | 123 | 31.1% |
| 2-Person Household | 160 | 40.5% |
| 3-Person Household | 47 | 11.9% |
| 4+ Person Household | 65 | 16.5% |
| Total Housing Units | 395 | 100.0% |
Occupancy by Ownership by Household Size in Dash Point
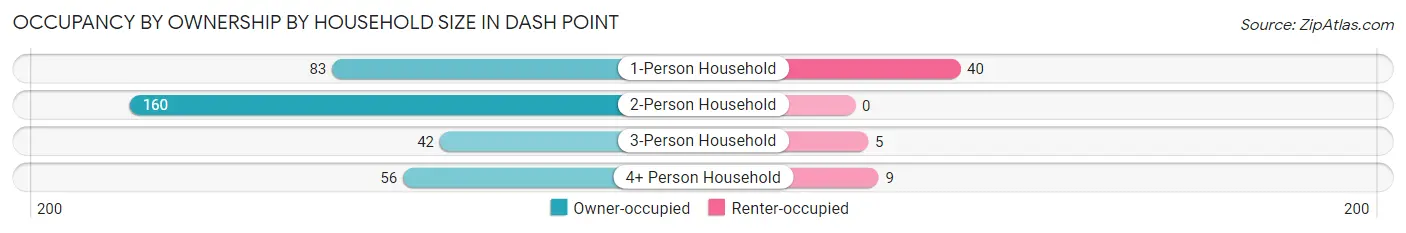
| Household Size | Owner-occupied | Renter-occupied |
| 1-Person Household | 83 (67.5%) | 40 (32.5%) |
| 2-Person Household | 160 (100.0%) | 0 (0.0%) |
| 3-Person Household | 42 (89.4%) | 5 (10.6%) |
| 4+ Person Household | 56 (86.2%) | 9 (13.9%) |
| Total Housing Units | 341 (86.3%) | 54 (13.7%) |
Occupancy by Educational Attainment in Dash Point
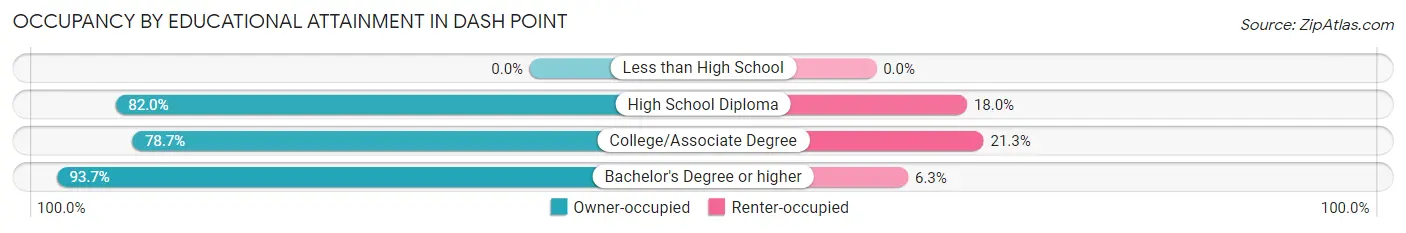
| Household Size | Owner-occupied | Renter-occupied |
| Less than High School | 0 (0.0%) | 0 (0.0%) |
| High School Diploma | 41 (82.0%) | 9 (18.0%) |
| College/Associate Degree | 122 (78.7%) | 33 (21.3%) |
| Bachelor's Degree or higher | 178 (93.7%) | 12 (6.3%) |
Occupancy by Age of Householder in Dash Point
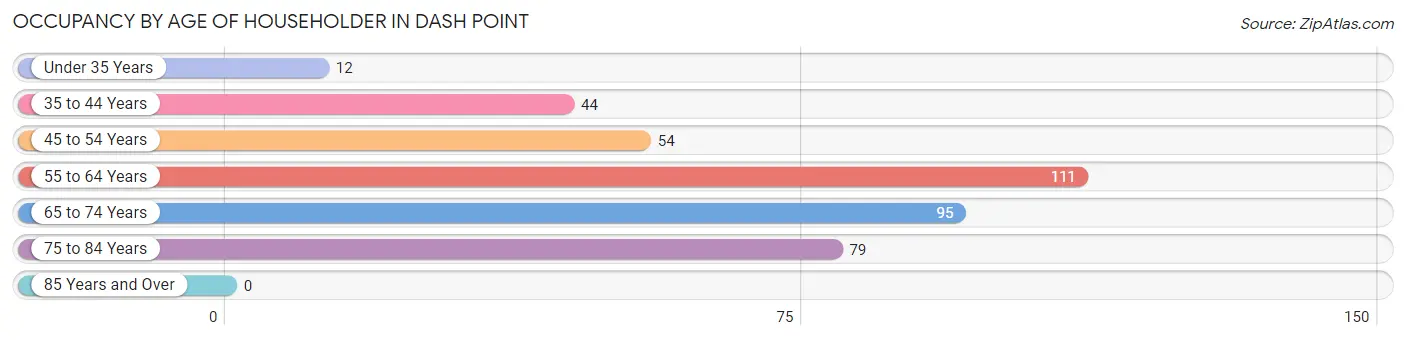
| Age Bracket | # Households | % Households |
| Under 35 Years | 12 | 3.0% |
| 35 to 44 Years | 44 | 11.1% |
| 45 to 54 Years | 54 | 13.7% |
| 55 to 64 Years | 111 | 28.1% |
| 65 to 74 Years | 95 | 24.0% |
| 75 to 84 Years | 79 | 20.0% |
| 85 Years and Over | 0 | 0.0% |
| Total | 395 | 100.0% |
Housing Finances in Dash Point
Median Income by Occupancy in Dash Point
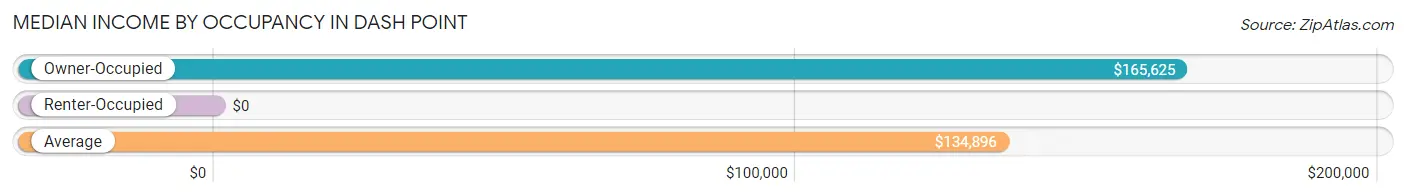
| Occupancy Type | # Households | Median Income |
| Owner-Occupied | 341 (86.3%) | $165,625 |
| Renter-Occupied | 54 (13.7%) | $0 |
| Average | 395 (100.0%) | $134,896 |
Occupancy by Householder Income Bracket in Dash Point
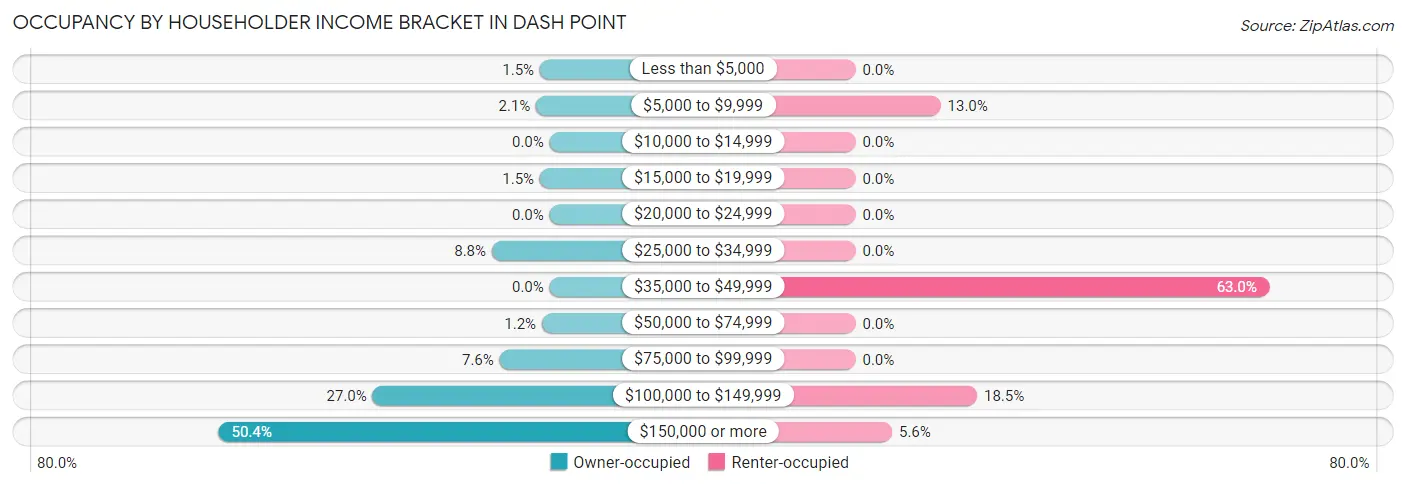
| Income Bracket | Owner-occupied | Renter-occupied |
| Less than $5,000 | 5 (1.5%) | 0 (0.0%) |
| $5,000 to $9,999 | 7 (2.1%) | 7 (13.0%) |
| $10,000 to $14,999 | 0 (0.0%) | 0 (0.0%) |
| $15,000 to $19,999 | 5 (1.5%) | 0 (0.0%) |
| $20,000 to $24,999 | 0 (0.0%) | 0 (0.0%) |
| $25,000 to $34,999 | 30 (8.8%) | 0 (0.0%) |
| $35,000 to $49,999 | 0 (0.0%) | 34 (63.0%) |
| $50,000 to $74,999 | 4 (1.2%) | 0 (0.0%) |
| $75,000 to $99,999 | 26 (7.6%) | 0 (0.0%) |
| $100,000 to $149,999 | 92 (27.0%) | 10 (18.5%) |
| $150,000 or more | 172 (50.4%) | 3 (5.6%) |
| Total | 341 (100.0%) | 54 (100.0%) |
Monthly Housing Cost Tiers in Dash Point
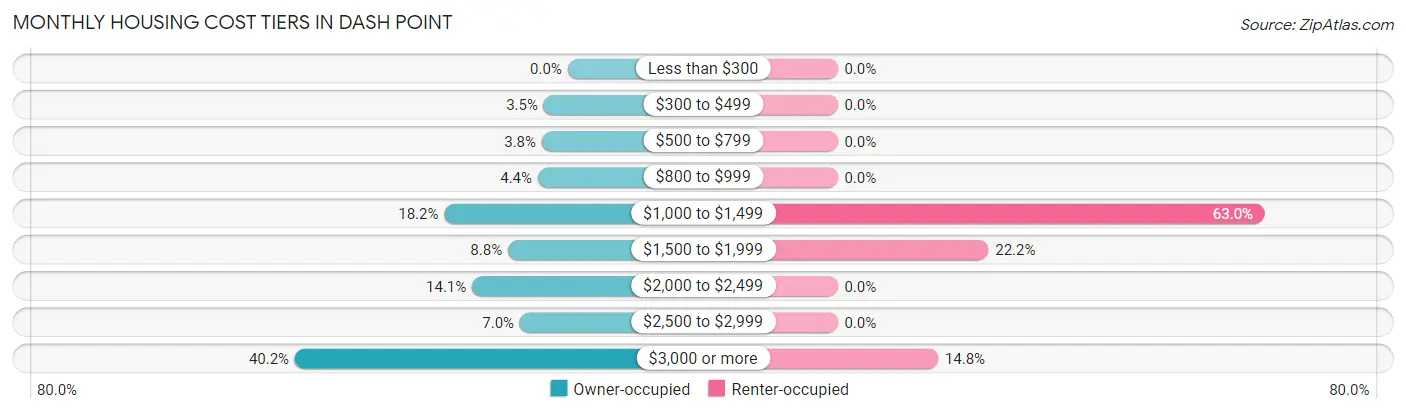
| Monthly Cost | Owner-occupied | Renter-occupied |
| Less than $300 | 0 (0.0%) | 0 (0.0%) |
| $300 to $499 | 12 (3.5%) | 0 (0.0%) |
| $500 to $799 | 13 (3.8%) | 0 (0.0%) |
| $800 to $999 | 15 (4.4%) | 0 (0.0%) |
| $1,000 to $1,499 | 62 (18.2%) | 34 (63.0%) |
| $1,500 to $1,999 | 30 (8.8%) | 12 (22.2%) |
| $2,000 to $2,499 | 48 (14.1%) | 0 (0.0%) |
| $2,500 to $2,999 | 24 (7.0%) | 0 (0.0%) |
| $3,000 or more | 137 (40.2%) | 8 (14.8%) |
| Total | 341 (100.0%) | 54 (100.0%) |
Physical Housing Characteristics in Dash Point
Housing Structures in Dash Point
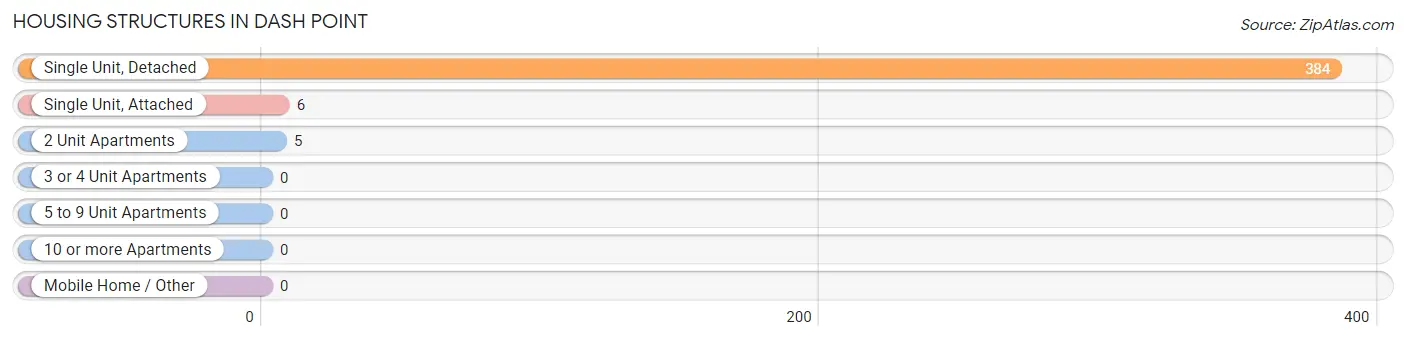
| Structure Type | # Housing Units | % Housing Units |
| Single Unit, Detached | 384 | 97.2% |
| Single Unit, Attached | 6 | 1.5% |
| 2 Unit Apartments | 5 | 1.3% |
| 3 or 4 Unit Apartments | 0 | 0.0% |
| 5 to 9 Unit Apartments | 0 | 0.0% |
| 10 or more Apartments | 0 | 0.0% |
| Mobile Home / Other | 0 | 0.0% |
| Total | 395 | 100.0% |
Housing Structures by Occupancy in Dash Point
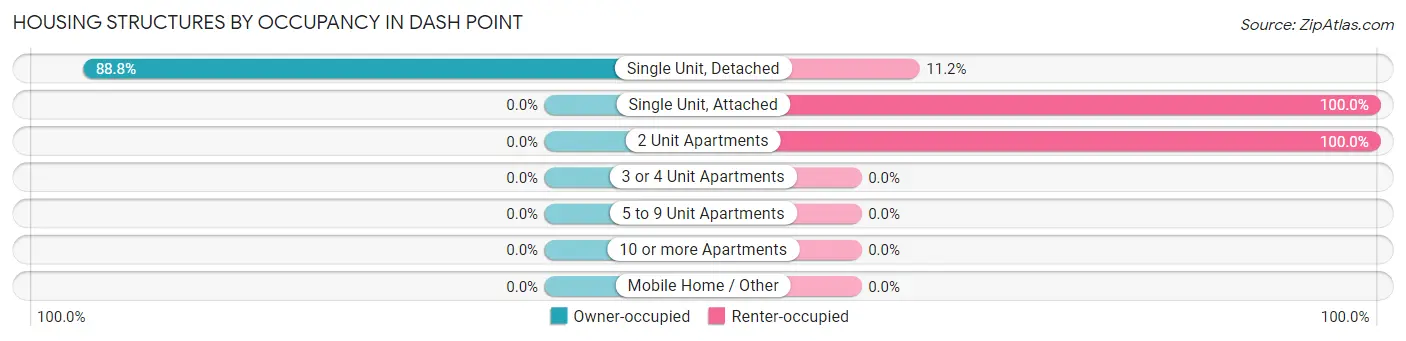
| Structure Type | Owner-occupied | Renter-occupied |
| Single Unit, Detached | 341 (88.8%) | 43 (11.2%) |
| Single Unit, Attached | 0 (0.0%) | 6 (100.0%) |
| 2 Unit Apartments | 0 (0.0%) | 5 (100.0%) |
| 3 or 4 Unit Apartments | 0 (0.0%) | 0 (0.0%) |
| 5 to 9 Unit Apartments | 0 (0.0%) | 0 (0.0%) |
| 10 or more Apartments | 0 (0.0%) | 0 (0.0%) |
| Mobile Home / Other | 0 (0.0%) | 0 (0.0%) |
| Total | 341 (86.3%) | 54 (13.7%) |
Housing Structures by Number of Rooms in Dash Point
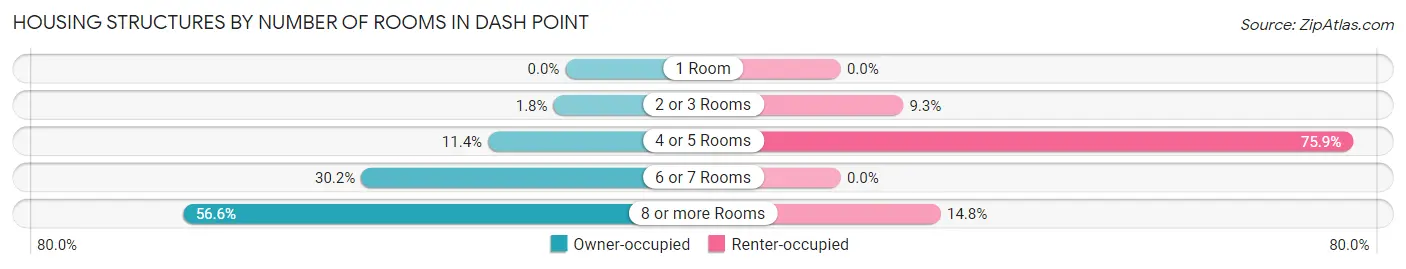
| Number of Rooms | Owner-occupied | Renter-occupied |
| 1 Room | 0 (0.0%) | 0 (0.0%) |
| 2 or 3 Rooms | 6 (1.8%) | 5 (9.3%) |
| 4 or 5 Rooms | 39 (11.4%) | 41 (75.9%) |
| 6 or 7 Rooms | 103 (30.2%) | 0 (0.0%) |
| 8 or more Rooms | 193 (56.6%) | 8 (14.8%) |
| Total | 341 (100.0%) | 54 (100.0%) |
Housing Structure by Heating Type in Dash Point
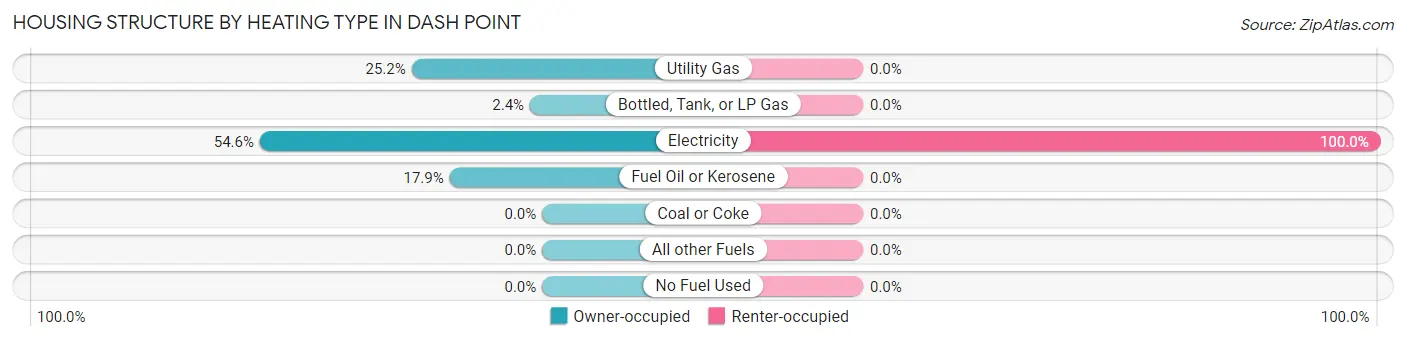
| Heating Type | Owner-occupied | Renter-occupied |
| Utility Gas | 86 (25.2%) | 0 (0.0%) |
| Bottled, Tank, or LP Gas | 8 (2.4%) | 0 (0.0%) |
| Electricity | 186 (54.5%) | 54 (100.0%) |
| Fuel Oil or Kerosene | 61 (17.9%) | 0 (0.0%) |
| Coal or Coke | 0 (0.0%) | 0 (0.0%) |
| All other Fuels | 0 (0.0%) | 0 (0.0%) |
| No Fuel Used | 0 (0.0%) | 0 (0.0%) |
| Total | 341 (100.0%) | 54 (100.0%) |
Household Vehicle Usage in Dash Point
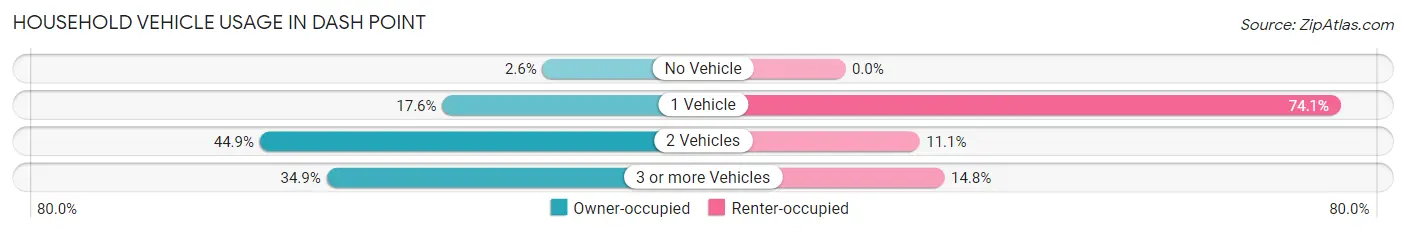
| Vehicles per Household | Owner-occupied | Renter-occupied |
| No Vehicle | 9 (2.6%) | 0 (0.0%) |
| 1 Vehicle | 60 (17.6%) | 40 (74.1%) |
| 2 Vehicles | 153 (44.9%) | 6 (11.1%) |
| 3 or more Vehicles | 119 (34.9%) | 8 (14.8%) |
| Total | 341 (100.0%) | 54 (100.0%) |
Real Estate & Mortgages in Dash Point
Real Estate and Mortgage Overview in Dash Point
| Characteristic | Without Mortgage | With Mortgage |
| Housing Units | 97 | 244 |
| Median Property Value | $806,500 | $836,100 |
| Median Household Income | $127,679 | $143 |
| Monthly Housing Costs | $1,145 | $137 |
| Real Estate Taxes | $7,542 | $0 |
Property Value by Mortgage Status in Dash Point
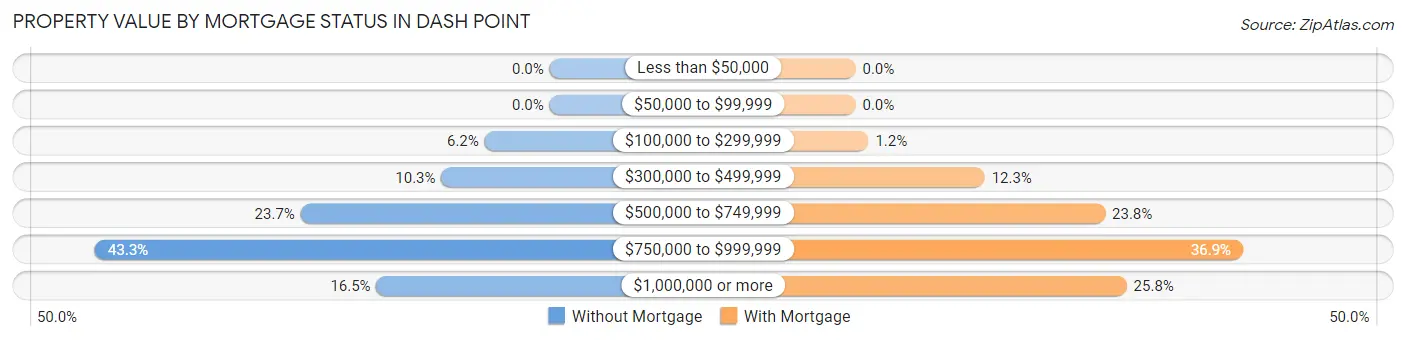
| Property Value | Without Mortgage | With Mortgage |
| Less than $50,000 | 0 (0.0%) | 0 (0.0%) |
| $50,000 to $99,999 | 0 (0.0%) | 0 (0.0%) |
| $100,000 to $299,999 | 6 (6.2%) | 3 (1.2%) |
| $300,000 to $499,999 | 10 (10.3%) | 30 (12.3%) |
| $500,000 to $749,999 | 23 (23.7%) | 58 (23.8%) |
| $750,000 to $999,999 | 42 (43.3%) | 90 (36.9%) |
| $1,000,000 or more | 16 (16.5%) | 63 (25.8%) |
| Total | 97 (100.0%) | 244 (100.0%) |
Household Income by Mortgage Status in Dash Point
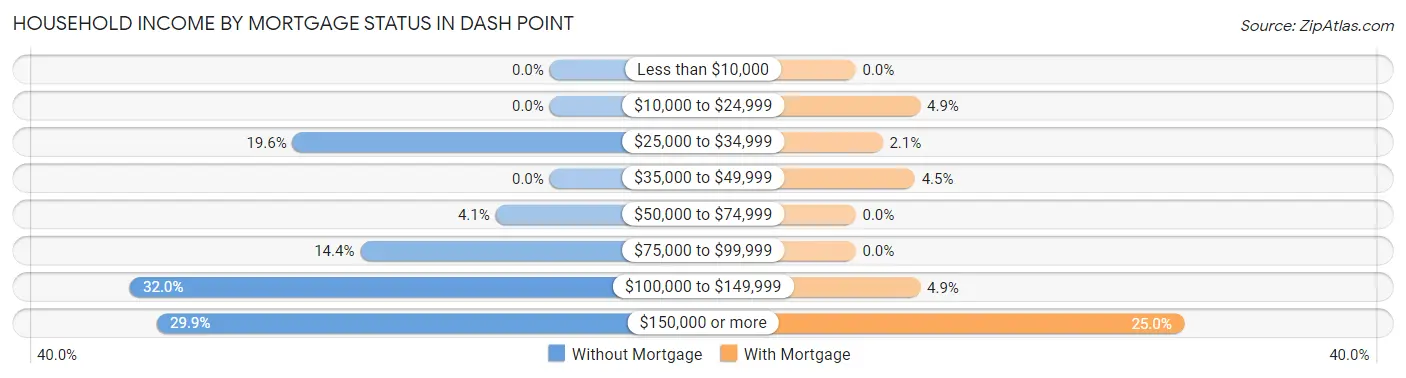
| Household Income | Without Mortgage | With Mortgage |
| Less than $10,000 | 0 (0.0%) | 0 (0.0%) |
| $10,000 to $24,999 | 0 (0.0%) | 12 (4.9%) |
| $25,000 to $34,999 | 19 (19.6%) | 5 (2.1%) |
| $35,000 to $49,999 | 0 (0.0%) | 11 (4.5%) |
| $50,000 to $74,999 | 4 (4.1%) | 0 (0.0%) |
| $75,000 to $99,999 | 14 (14.4%) | 0 (0.0%) |
| $100,000 to $149,999 | 31 (32.0%) | 12 (4.9%) |
| $150,000 or more | 29 (29.9%) | 61 (25.0%) |
| Total | 97 (100.0%) | 244 (100.0%) |
Property Value to Household Income Ratio in Dash Point
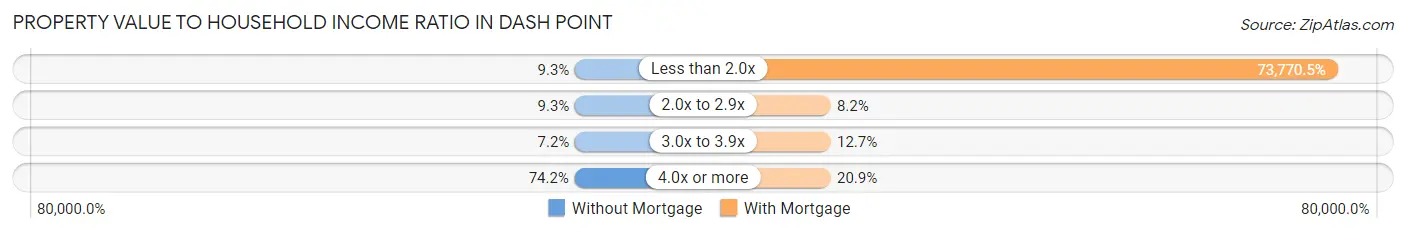
| Value-to-Income Ratio | Without Mortgage | With Mortgage |
| Less than 2.0x | 9 (9.3%) | 180,000 (73,770.5%) |
| 2.0x to 2.9x | 9 (9.3%) | 20 (8.2%) |
| 3.0x to 3.9x | 7 (7.2%) | 31 (12.7%) |
| 4.0x or more | 72 (74.2%) | 51 (20.9%) |
| Total | 97 (100.0%) | 244 (100.0%) |
Real Estate Taxes by Mortgage Status in Dash Point
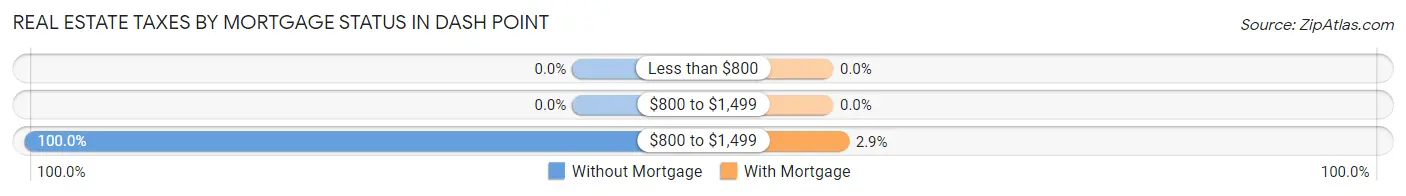
| Property Taxes | Without Mortgage | With Mortgage |
| Less than $800 | 0 (0.0%) | 0 (0.0%) |
| $800 to $1,499 | 0 (0.0%) | 0 (0.0%) |
| $800 to $1,499 | 97 (100.0%) | 7 (2.9%) |
| Total | 97 (100.0%) | 244 (100.0%) |
Health & Disability in Dash Point
Health Insurance Coverage by Age in Dash Point
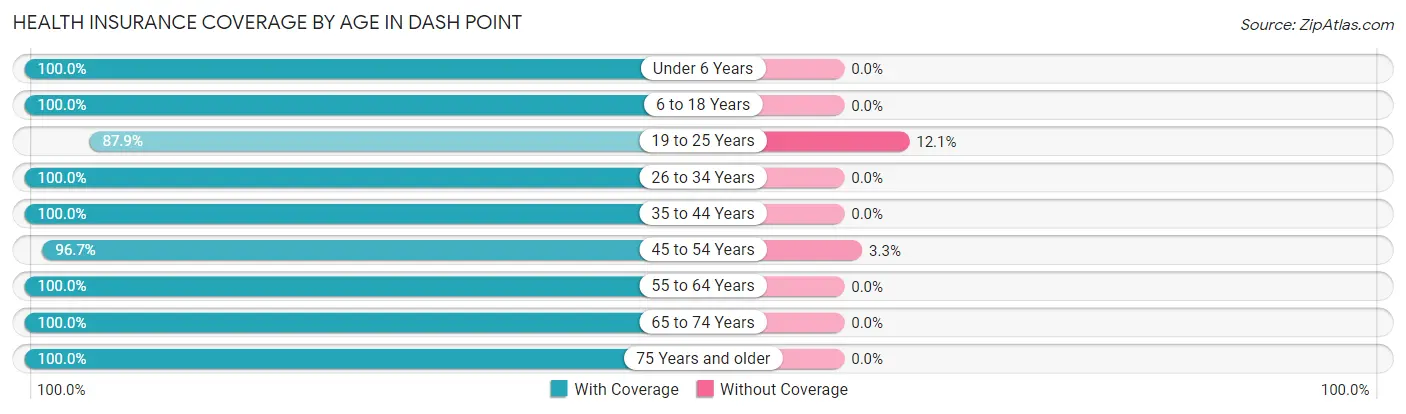
| Age Bracket | With Coverage | Without Coverage |
| Under 6 Years | 45 (100.0%) | 0 (0.0%) |
| 6 to 18 Years | 118 (100.0%) | 0 (0.0%) |
| 19 to 25 Years | 29 (87.9%) | 4 (12.1%) |
| 26 to 34 Years | 49 (100.0%) | 0 (0.0%) |
| 35 to 44 Years | 114 (100.0%) | 0 (0.0%) |
| 45 to 54 Years | 87 (96.7%) | 3 (3.3%) |
| 55 to 64 Years | 193 (100.0%) | 0 (0.0%) |
| 65 to 74 Years | 166 (100.0%) | 0 (0.0%) |
| 75 Years and older | 115 (100.0%) | 0 (0.0%) |
| Total | 916 (99.2%) | 7 (0.8%) |
Health Insurance Coverage by Citizenship Status in Dash Point
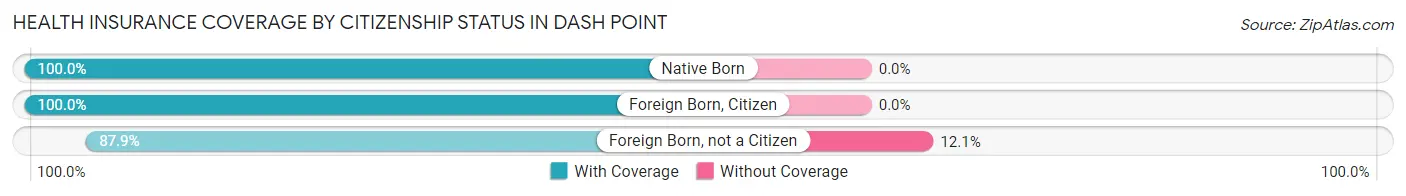
| Citizenship Status | With Coverage | Without Coverage |
| Native Born | 45 (100.0%) | 0 (0.0%) |
| Foreign Born, Citizen | 118 (100.0%) | 0 (0.0%) |
| Foreign Born, not a Citizen | 29 (87.9%) | 4 (12.1%) |
Health Insurance Coverage by Household Income in Dash Point
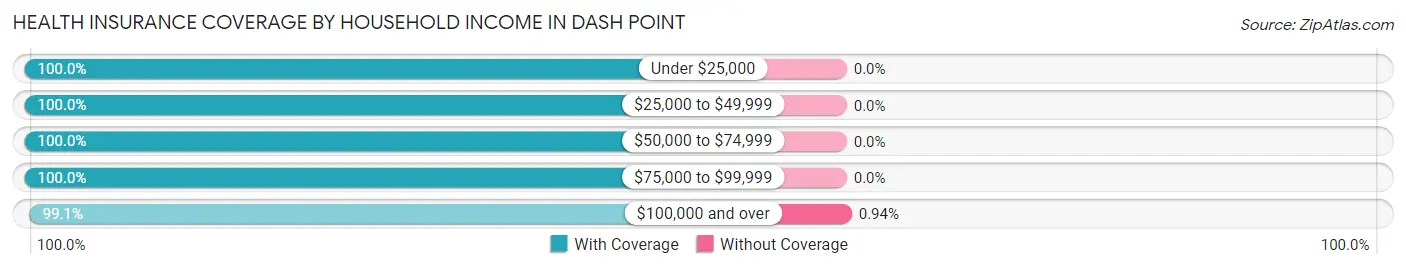
| Household Income | With Coverage | Without Coverage |
| Under $25,000 | 29 (100.0%) | 0 (0.0%) |
| $25,000 to $49,999 | 92 (100.0%) | 0 (0.0%) |
| $50,000 to $74,999 | 4 (100.0%) | 0 (0.0%) |
| $75,000 to $99,999 | 53 (100.0%) | 0 (0.0%) |
| $100,000 and over | 738 (99.1%) | 7 (0.9%) |
Public vs Private Health Insurance Coverage by Age in Dash Point
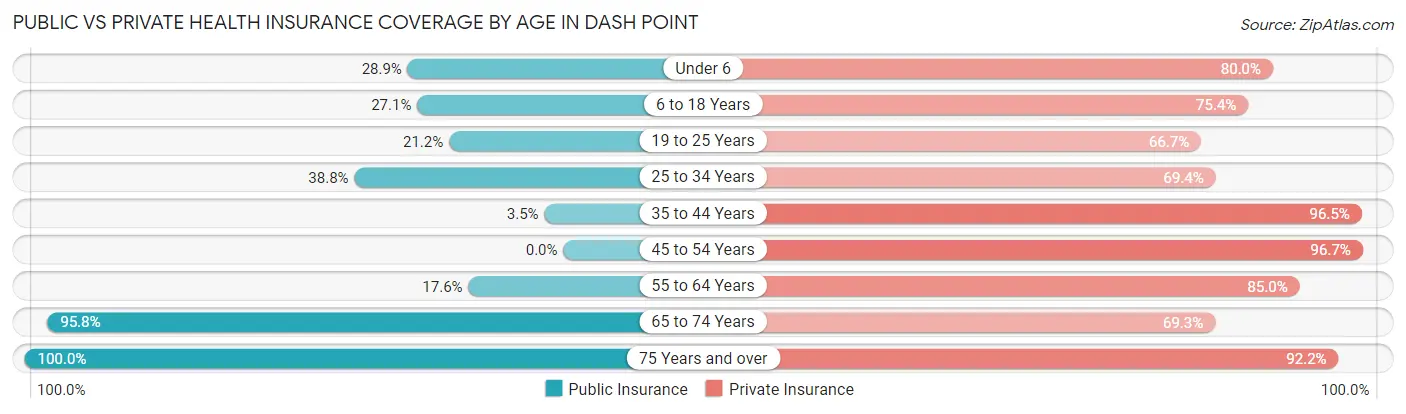
| Age Bracket | Public Insurance | Private Insurance |
| Under 6 | 13 (28.9%) | 36 (80.0%) |
| 6 to 18 Years | 32 (27.1%) | 89 (75.4%) |
| 19 to 25 Years | 7 (21.2%) | 22 (66.7%) |
| 25 to 34 Years | 19 (38.8%) | 34 (69.4%) |
| 35 to 44 Years | 4 (3.5%) | 110 (96.5%) |
| 45 to 54 Years | 0 (0.0%) | 87 (96.7%) |
| 55 to 64 Years | 34 (17.6%) | 164 (85.0%) |
| 65 to 74 Years | 159 (95.8%) | 115 (69.3%) |
| 75 Years and over | 115 (100.0%) | 106 (92.2%) |
| Total | 383 (41.5%) | 763 (82.7%) |
Disability Status by Sex by Age in Dash Point
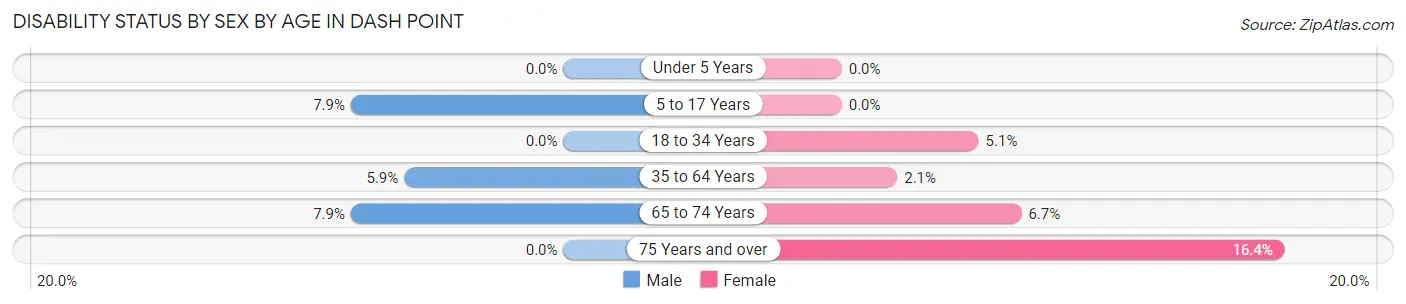
| Age Bracket | Male | Female |
| Under 5 Years | 0 (0.0%) | 0 (0.0%) |
| 5 to 17 Years | 3 (7.9%) | 0 (0.0%) |
| 18 to 34 Years | 0 (0.0%) | 3 (5.1%) |
| 35 to 64 Years | 12 (5.9%) | 4 (2.1%) |
| 65 to 74 Years | 6 (7.9%) | 6 (6.7%) |
| 75 Years and over | 0 (0.0%) | 12 (16.4%) |
Disability Class by Sex by Age in Dash Point
Disability Class: Hearing Difficulty
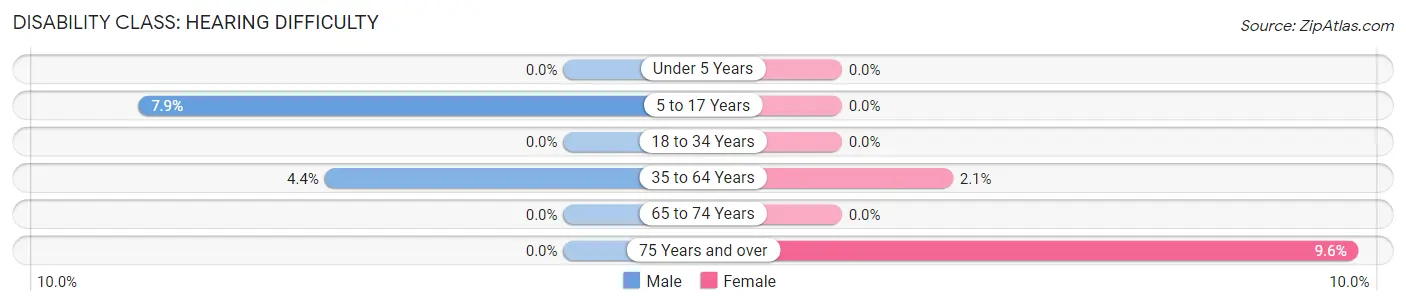
| Age Bracket | Male | Female |
| Under 5 Years | 0 (0.0%) | 0 (0.0%) |
| 5 to 17 Years | 3 (7.9%) | 0 (0.0%) |
| 18 to 34 Years | 0 (0.0%) | 0 (0.0%) |
| 35 to 64 Years | 9 (4.4%) | 4 (2.1%) |
| 65 to 74 Years | 0 (0.0%) | 0 (0.0%) |
| 75 Years and over | 0 (0.0%) | 7 (9.6%) |
Disability Class: Vision Difficulty
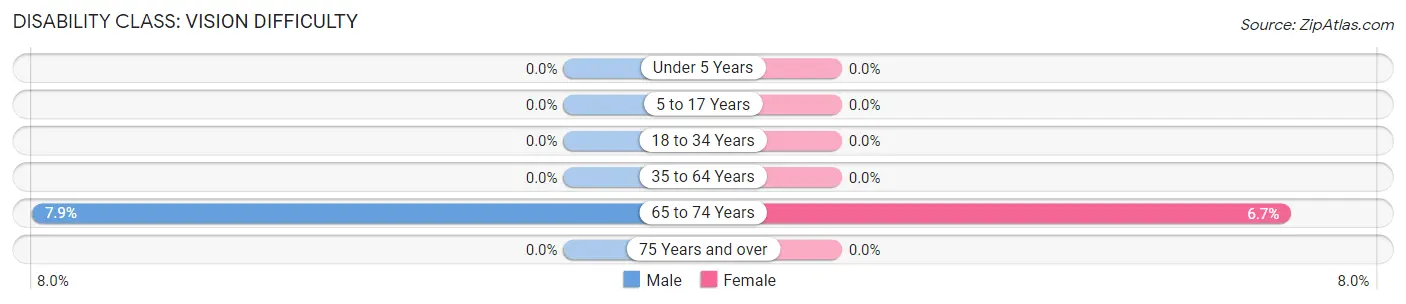
| Age Bracket | Male | Female |
| Under 5 Years | 0 (0.0%) | 0 (0.0%) |
| 5 to 17 Years | 0 (0.0%) | 0 (0.0%) |
| 18 to 34 Years | 0 (0.0%) | 0 (0.0%) |
| 35 to 64 Years | 0 (0.0%) | 0 (0.0%) |
| 65 to 74 Years | 6 (7.9%) | 6 (6.7%) |
| 75 Years and over | 0 (0.0%) | 0 (0.0%) |
Disability Class: Cognitive Difficulty
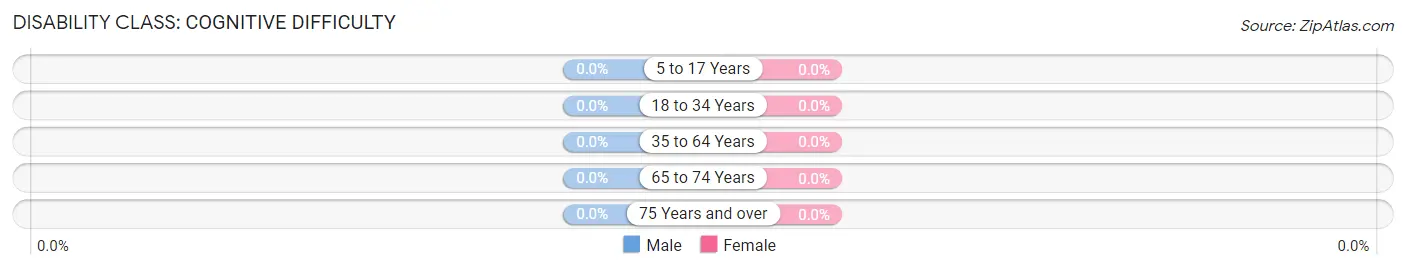
| Age Bracket | Male | Female |
| 5 to 17 Years | 0 (0.0%) | 0 (0.0%) |
| 18 to 34 Years | 0 (0.0%) | 0 (0.0%) |
| 35 to 64 Years | 0 (0.0%) | 0 (0.0%) |
| 65 to 74 Years | 0 (0.0%) | 0 (0.0%) |
| 75 Years and over | 0 (0.0%) | 0 (0.0%) |
Disability Class: Ambulatory Difficulty
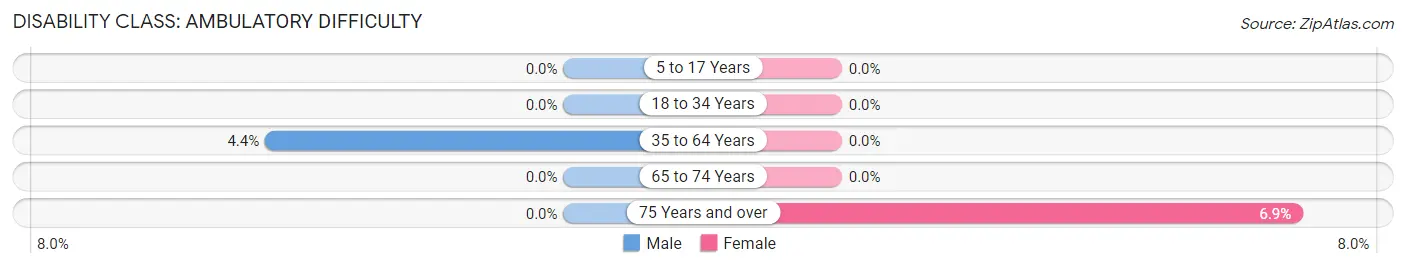
| Age Bracket | Male | Female |
| 5 to 17 Years | 0 (0.0%) | 0 (0.0%) |
| 18 to 34 Years | 0 (0.0%) | 0 (0.0%) |
| 35 to 64 Years | 9 (4.4%) | 0 (0.0%) |
| 65 to 74 Years | 0 (0.0%) | 0 (0.0%) |
| 75 Years and over | 0 (0.0%) | 5 (6.9%) |
Disability Class: Self-Care Difficulty
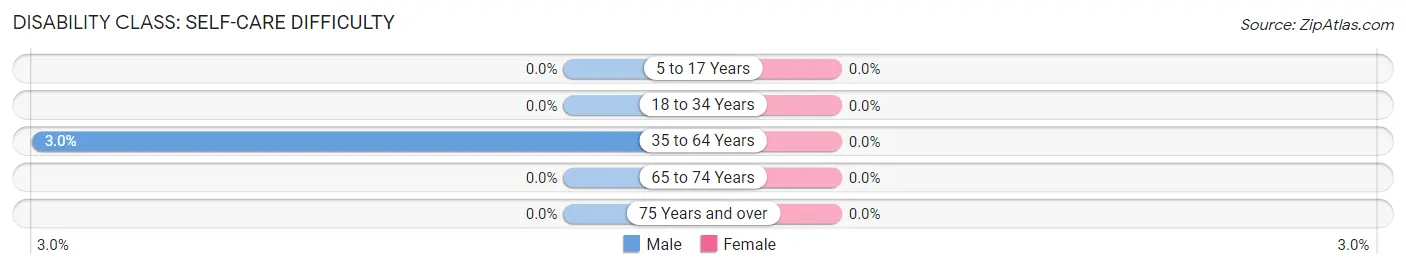
| Age Bracket | Male | Female |
| 5 to 17 Years | 0 (0.0%) | 0 (0.0%) |
| 18 to 34 Years | 0 (0.0%) | 0 (0.0%) |
| 35 to 64 Years | 6 (3.0%) | 0 (0.0%) |
| 65 to 74 Years | 0 (0.0%) | 0 (0.0%) |
| 75 Years and over | 0 (0.0%) | 0 (0.0%) |
Technology Access in Dash Point
Computing Device Access in Dash Point
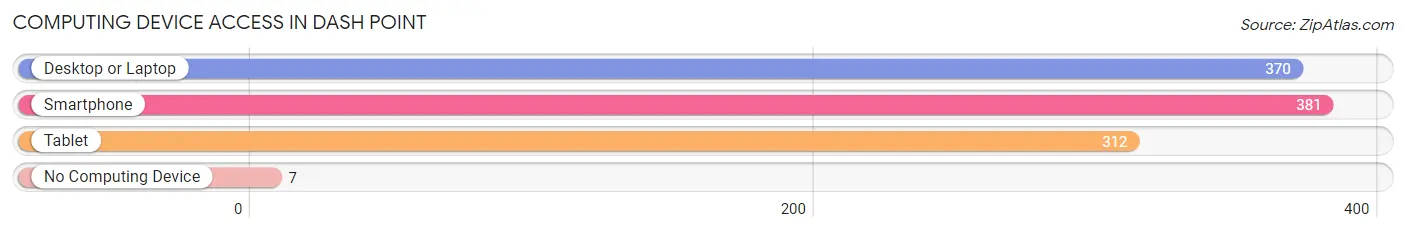
| Device Type | # Households | % Households |
| Desktop or Laptop | 370 | 93.7% |
| Smartphone | 381 | 96.5% |
| Tablet | 312 | 79.0% |
| No Computing Device | 7 | 1.8% |
| Total | 395 | 100.0% |
Internet Access in Dash Point
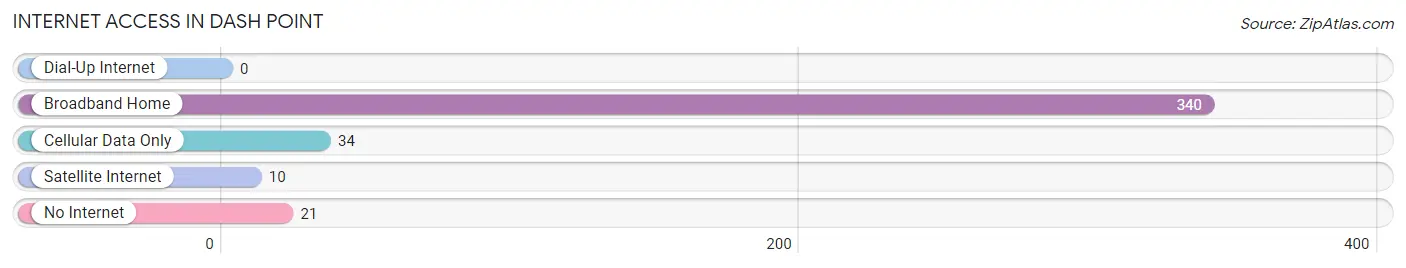
| Internet Type | # Households | % Households |
| Dial-Up Internet | 0 | 0.0% |
| Broadband Home | 340 | 86.1% |
| Cellular Data Only | 34 | 8.6% |
| Satellite Internet | 10 | 2.5% |
| No Internet | 21 | 5.3% |
| Total | 395 | 100.0% |
Dash Point Summary
Point, WA is a small unincorporated community located in King County, Washington. It is situated on the Puget Sound, just north of Tacoma and south of Seattle. The area is known for its beautiful beaches, lush forests, and stunning views of the Olympic Mountains.
History
The area now known as Dash Point was first inhabited by the Nisqually people, who lived in the area for thousands of years before the arrival of European settlers. The first recorded European settler in the area was William Dash, who arrived in 1854 and established a homestead. The area was named after him, and the name was officially adopted in 1891.
In the early 1900s, the area began to develop as a resort destination. The first hotel was built in 1906, and the area soon became a popular spot for fishing, boating, and swimming. The area was also home to a number of logging camps, which provided employment for many of the local residents.
Geography
Dash Point is located on the Puget Sound, just north of Tacoma and south of Seattle. The area is known for its beautiful beaches, lush forests, and stunning views of the Olympic Mountains. The area is also home to a number of parks, including Dash Point State Park, which offers camping, hiking, and other outdoor activities.
Economy
The economy of Dash Point is largely based on tourism and recreation. The area is home to a number of hotels, restaurants, and other businesses that cater to visitors. The area is also home to a number of marinas, which provide services for boaters. In addition, the area is home to a number of small businesses, including retail stores, art galleries, and other services.
Demographics
As of the 2010 census, the population of Dash Point was 4,719. The population is largely white (90.2%), with a small percentage of African Americans (2.2%), Asians (2.1%), and other races (5.5%). The median household income in the area is $63,945, and the median home value is $323,400.
Conclusion
Dash Point, WA is a small unincorporated community located in King County, Washington. It is situated on the Puget Sound, just north of Tacoma and south of Seattle. The area is known for its beautiful beaches, lush forests, and stunning views of the Olympic Mountains. The economy of Dash Point is largely based on tourism and recreation, and the population is largely white. The area is home to a number of parks, hotels, restaurants, and other businesses that cater to visitors.
Common Questions
What is Per Capita Income in Dash Point?
Per Capita income in Dash Point is $76,851.
What is the Median Family Income in Dash Point?
Median Family Income in Dash Point is $176,957.
What is the Median Household income in Dash Point?
Median Household Income in Dash Point is $134,896.
What is Income or Wage Gap in Dash Point?
Income or Wage Gap in Dash Point is 30.8%.
Women in Dash Point earn 69.2 cents for every dollar earned by a man.
What is Inequality or Gini Index in Dash Point?
Inequality or Gini Index in Dash Point is 0.43.
What is the Total Population of Dash Point?
Total Population of Dash Point is 923.
What is the Total Male Population of Dash Point?
Total Male Population of Dash Point is 433.
What is the Total Female Population of Dash Point?
Total Female Population of Dash Point is 490.
What is the Ratio of Males per 100 Females in Dash Point?
There are 88.37 Males per 100 Females in Dash Point.
What is the Ratio of Females per 100 Males in Dash Point?
There are 113.16 Females per 100 Males in Dash Point.
What is the Median Population Age in Dash Point?
Median Population Age in Dash Point is 56.3 Years.
What is the Average Family Size in Dash Point
Average Family Size in Dash Point is 2.9 People.
What is the Average Household Size in Dash Point
Average Household Size in Dash Point is 2.3 People.
How Large is the Labor Force in Dash Point?
There are 442 People in the Labor Forcein in Dash Point.
What is the Percentage of People in the Labor Force in Dash Point?
54.8% of People are in the Labor Force in Dash Point.
What is the Unemployment Rate in Dash Point?
Unemployment Rate in Dash Point is 4.3%.