Mckenna, WA Map & Demographics
Mckenna Map
Mckenna Overview
$55,349
PER CAPITA INCOME
$95,043
AVG FAMILY INCOME
$74,602
AVG HOUSEHOLD INCOME
0.56
INEQUALITY / GINI INDEX
554
TOTAL POPULATION
325
MALE POPULATION
229
FEMALE POPULATION
141.92
MALES / 100 FEMALES
70.46
FEMALES / 100 MALES
37.9
MEDIAN AGE
2.8
AVG FAMILY SIZE
2.6
AVG HOUSEHOLD SIZE
249
LABOR FORCE [ PEOPLE ]
56.1%
PERCENT IN LABOR FORCE
20.9%
UNEMPLOYMENT RATE
Mckenna Zip Codes
Income in Mckenna
Income Overview in Mckenna
Per Capita Income in Mckenna is $55,349, while median incomes of families and households are $95,043 and $74,602 respectively.
| Characteristic | Number | Measure |
| Per Capita Income | 554 | $55,349 |
| Median Family Income | 141 | $95,043 |
| Mean Family Income | 141 | $166,719 |
| Median Household Income | 193 | $74,602 |
| Mean Household Income | 193 | $140,176 |
| Income Deficit | 141 | $0 |
| Wage / Income Gap (%) | 554 | 0.00% |
| Wage / Income Gap ($) | 554 | 100.00¢ per $1 |
| Gini / Inequality Index | 554 | 0.56 |
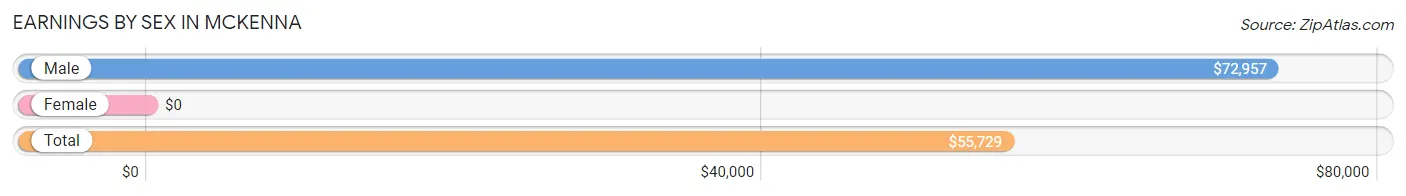
Earnings by Sex in Mckenna
| Sex | Number | Average Earnings |
| Male | 175 (67.6%) | $72,957 |
| Female | 84 (32.4%) | $0 |
| Total | 259 (100.0%) | $55,729 |
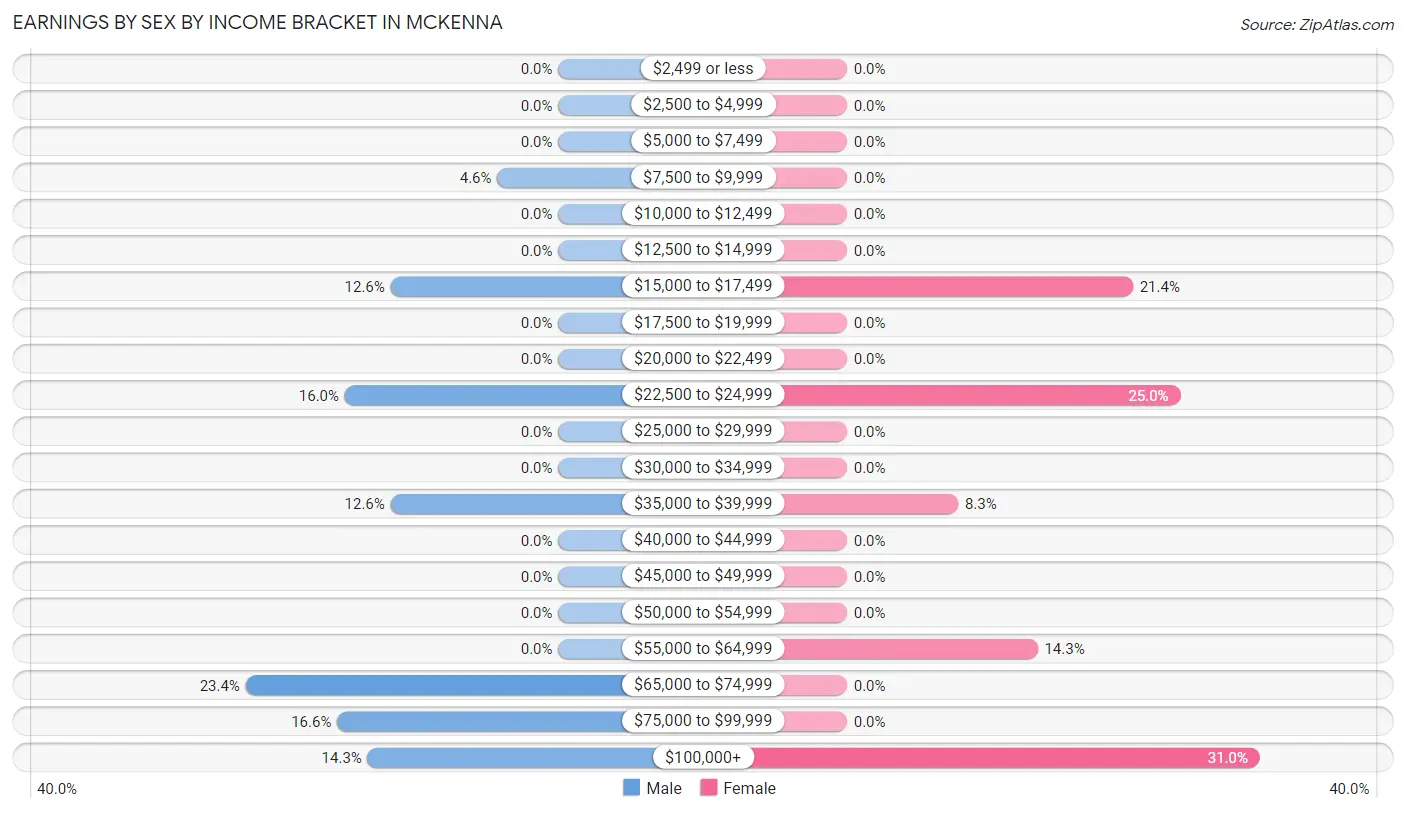
Earnings by Sex by Income Bracket in Mckenna
The most common earnings brackets in Mckenna are $65,000 to $74,999 for men (41 | 23.4%) and $100,000+ for women (26 | 30.9%).
| Income | Male | Female |
| $2,499 or less | 0 (0.0%) | 0 (0.0%) |
| $2,500 to $4,999 | 0 (0.0%) | 0 (0.0%) |
| $5,000 to $7,499 | 0 (0.0%) | 0 (0.0%) |
| $7,500 to $9,999 | 8 (4.6%) | 0 (0.0%) |
| $10,000 to $12,499 | 0 (0.0%) | 0 (0.0%) |
| $12,500 to $14,999 | 0 (0.0%) | 0 (0.0%) |
| $15,000 to $17,499 | 22 (12.6%) | 18 (21.4%) |
| $17,500 to $19,999 | 0 (0.0%) | 0 (0.0%) |
| $20,000 to $22,499 | 0 (0.0%) | 0 (0.0%) |
| $22,500 to $24,999 | 28 (16.0%) | 21 (25.0%) |
| $25,000 to $29,999 | 0 (0.0%) | 0 (0.0%) |
| $30,000 to $34,999 | 0 (0.0%) | 0 (0.0%) |
| $35,000 to $39,999 | 22 (12.6%) | 7 (8.3%) |
| $40,000 to $44,999 | 0 (0.0%) | 0 (0.0%) |
| $45,000 to $49,999 | 0 (0.0%) | 0 (0.0%) |
| $50,000 to $54,999 | 0 (0.0%) | 0 (0.0%) |
| $55,000 to $64,999 | 0 (0.0%) | 12 (14.3%) |
| $65,000 to $74,999 | 41 (23.4%) | 0 (0.0%) |
| $75,000 to $99,999 | 29 (16.6%) | 0 (0.0%) |
| $100,000+ | 25 (14.3%) | 26 (30.9%) |
| Total | 175 (100.0%) | 84 (100.0%) |
Earnings by Sex by Educational Attainment in Mckenna
| Educational Attainment | Male Income | Female Income |
| Less than High School | - | - |
| High School Diploma | - | - |
| College or Associate's Degree | - | - |
| Bachelor's Degree | - | - |
| Graduate Degree | - | - |
| Total | $73,811 | $0 |
Family Income in Mckenna
Family Income Brackets in Mckenna
According to the Mckenna family income data, there are 51 families falling into the $75,000 to $99,999 income range, which is the most common income bracket and makes up 36.2% of all families.
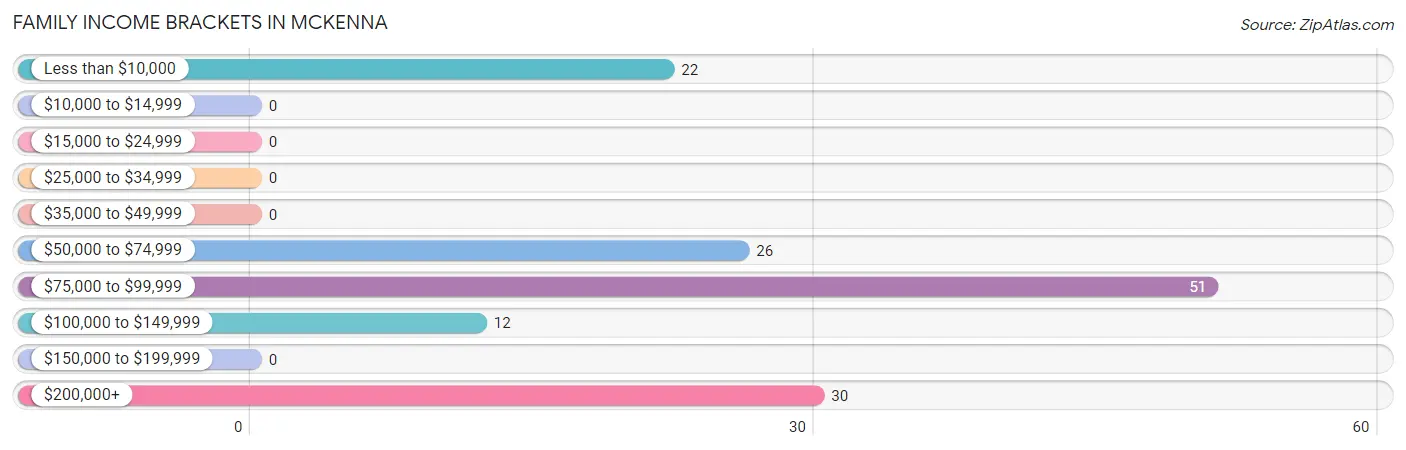
| Income Bracket | # Families | % Families |
| Less than $10,000 | 22 | 15.6% |
| $10,000 to $14,999 | 0 | 0.0% |
| $15,000 to $24,999 | 0 | 0.0% |
| $25,000 to $34,999 | 0 | 0.0% |
| $35,000 to $49,999 | 0 | 0.0% |
| $50,000 to $74,999 | 26 | 18.4% |
| $75,000 to $99,999 | 51 | 36.2% |
| $100,000 to $149,999 | 12 | 8.5% |
| $150,000 to $199,999 | 0 | 0.0% |
| $200,000+ | 30 | 21.3% |
Family Income by Famaliy Size in Mckenna
2-person families (74 | 52.5%) account for the highest median family income in Mckenna with $95,948 per family, while 2-person families (74 | 52.5%) have the highest median income of $47,974 per family member.
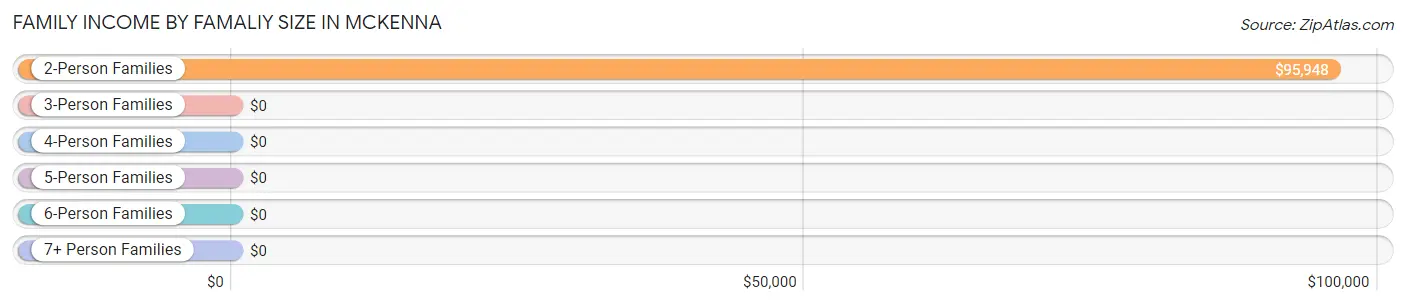
| Income Bracket | # Families | Median Income |
| 2-Person Families | 74 (52.5%) | $95,948 |
| 3-Person Families | 45 (31.9%) | $0 |
| 4-Person Families | 22 (15.6%) | $0 |
| 5-Person Families | 0 (0.0%) | $0 |
| 6-Person Families | 0 (0.0%) | $0 |
| 7+ Person Families | 0 (0.0%) | $0 |
| Total | 141 (100.0%) | $95,043 |
Family Income by Number of Earners in Mckenna
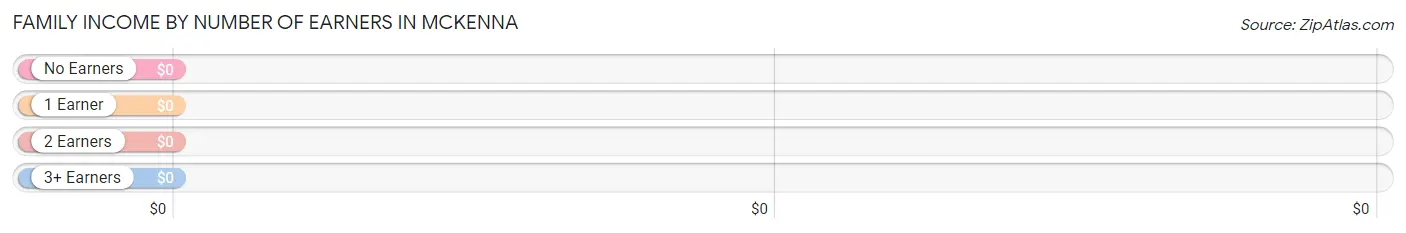
| Number of Earners | # Families | Median Income |
| No Earners | 48 (34.0%) | $0 |
| 1 Earner | 29 (20.6%) | $0 |
| 2 Earners | 19 (13.5%) | $0 |
| 3+ Earners | 45 (31.9%) | $0 |
| Total | 141 (100.0%) | $95,043 |
Household Income in Mckenna
Household Income Brackets in Mckenna
With 52 households falling in the category, the $15,000 to $24,999 income range is the most frequent in Mckenna, accounting for 26.9% of all households.
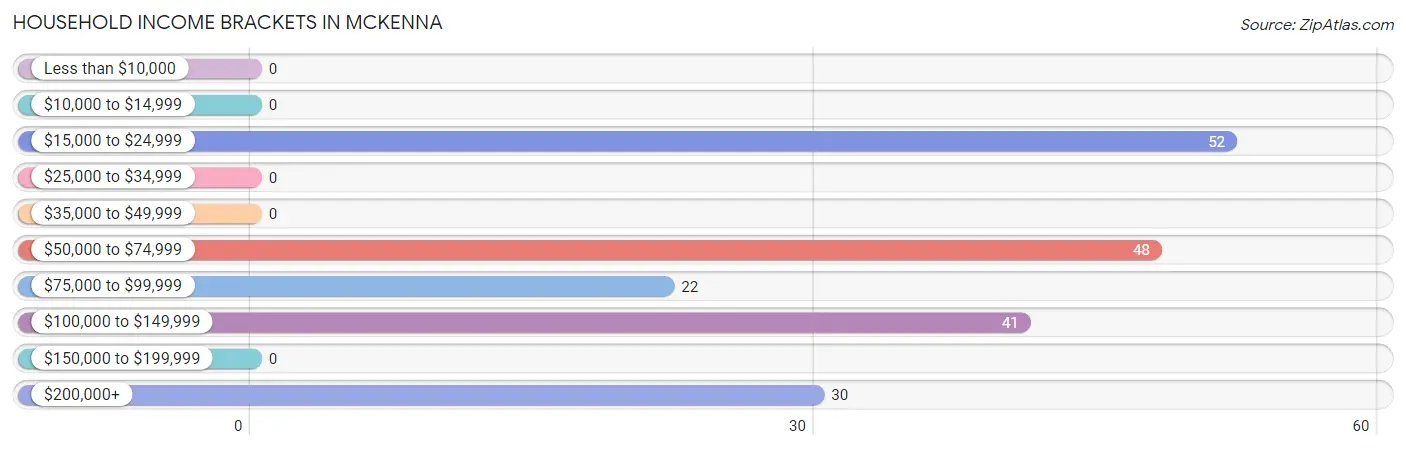
| Income Bracket | # Households | % Households |
| Less than $10,000 | 0 | 0.0% |
| $10,000 to $14,999 | 0 | 0.0% |
| $15,000 to $24,999 | 52 | 26.9% |
| $25,000 to $34,999 | 0 | 0.0% |
| $35,000 to $49,999 | 0 | 0.0% |
| $50,000 to $74,999 | 48 | 24.9% |
| $75,000 to $99,999 | 22 | 11.4% |
| $100,000 to $149,999 | 41 | 21.2% |
| $150,000 to $199,999 | 0 | 0.0% |
| $200,000+ | 30 | 15.5% |
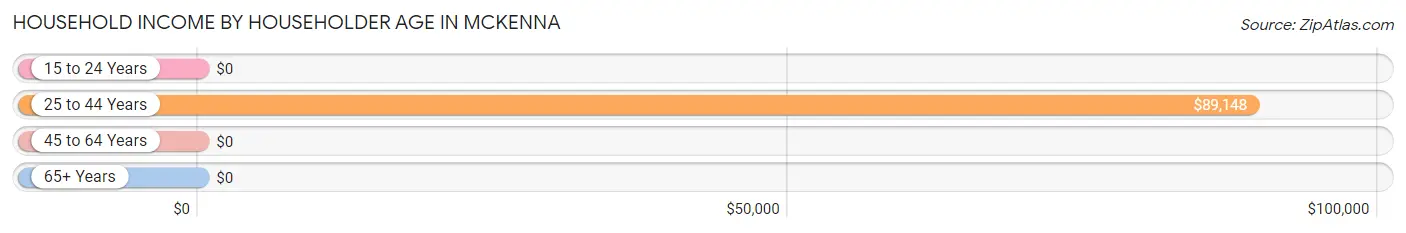
Household Income by Householder Age in Mckenna
The median household income in Mckenna is $74,602, with the highest median household income of $89,148 found in the 25 to 44 years age bracket for the primary householder. A total of 73 households (37.8%) fall into this category.
| Income Bracket | # Households | Median Income |
| 15 to 24 Years | 0 (0.0%) | $0 |
| 25 to 44 Years | 73 (37.8%) | $89,148 |
| 45 to 64 Years | 23 (11.9%) | $0 |
| 65+ Years | 97 (50.3%) | $0 |
| Total | 193 (100.0%) | $74,602 |
Poverty in Mckenna
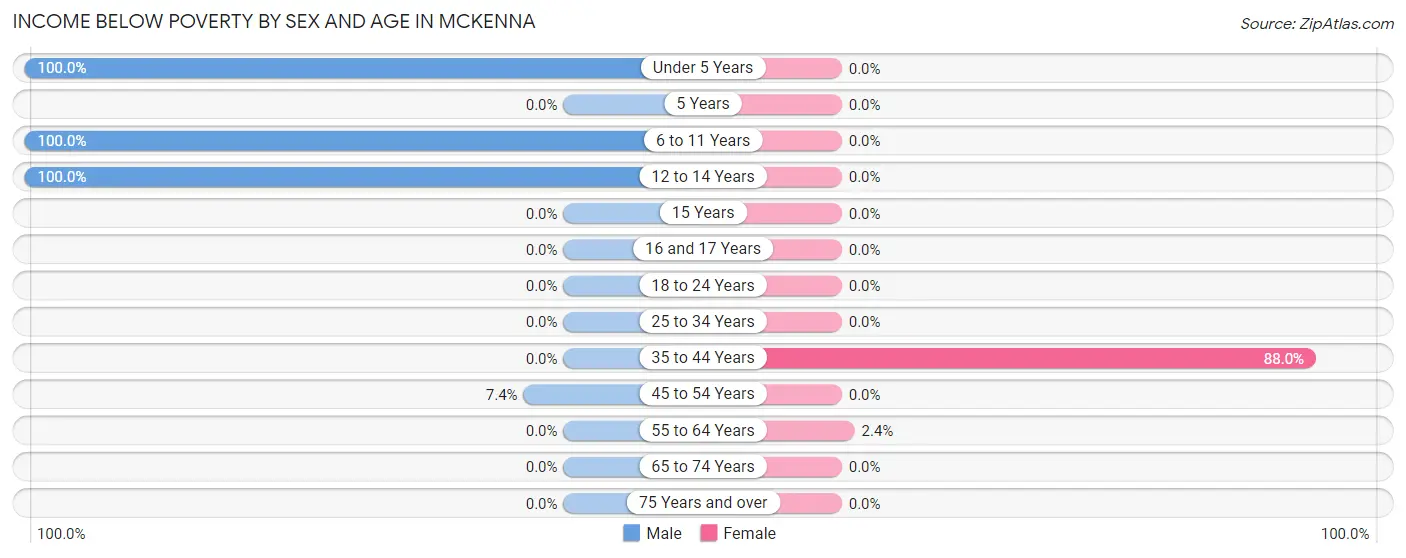
Income Below Poverty by Sex and Age in Mckenna
With 30.1% poverty level for males and 10.7% for females among the residents of Mckenna, under 5 year old males and 35 to 44 year old females are the most vulnerable to poverty, with 31 males (100.0%) and 22 females (88.0%) in their respective age groups living below the poverty level.
| Age Bracket | Male | Female |
| Under 5 Years | 31 (100.0%) | 0 (0.0%) |
| 5 Years | 0 (0.0%) | 0 (0.0%) |
| 6 to 11 Years | 27 (100.0%) | 0 (0.0%) |
| 12 to 14 Years | 27 (100.0%) | 0 (0.0%) |
| 15 Years | 0 (0.0%) | 0 (0.0%) |
| 16 and 17 Years | 0 (0.0%) | 0 (0.0%) |
| 18 to 24 Years | 0 (0.0%) | 0 (0.0%) |
| 25 to 34 Years | 0 (0.0%) | 0 (0.0%) |
| 35 to 44 Years | 0 (0.0%) | 22 (88.0%) |
| 45 to 54 Years | 2 (7.4%) | 0 (0.0%) |
| 55 to 64 Years | 0 (0.0%) | 1 (2.4%) |
| 65 to 74 Years | 0 (0.0%) | 0 (0.0%) |
| 75 Years and over | 0 (0.0%) | 0 (0.0%) |
| Total | 87 (30.1%) | 23 (10.7%) |
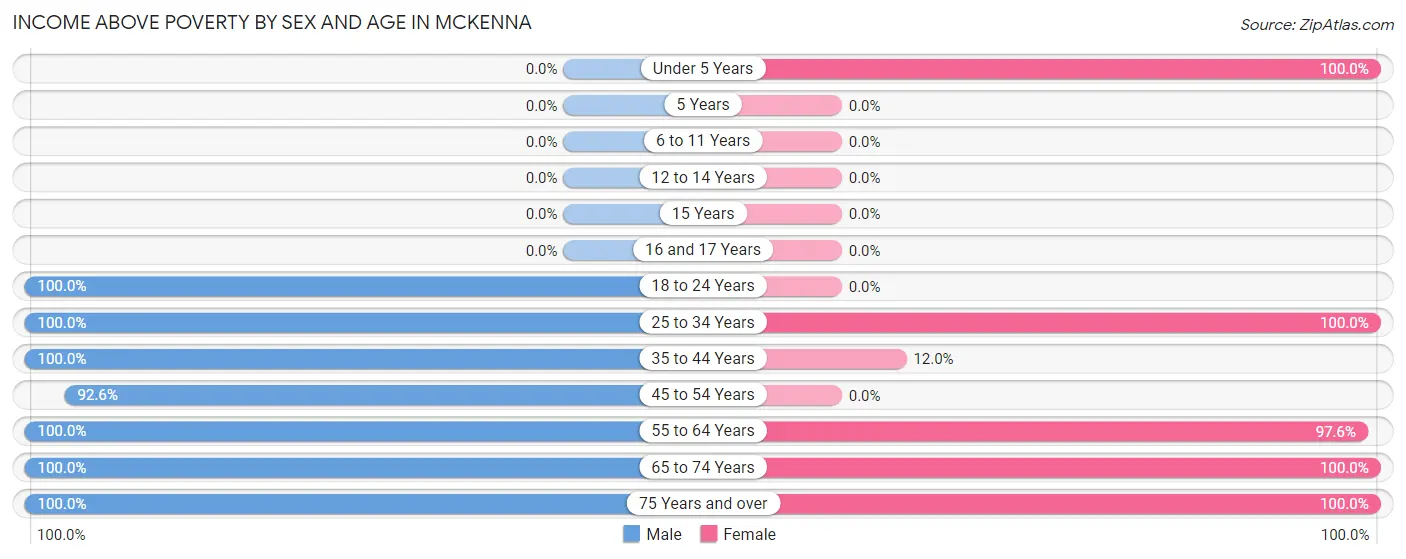
Income Above Poverty by Sex and Age in Mckenna
According to the poverty statistics in Mckenna, males aged 18 to 24 years and females aged under 5 years are the age groups that are most secure financially, with 100.0% of males and 100.0% of females in these age groups living above the poverty line.
| Age Bracket | Male | Female |
| Under 5 Years | 0 (0.0%) | 25 (100.0%) |
| 5 Years | 0 (0.0%) | 0 (0.0%) |
| 6 to 11 Years | 0 (0.0%) | 0 (0.0%) |
| 12 to 14 Years | 0 (0.0%) | 0 (0.0%) |
| 15 Years | 0 (0.0%) | 0 (0.0%) |
| 16 and 17 Years | 0 (0.0%) | 0 (0.0%) |
| 18 to 24 Years | 28 (100.0%) | 0 (0.0%) |
| 25 to 34 Years | 51 (100.0%) | 21 (100.0%) |
| 35 to 44 Years | 49 (100.0%) | 3 (12.0%) |
| 45 to 54 Years | 25 (92.6%) | 0 (0.0%) |
| 55 to 64 Years | 14 (100.0%) | 41 (97.6%) |
| 65 to 74 Years | 34 (100.0%) | 47 (100.0%) |
| 75 Years and over | 1 (100.0%) | 55 (100.0%) |
| Total | 202 (69.9%) | 192 (89.3%) |
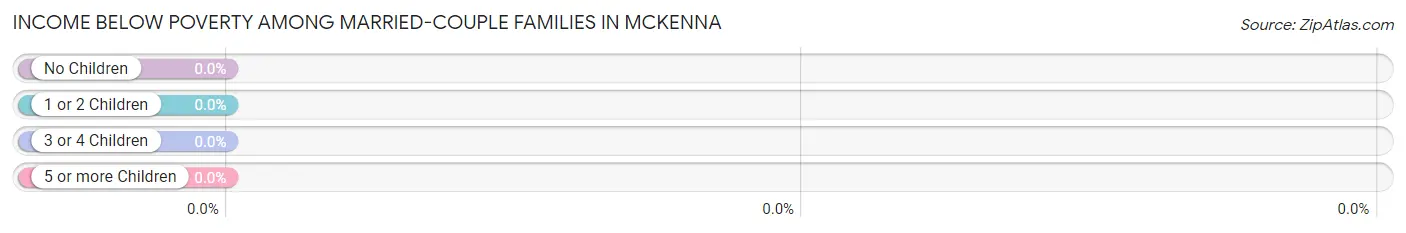
Income Below Poverty Among Married-Couple Families in Mckenna
| Children | Above Poverty | Below Poverty |
| No Children | 68 (100.0%) | 0 (0.0%) |
| 1 or 2 Children | 0 (0.0%) | 0 (0.0%) |
| 3 or 4 Children | 0 (0.0%) | 0 (0.0%) |
| 5 or more Children | 0 (0.0%) | 0 (0.0%) |
| Total | 68 (100.0%) | 0 (0.0%) |
Income Below Poverty Among Single-Parent Households in Mckenna
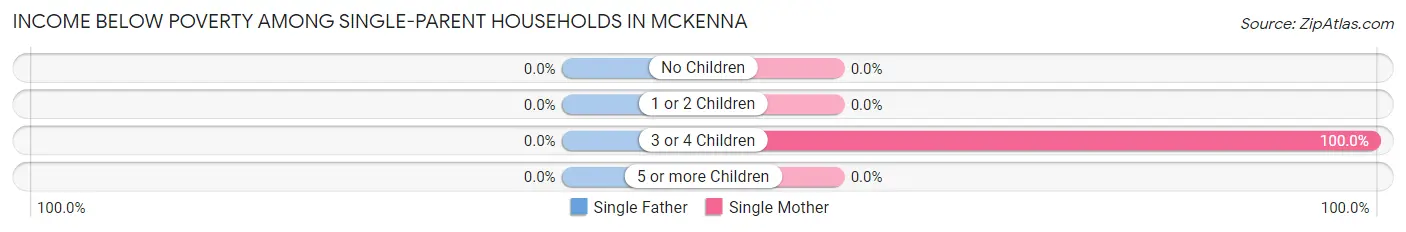
| Children | Single Father | Single Mother |
| No Children | 0 (0.0%) | 0 (0.0%) |
| 1 or 2 Children | 0 (0.0%) | 0 (0.0%) |
| 3 or 4 Children | 0 (0.0%) | 22 (100.0%) |
| 5 or more Children | 0 (0.0%) | 0 (0.0%) |
| Total | 0 (0.0%) | 22 (100.0%) |
Income Below Poverty Among Married-Couple vs Single-Parent Households in Mckenna
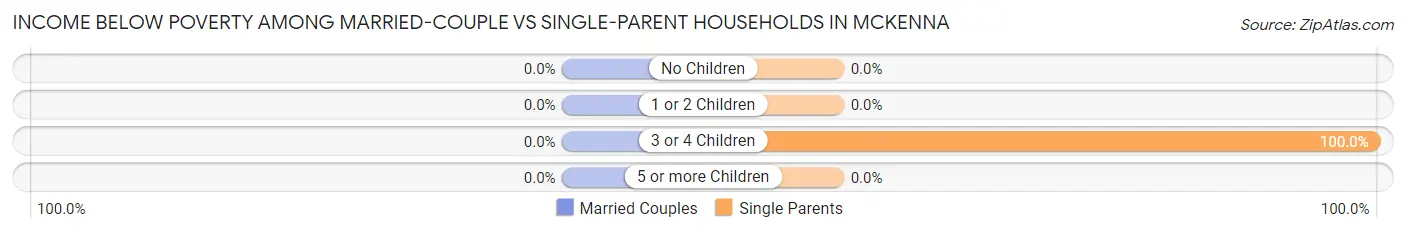
| Children | Married-Couple Families | Single-Parent Households |
| No Children | 0 (0.0%) | 0 (0.0%) |
| 1 or 2 Children | 0 (0.0%) | 0 (0.0%) |
| 3 or 4 Children | 0 (0.0%) | 22 (100.0%) |
| 5 or more Children | 0 (0.0%) | 0 (0.0%) |
| Total | 0 (0.0%) | 22 (30.1%) |
Race in Mckenna
The most populous races in Mckenna are White / Caucasian (424 | 76.5%), Hispanic or Latino (134 | 24.2%), and Two or more Races (103 | 18.6%).
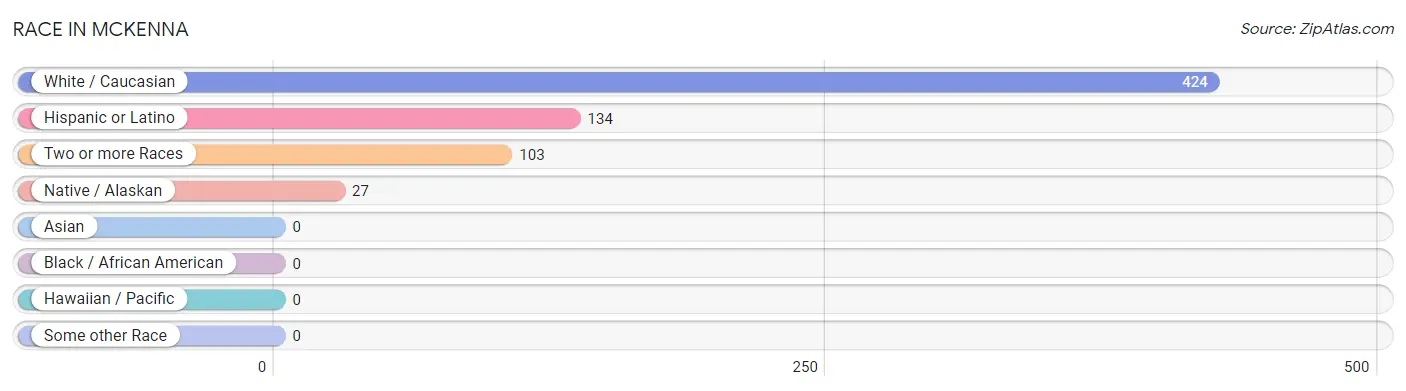
| Race | # Population | % Population |
| Asian | 0 | 0.0% |
| Black / African American | 0 | 0.0% |
| Hawaiian / Pacific | 0 | 0.0% |
| Hispanic or Latino | 134 | 24.2% |
| Native / Alaskan | 27 | 4.9% |
| White / Caucasian | 424 | 76.5% |
| Two or more Races | 103 | 18.6% |
| Some other Race | 0 | 0.0% |
| Total | 554 | 100.0% |
Ancestry in Mckenna
The most populous ancestries reported in Mckenna are Mexican (134 | 24.2%), German (117 | 21.1%), English (90 | 16.3%), Italian (72 | 13.0%), and Irish (52 | 9.4%), together accounting for 84.0% of all Mckenna residents.
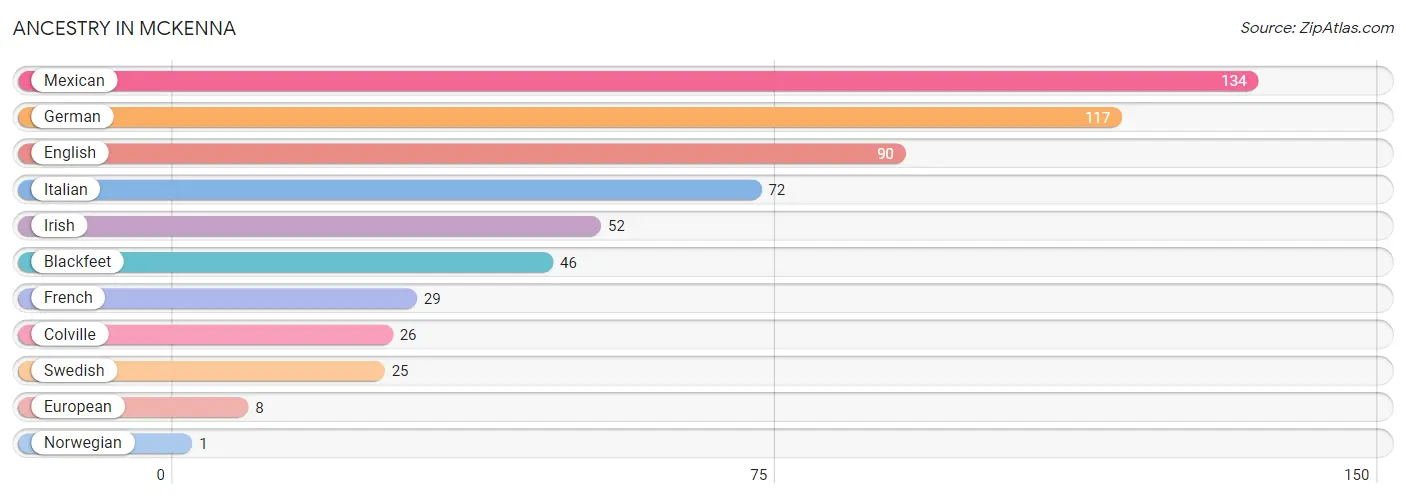
| Ancestry | # Population | % Population |
| Blackfeet | 46 | 8.3% |
| Colville | 26 | 4.7% |
| English | 90 | 16.3% |
| European | 8 | 1.4% |
| French | 29 | 5.2% |
| German | 117 | 21.1% |
| Irish | 52 | 9.4% |
| Italian | 72 | 13.0% |
| Mexican | 134 | 24.2% |
| Norwegian | 1 | 0.2% |
| Swedish | 25 | 4.5% | View All 11 Rows |
Immigrants in Mckenna
The most numerous immigrant groups reported in Mckenna came from Central America (49 | 8.8%), Latin America (49 | 8.8%), Mexico (49 | 8.8%), and Canada (3 | 0.5%), together accounting for 27.1% of all Mckenna residents.
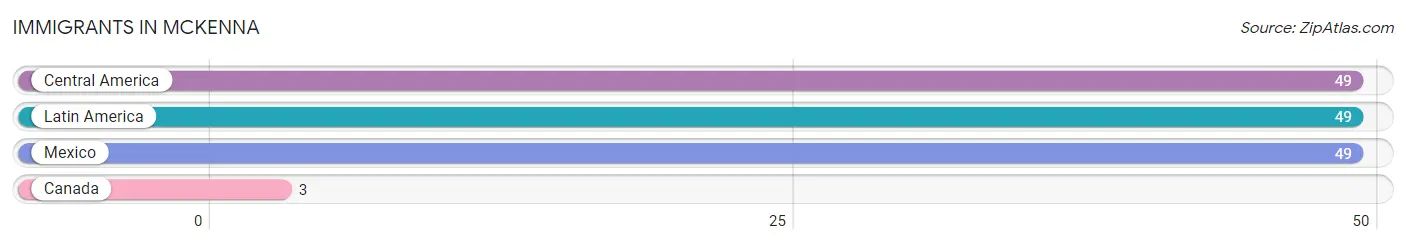
| Immigration Origin | # Population | % Population |
| Canada | 3 | 0.5% |
| Central America | 49 | 8.8% |
| Latin America | 49 | 8.8% |
| Mexico | 49 | 8.8% | View All 4 Rows |
Sex and Age in Mckenna
Sex and Age in Mckenna
The most populous age groups in Mckenna are 10 to 14 Years (54 | 16.6%) for men and 80 to 84 Years (52 | 22.7%) for women.
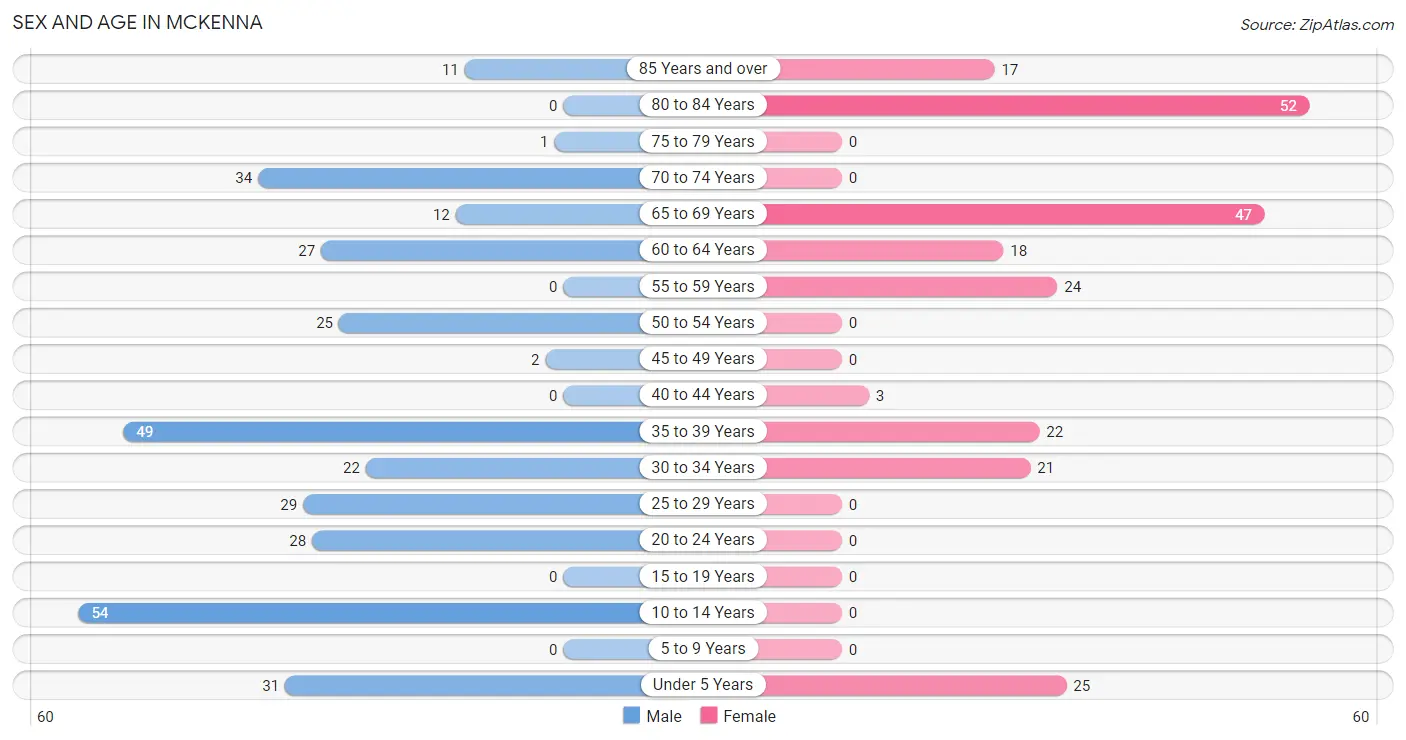
| Age Bracket | Male | Female |
| Under 5 Years | 31 (9.5%) | 25 (10.9%) |
| 5 to 9 Years | 0 (0.0%) | 0 (0.0%) |
| 10 to 14 Years | 54 (16.6%) | 0 (0.0%) |
| 15 to 19 Years | 0 (0.0%) | 0 (0.0%) |
| 20 to 24 Years | 28 (8.6%) | 0 (0.0%) |
| 25 to 29 Years | 29 (8.9%) | 0 (0.0%) |
| 30 to 34 Years | 22 (6.8%) | 21 (9.2%) |
| 35 to 39 Years | 49 (15.1%) | 22 (9.6%) |
| 40 to 44 Years | 0 (0.0%) | 3 (1.3%) |
| 45 to 49 Years | 2 (0.6%) | 0 (0.0%) |
| 50 to 54 Years | 25 (7.7%) | 0 (0.0%) |
| 55 to 59 Years | 0 (0.0%) | 24 (10.5%) |
| 60 to 64 Years | 27 (8.3%) | 18 (7.9%) |
| 65 to 69 Years | 12 (3.7%) | 47 (20.5%) |
| 70 to 74 Years | 34 (10.5%) | 0 (0.0%) |
| 75 to 79 Years | 1 (0.3%) | 0 (0.0%) |
| 80 to 84 Years | 0 (0.0%) | 52 (22.7%) |
| 85 Years and over | 11 (3.4%) | 17 (7.4%) |
| Total | 325 (100.0%) | 229 (100.0%) |
Families and Households in Mckenna
Median Family Size in Mckenna
The median family size in Mckenna is 2.79 persons per family, with single female/mother families (22 | 15.6%) accounting for the largest median family size of 4.86 persons per family. On the other hand, single male/father families (51 | 36.2%) represent the smallest median family size with 2.27 persons per family.
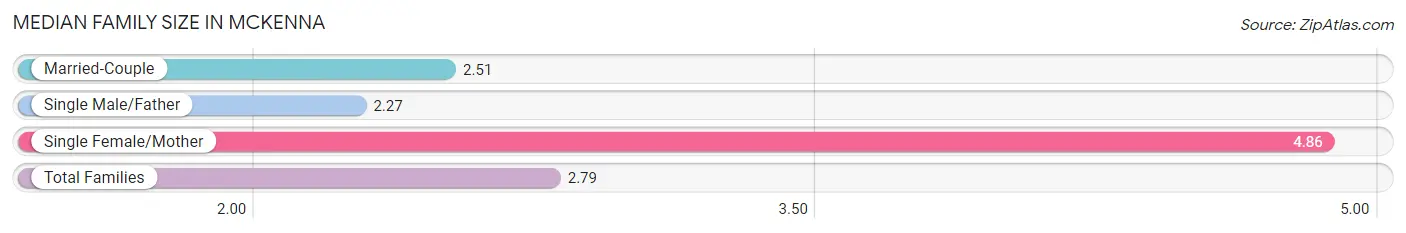
| Family Type | # Families | Family Size |
| Married-Couple | 68 (48.2%) | 2.51 |
| Single Male/Father | 51 (36.2%) | 2.27 |
| Single Female/Mother | 22 (15.6%) | 4.86 |
| Total Families | 141 (100.0%) | 2.79 |
Median Household Size in Mckenna
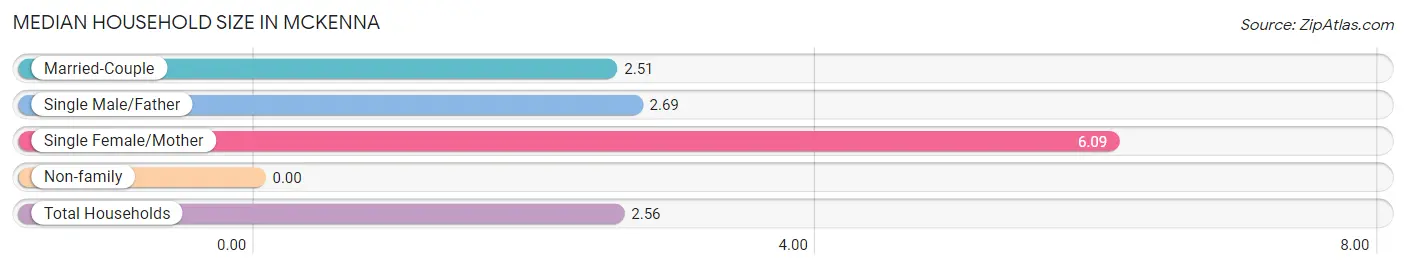
| Household Type | # Households | Household Size |
| Married-Couple | 68 (35.2%) | 2.51 |
| Single Male/Father | 51 (26.4%) | 2.69 |
| Single Female/Mother | 22 (11.4%) | 6.09 |
| Non-family | 52 (26.9%) | - |
| Total Households | 193 (100.0%) | 2.56 |
Household Size by Marriage Status in Mckenna
Out of a total of 193 households in Mckenna, 141 (73.1%) are family households, while 52 (26.9%) are nonfamily households. The most numerous type of family households are 3-person households, comprising 74, and the most common type of nonfamily households are 1-person households, comprising 52.
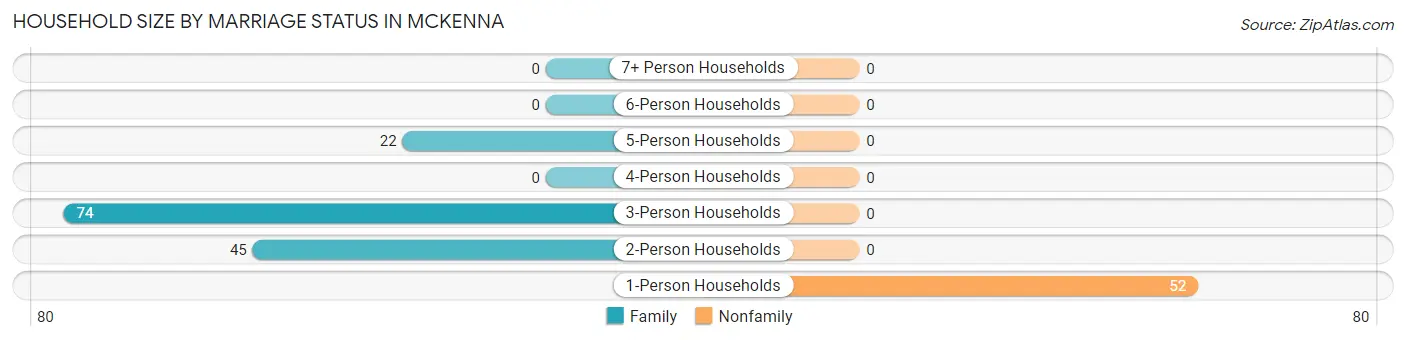
| Household Size | Family Households | Nonfamily Households |
| 1-Person Households | - | 52 (26.9%) |
| 2-Person Households | 45 (23.3%) | 0 (0.0%) |
| 3-Person Households | 74 (38.3%) | 0 (0.0%) |
| 4-Person Households | 0 (0.0%) | 0 (0.0%) |
| 5-Person Households | 22 (11.4%) | 0 (0.0%) |
| 6-Person Households | 0 (0.0%) | 0 (0.0%) |
| 7+ Person Households | 0 (0.0%) | 0 (0.0%) |
| Total | 141 (73.1%) | 52 (26.9%) |
Female Fertility in Mckenna
Fertility by Age in Mckenna
Average fertility rate in Mckenna is 457.0 births per 1,000 women. Women in the age bracket of 20 to 34 years have the highest fertility rate with 1,000.0 births per 1,000 women. Women in the age bracket of 20 to 34 years acount for 100.0% of all women with births.
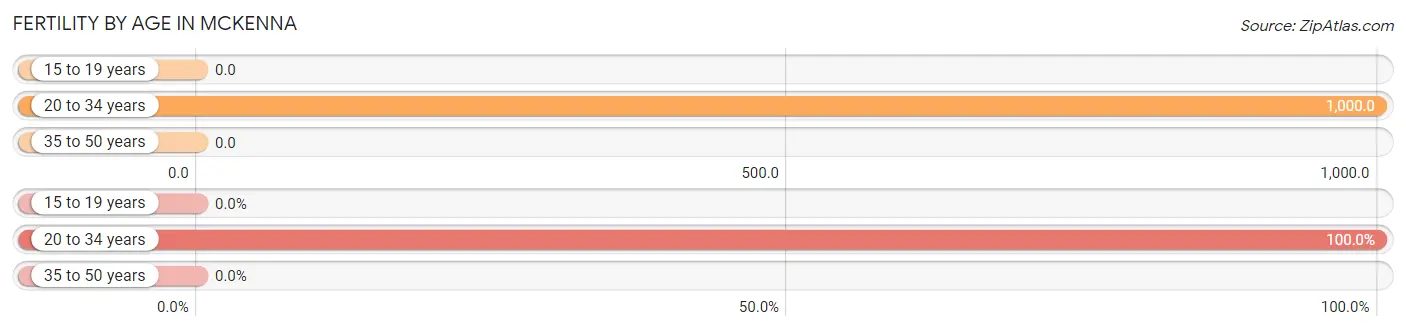
| Age Bracket | Women with Births | Births / 1,000 Women |
| 15 to 19 years | 0 (0.0%) | 0.0 |
| 20 to 34 years | 21 (100.0%) | 1,000.0 |
| 35 to 50 years | 0 (0.0%) | 0.0 |
| Total | 21 (100.0%) | 457.0 |
Fertility by Age by Marriage Status in Mckenna
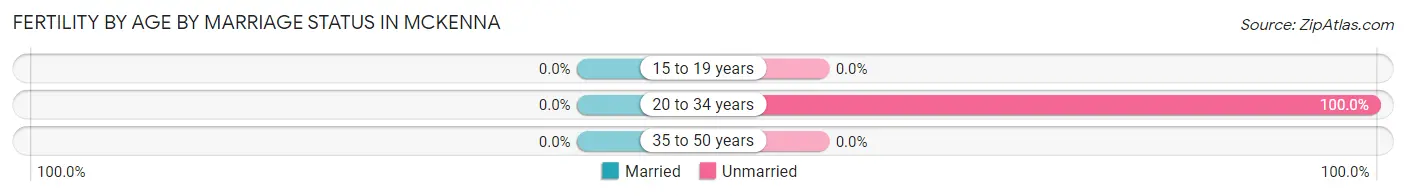
| Age Bracket | Married | Unmarried |
| 15 to 19 years | 0 (0.0%) | 0 (0.0%) |
| 20 to 34 years | 0 (0.0%) | 21 (100.0%) |
| 35 to 50 years | 0 (0.0%) | 0 (0.0%) |
| Total | 0 (0.0%) | 21 (100.0%) |
Fertility by Education in Mckenna
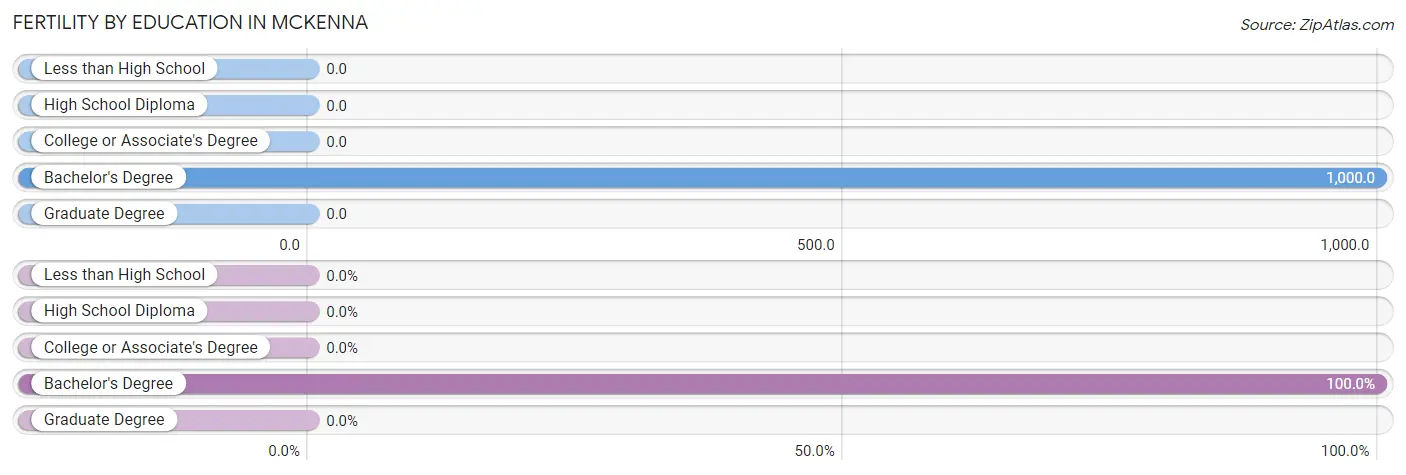
| Educational Attainment | Women with Births | Births / 1,000 Women |
| Less than High School | 0 (0.0%) | 0.0 |
| High School Diploma | 0 (0.0%) | 0.0 |
| College or Associate's Degree | 0 (0.0%) | 0.0 |
| Bachelor's Degree | 21 (100.0%) | 1,000.0 |
| Graduate Degree | 0 (0.0%) | 0.0 |
| Total | 21 (100.0%) | 457.0 |
Fertility by Education by Marriage Status in Mckenna
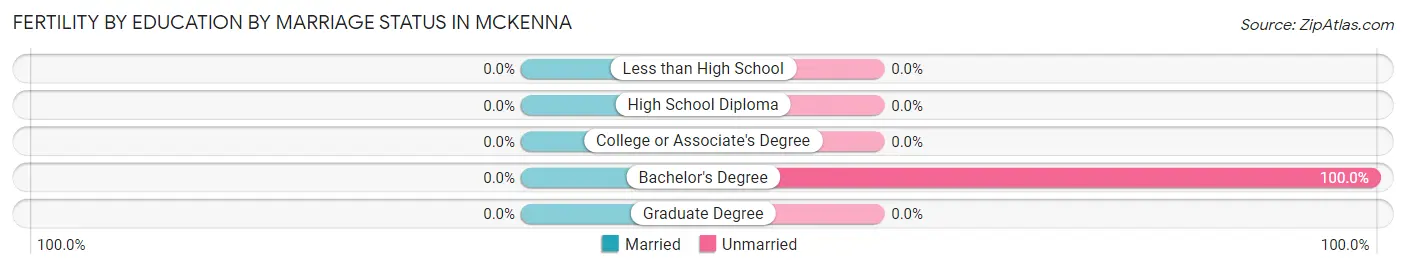
| Educational Attainment | Married | Unmarried |
| Less than High School | 0 (0.0%) | 0 (0.0%) |
| High School Diploma | 0 (0.0%) | 0 (0.0%) |
| College or Associate's Degree | 0 (0.0%) | 0 (0.0%) |
| Bachelor's Degree | 0 (0.0%) | 21 (100.0%) |
| Graduate Degree | 0 (0.0%) | 0 (0.0%) |
| Total | 0 (0.0%) | 21 (100.0%) |
Employment Characteristics in Mckenna
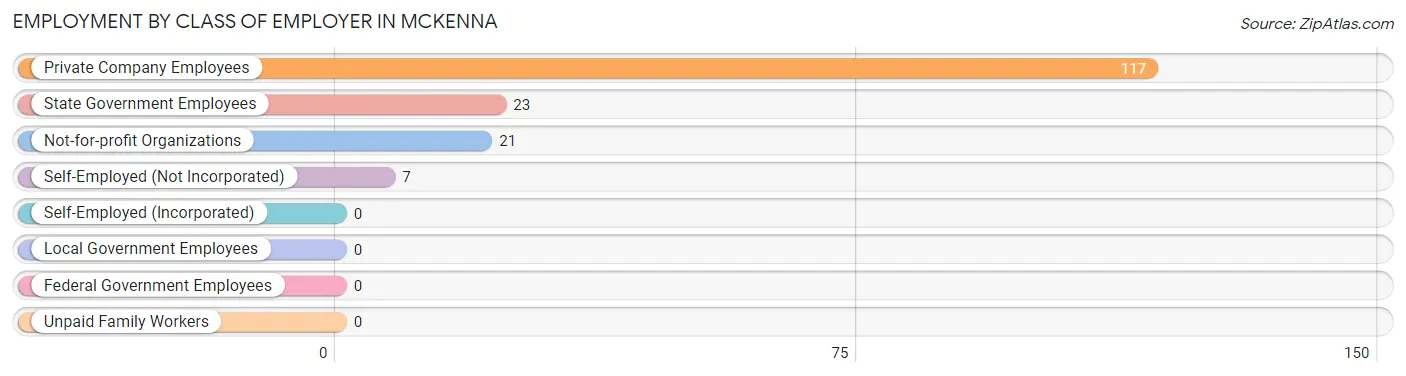
Employment by Class of Employer in Mckenna
Among the 168 employed individuals in Mckenna, private company employees (117 | 69.6%), state government employees (23 | 13.7%), and not-for-profit organizations (21 | 12.5%) make up the most common classes of employment.
| Employer Class | # Employees | % Employees |
| Private Company Employees | 117 | 69.6% |
| Self-Employed (Incorporated) | 0 | 0.0% |
| Self-Employed (Not Incorporated) | 7 | 4.2% |
| Not-for-profit Organizations | 21 | 12.5% |
| Local Government Employees | 0 | 0.0% |
| State Government Employees | 23 | 13.7% |
| Federal Government Employees | 0 | 0.0% |
| Unpaid Family Workers | 0 | 0.0% |
| Total | 168 | 100.0% |
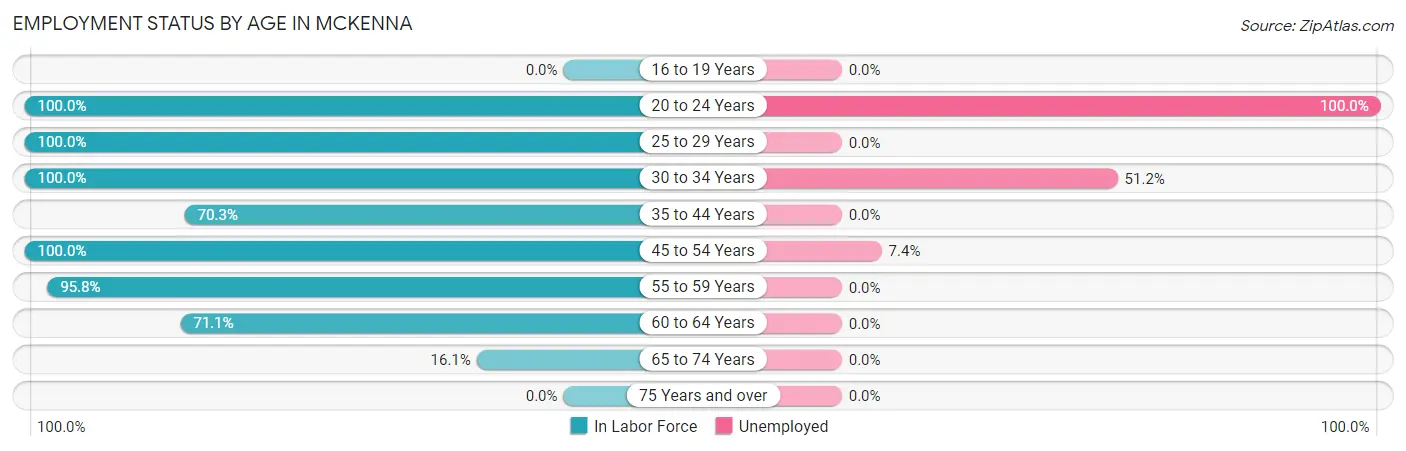
Employment Status by Age in Mckenna
According to the labor force statistics for Mckenna, out of the total population over 16 years of age (444), 56.1% or 249 individuals are in the labor force, with 20.9% or 52 of them unemployed. The age group with the highest labor force participation rate is 20 to 24 years, with 100.0% or 28 individuals in the labor force. Within the labor force, the 20 to 24 years age range has the highest percentage of unemployed individuals, with 100.0% or 28 of them being unemployed.
| Age Bracket | In Labor Force | Unemployed |
| 16 to 19 Years | 0 (0.0%) | 0 (0.0%) |
| 20 to 24 Years | 28 (100.0%) | 28 (100.0%) |
| 25 to 29 Years | 29 (100.0%) | 0 (0.0%) |
| 30 to 34 Years | 43 (100.0%) | 22 (51.2%) |
| 35 to 44 Years | 52 (70.3%) | 0 (0.0%) |
| 45 to 54 Years | 27 (100.0%) | 2 (7.4%) |
| 55 to 59 Years | 23 (95.8%) | 0 (0.0%) |
| 60 to 64 Years | 32 (71.1%) | 0 (0.0%) |
| 65 to 74 Years | 15 (16.1%) | 0 (0.0%) |
| 75 Years and over | 0 (0.0%) | 0 (0.0%) |
| Total | 249 (56.1%) | 52 (20.9%) |
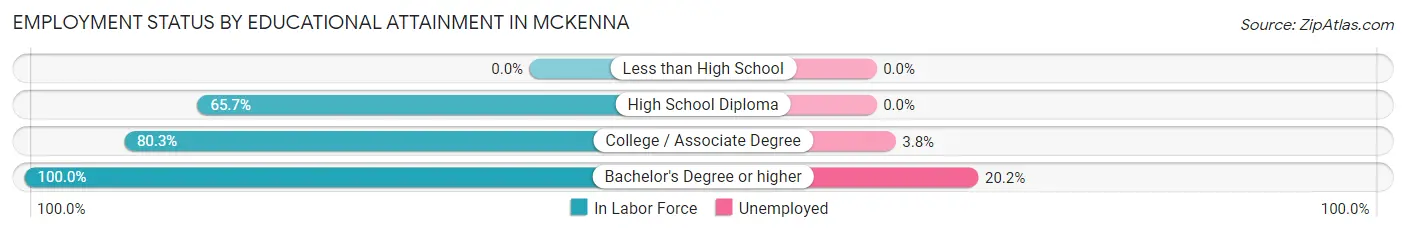
Employment Status by Educational Attainment in Mckenna
According to labor force statistics for Mckenna, 85.1% of individuals (206) out of the total population between 25 and 64 years of age (242) are in the labor force, with 11.7% or 24 of them being unemployed. The group with the highest labor force participation rate are those with the educational attainment of bachelor's degree or higher, with 100.0% or 109 individuals in the labor force. Within the labor force, individuals with bachelor's degree or higher education have the highest percentage of unemployment, with 20.2% or 22 of them being unemployed.
| Educational Attainment | In Labor Force | Unemployed |
| Less than High School | 0 (0.0%) | 0 (0.0%) |
| High School Diploma | 44 (65.7%) | 0 (0.0%) |
| College / Associate Degree | 53 (80.3%) | 3 (3.8%) |
| Bachelor's Degree or higher | 109 (100.0%) | 22 (20.2%) |
| Total | 206 (85.1%) | 28 (11.7%) |
Employment Occupations by Sex in Mckenna
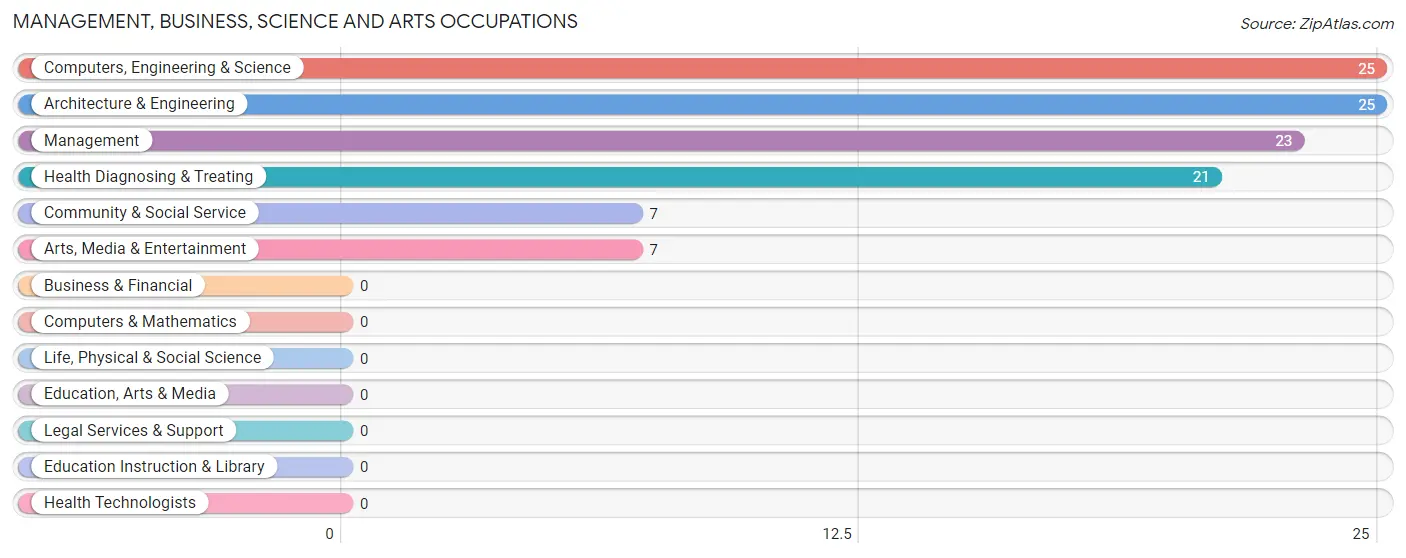
Management, Business, Science and Arts Occupations
The most common Management, Business, Science and Arts occupations in Mckenna are Computers, Engineering & Science (25 | 12.7%), Architecture & Engineering (25 | 12.7%), Management (23 | 11.7%), Health Diagnosing & Treating (21 | 10.7%), and Community & Social Service (7 | 3.5%).
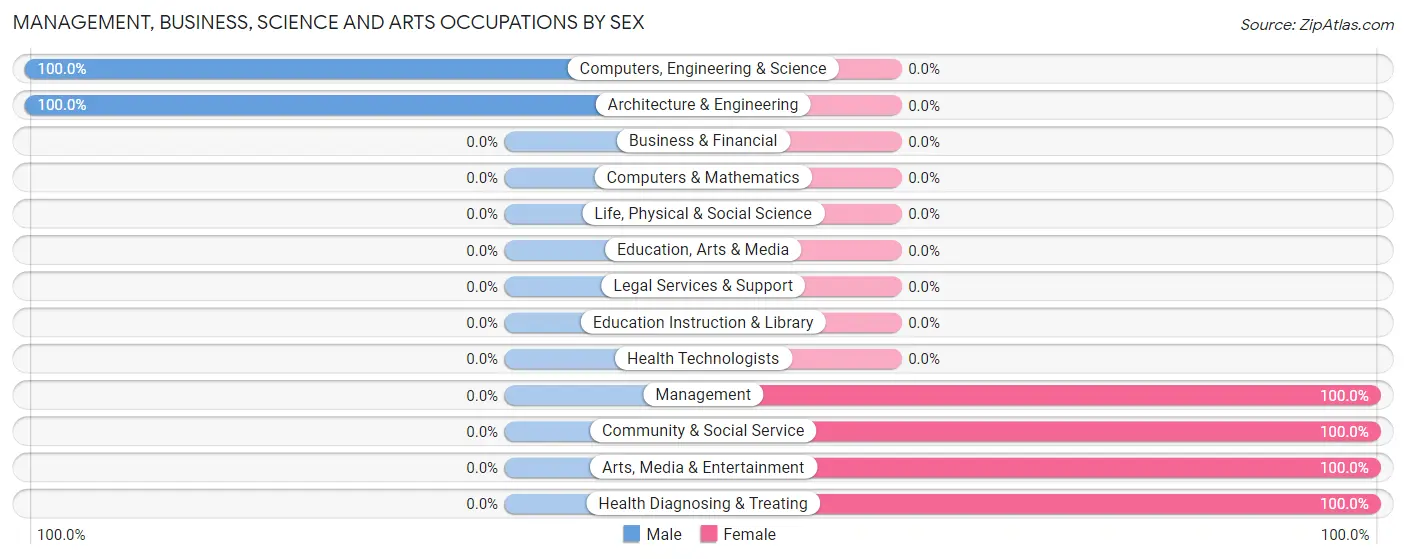
Management, Business, Science and Arts Occupations by Sex
Within the Management, Business, Science and Arts occupations in Mckenna, the most male-oriented occupations are Computers, Engineering & Science (100.0%), and Architecture & Engineering (100.0%), while the most female-oriented occupations are Management (100.0%), Community & Social Service (100.0%), and Arts, Media & Entertainment (100.0%).
| Occupation | Male | Female |
| Management | 0 (0.0%) | 23 (100.0%) |
| Business & Financial | 0 (0.0%) | 0 (0.0%) |
| Computers, Engineering & Science | 25 (100.0%) | 0 (0.0%) |
| Computers & Mathematics | 0 (0.0%) | 0 (0.0%) |
| Architecture & Engineering | 25 (100.0%) | 0 (0.0%) |
| Life, Physical & Social Science | 0 (0.0%) | 0 (0.0%) |
| Community & Social Service | 0 (0.0%) | 7 (100.0%) |
| Education, Arts & Media | 0 (0.0%) | 0 (0.0%) |
| Legal Services & Support | 0 (0.0%) | 0 (0.0%) |
| Education Instruction & Library | 0 (0.0%) | 0 (0.0%) |
| Arts, Media & Entertainment | 0 (0.0%) | 7 (100.0%) |
| Health Diagnosing & Treating | 0 (0.0%) | 21 (100.0%) |
| Health Technologists | 0 (0.0%) | 0 (0.0%) |
| Total (Category) | 25 (32.9%) | 51 (67.1%) |
| Total (Overall) | 125 (63.4%) | 72 (36.5%) |
Services Occupations
Services Occupations by Sex
| Occupation | Male | Female |
| Healthcare Support | 0 (0.0%) | 0 (0.0%) |
| Security & Protection | 0 (0.0%) | 0 (0.0%) |
| Firefighting & Prevention | 0 (0.0%) | 0 (0.0%) |
| Law Enforcement | 0 (0.0%) | 0 (0.0%) |
| Food Preparation & Serving | 0 (0.0%) | 0 (0.0%) |
| Cleaning & Maintenance | 0 (0.0%) | 0 (0.0%) |
| Personal Care & Service | 0 (0.0%) | 0 (0.0%) |
| Total (Category) | 0 (0.0%) | 0 (0.0%) |
| Total (Overall) | 125 (63.4%) | 72 (36.5%) |
Sales and Office Occupations
Sales and Office Occupations by Sex
| Occupation | Male | Female |
| Sales & Related | 0 (0.0%) | 0 (0.0%) |
| Office & Administration | 0 (0.0%) | 0 (0.0%) |
| Total (Category) | 0 (0.0%) | 0 (0.0%) |
| Total (Overall) | 125 (63.4%) | 72 (36.5%) |
Natural Resources, Construction and Maintenance Occupations
The most common Natural Resources, Construction and Maintenance occupations in Mckenna are , and Construction & Extraction (64 | 32.5%).
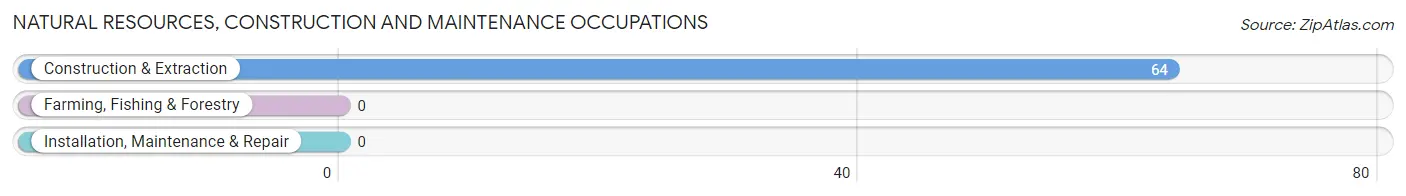
Natural Resources, Construction and Maintenance Occupations by Sex
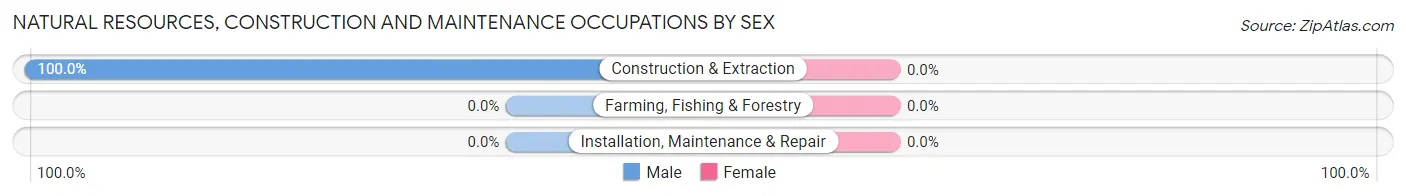
| Occupation | Male | Female |
| Farming, Fishing & Forestry | 0 (0.0%) | 0 (0.0%) |
| Construction & Extraction | 64 (100.0%) | 0 (0.0%) |
| Installation, Maintenance & Repair | 0 (0.0%) | 0 (0.0%) |
| Total (Category) | 64 (100.0%) | 0 (0.0%) |
| Total (Overall) | 125 (63.4%) | 72 (36.5%) |
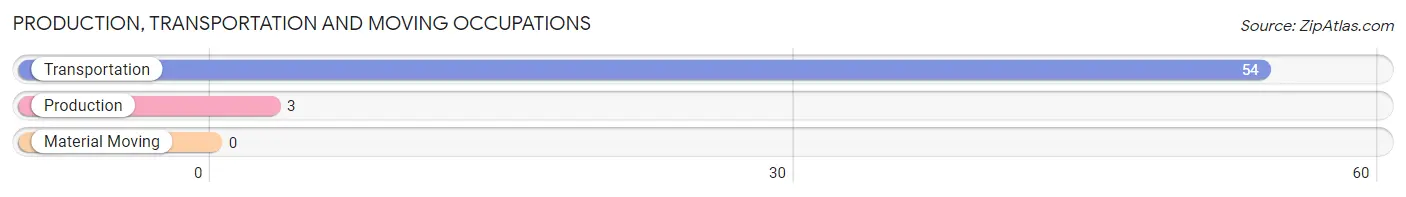
Production, Transportation and Moving Occupations
The most common Production, Transportation and Moving occupations in Mckenna are Transportation (54 | 27.4%), and Production (3 | 1.5%).
Production, Transportation and Moving Occupations by Sex
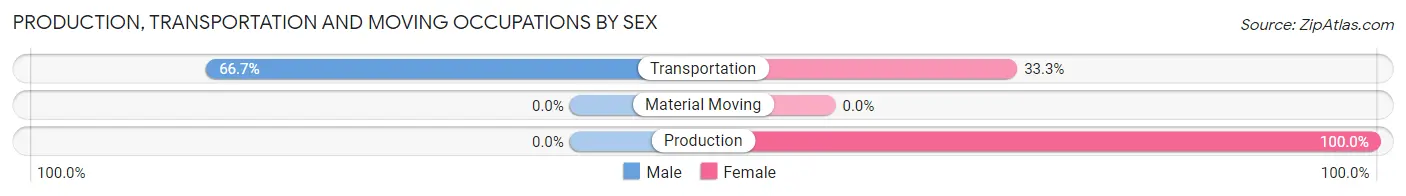
| Occupation | Male | Female |
| Production | 0 (0.0%) | 3 (100.0%) |
| Transportation | 36 (66.7%) | 18 (33.3%) |
| Material Moving | 0 (0.0%) | 0 (0.0%) |
| Total (Category) | 36 (63.2%) | 21 (36.8%) |
| Total (Overall) | 125 (63.4%) | 72 (36.5%) |
Employment Industries by Sex in Mckenna
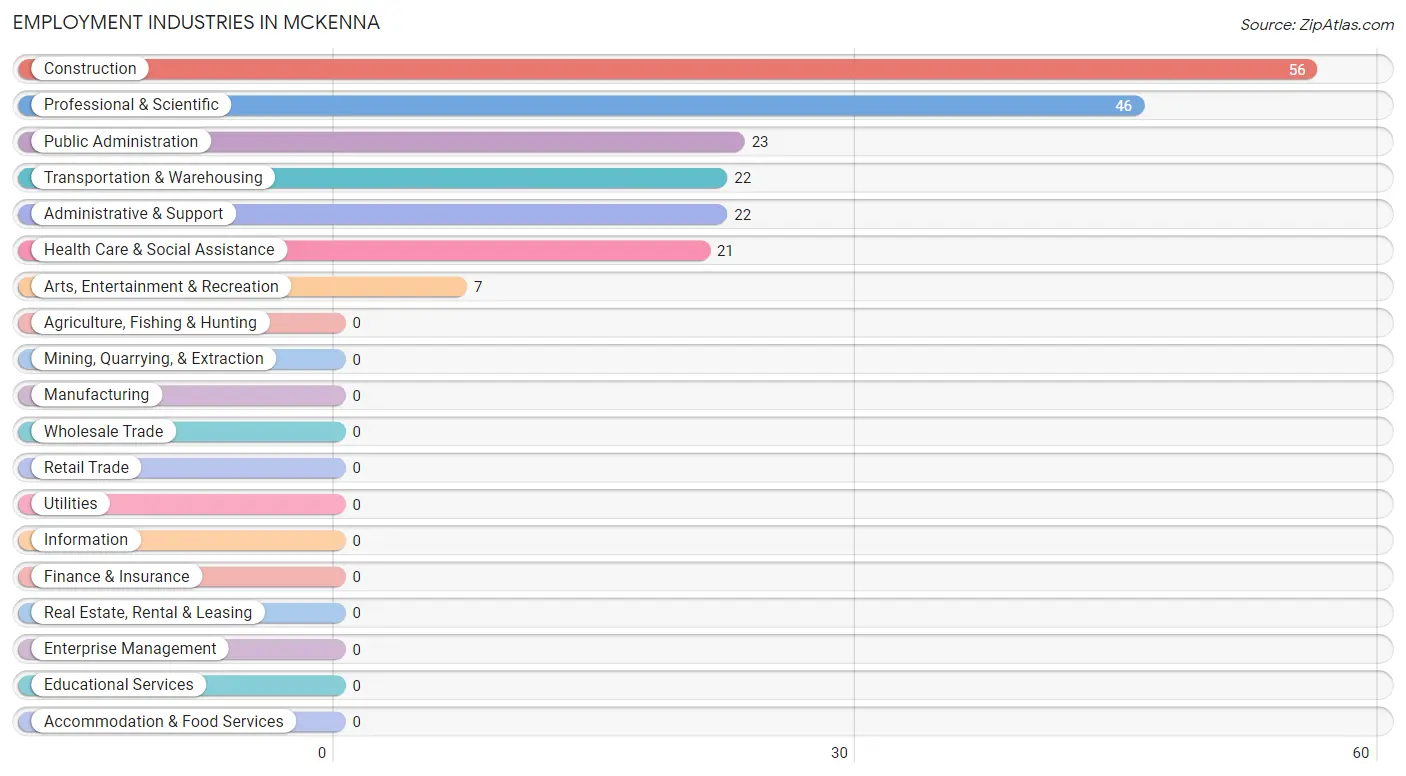
Employment Industries in Mckenna
The major employment industries in Mckenna include Construction (56 | 28.4%), Professional & Scientific (46 | 23.4%), Public Administration (23 | 11.7%), Transportation & Warehousing (22 | 11.2%), and Administrative & Support (22 | 11.2%).
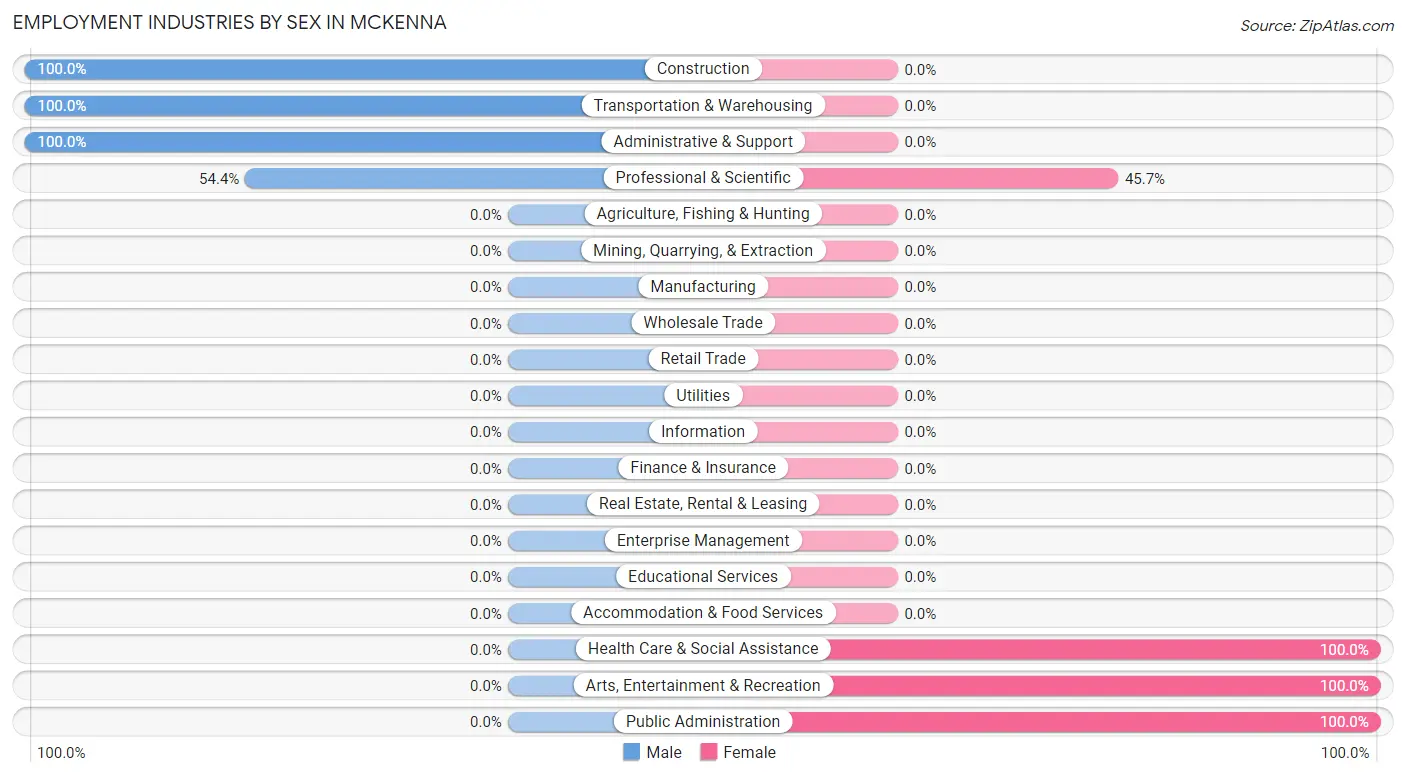
Employment Industries by Sex in Mckenna
The Mckenna industries that see more men than women are Construction (100.0%), Transportation & Warehousing (100.0%), and Administrative & Support (100.0%), whereas the industries that tend to have a higher number of women are Health Care & Social Assistance (100.0%), Arts, Entertainment & Recreation (100.0%), and Public Administration (100.0%).
| Industry | Male | Female |
| Agriculture, Fishing & Hunting | 0 (0.0%) | 0 (0.0%) |
| Mining, Quarrying, & Extraction | 0 (0.0%) | 0 (0.0%) |
| Construction | 56 (100.0%) | 0 (0.0%) |
| Manufacturing | 0 (0.0%) | 0 (0.0%) |
| Wholesale Trade | 0 (0.0%) | 0 (0.0%) |
| Retail Trade | 0 (0.0%) | 0 (0.0%) |
| Transportation & Warehousing | 22 (100.0%) | 0 (0.0%) |
| Utilities | 0 (0.0%) | 0 (0.0%) |
| Information | 0 (0.0%) | 0 (0.0%) |
| Finance & Insurance | 0 (0.0%) | 0 (0.0%) |
| Real Estate, Rental & Leasing | 0 (0.0%) | 0 (0.0%) |
| Professional & Scientific | 25 (54.3%) | 21 (45.7%) |
| Enterprise Management | 0 (0.0%) | 0 (0.0%) |
| Administrative & Support | 22 (100.0%) | 0 (0.0%) |
| Educational Services | 0 (0.0%) | 0 (0.0%) |
| Health Care & Social Assistance | 0 (0.0%) | 21 (100.0%) |
| Arts, Entertainment & Recreation | 0 (0.0%) | 7 (100.0%) |
| Accommodation & Food Services | 0 (0.0%) | 0 (0.0%) |
| Public Administration | 0 (0.0%) | 23 (100.0%) |
| Total | 125 (63.4%) | 72 (36.5%) |
Education in Mckenna
School Enrollment in Mckenna
The most common levels of schooling among the 84 students in Mckenna are middle school (54 | 64.3%), and college / undergraduate (30 | 35.7%).
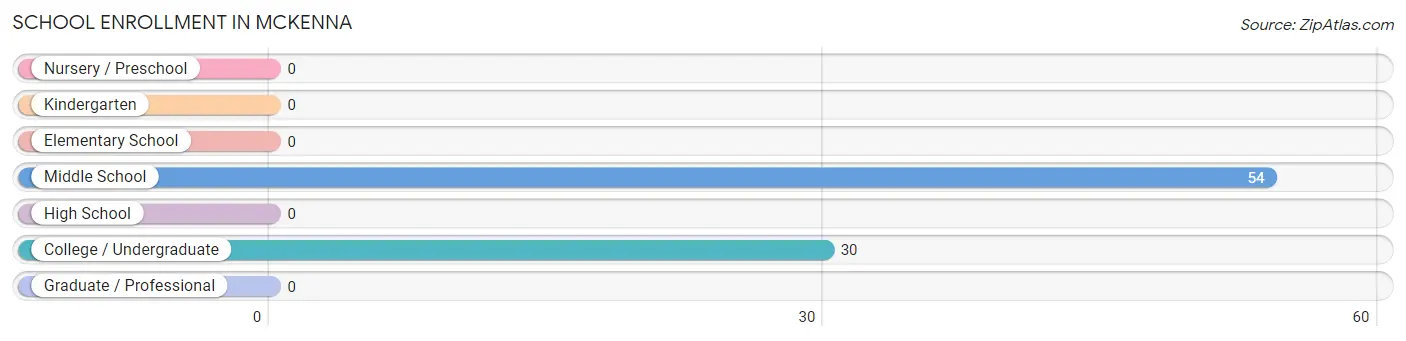
| School Level | # Students | % Students |
| Nursery / Preschool | 0 | 0.0% |
| Kindergarten | 0 | 0.0% |
| Elementary School | 0 | 0.0% |
| Middle School | 54 | 64.3% |
| High School | 0 | 0.0% |
| College / Undergraduate | 30 | 35.7% |
| Graduate / Professional | 0 | 0.0% |
| Total | 84 | 100.0% |
School Enrollment by Age by Funding Source in Mckenna
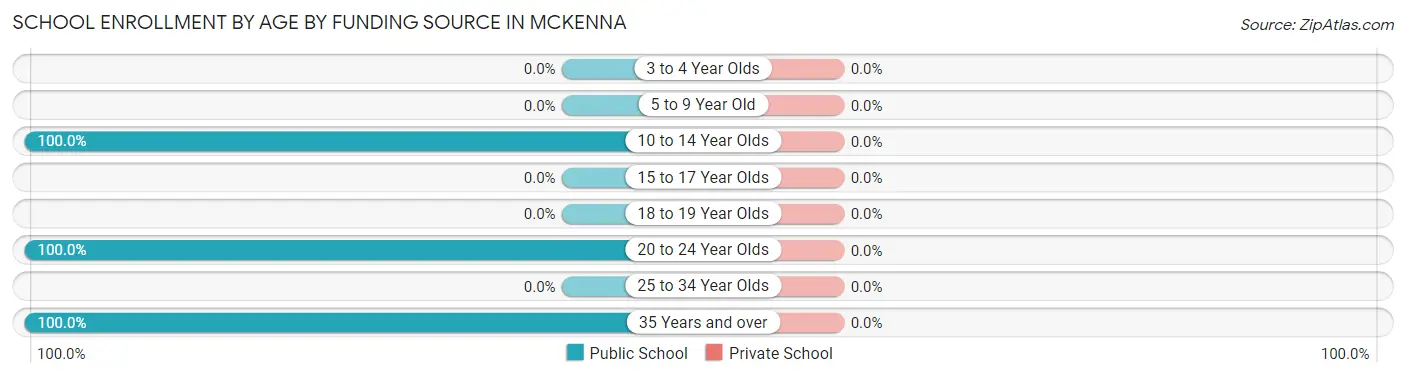
| Age Bracket | Public School | Private School |
| 3 to 4 Year Olds | 0 (0.0%) | 0 (0.0%) |
| 5 to 9 Year Old | 0 (0.0%) | 0 (0.0%) |
| 10 to 14 Year Olds | 54 (100.0%) | 0 (0.0%) |
| 15 to 17 Year Olds | 0 (0.0%) | 0 (0.0%) |
| 18 to 19 Year Olds | 0 (0.0%) | 0 (0.0%) |
| 20 to 24 Year Olds | 28 (100.0%) | 0 (0.0%) |
| 25 to 34 Year Olds | 0 (0.0%) | 0 (0.0%) |
| 35 Years and over | 2 (100.0%) | 0 (0.0%) |
| Total | 84 (100.0%) | 0 (0.0%) |
Educational Attainment by Field of Study in Mckenna
Science & technology (25 | 20.8%), literature & languages (23 | 19.2%), business (22 | 18.3%), bio, nature & agricultural (21 | 17.5%), and social sciences (18 | 15.0%) are the most common fields of study among 120 individuals in Mckenna who have obtained a bachelor's degree or higher.
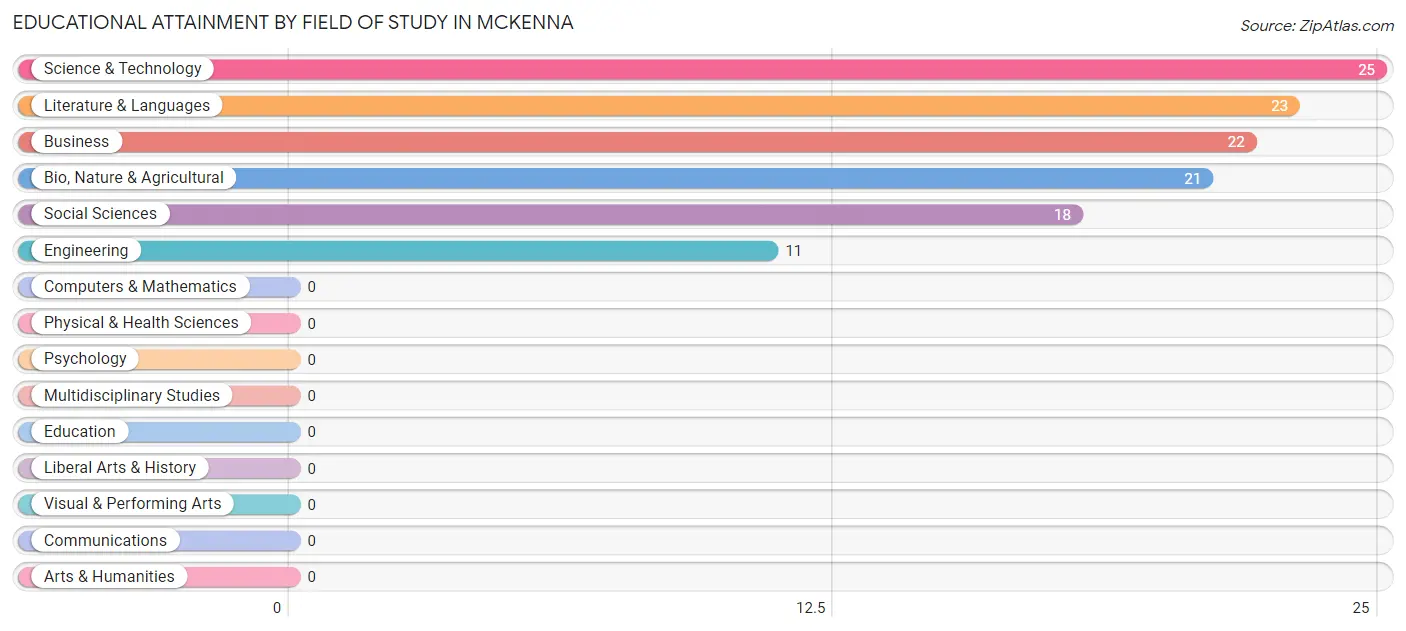
| Field of Study | # Graduates | % Graduates |
| Computers & Mathematics | 0 | 0.0% |
| Bio, Nature & Agricultural | 21 | 17.5% |
| Physical & Health Sciences | 0 | 0.0% |
| Psychology | 0 | 0.0% |
| Social Sciences | 18 | 15.0% |
| Engineering | 11 | 9.2% |
| Multidisciplinary Studies | 0 | 0.0% |
| Science & Technology | 25 | 20.8% |
| Business | 22 | 18.3% |
| Education | 0 | 0.0% |
| Literature & Languages | 23 | 19.2% |
| Liberal Arts & History | 0 | 0.0% |
| Visual & Performing Arts | 0 | 0.0% |
| Communications | 0 | 0.0% |
| Arts & Humanities | 0 | 0.0% |
| Total | 120 | 100.0% |
Transportation & Commute in Mckenna
Vehicle Availability by Sex in Mckenna
The most prevalent vehicle ownership categories in Mckenna are males with 3 vehicles (74, accounting for 77.1%) and females with 3 vehicles (62, making up 107.3%).
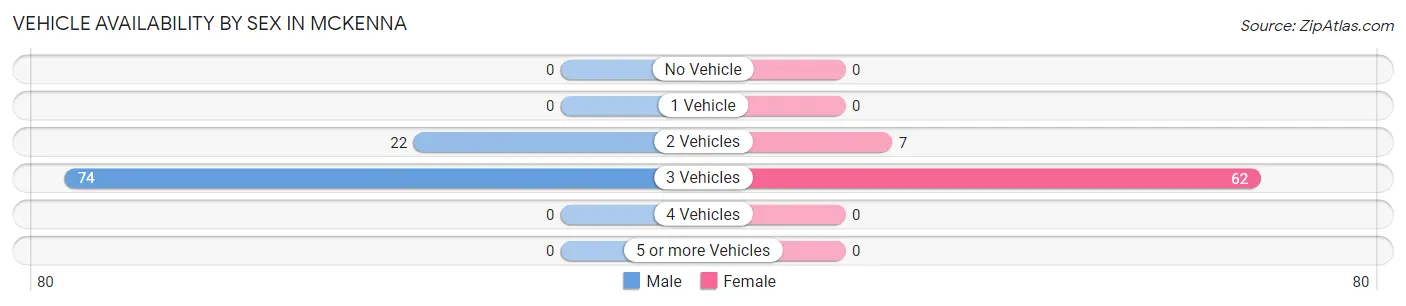
| Vehicles Available | Male | Female |
| No Vehicle | 0 (0.0%) | 0 (0.0%) |
| 1 Vehicle | 0 (0.0%) | 0 (0.0%) |
| 2 Vehicles | 22 (22.9%) | 7 (10.1%) |
| 3 Vehicles | 74 (77.1%) | 62 (89.9%) |
| 4 Vehicles | 0 (0.0%) | 0 (0.0%) |
| 5 or more Vehicles | 0 (0.0%) | 0 (0.0%) |
| Total | 96 (100.0%) | 69 (100.0%) |
Commute Time in Mckenna
The most frequently occuring commute durations in Mckenna are 45 to 59 minutes (48 commuters, 28.6%), 90 or more minutes (45 commuters, 26.8%), and 5 to 9 minutes (44 commuters, 26.2%).
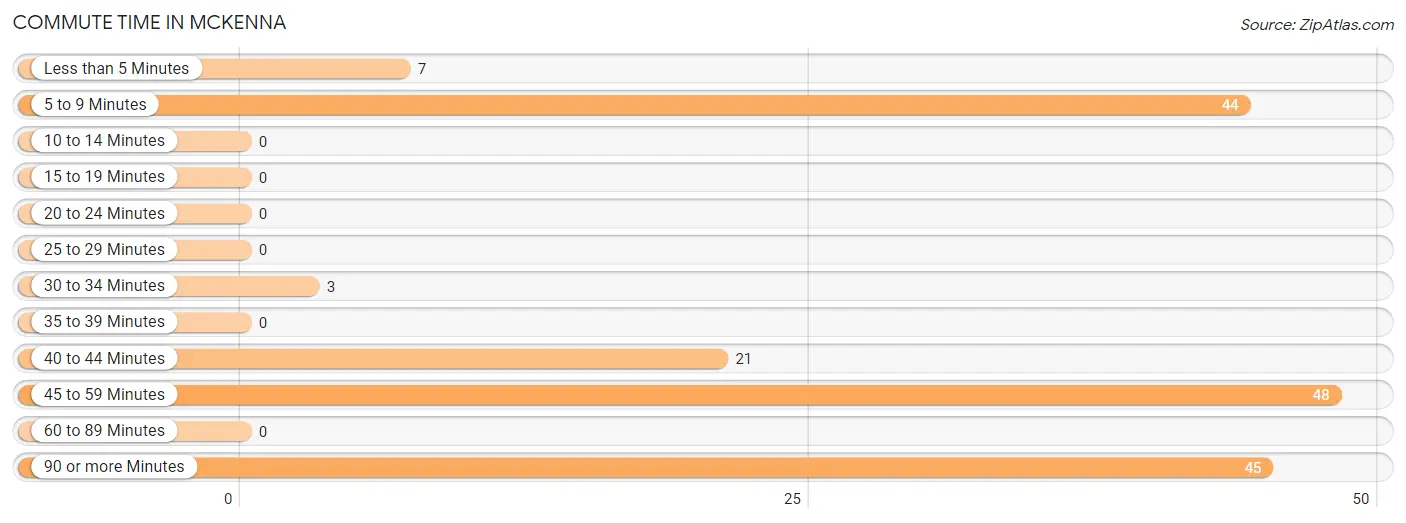
| Commute Time | # Commuters | % Commuters |
| Less than 5 Minutes | 7 | 4.2% |
| 5 to 9 Minutes | 44 | 26.2% |
| 10 to 14 Minutes | 0 | 0.0% |
| 15 to 19 Minutes | 0 | 0.0% |
| 20 to 24 Minutes | 0 | 0.0% |
| 25 to 29 Minutes | 0 | 0.0% |
| 30 to 34 Minutes | 3 | 1.8% |
| 35 to 39 Minutes | 0 | 0.0% |
| 40 to 44 Minutes | 21 | 12.5% |
| 45 to 59 Minutes | 48 | 28.6% |
| 60 to 89 Minutes | 0 | 0.0% |
| 90 or more Minutes | 45 | 26.8% |
Commute Time by Sex in Mckenna
The most common commute times in Mckenna are 5 to 9 minutes (44 commuters, 45.8%) for males and 45 to 59 minutes (23 commuters, 31.9%) for females.
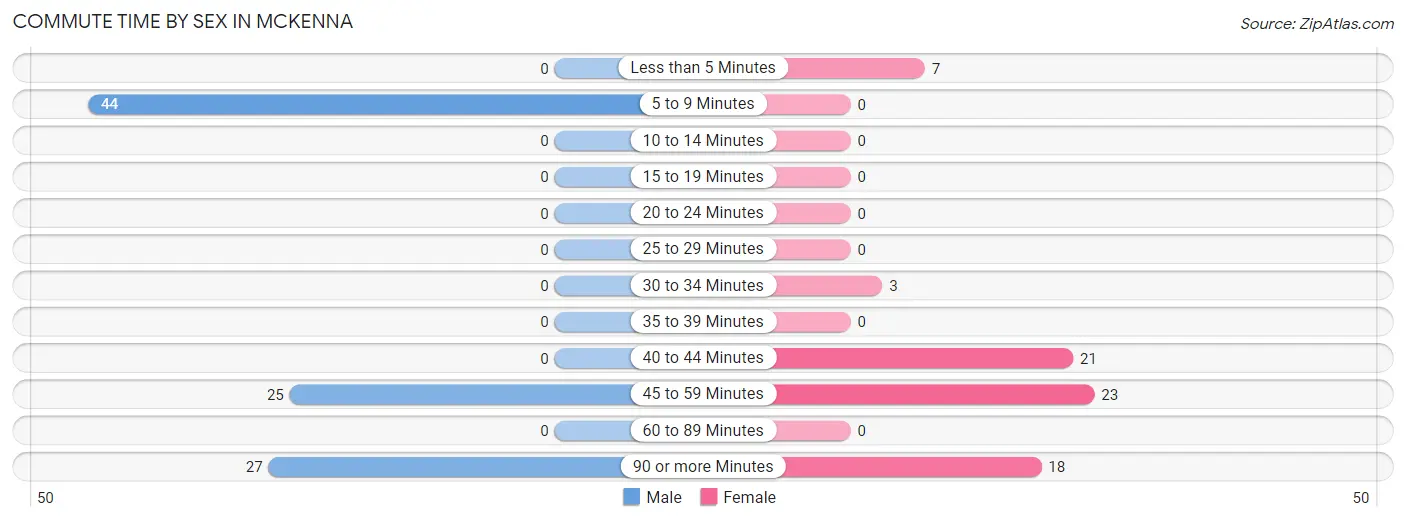
| Commute Time | Male | Female |
| Less than 5 Minutes | 0 (0.0%) | 7 (9.7%) |
| 5 to 9 Minutes | 44 (45.8%) | 0 (0.0%) |
| 10 to 14 Minutes | 0 (0.0%) | 0 (0.0%) |
| 15 to 19 Minutes | 0 (0.0%) | 0 (0.0%) |
| 20 to 24 Minutes | 0 (0.0%) | 0 (0.0%) |
| 25 to 29 Minutes | 0 (0.0%) | 0 (0.0%) |
| 30 to 34 Minutes | 0 (0.0%) | 3 (4.2%) |
| 35 to 39 Minutes | 0 (0.0%) | 0 (0.0%) |
| 40 to 44 Minutes | 0 (0.0%) | 21 (29.2%) |
| 45 to 59 Minutes | 25 (26.0%) | 23 (31.9%) |
| 60 to 89 Minutes | 0 (0.0%) | 0 (0.0%) |
| 90 or more Minutes | 27 (28.1%) | 18 (25.0%) |
Time of Departure to Work by Sex in Mckenna
The most frequent times of departure to work in Mckenna are 12:00 AM to 4:59 AM (52, 54.2%) for males and 4:00 PM to 11:59 PM (23, 31.9%) for females.
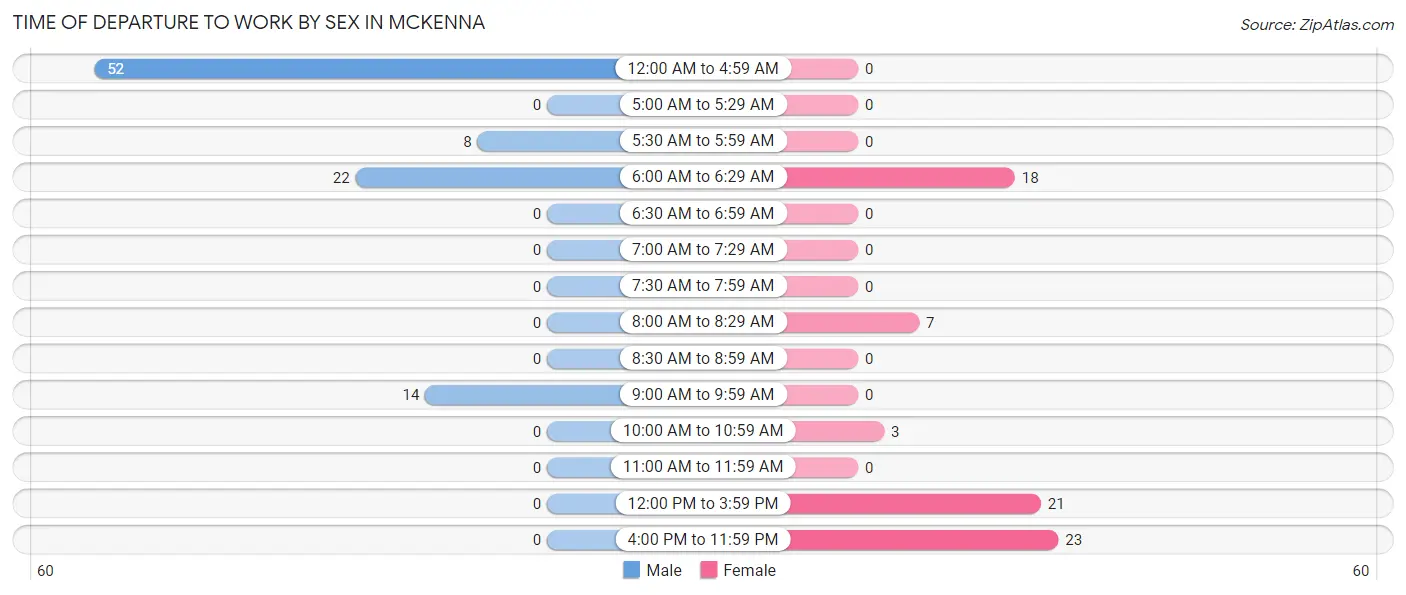
| Time of Departure | Male | Female |
| 12:00 AM to 4:59 AM | 52 (54.2%) | 0 (0.0%) |
| 5:00 AM to 5:29 AM | 0 (0.0%) | 0 (0.0%) |
| 5:30 AM to 5:59 AM | 8 (8.3%) | 0 (0.0%) |
| 6:00 AM to 6:29 AM | 22 (22.9%) | 18 (25.0%) |
| 6:30 AM to 6:59 AM | 0 (0.0%) | 0 (0.0%) |
| 7:00 AM to 7:29 AM | 0 (0.0%) | 0 (0.0%) |
| 7:30 AM to 7:59 AM | 0 (0.0%) | 0 (0.0%) |
| 8:00 AM to 8:29 AM | 0 (0.0%) | 7 (9.7%) |
| 8:30 AM to 8:59 AM | 0 (0.0%) | 0 (0.0%) |
| 9:00 AM to 9:59 AM | 14 (14.6%) | 0 (0.0%) |
| 10:00 AM to 10:59 AM | 0 (0.0%) | 3 (4.2%) |
| 11:00 AM to 11:59 AM | 0 (0.0%) | 0 (0.0%) |
| 12:00 PM to 3:59 PM | 0 (0.0%) | 21 (29.2%) |
| 4:00 PM to 11:59 PM | 0 (0.0%) | 23 (31.9%) |
| Total | 96 (100.0%) | 72 (100.0%) |
Housing Occupancy in Mckenna
Occupancy by Ownership in Mckenna
Of the total 193 dwellings in Mckenna, owner-occupied units account for 93 (48.2%), while renter-occupied units make up 100 (51.8%).
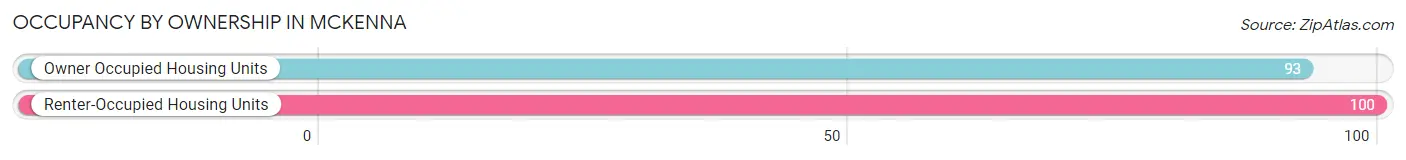
| Occupancy | # Housing Units | % Housing Units |
| Owner Occupied Housing Units | 93 | 48.2% |
| Renter-Occupied Housing Units | 100 | 51.8% |
| Total Occupied Housing Units | 193 | 100.0% |
Occupancy by Household Size in Mckenna
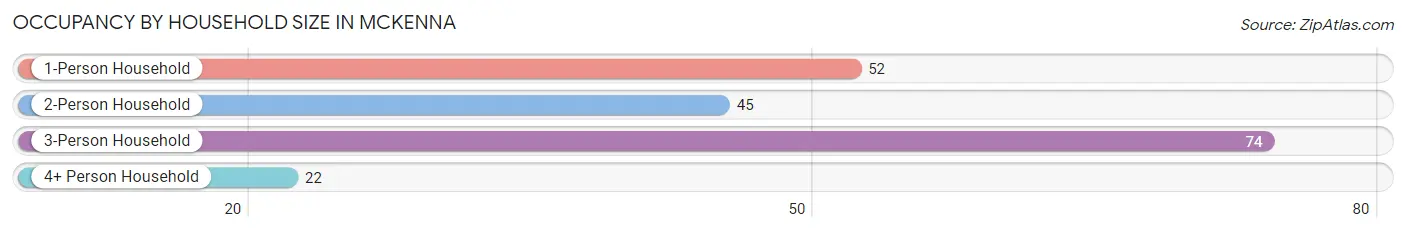
| Household Size | # Housing Units | % Housing Units |
| 1-Person Household | 52 | 26.9% |
| 2-Person Household | 45 | 23.3% |
| 3-Person Household | 74 | 38.3% |
| 4+ Person Household | 22 | 11.4% |
| Total Housing Units | 193 | 100.0% |
Occupancy by Ownership by Household Size in Mckenna
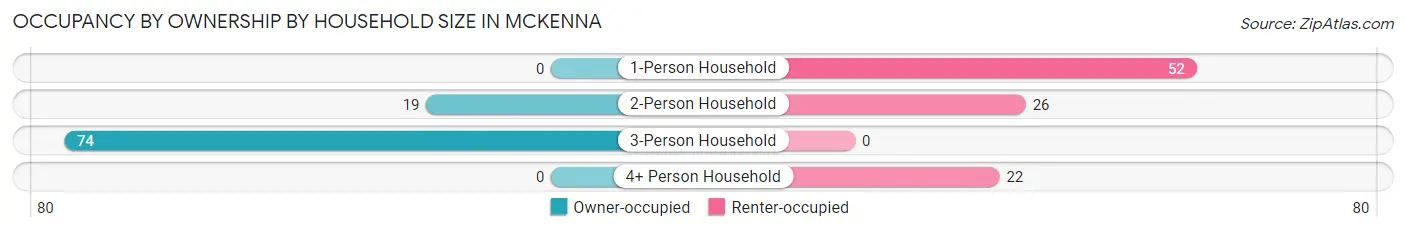
| Household Size | Owner-occupied | Renter-occupied |
| 1-Person Household | 0 (0.0%) | 52 (100.0%) |
| 2-Person Household | 19 (42.2%) | 26 (57.8%) |
| 3-Person Household | 74 (100.0%) | 0 (0.0%) |
| 4+ Person Household | 0 (0.0%) | 22 (100.0%) |
| Total Housing Units | 93 (48.2%) | 100 (51.8%) |
Occupancy by Educational Attainment in Mckenna
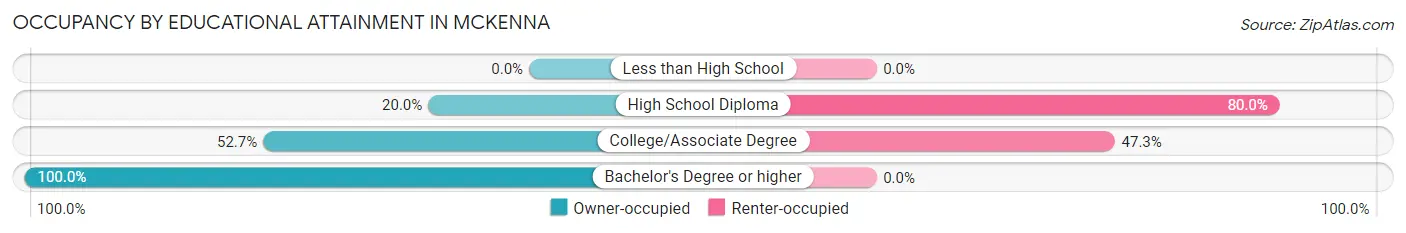
| Household Size | Owner-occupied | Renter-occupied |
| Less than High School | 0 (0.0%) | 0 (0.0%) |
| High School Diploma | 12 (20.0%) | 48 (80.0%) |
| College/Associate Degree | 58 (52.7%) | 52 (47.3%) |
| Bachelor's Degree or higher | 23 (100.0%) | 0 (0.0%) |
Occupancy by Age of Householder in Mckenna
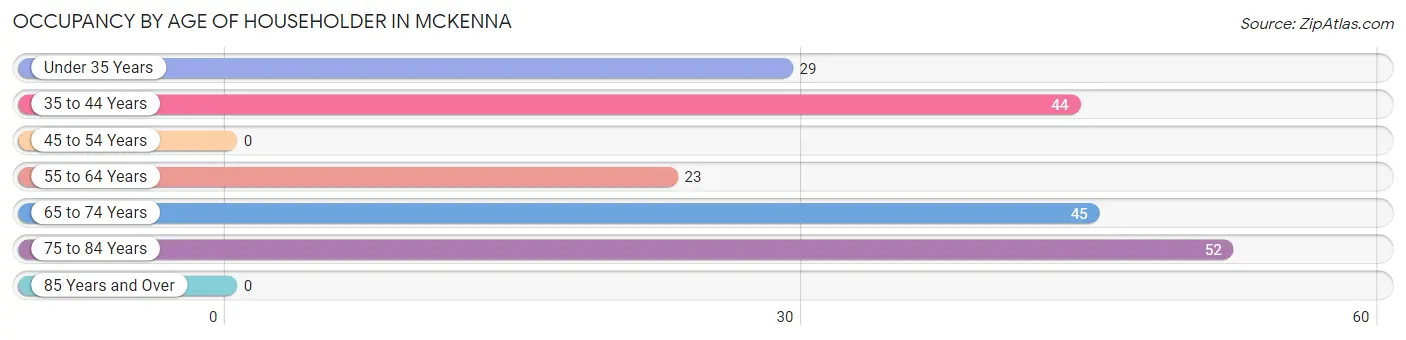
| Age Bracket | # Households | % Households |
| Under 35 Years | 29 | 15.0% |
| 35 to 44 Years | 44 | 22.8% |
| 45 to 54 Years | 0 | 0.0% |
| 55 to 64 Years | 23 | 11.9% |
| 65 to 74 Years | 45 | 23.3% |
| 75 to 84 Years | 52 | 26.9% |
| 85 Years and Over | 0 | 0.0% |
| Total | 193 | 100.0% |
Housing Finances in Mckenna
Median Income by Occupancy in Mckenna
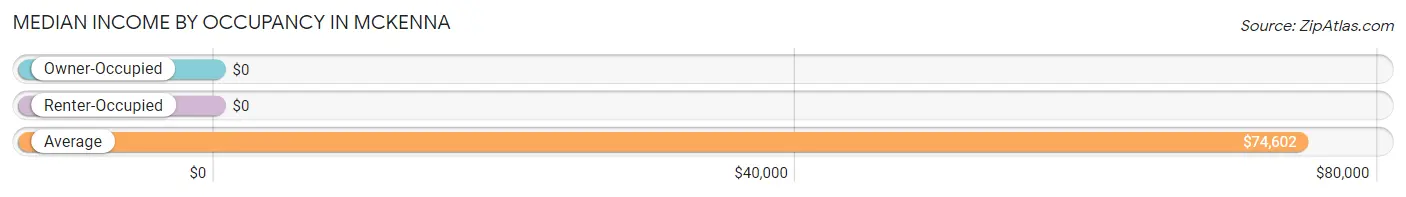
| Occupancy Type | # Households | Median Income |
| Owner-Occupied | 93 (48.2%) | $0 |
| Renter-Occupied | 100 (51.8%) | $0 |
| Average | 193 (100.0%) | $74,602 |
Occupancy by Householder Income Bracket in Mckenna
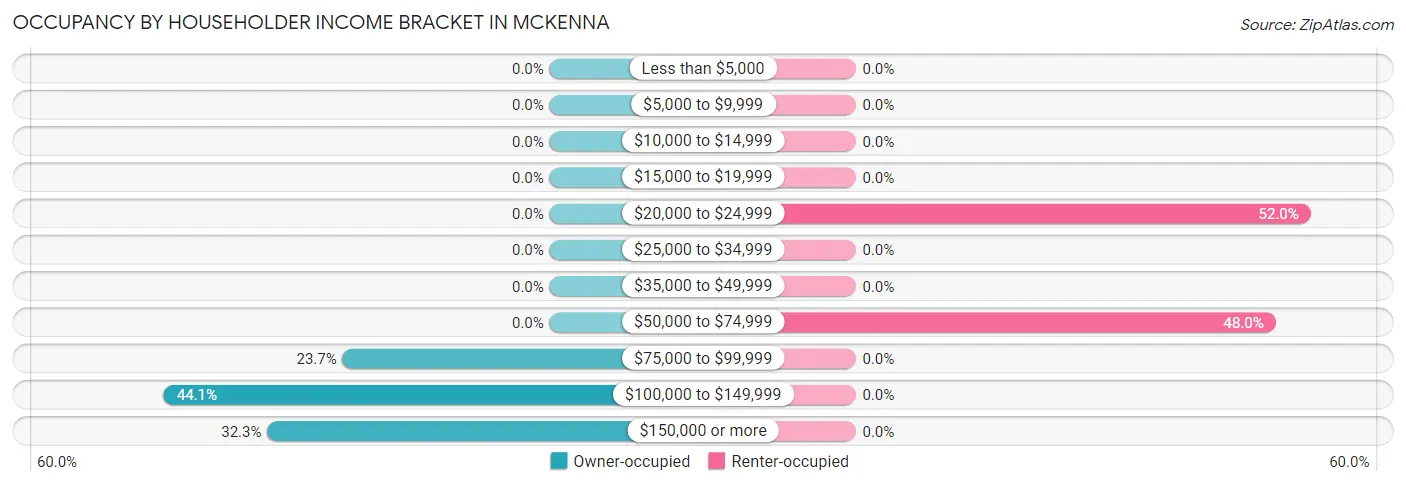
| Income Bracket | Owner-occupied | Renter-occupied |
| Less than $5,000 | 0 (0.0%) | 0 (0.0%) |
| $5,000 to $9,999 | 0 (0.0%) | 0 (0.0%) |
| $10,000 to $14,999 | 0 (0.0%) | 0 (0.0%) |
| $15,000 to $19,999 | 0 (0.0%) | 0 (0.0%) |
| $20,000 to $24,999 | 0 (0.0%) | 52 (52.0%) |
| $25,000 to $34,999 | 0 (0.0%) | 0 (0.0%) |
| $35,000 to $49,999 | 0 (0.0%) | 0 (0.0%) |
| $50,000 to $74,999 | 0 (0.0%) | 48 (48.0%) |
| $75,000 to $99,999 | 22 (23.7%) | 0 (0.0%) |
| $100,000 to $149,999 | 41 (44.1%) | 0 (0.0%) |
| $150,000 or more | 30 (32.3%) | 0 (0.0%) |
| Total | 93 (100.0%) | 100 (100.0%) |
Monthly Housing Cost Tiers in Mckenna
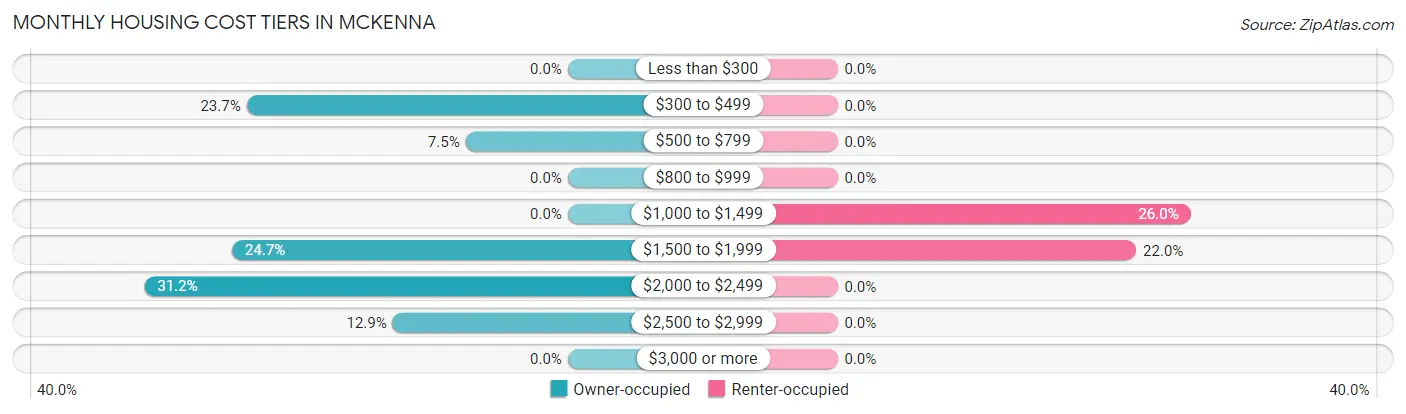
| Monthly Cost | Owner-occupied | Renter-occupied |
| Less than $300 | 0 (0.0%) | 0 (0.0%) |
| $300 to $499 | 22 (23.7%) | 0 (0.0%) |
| $500 to $799 | 7 (7.5%) | 0 (0.0%) |
| $800 to $999 | 0 (0.0%) | 0 (0.0%) |
| $1,000 to $1,499 | 0 (0.0%) | 26 (26.0%) |
| $1,500 to $1,999 | 23 (24.7%) | 22 (22.0%) |
| $2,000 to $2,499 | 29 (31.2%) | 0 (0.0%) |
| $2,500 to $2,999 | 12 (12.9%) | 0 (0.0%) |
| $3,000 or more | 0 (0.0%) | 0 (0.0%) |
| Total | 93 (100.0%) | 100 (100.0%) |
Physical Housing Characteristics in Mckenna
Housing Structures in Mckenna
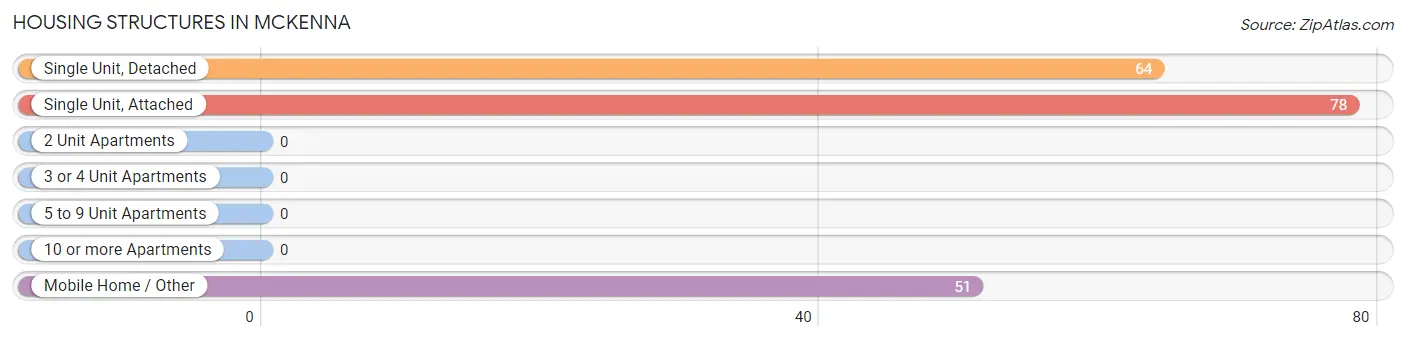
| Structure Type | # Housing Units | % Housing Units |
| Single Unit, Detached | 64 | 33.2% |
| Single Unit, Attached | 78 | 40.4% |
| 2 Unit Apartments | 0 | 0.0% |
| 3 or 4 Unit Apartments | 0 | 0.0% |
| 5 to 9 Unit Apartments | 0 | 0.0% |
| 10 or more Apartments | 0 | 0.0% |
| Mobile Home / Other | 51 | 26.4% |
| Total | 193 | 100.0% |
Housing Structures by Occupancy in Mckenna
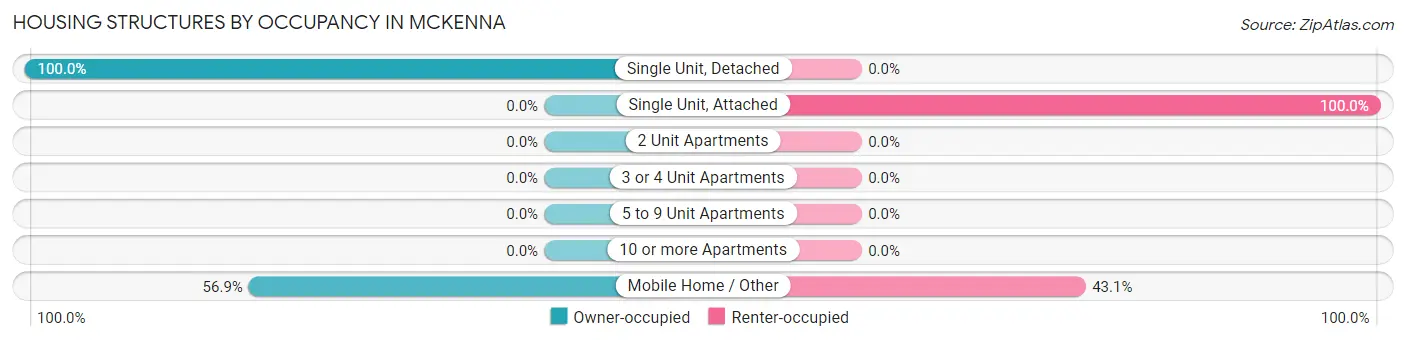
| Structure Type | Owner-occupied | Renter-occupied |
| Single Unit, Detached | 64 (100.0%) | 0 (0.0%) |
| Single Unit, Attached | 0 (0.0%) | 78 (100.0%) |
| 2 Unit Apartments | 0 (0.0%) | 0 (0.0%) |
| 3 or 4 Unit Apartments | 0 (0.0%) | 0 (0.0%) |
| 5 to 9 Unit Apartments | 0 (0.0%) | 0 (0.0%) |
| 10 or more Apartments | 0 (0.0%) | 0 (0.0%) |
| Mobile Home / Other | 29 (56.9%) | 22 (43.1%) |
| Total | 93 (48.2%) | 100 (51.8%) |
Housing Structures by Number of Rooms in Mckenna
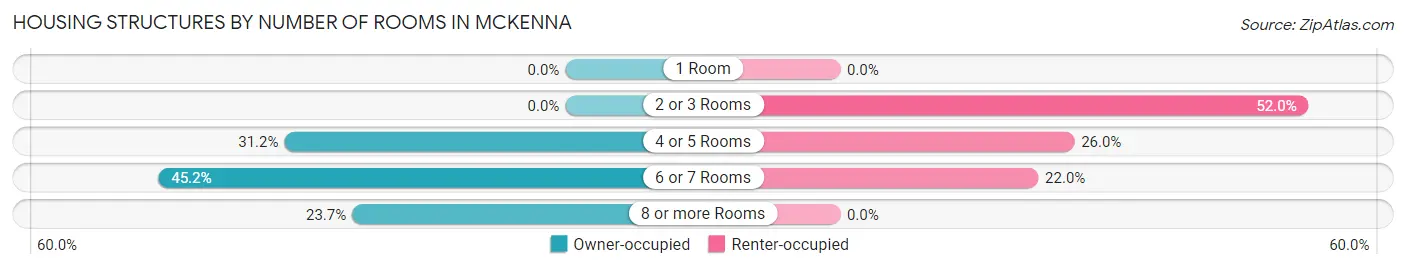
| Number of Rooms | Owner-occupied | Renter-occupied |
| 1 Room | 0 (0.0%) | 0 (0.0%) |
| 2 or 3 Rooms | 0 (0.0%) | 52 (52.0%) |
| 4 or 5 Rooms | 29 (31.2%) | 26 (26.0%) |
| 6 or 7 Rooms | 42 (45.2%) | 22 (22.0%) |
| 8 or more Rooms | 22 (23.7%) | 0 (0.0%) |
| Total | 93 (100.0%) | 100 (100.0%) |
Housing Structure by Heating Type in Mckenna
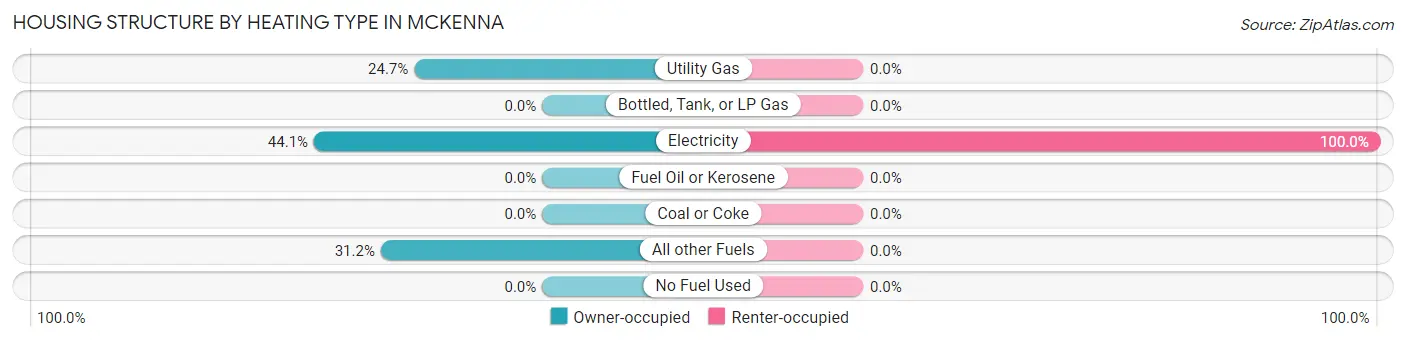
| Heating Type | Owner-occupied | Renter-occupied |
| Utility Gas | 23 (24.7%) | 0 (0.0%) |
| Bottled, Tank, or LP Gas | 0 (0.0%) | 0 (0.0%) |
| Electricity | 41 (44.1%) | 100 (100.0%) |
| Fuel Oil or Kerosene | 0 (0.0%) | 0 (0.0%) |
| Coal or Coke | 0 (0.0%) | 0 (0.0%) |
| All other Fuels | 29 (31.2%) | 0 (0.0%) |
| No Fuel Used | 0 (0.0%) | 0 (0.0%) |
| Total | 93 (100.0%) | 100 (100.0%) |
Household Vehicle Usage in Mckenna
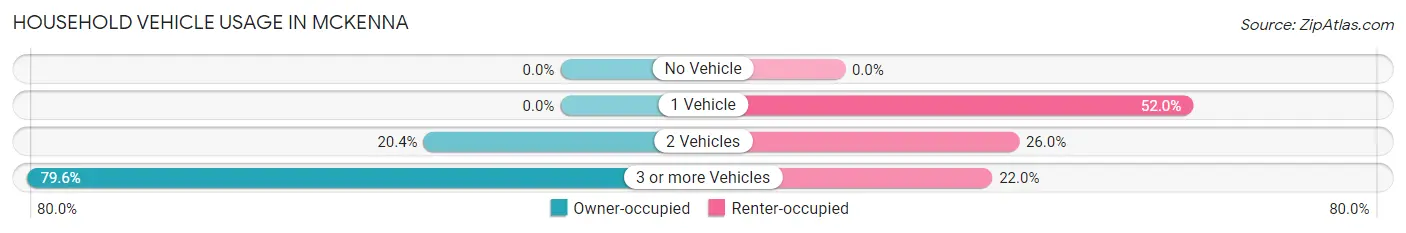
| Vehicles per Household | Owner-occupied | Renter-occupied |
| No Vehicle | 0 (0.0%) | 0 (0.0%) |
| 1 Vehicle | 0 (0.0%) | 52 (52.0%) |
| 2 Vehicles | 19 (20.4%) | 26 (26.0%) |
| 3 or more Vehicles | 74 (79.6%) | 22 (22.0%) |
| Total | 93 (100.0%) | 100 (100.0%) |
Real Estate & Mortgages in Mckenna
Real Estate and Mortgage Overview in Mckenna
| Characteristic | Without Mortgage | With Mortgage |
| Housing Units | 29 | 64 |
| Median Property Value | - | - |
| Median Household Income | - | - |
| Monthly Housing Costs | - | - |
| Real Estate Taxes | - | - |
Property Value by Mortgage Status in Mckenna
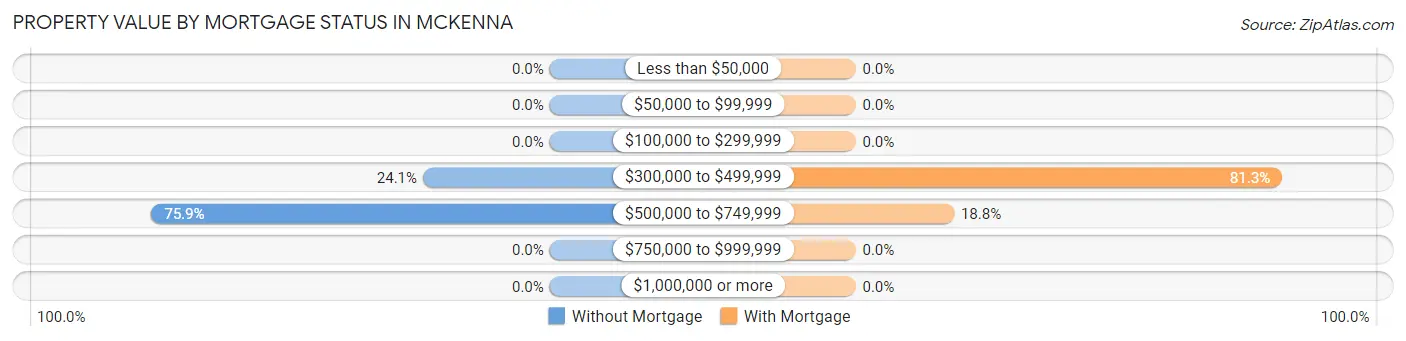
| Property Value | Without Mortgage | With Mortgage |
| Less than $50,000 | 0 (0.0%) | 0 (0.0%) |
| $50,000 to $99,999 | 0 (0.0%) | 0 (0.0%) |
| $100,000 to $299,999 | 0 (0.0%) | 0 (0.0%) |
| $300,000 to $499,999 | 7 (24.1%) | 52 (81.2%) |
| $500,000 to $749,999 | 22 (75.9%) | 12 (18.8%) |
| $750,000 to $999,999 | 0 (0.0%) | 0 (0.0%) |
| $1,000,000 or more | 0 (0.0%) | 0 (0.0%) |
| Total | 29 (100.0%) | 64 (100.0%) |
Household Income by Mortgage Status in Mckenna
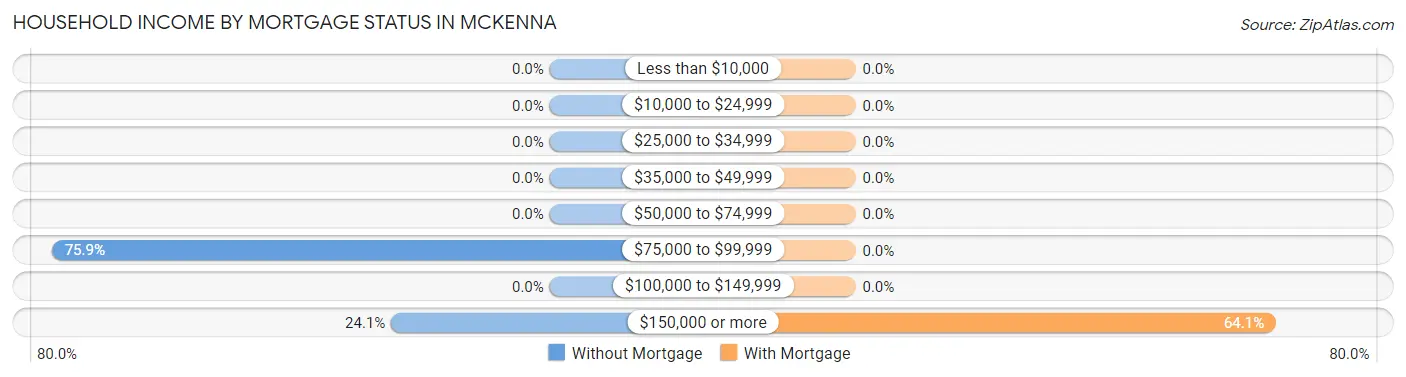
| Household Income | Without Mortgage | With Mortgage |
| Less than $10,000 | 0 (0.0%) | 0 (0.0%) |
| $10,000 to $24,999 | 0 (0.0%) | 0 (0.0%) |
| $25,000 to $34,999 | 0 (0.0%) | 0 (0.0%) |
| $35,000 to $49,999 | 0 (0.0%) | 0 (0.0%) |
| $50,000 to $74,999 | 0 (0.0%) | 0 (0.0%) |
| $75,000 to $99,999 | 22 (75.9%) | 0 (0.0%) |
| $100,000 to $149,999 | 0 (0.0%) | 0 (0.0%) |
| $150,000 or more | 7 (24.1%) | 41 (64.1%) |
| Total | 29 (100.0%) | 64 (100.0%) |
Property Value to Household Income Ratio in Mckenna
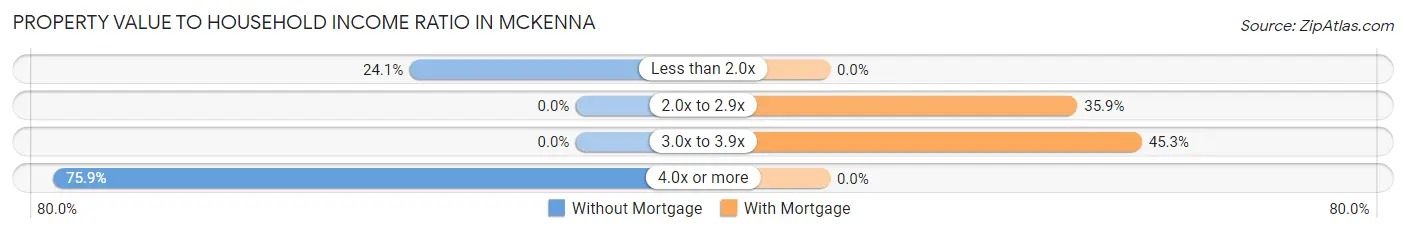
| Value-to-Income Ratio | Without Mortgage | With Mortgage |
| Less than 2.0x | 7 (24.1%) | 0 (0.0%) |
| 2.0x to 2.9x | 0 (0.0%) | 23 (35.9%) |
| 3.0x to 3.9x | 0 (0.0%) | 29 (45.3%) |
| 4.0x or more | 22 (75.9%) | 0 (0.0%) |
| Total | 29 (100.0%) | 64 (100.0%) |
Real Estate Taxes by Mortgage Status in Mckenna
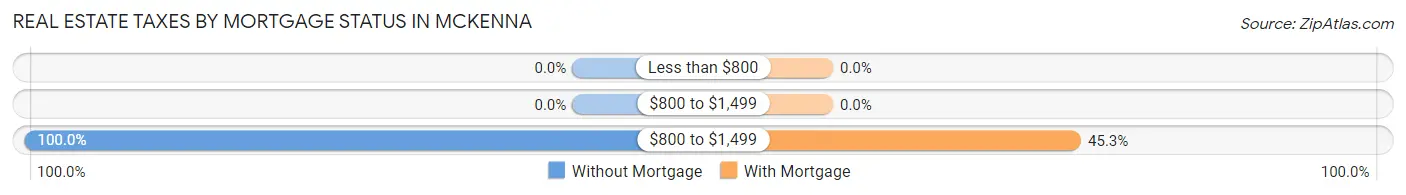
| Property Taxes | Without Mortgage | With Mortgage |
| Less than $800 | 0 (0.0%) | 0 (0.0%) |
| $800 to $1,499 | 0 (0.0%) | 0 (0.0%) |
| $800 to $1,499 | 29 (100.0%) | 29 (45.3%) |
| Total | 29 (100.0%) | 64 (100.0%) |
Health & Disability in Mckenna
Health Insurance Coverage by Age in Mckenna
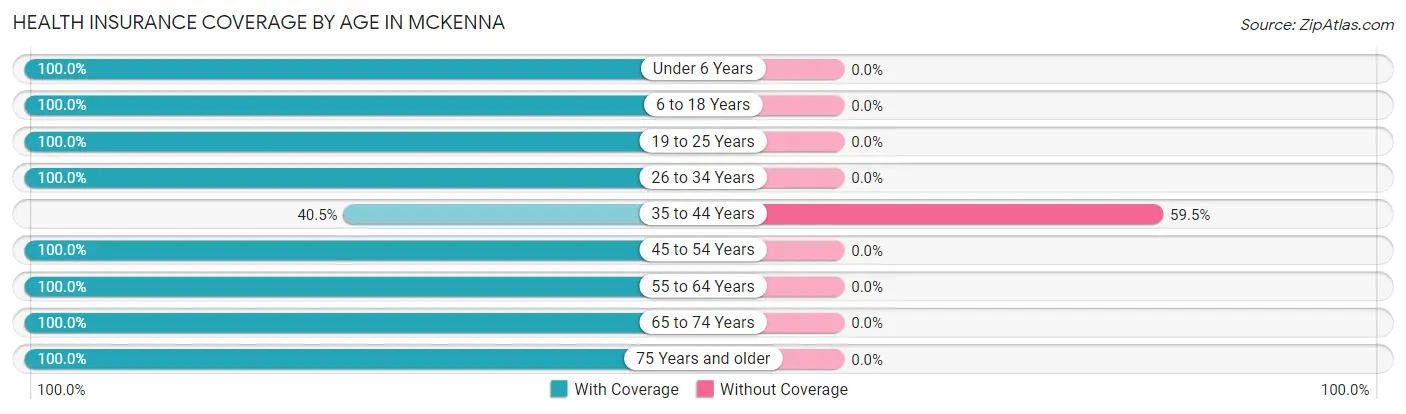
| Age Bracket | With Coverage | Without Coverage |
| Under 6 Years | 56 (100.0%) | 0 (0.0%) |
| 6 to 18 Years | 54 (100.0%) | 0 (0.0%) |
| 19 to 25 Years | 28 (100.0%) | 0 (0.0%) |
| 26 to 34 Years | 72 (100.0%) | 0 (0.0%) |
| 35 to 44 Years | 30 (40.5%) | 44 (59.5%) |
| 45 to 54 Years | 27 (100.0%) | 0 (0.0%) |
| 55 to 64 Years | 56 (100.0%) | 0 (0.0%) |
| 65 to 74 Years | 81 (100.0%) | 0 (0.0%) |
| 75 Years and older | 56 (100.0%) | 0 (0.0%) |
| Total | 460 (91.3%) | 44 (8.7%) |
Health Insurance Coverage by Citizenship Status in Mckenna
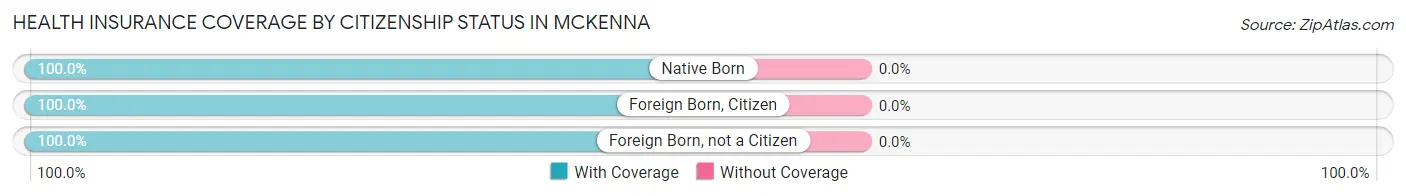
| Citizenship Status | With Coverage | Without Coverage |
| Native Born | 56 (100.0%) | 0 (0.0%) |
| Foreign Born, Citizen | 54 (100.0%) | 0 (0.0%) |
| Foreign Born, not a Citizen | 28 (100.0%) | 0 (0.0%) |
Health Insurance Coverage by Household Income in Mckenna
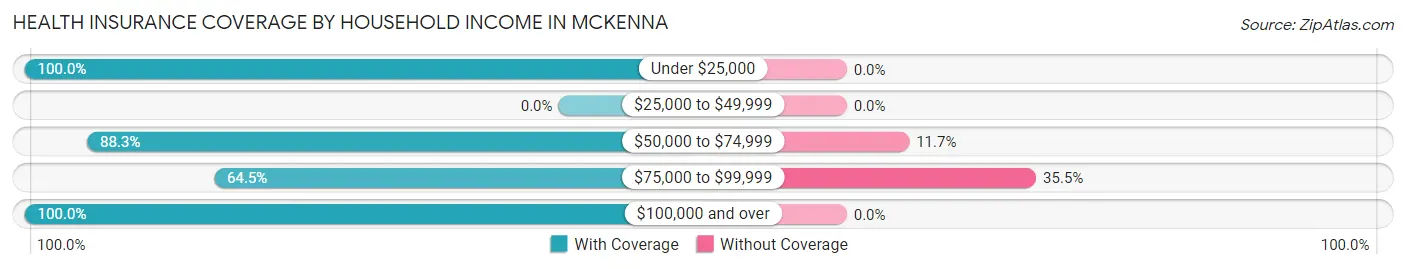
| Household Income | With Coverage | Without Coverage |
| Under $25,000 | 52 (100.0%) | 0 (0.0%) |
| $25,000 to $49,999 | 0 (0.0%) | 0 (0.0%) |
| $50,000 to $74,999 | 166 (88.3%) | 22 (11.7%) |
| $75,000 to $99,999 | 40 (64.5%) | 22 (35.5%) |
| $100,000 and over | 192 (100.0%) | 0 (0.0%) |
Public vs Private Health Insurance Coverage by Age in Mckenna
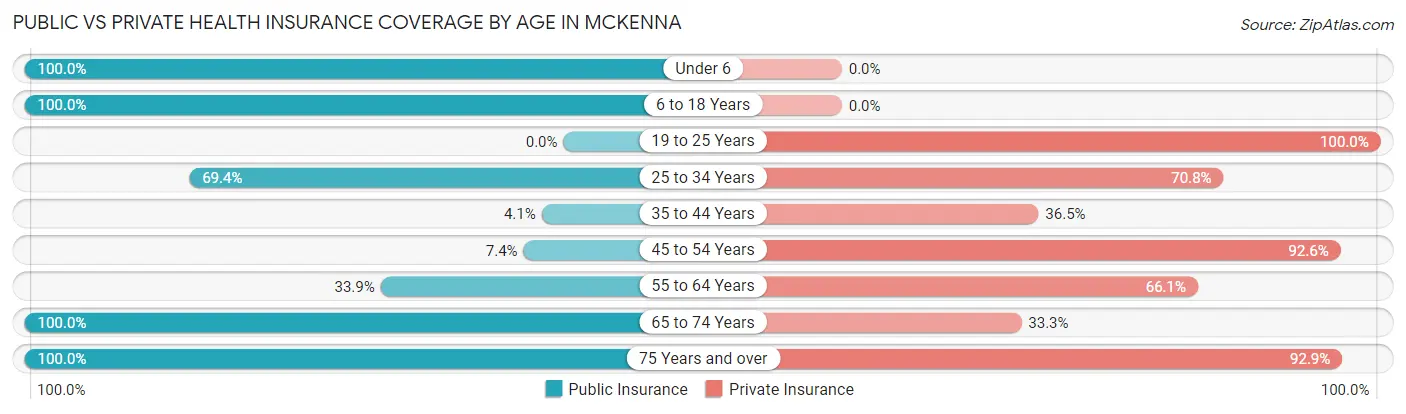
| Age Bracket | Public Insurance | Private Insurance |
| Under 6 | 56 (100.0%) | 0 (0.0%) |
| 6 to 18 Years | 54 (100.0%) | 0 (0.0%) |
| 19 to 25 Years | 0 (0.0%) | 28 (100.0%) |
| 25 to 34 Years | 50 (69.4%) | 51 (70.8%) |
| 35 to 44 Years | 3 (4.1%) | 27 (36.5%) |
| 45 to 54 Years | 2 (7.4%) | 25 (92.6%) |
| 55 to 64 Years | 19 (33.9%) | 37 (66.1%) |
| 65 to 74 Years | 81 (100.0%) | 27 (33.3%) |
| 75 Years and over | 56 (100.0%) | 52 (92.9%) |
| Total | 321 (63.7%) | 247 (49.0%) |
Disability Status by Sex by Age in Mckenna
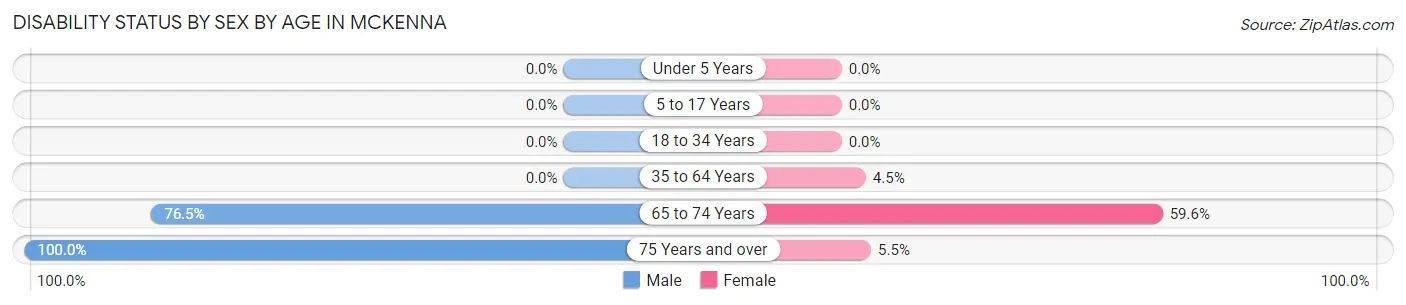
| Age Bracket | Male | Female |
| Under 5 Years | 0 (0.0%) | 0 (0.0%) |
| 5 to 17 Years | 0 (0.0%) | 0 (0.0%) |
| 18 to 34 Years | 0 (0.0%) | 0 (0.0%) |
| 35 to 64 Years | 0 (0.0%) | 3 (4.5%) |
| 65 to 74 Years | 26 (76.5%) | 28 (59.6%) |
| 75 Years and over | 1 (100.0%) | 3 (5.4%) |
Disability Class by Sex by Age in Mckenna
Disability Class: Hearing Difficulty
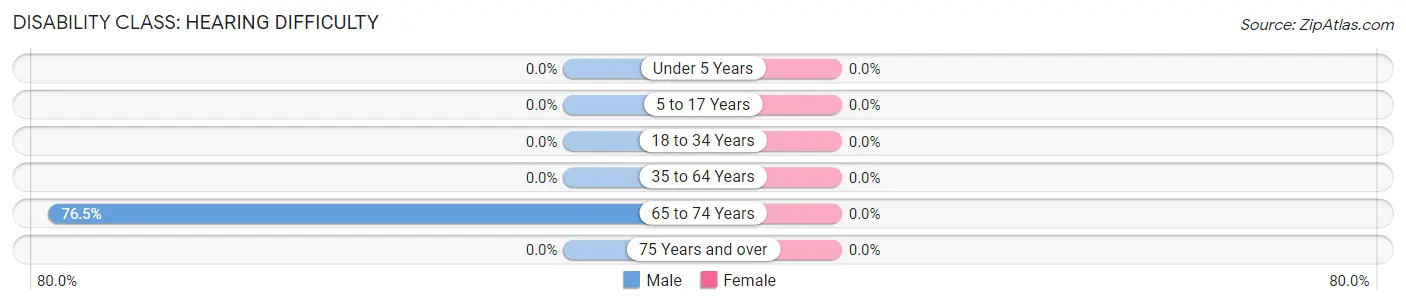
| Age Bracket | Male | Female |
| Under 5 Years | 0 (0.0%) | 0 (0.0%) |
| 5 to 17 Years | 0 (0.0%) | 0 (0.0%) |
| 18 to 34 Years | 0 (0.0%) | 0 (0.0%) |
| 35 to 64 Years | 0 (0.0%) | 0 (0.0%) |
| 65 to 74 Years | 26 (76.5%) | 0 (0.0%) |
| 75 Years and over | 0 (0.0%) | 0 (0.0%) |
Disability Class: Vision Difficulty
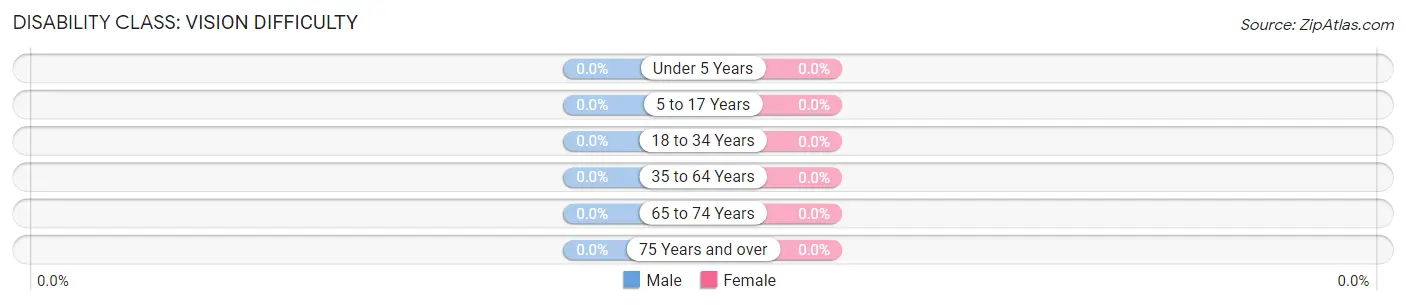
| Age Bracket | Male | Female |
| Under 5 Years | 0 (0.0%) | 0 (0.0%) |
| 5 to 17 Years | 0 (0.0%) | 0 (0.0%) |
| 18 to 34 Years | 0 (0.0%) | 0 (0.0%) |
| 35 to 64 Years | 0 (0.0%) | 0 (0.0%) |
| 65 to 74 Years | 0 (0.0%) | 0 (0.0%) |
| 75 Years and over | 0 (0.0%) | 0 (0.0%) |
Disability Class: Cognitive Difficulty
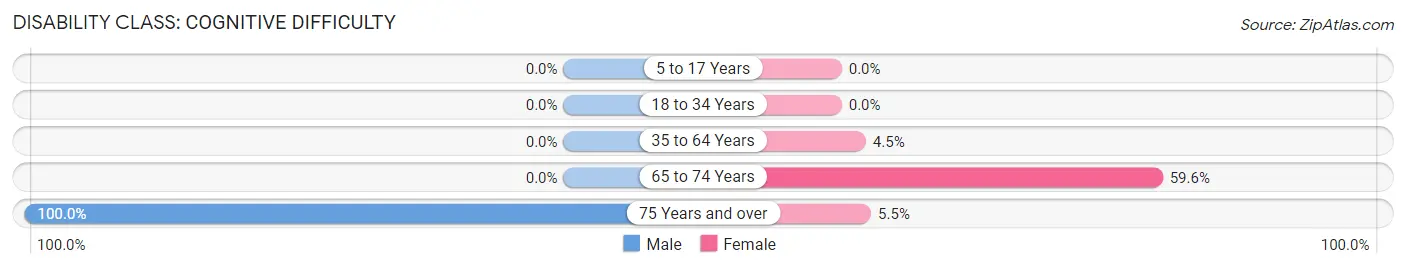
| Age Bracket | Male | Female |
| 5 to 17 Years | 0 (0.0%) | 0 (0.0%) |
| 18 to 34 Years | 0 (0.0%) | 0 (0.0%) |
| 35 to 64 Years | 0 (0.0%) | 3 (4.5%) |
| 65 to 74 Years | 0 (0.0%) | 28 (59.6%) |
| 75 Years and over | 1 (100.0%) | 3 (5.4%) |
Disability Class: Ambulatory Difficulty
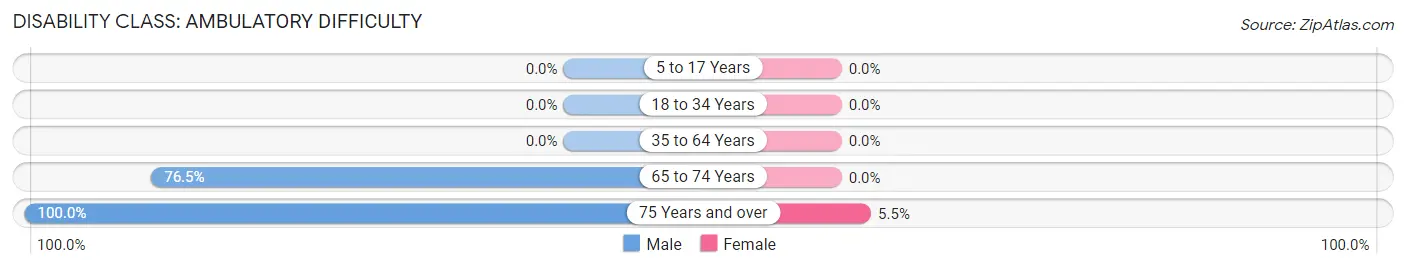
| Age Bracket | Male | Female |
| 5 to 17 Years | 0 (0.0%) | 0 (0.0%) |
| 18 to 34 Years | 0 (0.0%) | 0 (0.0%) |
| 35 to 64 Years | 0 (0.0%) | 0 (0.0%) |
| 65 to 74 Years | 26 (76.5%) | 0 (0.0%) |
| 75 Years and over | 1 (100.0%) | 3 (5.4%) |
Disability Class: Self-Care Difficulty
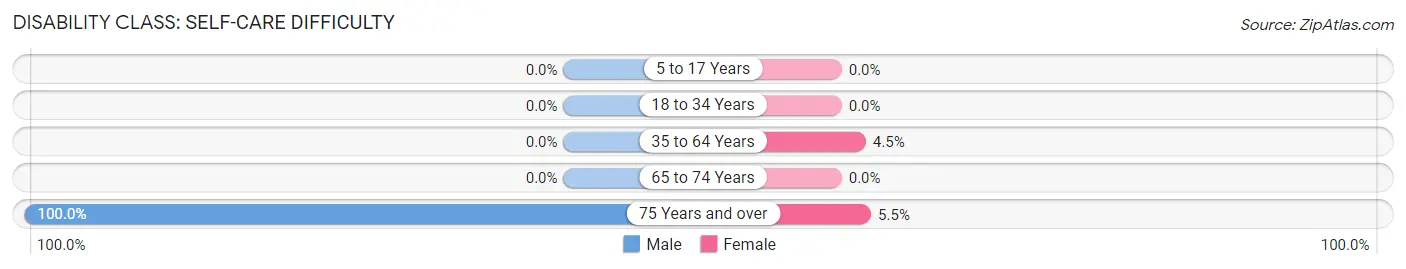
| Age Bracket | Male | Female |
| 5 to 17 Years | 0 (0.0%) | 0 (0.0%) |
| 18 to 34 Years | 0 (0.0%) | 0 (0.0%) |
| 35 to 64 Years | 0 (0.0%) | 3 (4.5%) |
| 65 to 74 Years | 0 (0.0%) | 0 (0.0%) |
| 75 Years and over | 1 (100.0%) | 3 (5.4%) |
Technology Access in Mckenna
Computing Device Access in Mckenna
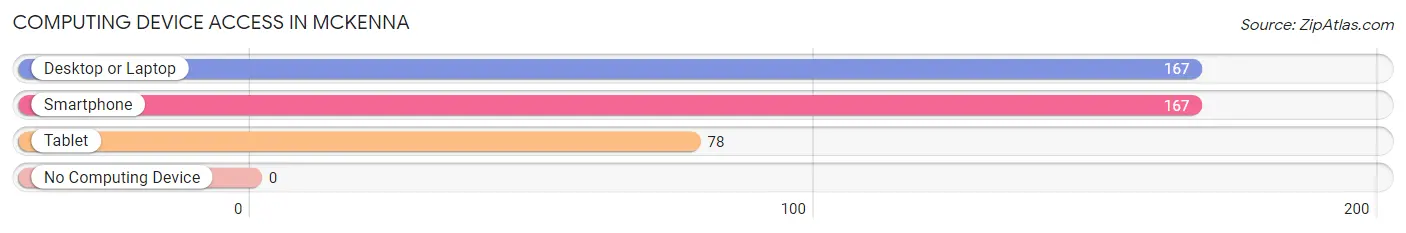
| Device Type | # Households | % Households |
| Desktop or Laptop | 167 | 86.5% |
| Smartphone | 167 | 86.5% |
| Tablet | 78 | 40.4% |
| No Computing Device | 0 | 0.0% |
| Total | 193 | 100.0% |
Internet Access in Mckenna
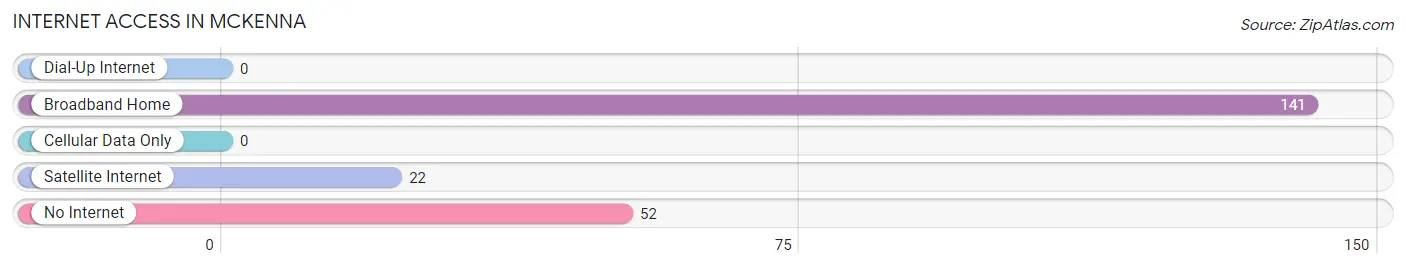
| Internet Type | # Households | % Households |
| Dial-Up Internet | 0 | 0.0% |
| Broadband Home | 141 | 73.1% |
| Cellular Data Only | 0 | 0.0% |
| Satellite Internet | 22 | 11.4% |
| No Internet | 52 | 26.9% |
| Total | 193 | 100.0% |
Mckenna Summary
Mckenna is a small town located in Pierce County, Washington, United States. It is situated in the foothills of the Cascade Mountains, approximately 25 miles south of Tacoma and 40 miles east of Seattle. The town has a population of approximately 1,500 people and is part of the greater Tacoma metropolitan area.
History
Mckenna was founded in 1883 by a group of settlers from the Midwest. The town was named after the first settler, John Mckenna, who had come from Ohio. The town was originally a logging and farming community, and the first post office was established in 1884.
In the early 1900s, the town began to grow and develop. The first school was built in 1906, and the first church was built in 1908. The town also had a general store, a blacksmith shop, and a sawmill.
In the 1920s, the town began to experience a period of growth and prosperity. The population increased from 500 to 1,000 people, and the town was incorporated in 1925. The town also had a bank, a movie theater, and a library.
In the 1950s, the town experienced a period of decline. The population decreased to 500 people, and many of the businesses closed. The town was also affected by the construction of Interstate 5, which bypassed the town.
In the 1970s, the town began to experience a period of revitalization. The population increased to 1,000 people, and new businesses opened. The town also had a new library, a new school, and a new park.
Geography
Mckenna is located in the foothills of the Cascade Mountains, approximately 25 miles south of Tacoma and 40 miles east of Seattle. The town is situated in a valley surrounded by hills and mountains. The town is located at an elevation of 1,000 feet above sea level.
The climate in Mckenna is mild and temperate. The average temperature in the summer is around 70 degrees Fahrenheit, and the average temperature in the winter is around 40 degrees Fahrenheit. The town receives an average of 40 inches of rain per year.
Economy
Mckenna is a small town with a limited economy. The town is primarily a bedroom community, with most of the residents commuting to nearby cities for work. The town also has a few small businesses, including a grocery store, a hardware store, and a few restaurants.
The town is also home to a few small manufacturing companies, including a furniture manufacturer and a woodworking company. The town also has a few small farms, which produce vegetables, fruits, and dairy products.
Demographics
Mckenna has a population of approximately 1,500 people. The town is predominantly white, with approximately 90% of the population being white. The town also has a small Hispanic population, with approximately 5% of the population being Hispanic. The town also has a small African American population, with approximately 2% of the population being African American.
The median household income in Mckenna is approximately $50,000 per year. The town also has a high rate of homeownership, with approximately 80% of the population owning their own homes. The town also has a low unemployment rate, with approximately 3% of the population being unemployed.
Common Questions
What is Per Capita Income in Mckenna?
Per Capita income in Mckenna is $55,349.
What is the Median Family Income in Mckenna?
Median Family Income in Mckenna is $95,043.
What is the Median Household income in Mckenna?
Median Household Income in Mckenna is $74,602.
What is Inequality or Gini Index in Mckenna?
Inequality or Gini Index in Mckenna is 0.56.
What is the Total Population of Mckenna?
Total Population of Mckenna is 554.
What is the Total Male Population of Mckenna?
Total Male Population of Mckenna is 325.
What is the Total Female Population of Mckenna?
Total Female Population of Mckenna is 229.
What is the Ratio of Males per 100 Females in Mckenna?
There are 141.92 Males per 100 Females in Mckenna.
What is the Ratio of Females per 100 Males in Mckenna?
There are 70.46 Females per 100 Males in Mckenna.
What is the Median Population Age in Mckenna?
Median Population Age in Mckenna is 37.9 Years.
What is the Average Family Size in Mckenna
Average Family Size in Mckenna is 2.8 People.
What is the Average Household Size in Mckenna
Average Household Size in Mckenna is 2.6 People.
How Large is the Labor Force in Mckenna?
There are 249 People in the Labor Forcein in Mckenna.
What is the Percentage of People in the Labor Force in Mckenna?
56.1% of People are in the Labor Force in Mckenna.
What is the Unemployment Rate in Mckenna?
Unemployment Rate in Mckenna is 20.9%.