Cities with the Highest Percentage of Households Without a Vehicle in Illinois
RELATED REPORTS & OPTIONS
Households without a Cars
Illinois
Compare Cities
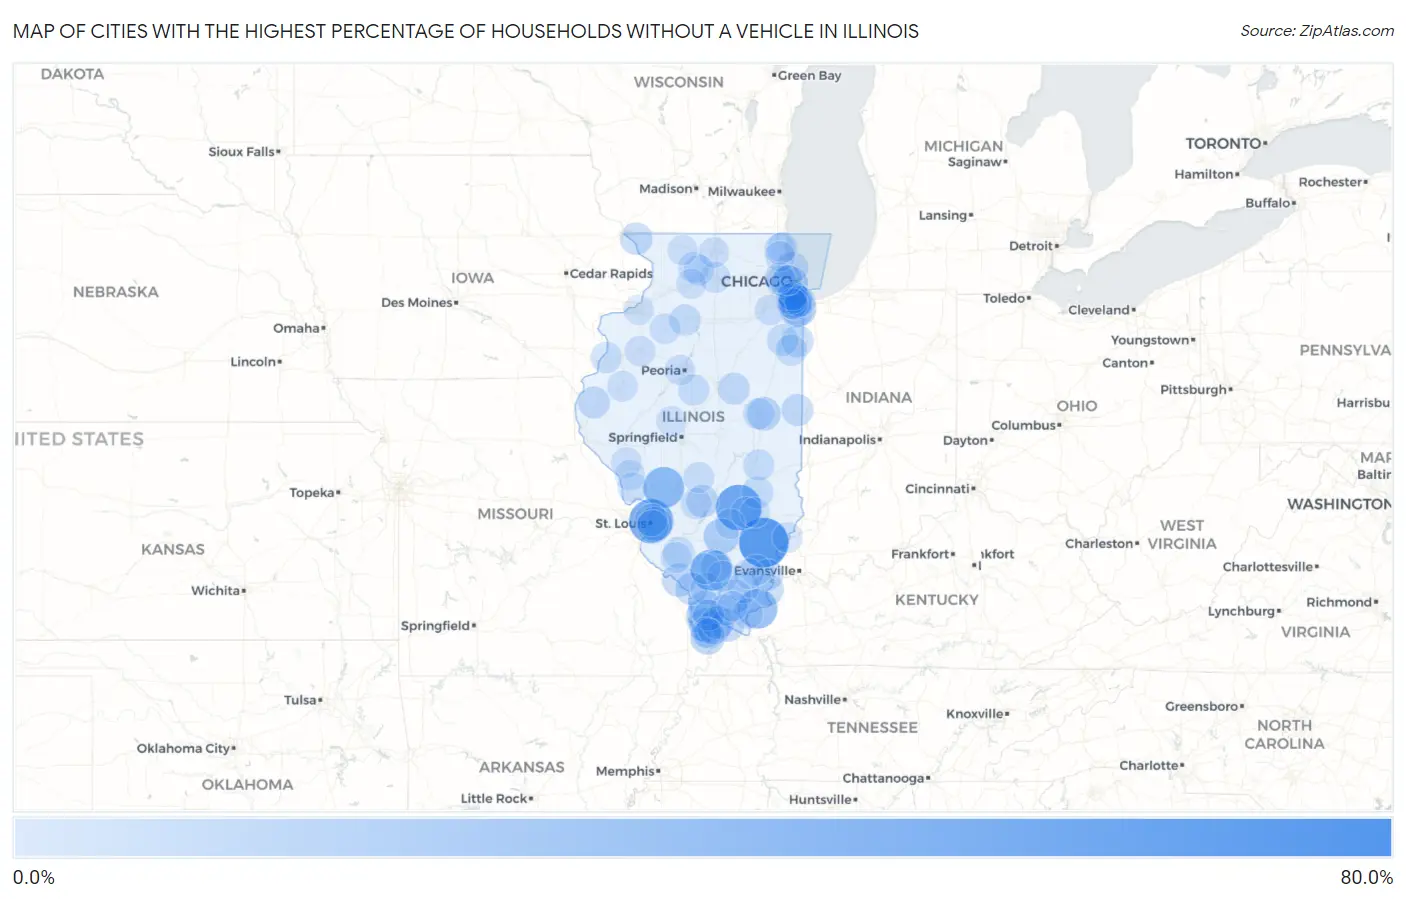
Map of Cities with the Highest Percentage of Households Without a Vehicle in Illinois
0.0%
80.0%
Cities with the Highest Percentage of Households Without a Vehicle in Illinois
| City | Housholds Without a Car | vs State | vs National | |
| 1. | Millersburg | 67.4% | 10.8%(+56.6)#1 | 8.3%(+59.1)#161 |
| 2. | Golden Gate | 62.1% | 10.8%(+51.3)#2 | 8.3%(+53.8)#178 |
| 3. | Iola | 51.7% | 10.8%(+40.9)#3 | 8.3%(+43.4)#227 |
| 4. | Brooklyn | 48.5% | 10.8%(+37.7)#4 | 8.3%(+40.2)#247 |
| 5. | Taylor Ridge | 45.0% | 10.8%(+34.2)#5 | 8.3%(+36.7)#281 |
| 6. | Mulkeytown | 40.0% | 10.8%(+29.2)#6 | 8.3%(+31.7)#344 |
| 7. | Royal Lakes | 39.6% | 10.8%(+28.8)#7 | 8.3%(+31.3)#349 |
| 8. | Elizabethtown | 36.3% | 10.8%(+25.5)#8 | 8.3%(+28.0)#402 |
| 9. | Chicago | 26.7% | 10.8%(+15.9)#9 | 8.3%(+18.4)#742 |
| 10. | Dix | 25.4% | 10.8%(+14.6)#10 | 8.3%(+17.1)#823 |
| 11. | Mill Creek | 25.0% | 10.8%(+14.2)#11 | 8.3%(+16.7)#858 |
| 12. | Oxville | 25.0% | 10.8%(+14.2)#12 | 8.3%(+16.7)#861 |
| 13. | Ford Heights | 24.8% | 10.8%(+14.0)#13 | 8.3%(+16.5)#871 |
| 14. | Pulaski | 23.3% | 10.8%(+12.5)#14 | 8.3%(+15.0)#989 |
| 15. | East St Louis | 22.6% | 10.8%(+11.8)#15 | 8.3%(+14.3)#1,035 |
| 16. | Cairo | 22.6% | 10.8%(+11.8)#16 | 8.3%(+14.3)#1,040 |
| 17. | Elwin | 21.9% | 10.8%(+11.1)#17 | 8.3%(+13.6)#1,142 |
| 18. | Olmsted | 21.6% | 10.8%(+10.8)#18 | 8.3%(+13.3)#1,170 |
| 19. | Cahokia Heights | 21.4% | 10.8%(+10.6)#19 | 8.3%(+13.1)#1,189 |
| 20. | Urbana | 21.0% | 10.8%(+10.2)#20 | 8.3%(+12.7)#1,252 |
| 21. | Stonefort | 21.0% | 10.8%(+10.2)#21 | 8.3%(+12.7)#1,263 |
| 22. | Anna | 20.9% | 10.8%(+10.1)#22 | 8.3%(+12.6)#1,268 |
| 23. | Joppa | 20.2% | 10.8%(+9.40)#23 | 8.3%(+11.9)#1,377 |
| 24. | Harvey | 20.0% | 10.8%(+9.20)#24 | 8.3%(+11.7)#1,393 |
| 25. | New Grand Chain | 20.0% | 10.8%(+9.20)#25 | 8.3%(+11.7)#1,406 |
| 26. | Rockwood | 20.0% | 10.8%(+9.20)#26 | 8.3%(+11.7)#1,419 |
| 27. | Phoenix | 19.6% | 10.8%(+8.80)#27 | 8.3%(+11.3)#1,482 |
| 28. | Riverdale | 19.4% | 10.8%(+8.60)#28 | 8.3%(+11.1)#1,509 |
| 29. | South Chicago Heights | 18.6% | 10.8%(+7.80)#29 | 8.3%(+10.3)#1,654 |
| 30. | East Hazel Crest | 18.6% | 10.8%(+7.80)#30 | 8.3%(+10.3)#1,660 |
| 31. | Venice | 18.2% | 10.8%(+7.40)#31 | 8.3%(+9.90)#1,730 |
| 32. | Gorham | 18.2% | 10.8%(+7.40)#32 | 8.3%(+9.90)#1,739 |
| 33. | Mulberry Grove | 18.0% | 10.8%(+7.20)#33 | 8.3%(+9.70)#1,780 |
| 34. | Old Shawneetown | 18.0% | 10.8%(+7.20)#34 | 8.3%(+9.70)#1,786 |
| 35. | Galena | 17.6% | 10.8%(+6.80)#35 | 8.3%(+9.30)#1,870 |
| 36. | Sauget | 17.6% | 10.8%(+6.80)#36 | 8.3%(+9.30)#1,883 |
| 37. | West Point | 17.2% | 10.8%(+6.40)#37 | 8.3%(+8.90)#1,986 |
| 38. | Hopkins Park | 17.0% | 10.8%(+6.20)#38 | 8.3%(+8.70)#2,031 |
| 39. | Ellsworth | 17.0% | 10.8%(+6.20)#39 | 8.3%(+8.70)#2,033 |
| 40. | Prairietown | 16.8% | 10.8%(+6.00)#40 | 8.3%(+8.50)#2,083 |
| 41. | Danville | 16.7% | 10.8%(+5.90)#41 | 8.3%(+8.40)#2,090 |
| 42. | Carbondale | 16.4% | 10.8%(+5.60)#42 | 8.3%(+8.10)#2,182 |
| 43. | Evanston | 16.3% | 10.8%(+5.50)#43 | 8.3%(+8.00)#2,214 |
| 44. | Wheeler | 16.3% | 10.8%(+5.50)#44 | 8.3%(+8.00)#2,247 |
| 45. | Valier | 16.2% | 10.8%(+5.40)#45 | 8.3%(+7.90)#2,266 |
| 46. | Kankakee | 15.9% | 10.8%(+5.10)#46 | 8.3%(+7.60)#2,335 |
| 47. | Wyanet | 15.8% | 10.8%(+5.00)#47 | 8.3%(+7.50)#2,398 |
| 48. | New Haven | 15.8% | 10.8%(+5.00)#48 | 8.3%(+7.50)#2,404 |
| 49. | Tilden | 15.7% | 10.8%(+4.90)#49 | 8.3%(+7.40)#2,441 |
| 50. | Harrisburg | 15.4% | 10.8%(+4.60)#50 | 8.3%(+7.10)#2,532 |
| 51. | Nekoma | 15.4% | 10.8%(+4.60)#51 | 8.3%(+7.10)#2,558 |
| 52. | Gladstone | 15.3% | 10.8%(+4.50)#52 | 8.3%(+7.00)#2,601 |
| 53. | Papineau | 15.2% | 10.8%(+4.40)#53 | 8.3%(+6.90)#2,636 |
| 54. | Mount Morris | 15.1% | 10.8%(+4.30)#54 | 8.3%(+6.80)#2,649 |
| 55. | Vienna | 15.1% | 10.8%(+4.30)#55 | 8.3%(+6.80)#2,654 |
| 56. | Champaign | 14.9% | 10.8%(+4.10)#56 | 8.3%(+6.60)#2,708 |
| 57. | Green Oaks | 14.9% | 10.8%(+4.10)#57 | 8.3%(+6.60)#2,718 |
| 58. | Lerna | 14.9% | 10.8%(+4.10)#58 | 8.3%(+6.60)#2,745 |
| 59. | Louisville | 14.8% | 10.8%(+4.00)#59 | 8.3%(+6.50)#2,765 |
| 60. | Hopedale | 14.8% | 10.8%(+4.00)#60 | 8.3%(+6.50)#2,770 |
| 61. | Greenville | 14.5% | 10.8%(+3.70)#61 | 8.3%(+6.20)#2,873 |
| 62. | Witt | 14.5% | 10.8%(+3.70)#62 | 8.3%(+6.20)#2,895 |
| 63. | Dongola | 14.5% | 10.8%(+3.70)#63 | 8.3%(+6.20)#2,896 |
| 64. | Blue Island | 14.4% | 10.8%(+3.60)#64 | 8.3%(+6.10)#2,914 |
| 65. | Robbins | 14.4% | 10.8%(+3.60)#65 | 8.3%(+6.10)#2,925 |
| 66. | Calumet City | 14.3% | 10.8%(+3.50)#66 | 8.3%(+6.00)#2,961 |
| 67. | Hillside | 14.3% | 10.8%(+3.50)#67 | 8.3%(+6.00)#2,967 |
| 68. | West Frankfort | 14.3% | 10.8%(+3.50)#68 | 8.3%(+6.00)#2,969 |
| 69. | Sparta | 14.2% | 10.8%(+3.40)#69 | 8.3%(+5.90)#3,021 |
| 70. | Merrionette Park | 14.1% | 10.8%(+3.30)#70 | 8.3%(+5.80)#3,065 |
| 71. | Norris City | 14.1% | 10.8%(+3.30)#71 | 8.3%(+5.80)#3,072 |
| 72. | Du Quoin | 14.0% | 10.8%(+3.20)#72 | 8.3%(+5.70)#3,101 |
| 73. | Rochelle | 13.9% | 10.8%(+3.10)#73 | 8.3%(+5.60)#3,134 |
| 74. | North Chicago | 13.8% | 10.8%(+3.00)#74 | 8.3%(+5.50)#3,172 |
| 75. | Pearl | 13.8% | 10.8%(+3.00)#75 | 8.3%(+5.50)#3,216 |
| 76. | Galesburg | 13.7% | 10.8%(+2.90)#76 | 8.3%(+5.40)#3,221 |
| 77. | Macomb | 13.7% | 10.8%(+2.90)#77 | 8.3%(+5.40)#3,225 |
| 78. | Kewanee | 13.7% | 10.8%(+2.90)#78 | 8.3%(+5.40)#3,228 |
| 79. | Golconda | 13.7% | 10.8%(+2.90)#79 | 8.3%(+5.40)#3,252 |
| 80. | Preston Heights | 13.6% | 10.8%(+2.80)#80 | 8.3%(+5.30)#3,283 |
| 81. | Hazel Crest | 13.4% | 10.8%(+2.60)#81 | 8.3%(+5.10)#3,354 |
| 82. | Oregon | 13.4% | 10.8%(+2.60)#82 | 8.3%(+5.10)#3,367 |
| 83. | Mound City | 13.4% | 10.8%(+2.60)#83 | 8.3%(+5.10)#3,386 |
| 84. | Mount Carmel | 13.3% | 10.8%(+2.50)#84 | 8.3%(+5.00)#3,403 |
| 85. | Simpson | 13.3% | 10.8%(+2.50)#85 | 8.3%(+5.00)#3,438 |
| 86. | Bellevue | 13.2% | 10.8%(+2.40)#86 | 8.3%(+4.90)#3,459 |
| 87. | Rockford | 13.1% | 10.8%(+2.30)#87 | 8.3%(+4.80)#3,493 |
| 88. | Lincolnshire | 13.1% | 10.8%(+2.30)#88 | 8.3%(+4.80)#3,499 |
| 89. | Mounds | 13.1% | 10.8%(+2.30)#89 | 8.3%(+4.80)#3,519 |
| 90. | Northlake | 13.0% | 10.8%(+2.20)#90 | 8.3%(+4.70)#3,539 |
| 91. | Broughton | 13.0% | 10.8%(+2.20)#91 | 8.3%(+4.70)#3,573 |
| 92. | Petersburg | 12.9% | 10.8%(+2.10)#92 | 8.3%(+4.60)#3,596 |
| 93. | Eldred | 12.9% | 10.8%(+2.10)#93 | 8.3%(+4.60)#3,623 |
| 94. | Sailor Springs | 12.8% | 10.8%(+2.00)#94 | 8.3%(+4.50)#3,681 |
| 95. | Dixon | 12.7% | 10.8%(+1.90)#95 | 8.3%(+4.40)#3,687 |
| 96. | Silvis | 12.7% | 10.8%(+1.90)#96 | 8.3%(+4.40)#3,691 |
| 97. | Iuka | 12.7% | 10.8%(+1.90)#97 | 8.3%(+4.40)#3,725 |
| 98. | Fieldon | 12.7% | 10.8%(+1.90)#98 | 8.3%(+4.40)#3,733 |
| 99. | Freeport | 12.6% | 10.8%(+1.80)#99 | 8.3%(+4.30)#3,738 |
| 100. | Oak Park | 12.5% | 10.8%(+1.70)#100 | 8.3%(+4.20)#3,789 |
Common Questions
What are the Top 10 Cities with the Highest Percentage of Households Without a Vehicle in Illinois?
Top 10 Cities with the Highest Percentage of Households Without a Vehicle in Illinois are:
#1
62.1%
#2
51.7%
#3
48.5%
#4
40.0%
#5
39.6%
#6
36.3%
#7
26.7%
#8
25.4%
#9
25.0%
#10
24.8%
What city has the Highest Percentage of Households Without a Vehicle in Illinois?
Golden Gate has the Highest Percentage of Households Without a Vehicle in Illinois with 62.1%.
What is the Percentage of Households Without a Vehicle in the State of Illinois?
Percentage of Households Without a Vehicle in Illinois is 10.8%.
What is the Percentage of Households Without a Vehicle in the United States?
Percentage of Households Without a Vehicle in the United States is 8.3%.