McSwain, CA Map & Demographics
McSwain Map
McSwain Overview
$68,324
PER CAPITA INCOME
$137,370
AVG FAMILY INCOME
$122,235
AVG HOUSEHOLD INCOME
19.5%
WAGE / INCOME GAP [ % ]
80.5¢/ $1
WAGE / INCOME GAP [ $ ]
0.60
INEQUALITY / GINI INDEX
5,042
TOTAL POPULATION
2,887
MALE POPULATION
2,155
FEMALE POPULATION
133.97
MALES / 100 FEMALES
74.64
FEMALES / 100 MALES
38.1
MEDIAN AGE
3.6
AVG FAMILY SIZE
3.2
AVG HOUSEHOLD SIZE
2,286
LABOR FORCE [ PEOPLE ]
61.4%
PERCENT IN LABOR FORCE
4.1%
UNEMPLOYMENT RATE
Income in McSwain
Income Overview in McSwain
Per Capita Income in McSwain is $68,324, while median incomes of families and households are $137,370 and $122,235 respectively.
| Characteristic | Number | Measure |
| Per Capita Income | 5,042 | $68,324 |
| Median Family Income | 1,285 | $137,370 |
| Mean Family Income | 1,285 | $245,524 |
| Median Household Income | 1,548 | $122,235 |
| Mean Household Income | 1,548 | $215,274 |
| Income Deficit | 1,285 | $0 |
| Wage / Income Gap (%) | 5,042 | 19.45% |
| Wage / Income Gap ($) | 5,042 | 80.55¢ per $1 |
| Gini / Inequality Index | 5,042 | 0.60 |
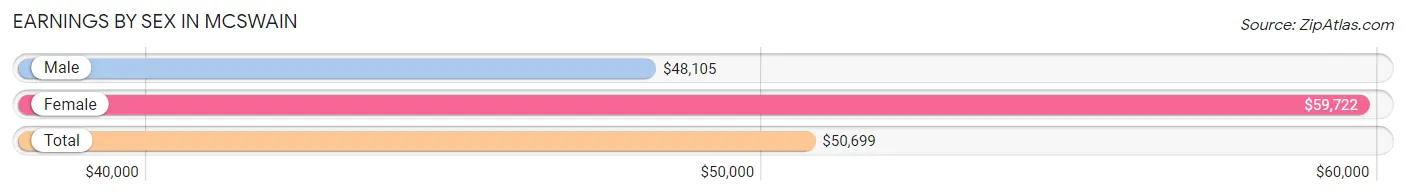
Earnings by Sex in McSwain
Average Earnings in McSwain are $50,699, $48,105 for men and $59,722 for women, a difference of 19.5%.
| Sex | Number | Average Earnings |
| Male | 1,377 (60.4%) | $48,105 |
| Female | 902 (39.6%) | $59,722 |
| Total | 2,279 (100.0%) | $50,699 |
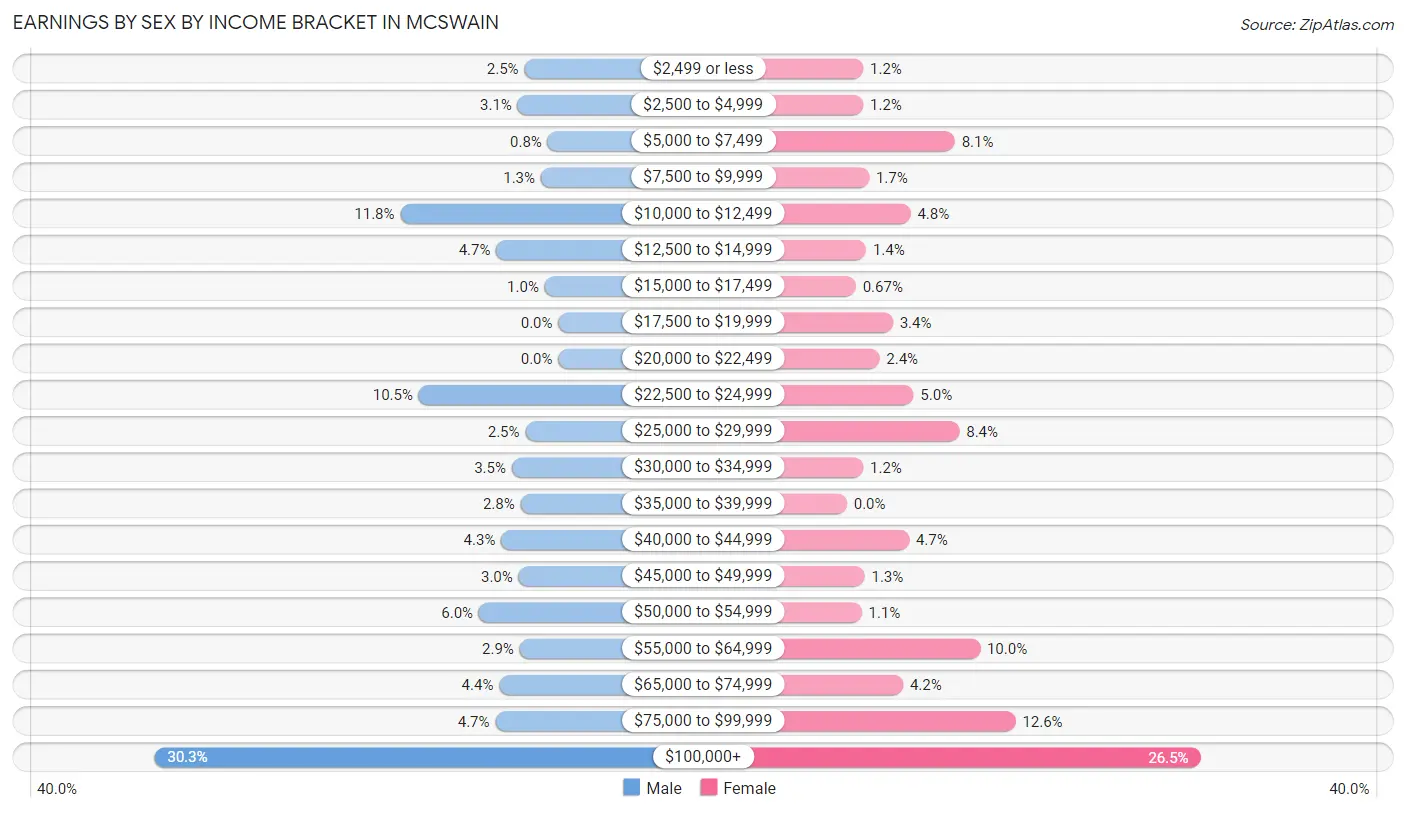
Earnings by Sex by Income Bracket in McSwain
The most common earnings brackets in McSwain are $100,000+ for men (417 | 30.3%) and $100,000+ for women (239 | 26.5%).
| Income | Male | Female |
| $2,499 or less | 35 (2.5%) | 11 (1.2%) |
| $2,500 to $4,999 | 42 (3.0%) | 11 (1.2%) |
| $5,000 to $7,499 | 11 (0.8%) | 73 (8.1%) |
| $7,500 to $9,999 | 18 (1.3%) | 15 (1.7%) |
| $10,000 to $12,499 | 163 (11.8%) | 43 (4.8%) |
| $12,500 to $14,999 | 64 (4.6%) | 13 (1.4%) |
| $15,000 to $17,499 | 14 (1.0%) | 6 (0.7%) |
| $17,500 to $19,999 | 0 (0.0%) | 31 (3.4%) |
| $20,000 to $22,499 | 0 (0.0%) | 22 (2.4%) |
| $22,500 to $24,999 | 144 (10.5%) | 45 (5.0%) |
| $25,000 to $29,999 | 34 (2.5%) | 76 (8.4%) |
| $30,000 to $34,999 | 48 (3.5%) | 11 (1.2%) |
| $35,000 to $39,999 | 39 (2.8%) | 0 (0.0%) |
| $40,000 to $44,999 | 59 (4.3%) | 42 (4.7%) |
| $45,000 to $49,999 | 41 (3.0%) | 12 (1.3%) |
| $50,000 to $54,999 | 82 (5.9%) | 10 (1.1%) |
| $55,000 to $64,999 | 40 (2.9%) | 90 (10.0%) |
| $65,000 to $74,999 | 61 (4.4%) | 38 (4.2%) |
| $75,000 to $99,999 | 65 (4.7%) | 114 (12.6%) |
| $100,000+ | 417 (30.3%) | 239 (26.5%) |
| Total | 1,377 (100.0%) | 902 (100.0%) |
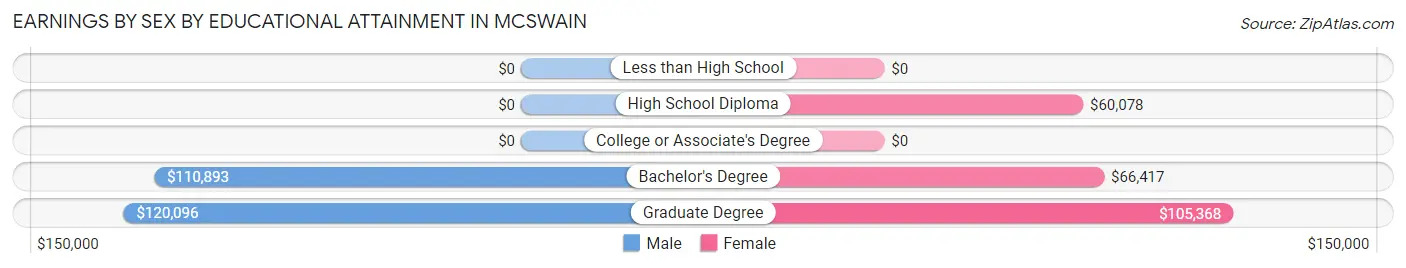
Earnings by Sex by Educational Attainment in McSwain
Average earnings in McSwain are $56,875 for men and $65,167 for women, a difference of 12.7%. Men with an educational attainment of graduate degree enjoy the highest average annual earnings of $120,096, while those with bachelor's degree education earn the least with $110,893. Women with an educational attainment of graduate degree earn the most with the average annual earnings of $105,368, while those with high school diploma education have the smallest earnings of $60,078.
| Educational Attainment | Male Income | Female Income |
| Less than High School | - | - |
| High School Diploma | - | - |
| College or Associate's Degree | - | - |
| Bachelor's Degree | $110,893 | $66,417 |
| Graduate Degree | $120,096 | $105,368 |
| Total | $56,875 | $65,167 |
Family Income in McSwain
Family Income Brackets in McSwain
According to the McSwain family income data, there are 412 families falling into the $200,000+ income range, which is the most common income bracket and makes up 32.1% of all families.
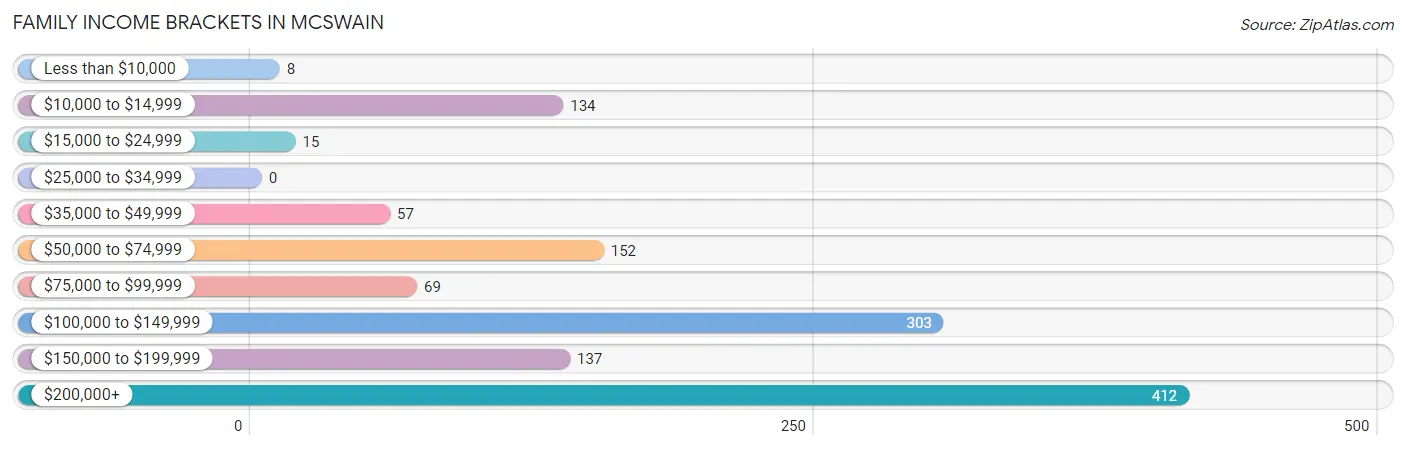
| Income Bracket | # Families | % Families |
| Less than $10,000 | 8 | 0.6% |
| $10,000 to $14,999 | 134 | 10.4% |
| $15,000 to $24,999 | 15 | 1.2% |
| $25,000 to $34,999 | 0 | 0.0% |
| $35,000 to $49,999 | 57 | 4.4% |
| $50,000 to $74,999 | 152 | 11.8% |
| $75,000 to $99,999 | 69 | 5.4% |
| $100,000 to $149,999 | 303 | 23.6% |
| $150,000 to $199,999 | 137 | 10.7% |
| $200,000+ | 412 | 32.1% |
Family Income by Famaliy Size in McSwain
6-person families (58 | 4.5%) account for the highest median family income in McSwain with $250,001 per family, while 2-person families (450 | 35.0%) have the highest median income of $60,871 per family member.
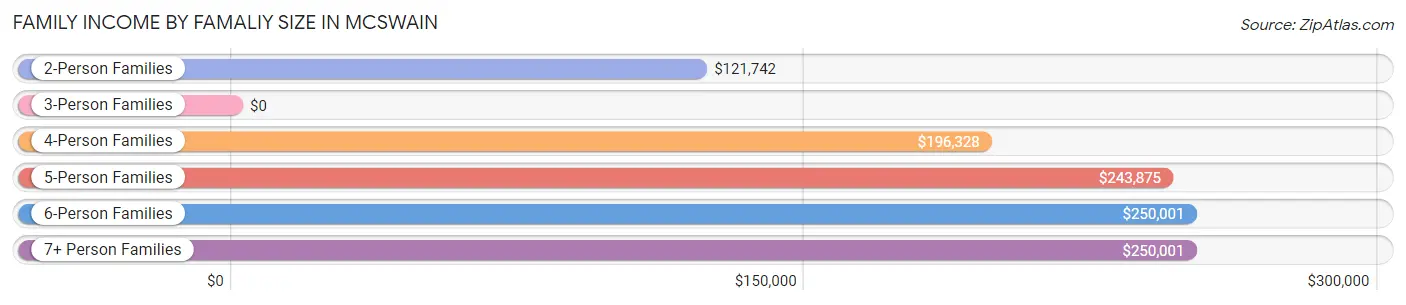
| Income Bracket | # Families | Median Income |
| 2-Person Families | 450 (35.0%) | $121,742 |
| 3-Person Families | 379 (29.5%) | $0 |
| 4-Person Families | 307 (23.9%) | $196,328 |
| 5-Person Families | 27 (2.1%) | $243,875 |
| 6-Person Families | 58 (4.5%) | $250,001 |
| 7+ Person Families | 64 (5.0%) | $250,001 |
| Total | 1,285 (100.0%) | $137,370 |
Family Income by Number of Earners in McSwain
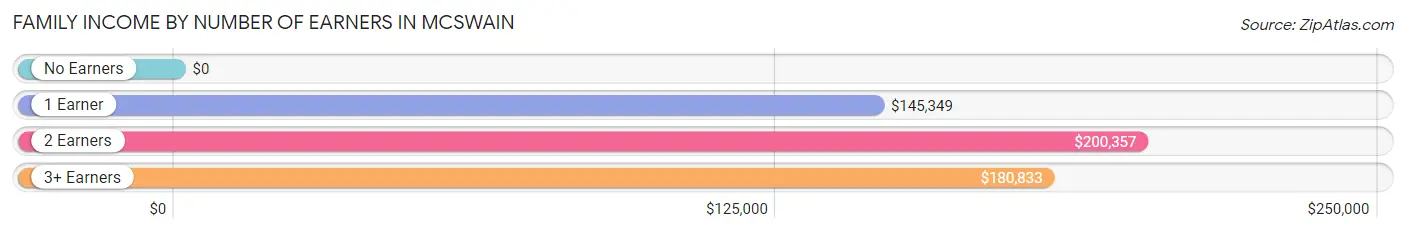
| Number of Earners | # Families | Median Income |
| No Earners | 324 (25.2%) | $0 |
| 1 Earner | 299 (23.3%) | $145,349 |
| 2 Earners | 432 (33.6%) | $200,357 |
| 3+ Earners | 230 (17.9%) | $180,833 |
| Total | 1,285 (100.0%) | $137,370 |
Household Income in McSwain
Household Income Brackets in McSwain
With 438 households falling in the category, the $200,000+ income range is the most frequent in McSwain, accounting for 28.3% of all households. In contrast, only 39 households (2.5%) fall into the less than $10,000 income bracket, making it the least populous group.
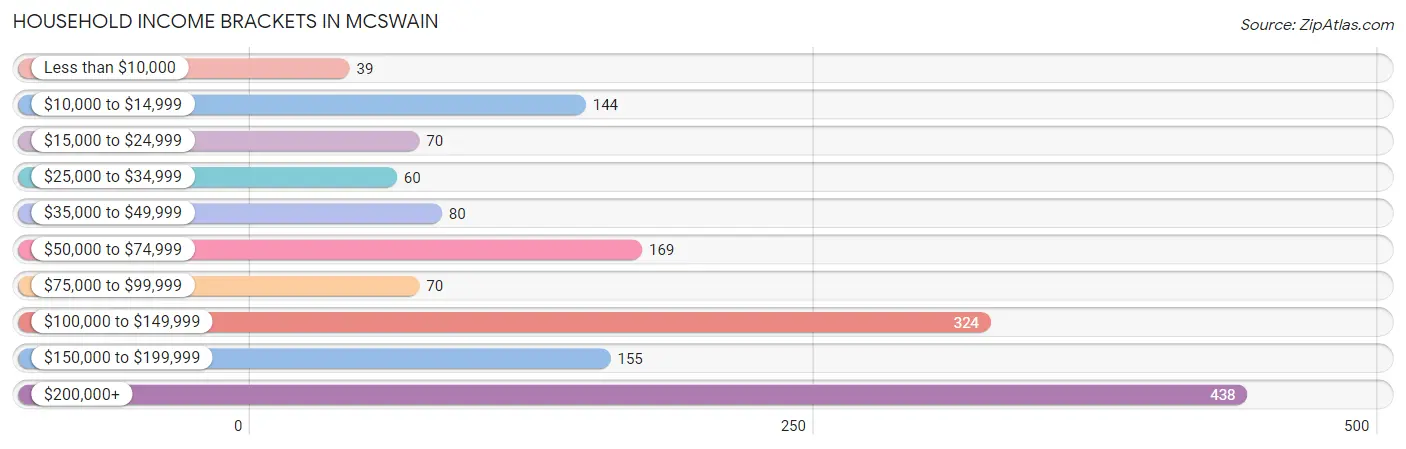
| Income Bracket | # Households | % Households |
| Less than $10,000 | 39 | 2.5% |
| $10,000 to $14,999 | 144 | 9.3% |
| $15,000 to $24,999 | 70 | 4.5% |
| $25,000 to $34,999 | 60 | 3.9% |
| $35,000 to $49,999 | 80 | 5.2% |
| $50,000 to $74,999 | 169 | 10.9% |
| $75,000 to $99,999 | 70 | 4.5% |
| $100,000 to $149,999 | 324 | 20.9% |
| $150,000 to $199,999 | 155 | 10.0% |
| $200,000+ | 438 | 28.3% |
Household Income by Householder Age in McSwain
The median household income in McSwain is $122,235, with the highest median household income of $147,261 found in the 45 to 64 years age bracket for the primary householder. A total of 631 households (40.8%) fall into this category. Meanwhile, the 15 to 24 years age bracket for the primary householder has the lowest median household income of $0, with 38 households (2.5%) in this group.
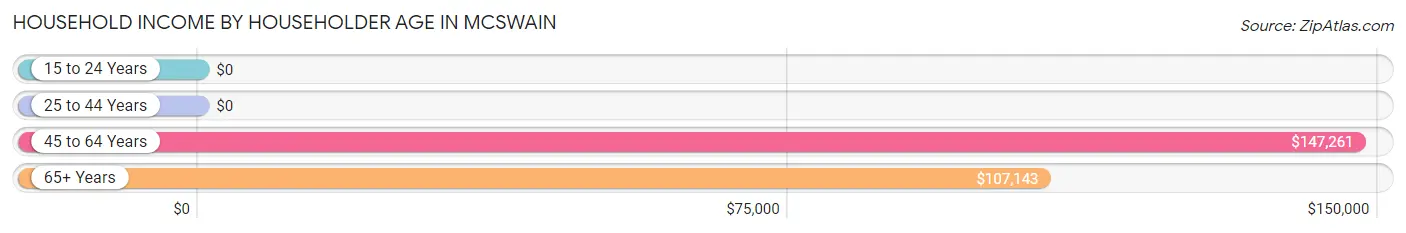
| Income Bracket | # Households | Median Income |
| 15 to 24 Years | 38 (2.5%) | $0 |
| 25 to 44 Years | 419 (27.1%) | $0 |
| 45 to 64 Years | 631 (40.8%) | $147,261 |
| 65+ Years | 460 (29.7%) | $107,143 |
| Total | 1,548 (100.0%) | $122,235 |
Poverty in McSwain
Income Below Poverty by Sex and Age in McSwain
With 12.7% poverty level for males and 11.3% for females among the residents of McSwain, 6 to 11 year old males and 35 to 44 year old females are the most vulnerable to poverty, with 283 males (47.0%) and 132 females (32.6%) in their respective age groups living below the poverty level.
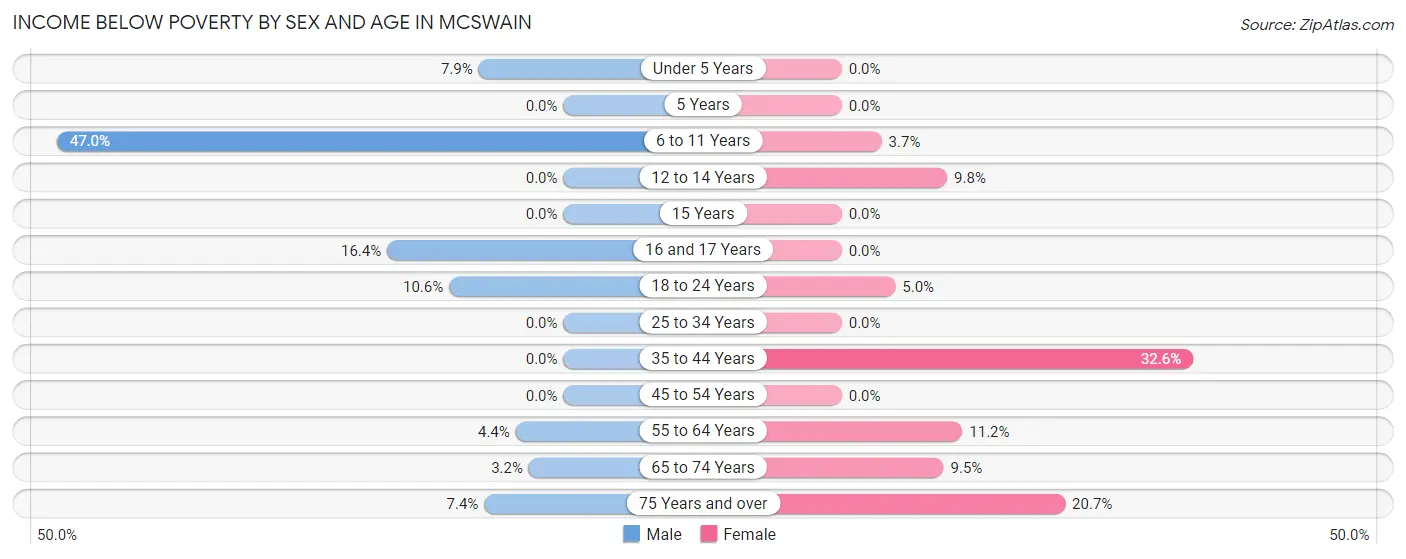
| Age Bracket | Male | Female |
| Under 5 Years | 10 (7.9%) | 0 (0.0%) |
| 5 Years | 0 (0.0%) | 0 (0.0%) |
| 6 to 11 Years | 283 (47.0%) | 9 (3.7%) |
| 12 to 14 Years | 0 (0.0%) | 9 (9.8%) |
| 15 Years | 0 (0.0%) | 0 (0.0%) |
| 16 and 17 Years | 9 (16.4%) | 0 (0.0%) |
| 18 to 24 Years | 33 (10.6%) | 8 (5.0%) |
| 25 to 34 Years | 0 (0.0%) | 0 (0.0%) |
| 35 to 44 Years | 0 (0.0%) | 132 (32.6%) |
| 45 to 54 Years | 0 (0.0%) | 0 (0.0%) |
| 55 to 64 Years | 14 (4.4%) | 33 (11.2%) |
| 65 to 74 Years | 8 (3.2%) | 19 (9.5%) |
| 75 Years and over | 10 (7.3%) | 34 (20.7%) |
| Total | 367 (12.7%) | 244 (11.3%) |
Income Above Poverty by Sex and Age in McSwain
According to the poverty statistics in McSwain, males aged 5 years and females aged under 5 years are the age groups that are most secure financially, with 100.0% of males and 100.0% of females in these age groups living above the poverty line.
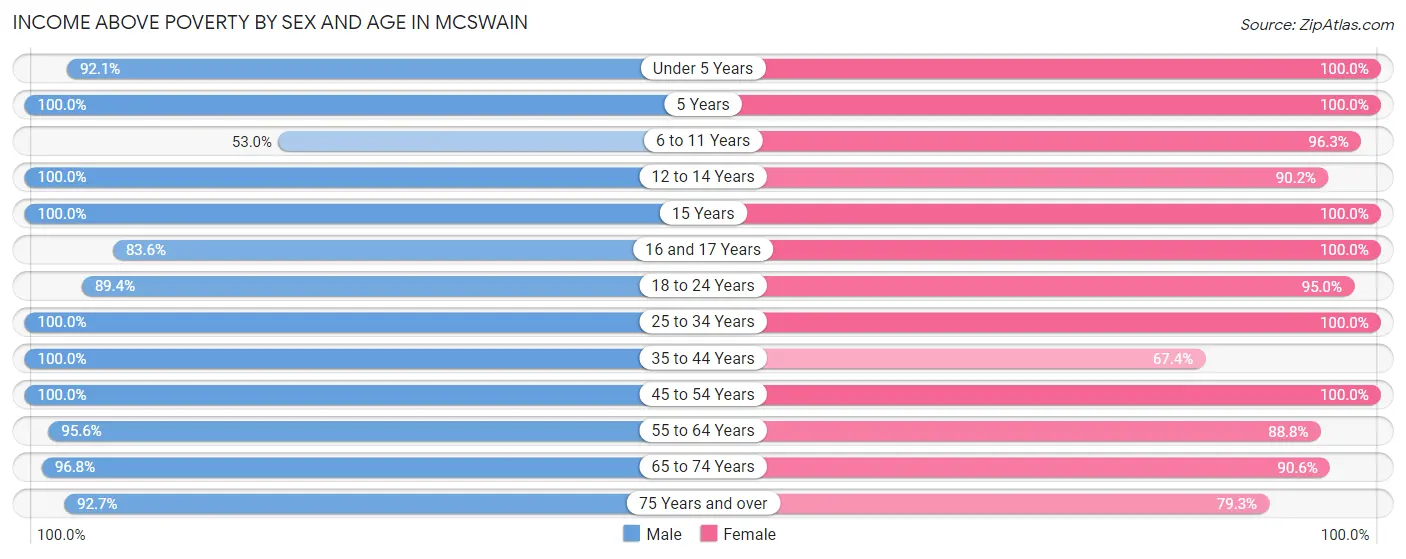
| Age Bracket | Male | Female |
| Under 5 Years | 117 (92.1%) | 19 (100.0%) |
| 5 Years | 12 (100.0%) | 39 (100.0%) |
| 6 to 11 Years | 319 (53.0%) | 234 (96.3%) |
| 12 to 14 Years | 120 (100.0%) | 83 (90.2%) |
| 15 Years | 19 (100.0%) | 46 (100.0%) |
| 16 and 17 Years | 46 (83.6%) | 41 (100.0%) |
| 18 to 24 Years | 278 (89.4%) | 153 (95.0%) |
| 25 to 34 Years | 236 (100.0%) | 115 (100.0%) |
| 35 to 44 Years | 336 (100.0%) | 273 (67.4%) |
| 45 to 54 Years | 368 (100.0%) | 334 (100.0%) |
| 55 to 64 Years | 302 (95.6%) | 262 (88.8%) |
| 65 to 74 Years | 241 (96.8%) | 182 (90.5%) |
| 75 Years and over | 126 (92.6%) | 130 (79.3%) |
| Total | 2,520 (87.3%) | 1,911 (88.7%) |
Income Below Poverty Among Married-Couple Families in McSwain
The poverty statistics for married-couple families in McSwain show that 0.9% or 8 of the total 924 families live below the poverty line. Families with no children have the highest poverty rate of 1.5%, comprising of 8 families. On the other hand, families with 1 or 2 children have the lowest poverty rate of 0.0%, which includes 0 families.
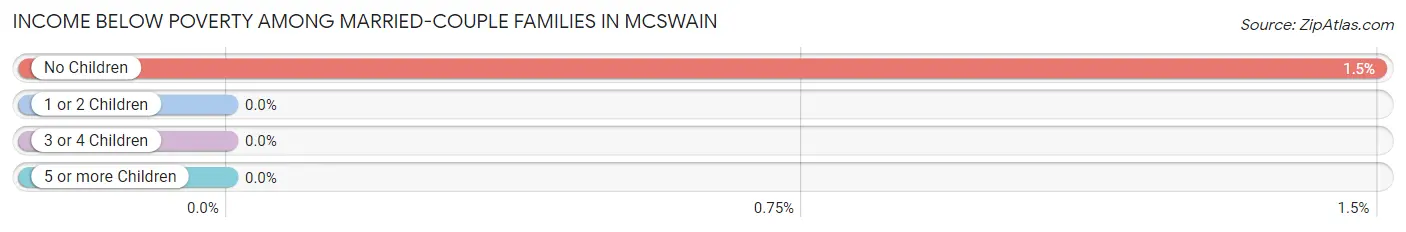
| Children | Above Poverty | Below Poverty |
| No Children | 525 (98.5%) | 8 (1.5%) |
| 1 or 2 Children | 313 (100.0%) | 0 (0.0%) |
| 3 or 4 Children | 68 (100.0%) | 0 (0.0%) |
| 5 or more Children | 10 (100.0%) | 0 (0.0%) |
| Total | 916 (99.1%) | 8 (0.9%) |
Income Below Poverty Among Single-Parent Households in McSwain
According to the poverty data in McSwain, 5.7% or 10 single-father households and 71.7% or 132 single-mother households are living below the poverty line. Among single-father households, those with no children have the highest poverty rate, with 10 households (8.0%) experiencing poverty. Likewise, among single-mother households, those with 1 or 2 children have the highest poverty rate, with 124 households (100.0%) falling below the poverty line.
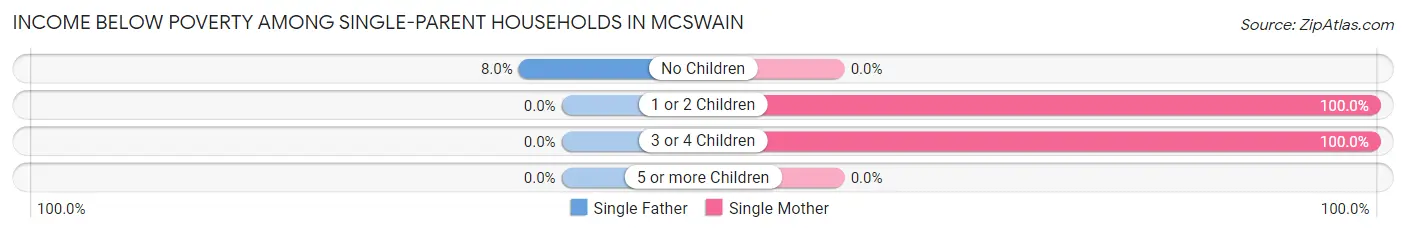
| Children | Single Father | Single Mother |
| No Children | 10 (8.0%) | 0 (0.0%) |
| 1 or 2 Children | 0 (0.0%) | 124 (100.0%) |
| 3 or 4 Children | 0 (0.0%) | 8 (100.0%) |
| 5 or more Children | 0 (0.0%) | 0 (0.0%) |
| Total | 10 (5.7%) | 132 (71.7%) |
Income Below Poverty Among Married-Couple vs Single-Parent Households in McSwain
The poverty data for McSwain shows that 8 of the married-couple family households (0.9%) and 142 of the single-parent households (39.3%) are living below the poverty level. Within the married-couple family households, those with no children have the highest poverty rate, with 8 households (1.5%) falling below the poverty line. Among the single-parent households, those with 1 or 2 children have the highest poverty rate, with 124 household (84.9%) living below poverty.
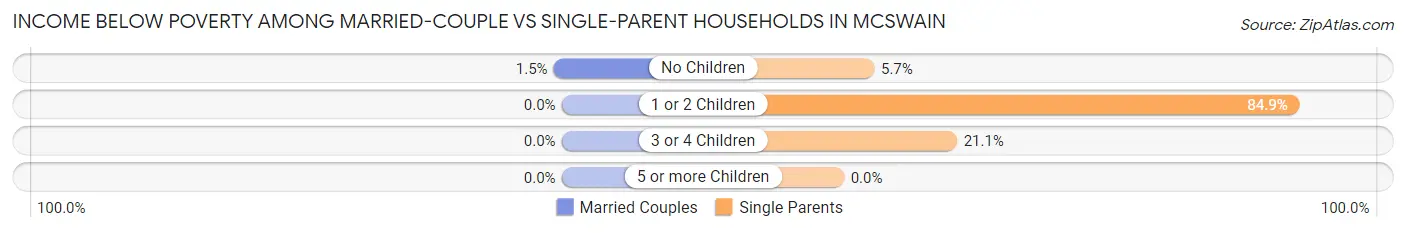
| Children | Married-Couple Families | Single-Parent Households |
| No Children | 8 (1.5%) | 10 (5.7%) |
| 1 or 2 Children | 0 (0.0%) | 124 (84.9%) |
| 3 or 4 Children | 0 (0.0%) | 8 (21.0%) |
| 5 or more Children | 0 (0.0%) | 0 (0.0%) |
| Total | 8 (0.9%) | 142 (39.3%) |
Race in McSwain
The most populous races in McSwain are White / Caucasian (3,332 | 66.1%), Hispanic or Latino (1,075 | 21.3%), and Asian (716 | 14.2%).
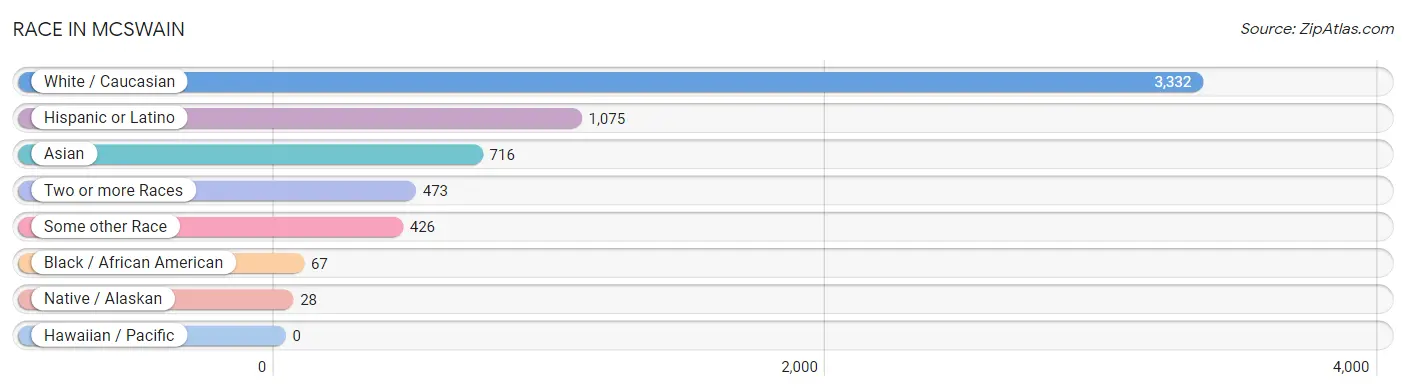
| Race | # Population | % Population |
| Asian | 716 | 14.2% |
| Black / African American | 67 | 1.3% |
| Hawaiian / Pacific | 0 | 0.0% |
| Hispanic or Latino | 1,075 | 21.3% |
| Native / Alaskan | 28 | 0.6% |
| White / Caucasian | 3,332 | 66.1% |
| Two or more Races | 473 | 9.4% |
| Some other Race | 426 | 8.5% |
| Total | 5,042 | 100.0% |
Ancestry in McSwain
The most populous ancestries reported in McSwain are Mexican (997 | 19.8%), Portuguese (928 | 18.4%), Thai (618 | 12.3%), German (453 | 9.0%), and Italian (450 | 8.9%), together accounting for 68.4% of all McSwain residents.
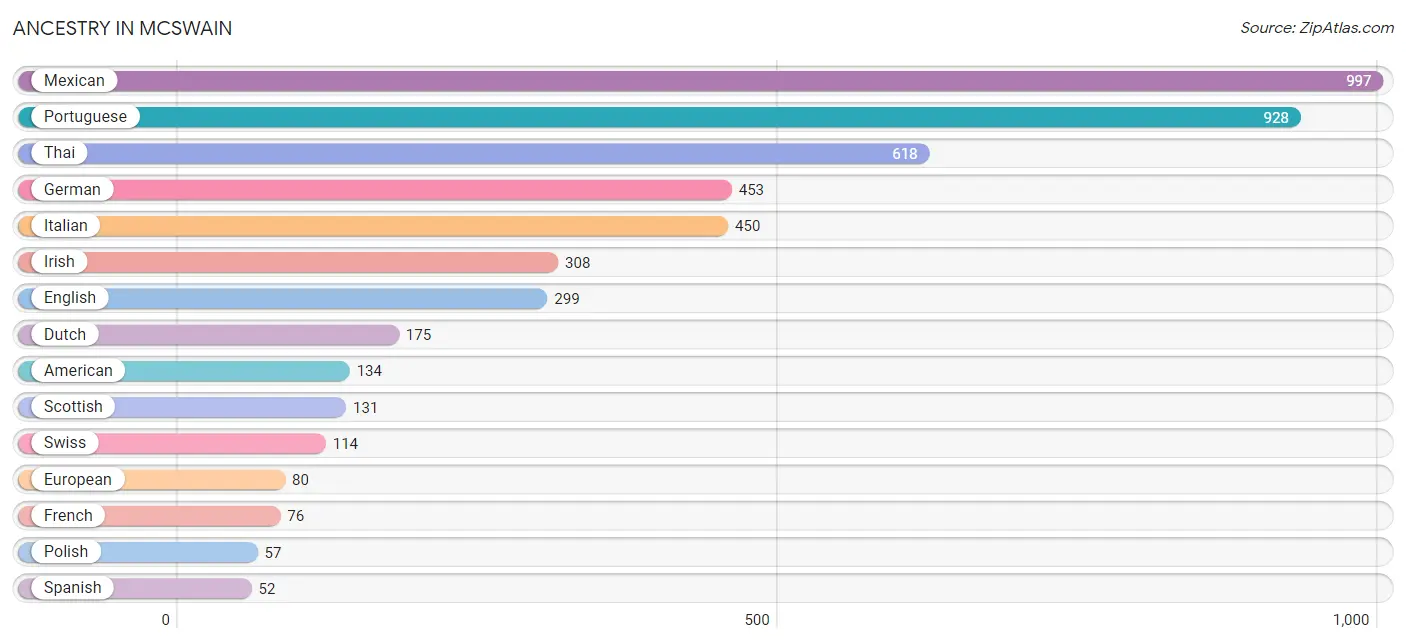
| Ancestry | # Population | % Population |
| American | 134 | 2.7% |
| Armenian | 9 | 0.2% |
| Bangladeshi | 31 | 0.6% |
| Bhutanese | 10 | 0.2% |
| Cajun | 9 | 0.2% |
| Central American | 26 | 0.5% |
| Cherokee | 9 | 0.2% |
| Czechoslovakian | 9 | 0.2% |
| Danish | 23 | 0.5% |
| Dutch | 175 | 3.5% |
| English | 299 | 5.9% |
| European | 80 | 1.6% |
| French | 76 | 1.5% |
| German | 453 | 9.0% |
| Indian (Asian) | 7 | 0.1% |
| Irish | 308 | 6.1% |
| Italian | 450 | 8.9% |
| Korean | 31 | 0.6% |
| Mexican | 997 | 19.8% |
| Navajo | 17 | 0.3% |
| Northern European | 34 | 0.7% |
| Norwegian | 48 | 0.9% |
| Pakistani | 31 | 0.6% |
| Polish | 57 | 1.1% |
| Portuguese | 928 | 18.4% |
| Romanian | 34 | 0.7% |
| Salvadoran | 26 | 0.5% |
| Scandinavian | 9 | 0.2% |
| Scotch-Irish | 28 | 0.6% |
| Scottish | 131 | 2.6% |
| South African | 25 | 0.5% |
| Spanish | 52 | 1.0% |
| Sri Lankan | 19 | 0.4% |
| Subsaharan African | 25 | 0.5% |
| Swedish | 36 | 0.7% |
| Swiss | 114 | 2.3% |
| Thai | 618 | 12.3% | View All 37 Rows |
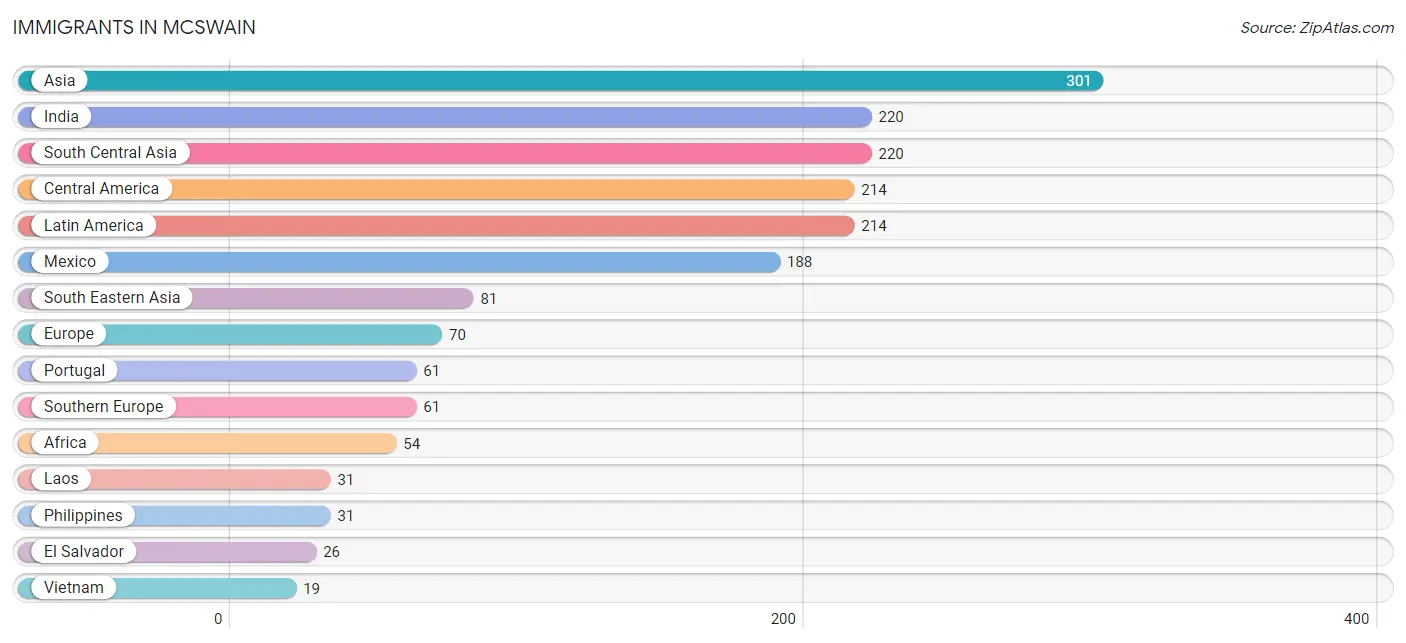
Immigrants in McSwain
The most numerous immigrant groups reported in McSwain came from Asia (301 | 6.0%), India (220 | 4.4%), South Central Asia (220 | 4.4%), Central America (214 | 4.2%), and Latin America (214 | 4.2%), together accounting for 23.2% of all McSwain residents.
| Immigration Origin | # Population | % Population |
| Africa | 54 | 1.1% |
| Asia | 301 | 6.0% |
| Australia | 10 | 0.2% |
| Azores | 3 | 0.1% |
| Central America | 214 | 4.2% |
| Eastern Europe | 9 | 0.2% |
| El Salvador | 26 | 0.5% |
| Europe | 70 | 1.4% |
| India | 220 | 4.4% |
| Laos | 31 | 0.6% |
| Latin America | 214 | 4.2% |
| Mexico | 188 | 3.7% |
| Middle Africa | 13 | 0.3% |
| Oceania | 10 | 0.2% |
| Philippines | 31 | 0.6% |
| Portugal | 61 | 1.2% |
| Romania | 9 | 0.2% |
| South Central Asia | 220 | 4.4% |
| South Eastern Asia | 81 | 1.6% |
| Southern Europe | 61 | 1.2% |
| Vietnam | 19 | 0.4% | View All 21 Rows |
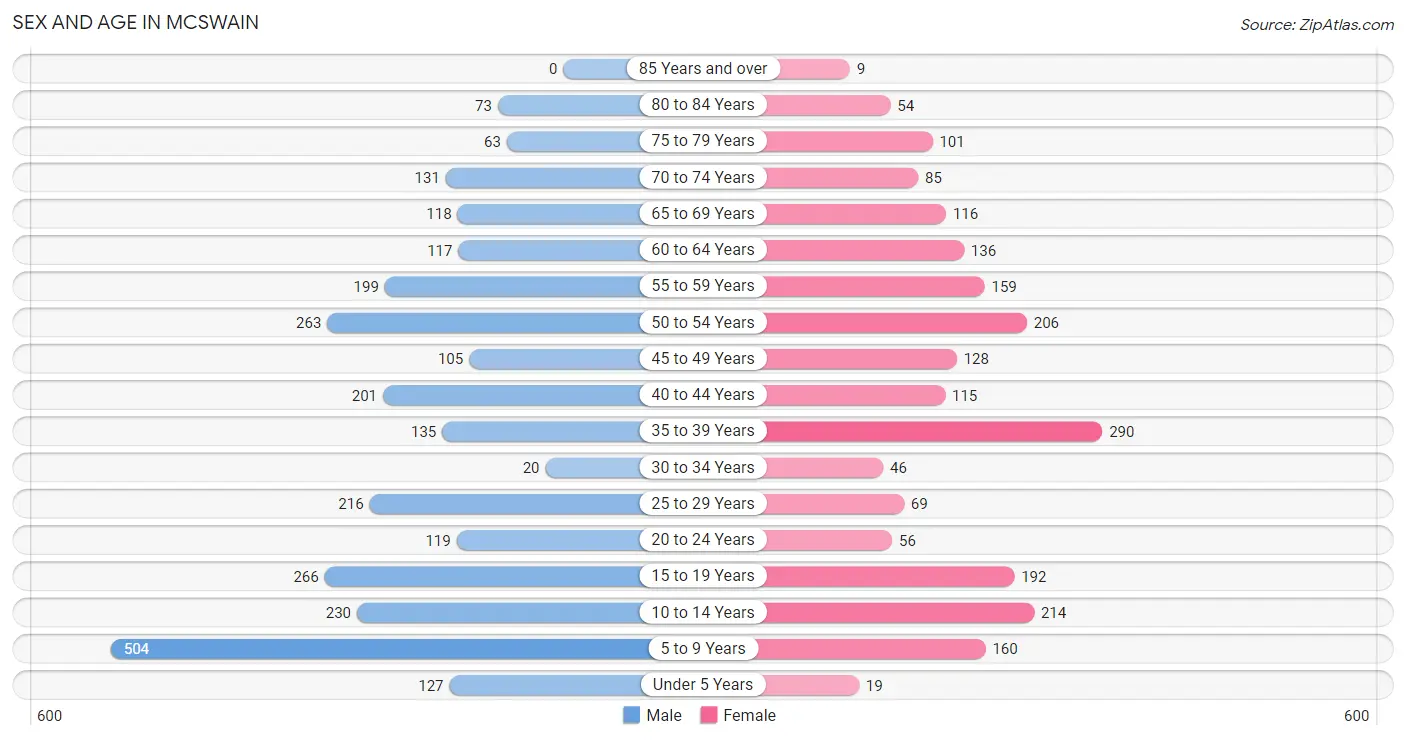
Sex and Age in McSwain
Sex and Age in McSwain
The most populous age groups in McSwain are 5 to 9 Years (504 | 17.5%) for men and 35 to 39 Years (290 | 13.5%) for women.
| Age Bracket | Male | Female |
| Under 5 Years | 127 (4.4%) | 19 (0.9%) |
| 5 to 9 Years | 504 (17.5%) | 160 (7.4%) |
| 10 to 14 Years | 230 (8.0%) | 214 (9.9%) |
| 15 to 19 Years | 266 (9.2%) | 192 (8.9%) |
| 20 to 24 Years | 119 (4.1%) | 56 (2.6%) |
| 25 to 29 Years | 216 (7.5%) | 69 (3.2%) |
| 30 to 34 Years | 20 (0.7%) | 46 (2.1%) |
| 35 to 39 Years | 135 (4.7%) | 290 (13.5%) |
| 40 to 44 Years | 201 (7.0%) | 115 (5.3%) |
| 45 to 49 Years | 105 (3.6%) | 128 (5.9%) |
| 50 to 54 Years | 263 (9.1%) | 206 (9.6%) |
| 55 to 59 Years | 199 (6.9%) | 159 (7.4%) |
| 60 to 64 Years | 117 (4.1%) | 136 (6.3%) |
| 65 to 69 Years | 118 (4.1%) | 116 (5.4%) |
| 70 to 74 Years | 131 (4.5%) | 85 (3.9%) |
| 75 to 79 Years | 63 (2.2%) | 101 (4.7%) |
| 80 to 84 Years | 73 (2.5%) | 54 (2.5%) |
| 85 Years and over | 0 (0.0%) | 9 (0.4%) |
| Total | 2,887 (100.0%) | 2,155 (100.0%) |
Families and Households in McSwain
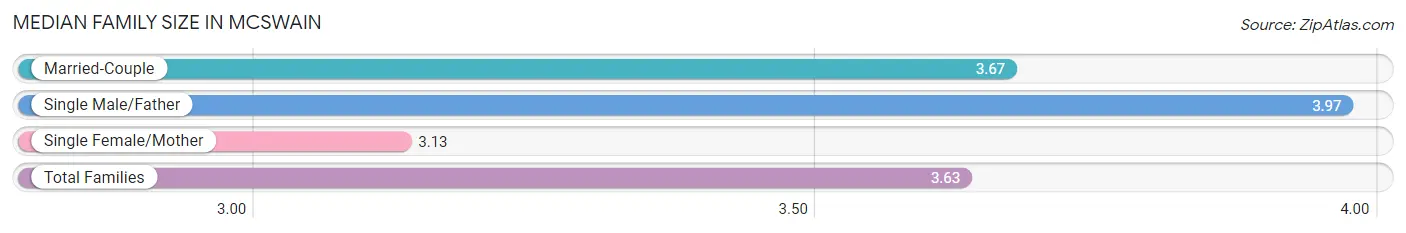
Median Family Size in McSwain
The median family size in McSwain is 3.63 persons per family, with single male/father families (177 | 13.8%) accounting for the largest median family size of 3.97 persons per family. On the other hand, single female/mother families (184 | 14.3%) represent the smallest median family size with 3.13 persons per family.
| Family Type | # Families | Family Size |
| Married-Couple | 924 (71.9%) | 3.67 |
| Single Male/Father | 177 (13.8%) | 3.97 |
| Single Female/Mother | 184 (14.3%) | 3.13 |
| Total Families | 1,285 (100.0%) | 3.63 |
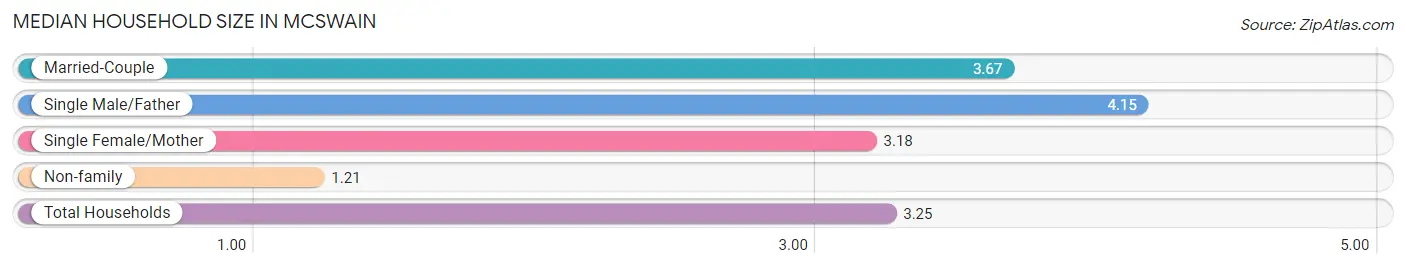
Median Household Size in McSwain
The median household size in McSwain is 3.25 persons per household, with single male/father households (177 | 11.4%) accounting for the largest median household size of 4.15 persons per household. non-family households (263 | 17.0%) represent the smallest median household size with 1.21 persons per household.
| Household Type | # Households | Household Size |
| Married-Couple | 924 (59.7%) | 3.67 |
| Single Male/Father | 177 (11.4%) | 4.15 |
| Single Female/Mother | 184 (11.9%) | 3.18 |
| Non-family | 263 (17.0%) | 1.21 |
| Total Households | 1,548 (100.0%) | 3.25 |
Household Size by Marriage Status in McSwain
Out of a total of 1,548 households in McSwain, 1,285 (83.0%) are family households, while 263 (17.0%) are nonfamily households. The most numerous type of family households are 2-person households, comprising 450, and the most common type of nonfamily households are 1-person households, comprising 231.
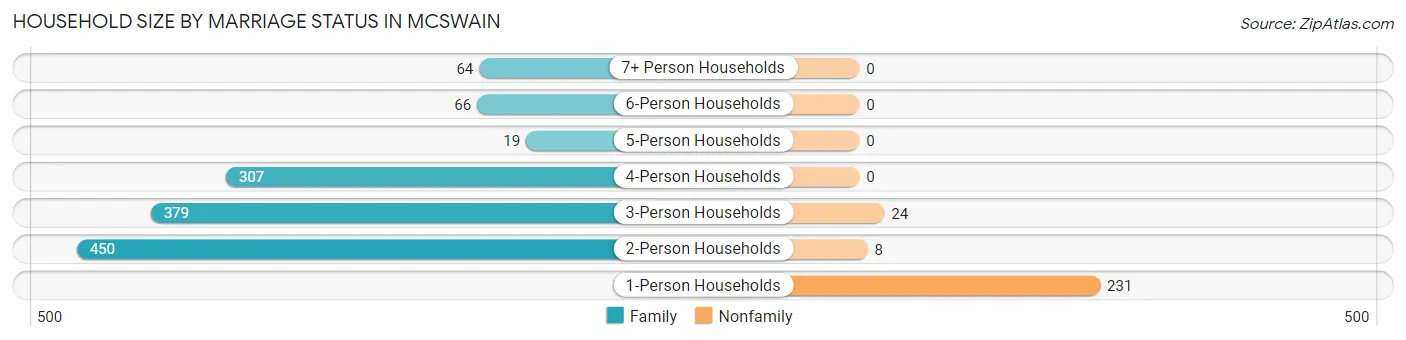
| Household Size | Family Households | Nonfamily Households |
| 1-Person Households | - | 231 (14.9%) |
| 2-Person Households | 450 (29.1%) | 8 (0.5%) |
| 3-Person Households | 379 (24.5%) | 24 (1.5%) |
| 4-Person Households | 307 (19.8%) | 0 (0.0%) |
| 5-Person Households | 19 (1.2%) | 0 (0.0%) |
| 6-Person Households | 66 (4.3%) | 0 (0.0%) |
| 7+ Person Households | 64 (4.1%) | 0 (0.0%) |
| Total | 1,285 (83.0%) | 263 (17.0%) |
Female Fertility in McSwain
Fertility by Age in McSwain
Average fertility rate in McSwain is 19.0 births per 1,000 women. Women in the age bracket of 20 to 34 years have the highest fertility rate with 105.0 births per 1,000 women. Women in the age bracket of 20 to 34 years acount for 100.0% of all women with births.
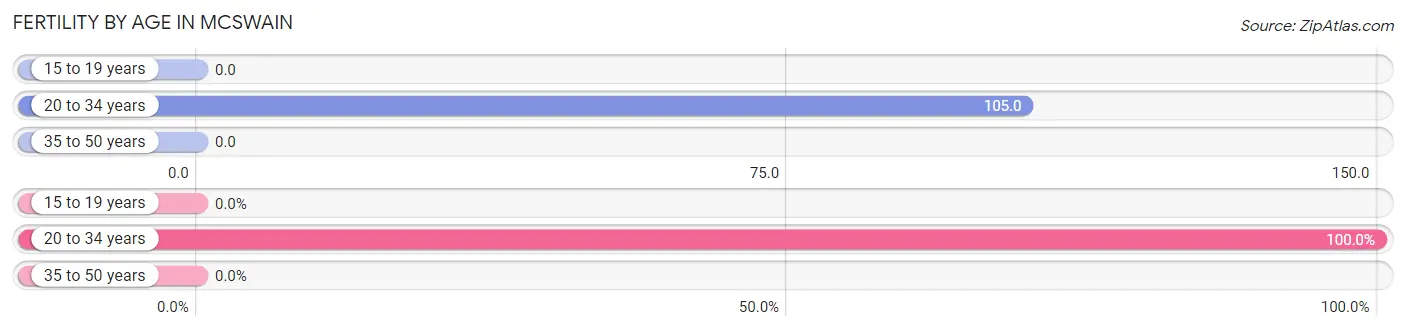
| Age Bracket | Women with Births | Births / 1,000 Women |
| 15 to 19 years | 0 (0.0%) | 0.0 |
| 20 to 34 years | 18 (100.0%) | 105.0 |
| 35 to 50 years | 0 (0.0%) | 0.0 |
| Total | 18 (100.0%) | 19.0 |
Fertility by Age by Marriage Status in McSwain
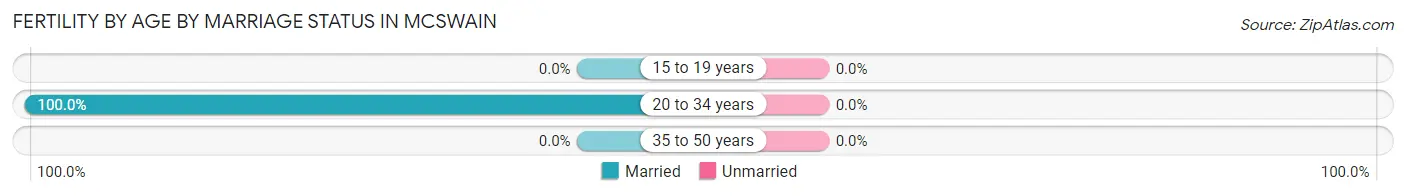
| Age Bracket | Married | Unmarried |
| 15 to 19 years | 0 (0.0%) | 0 (0.0%) |
| 20 to 34 years | 18 (100.0%) | 0 (0.0%) |
| 35 to 50 years | 0 (0.0%) | 0 (0.0%) |
| Total | 18 (100.0%) | 0 (0.0%) |
Fertility by Education in McSwain
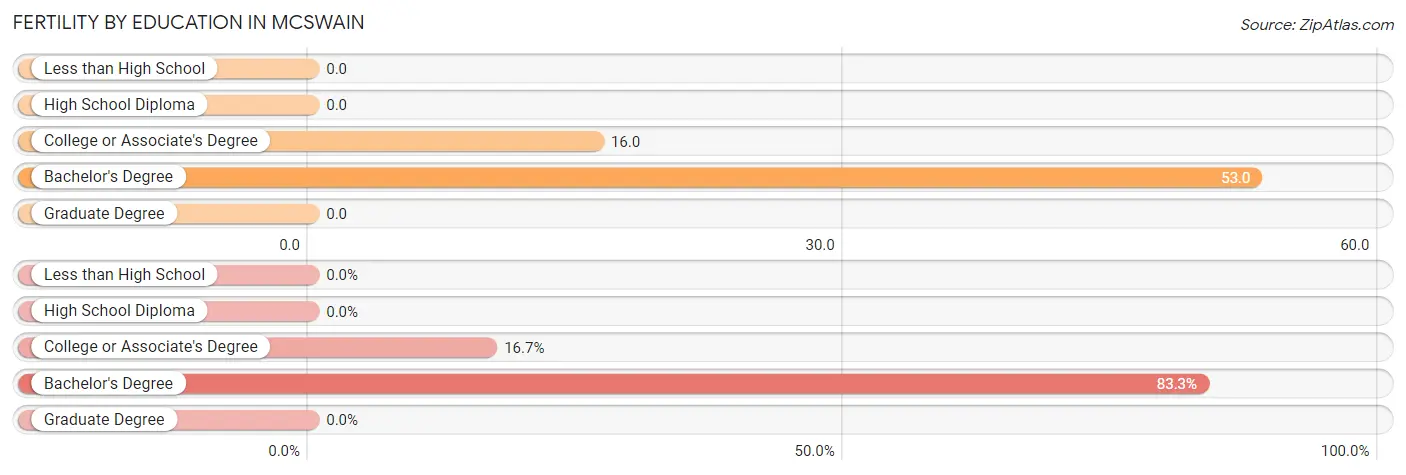
| Educational Attainment | Women with Births | Births / 1,000 Women |
| Less than High School | 0 (0.0%) | 0.0 |
| High School Diploma | 0 (0.0%) | 0.0 |
| College or Associate's Degree | 3 (16.7%) | 16.0 |
| Bachelor's Degree | 15 (83.3%) | 53.0 |
| Graduate Degree | 0 (0.0%) | 0.0 |
| Total | 18 (100.0%) | 19.0 |
Fertility by Education by Marriage Status in McSwain
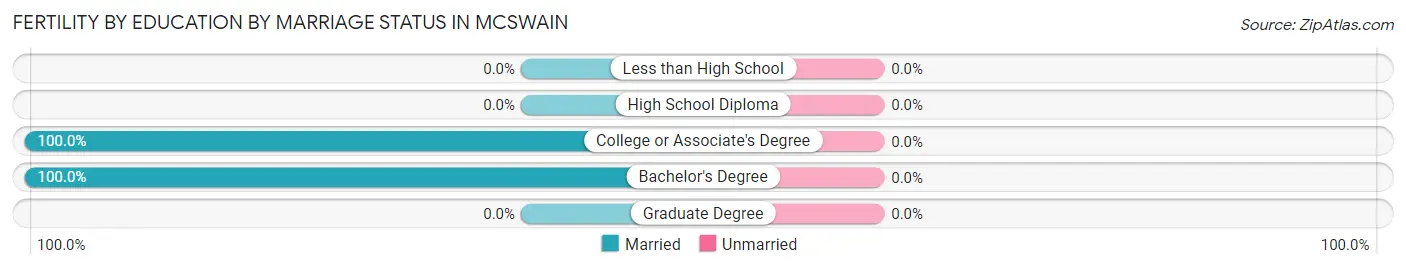
| Educational Attainment | Married | Unmarried |
| Less than High School | 0 (0.0%) | 0 (0.0%) |
| High School Diploma | 0 (0.0%) | 0 (0.0%) |
| College or Associate's Degree | 3 (100.0%) | 0 (0.0%) |
| Bachelor's Degree | 15 (100.0%) | 0 (0.0%) |
| Graduate Degree | 0 (0.0%) | 0 (0.0%) |
| Total | 18 (100.0%) | 0 (0.0%) |
Employment Characteristics in McSwain
Employment by Class of Employer in McSwain
Among the 2,130 employed individuals in McSwain, private company employees (1,297 | 60.9%), local government employees (334 | 15.7%), and self-employed (incorporated) (186 | 8.7%) make up the most common classes of employment.
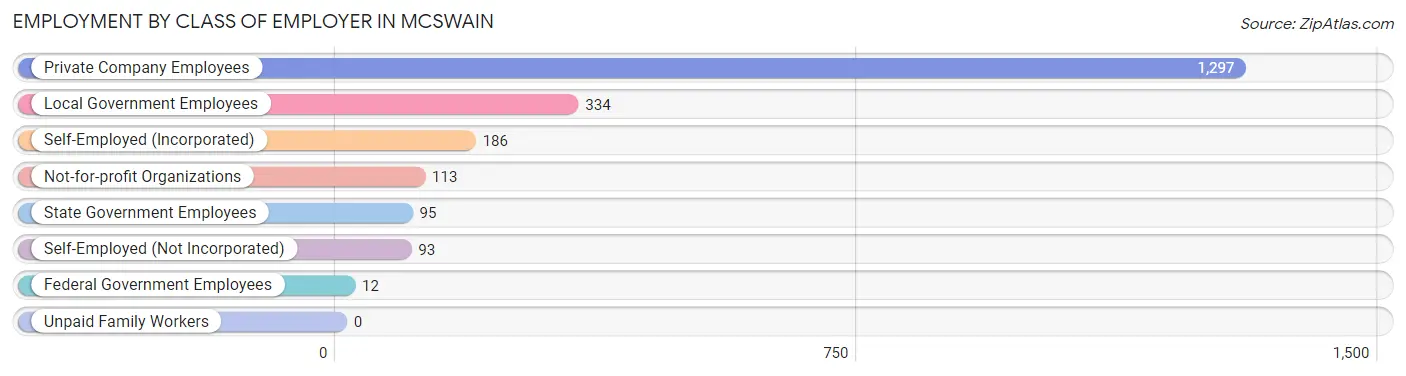
| Employer Class | # Employees | % Employees |
| Private Company Employees | 1,297 | 60.9% |
| Self-Employed (Incorporated) | 186 | 8.7% |
| Self-Employed (Not Incorporated) | 93 | 4.4% |
| Not-for-profit Organizations | 113 | 5.3% |
| Local Government Employees | 334 | 15.7% |
| State Government Employees | 95 | 4.5% |
| Federal Government Employees | 12 | 0.6% |
| Unpaid Family Workers | 0 | 0.0% |
| Total | 2,130 | 100.0% |
Employment Status by Age in McSwain
According to the labor force statistics for McSwain, out of the total population over 16 years of age (3,723), 61.4% or 2,286 individuals are in the labor force, with 4.1% or 94 of them unemployed. The age group with the highest labor force participation rate is 30 to 34 years, with 95.5% or 63 individuals in the labor force. Within the labor force, the 20 to 24 years age range has the highest percentage of unemployed individuals, with 9.0% or 13 of them being unemployed.
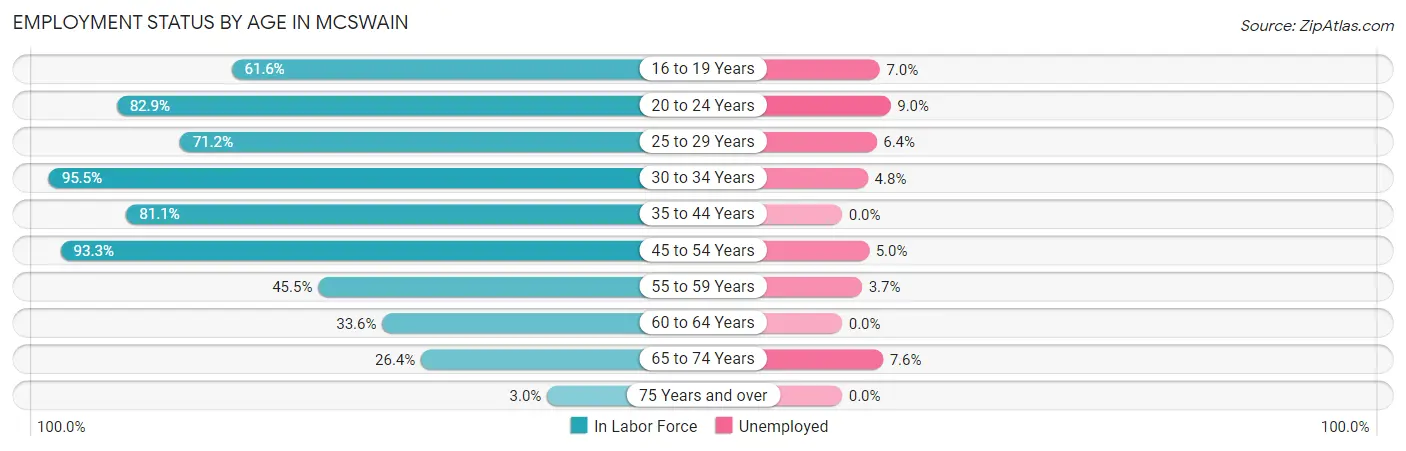
| Age Bracket | In Labor Force | Unemployed |
| 16 to 19 Years | 242 (61.6%) | 17 (7.0%) |
| 20 to 24 Years | 145 (82.9%) | 13 (9.0%) |
| 25 to 29 Years | 203 (71.2%) | 13 (6.4%) |
| 30 to 34 Years | 63 (95.5%) | 3 (4.8%) |
| 35 to 44 Years | 601 (81.1%) | 0 (0.0%) |
| 45 to 54 Years | 655 (93.3%) | 33 (5.0%) |
| 55 to 59 Years | 163 (45.5%) | 6 (3.7%) |
| 60 to 64 Years | 85 (33.6%) | 0 (0.0%) |
| 65 to 74 Years | 119 (26.4%) | 9 (7.6%) |
| 75 Years and over | 9 (3.0%) | 0 (0.0%) |
| Total | 2,286 (61.4%) | 94 (4.1%) |
Employment Status by Educational Attainment in McSwain
According to labor force statistics for McSwain, 73.6% of individuals (1,770) out of the total population between 25 and 64 years of age (2,405) are in the labor force, with 3.1% or 55 of them being unemployed. The group with the highest labor force participation rate are those with the educational attainment of bachelor's degree or higher, with 80.8% or 804 individuals in the labor force. Within the labor force, individuals with college / associate degree education have the highest percentage of unemployment, with 5.1% or 15 of them being unemployed.
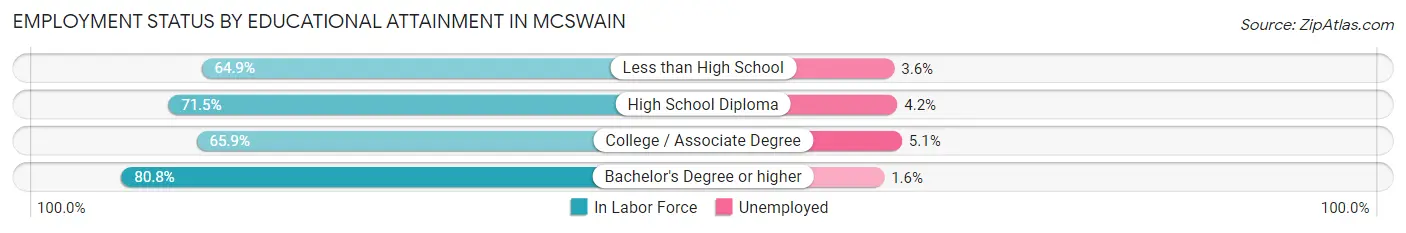
| Educational Attainment | In Labor Force | Unemployed |
| Less than High School | 168 (64.9%) | 9 (3.6%) |
| High School Diploma | 502 (71.5%) | 29 (4.2%) |
| College / Associate Degree | 296 (65.9%) | 23 (5.1%) |
| Bachelor's Degree or higher | 804 (80.8%) | 16 (1.6%) |
| Total | 1,770 (73.6%) | 75 (3.1%) |
Employment Occupations by Sex in McSwain
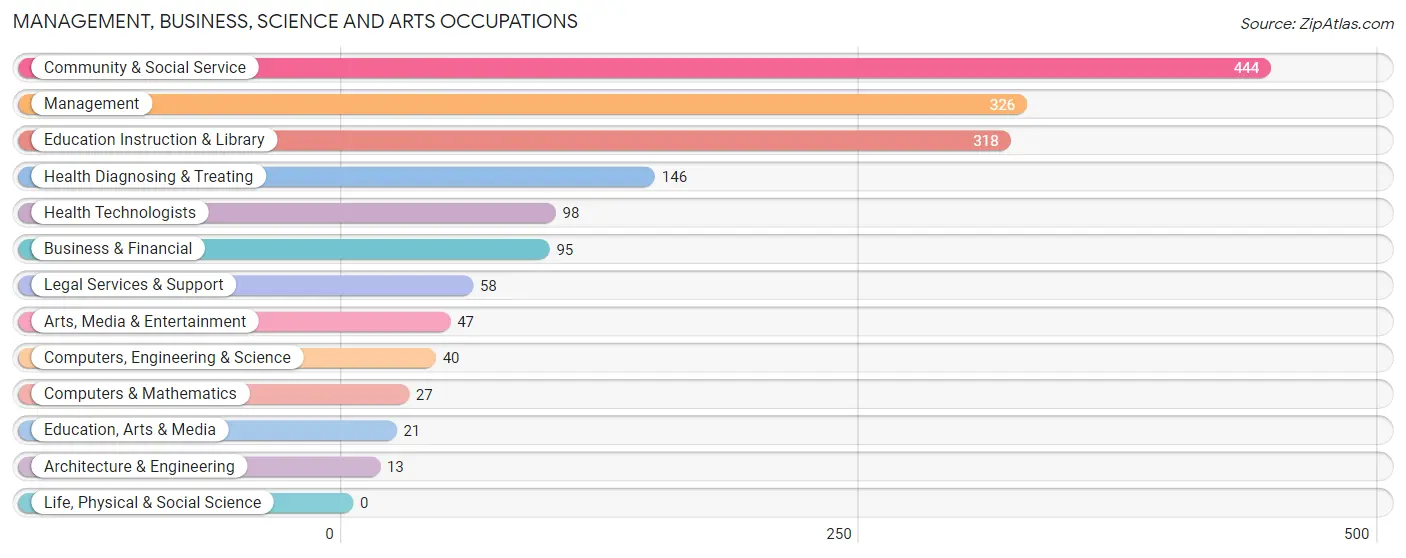
Management, Business, Science and Arts Occupations
The most common Management, Business, Science and Arts occupations in McSwain are Community & Social Service (444 | 20.3%), Management (326 | 14.9%), Education Instruction & Library (318 | 14.5%), Health Diagnosing & Treating (146 | 6.7%), and Health Technologists (98 | 4.5%).
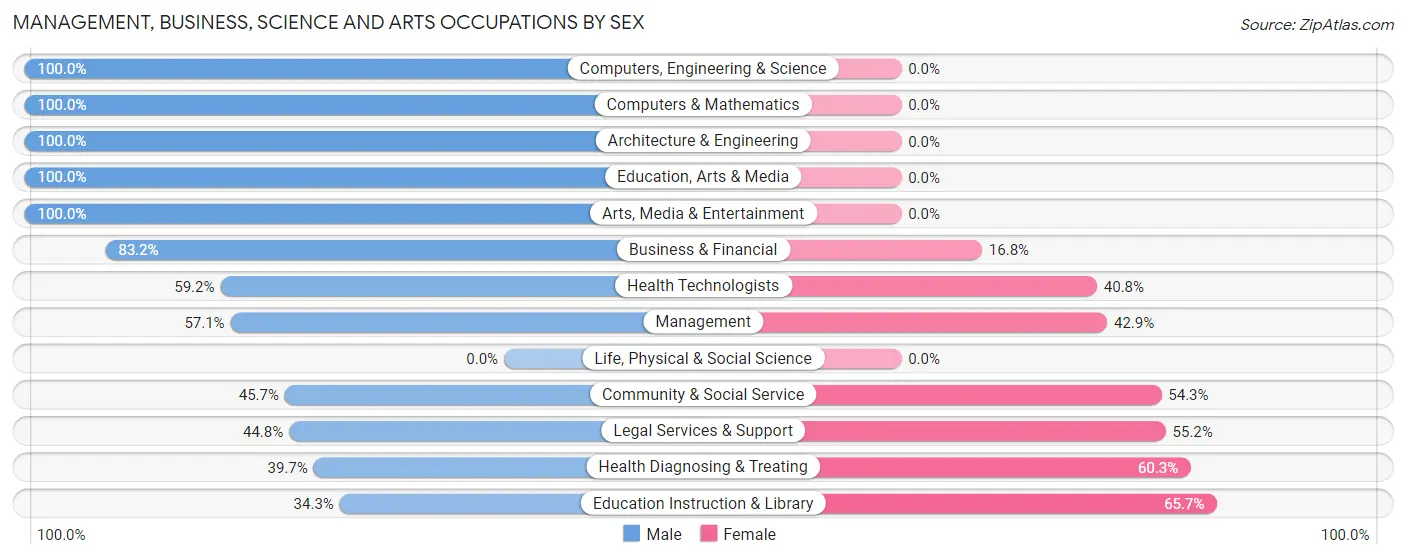
Management, Business, Science and Arts Occupations by Sex
Within the Management, Business, Science and Arts occupations in McSwain, the most male-oriented occupations are Computers, Engineering & Science (100.0%), Computers & Mathematics (100.0%), and Architecture & Engineering (100.0%), while the most female-oriented occupations are Education Instruction & Library (65.7%), Health Diagnosing & Treating (60.3%), and Legal Services & Support (55.2%).
| Occupation | Male | Female |
| Management | 186 (57.1%) | 140 (42.9%) |
| Business & Financial | 79 (83.2%) | 16 (16.8%) |
| Computers, Engineering & Science | 40 (100.0%) | 0 (0.0%) |
| Computers & Mathematics | 27 (100.0%) | 0 (0.0%) |
| Architecture & Engineering | 13 (100.0%) | 0 (0.0%) |
| Life, Physical & Social Science | 0 (0.0%) | 0 (0.0%) |
| Community & Social Service | 203 (45.7%) | 241 (54.3%) |
| Education, Arts & Media | 21 (100.0%) | 0 (0.0%) |
| Legal Services & Support | 26 (44.8%) | 32 (55.2%) |
| Education Instruction & Library | 109 (34.3%) | 209 (65.7%) |
| Arts, Media & Entertainment | 47 (100.0%) | 0 (0.0%) |
| Health Diagnosing & Treating | 58 (39.7%) | 88 (60.3%) |
| Health Technologists | 58 (59.2%) | 40 (40.8%) |
| Total (Category) | 566 (53.8%) | 485 (46.2%) |
| Total (Overall) | 1,316 (60.1%) | 875 (39.9%) |
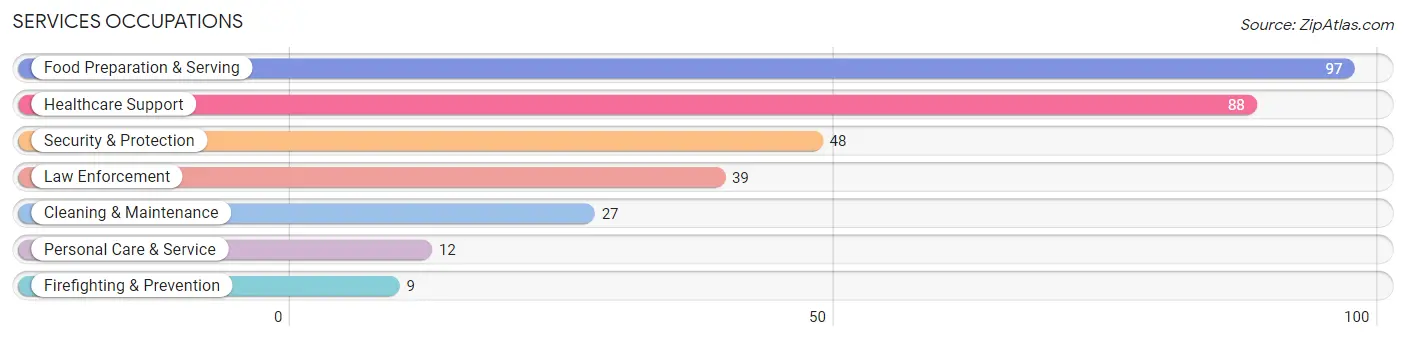
Services Occupations
The most common Services occupations in McSwain are Food Preparation & Serving (97 | 4.4%), Healthcare Support (88 | 4.0%), Security & Protection (48 | 2.2%), Law Enforcement (39 | 1.8%), and Cleaning & Maintenance (27 | 1.2%).
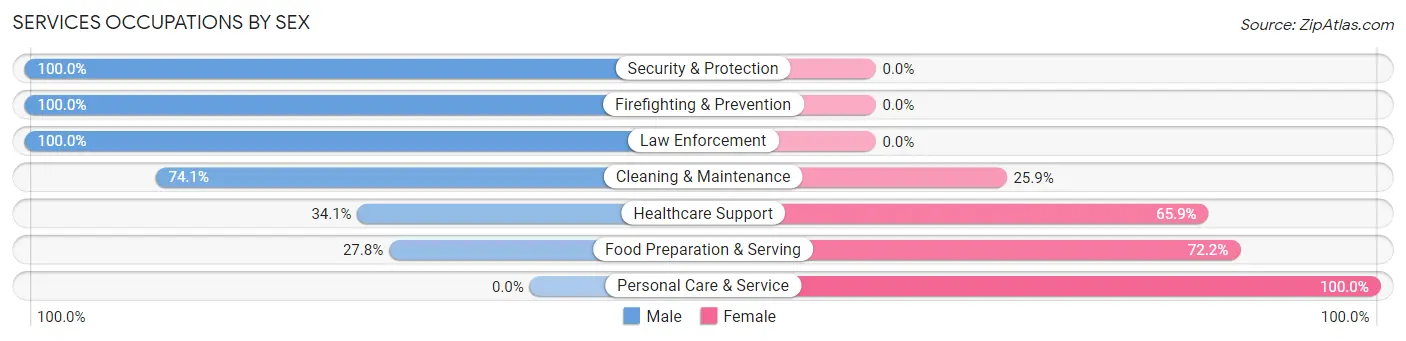
Services Occupations by Sex
Within the Services occupations in McSwain, the most male-oriented occupations are Security & Protection (100.0%), Firefighting & Prevention (100.0%), and Law Enforcement (100.0%), while the most female-oriented occupations are Personal Care & Service (100.0%), Food Preparation & Serving (72.2%), and Healthcare Support (65.9%).
| Occupation | Male | Female |
| Healthcare Support | 30 (34.1%) | 58 (65.9%) |
| Security & Protection | 48 (100.0%) | 0 (0.0%) |
| Firefighting & Prevention | 9 (100.0%) | 0 (0.0%) |
| Law Enforcement | 39 (100.0%) | 0 (0.0%) |
| Food Preparation & Serving | 27 (27.8%) | 70 (72.2%) |
| Cleaning & Maintenance | 20 (74.1%) | 7 (25.9%) |
| Personal Care & Service | 0 (0.0%) | 12 (100.0%) |
| Total (Category) | 125 (46.0%) | 147 (54.0%) |
| Total (Overall) | 1,316 (60.1%) | 875 (39.9%) |
Sales and Office Occupations
The most common Sales and Office occupations in McSwain are Office & Administration (242 | 11.1%), and Sales & Related (95 | 4.3%).
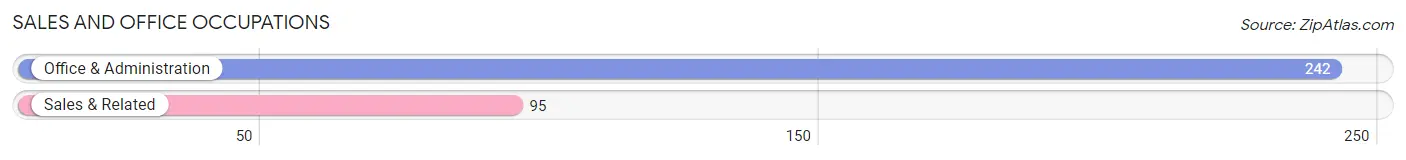
Sales and Office Occupations by Sex
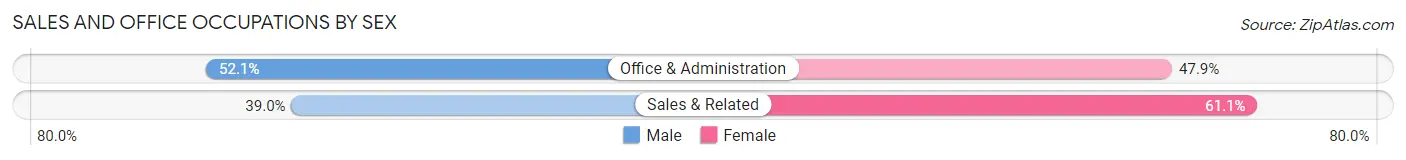
| Occupation | Male | Female |
| Sales & Related | 37 (39.0%) | 58 (61.1%) |
| Office & Administration | 126 (52.1%) | 116 (47.9%) |
| Total (Category) | 163 (48.4%) | 174 (51.6%) |
| Total (Overall) | 1,316 (60.1%) | 875 (39.9%) |
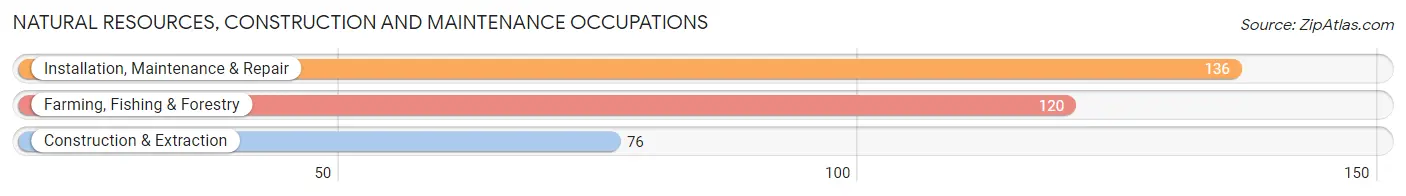
Natural Resources, Construction and Maintenance Occupations
The most common Natural Resources, Construction and Maintenance occupations in McSwain are Installation, Maintenance & Repair (136 | 6.2%), Farming, Fishing & Forestry (120 | 5.5%), and Construction & Extraction (76 | 3.5%).
Natural Resources, Construction and Maintenance Occupations by Sex
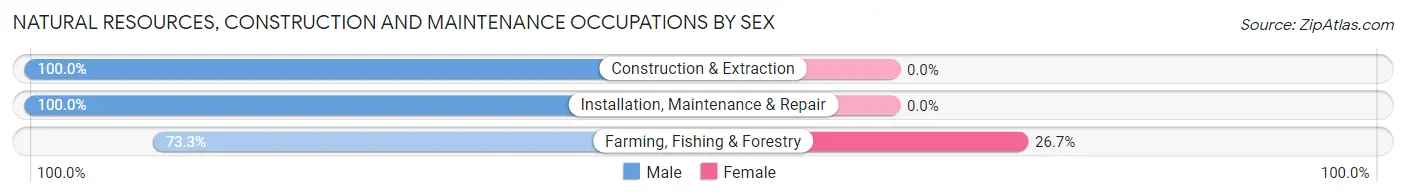
| Occupation | Male | Female |
| Farming, Fishing & Forestry | 88 (73.3%) | 32 (26.7%) |
| Construction & Extraction | 76 (100.0%) | 0 (0.0%) |
| Installation, Maintenance & Repair | 136 (100.0%) | 0 (0.0%) |
| Total (Category) | 300 (90.4%) | 32 (9.6%) |
| Total (Overall) | 1,316 (60.1%) | 875 (39.9%) |
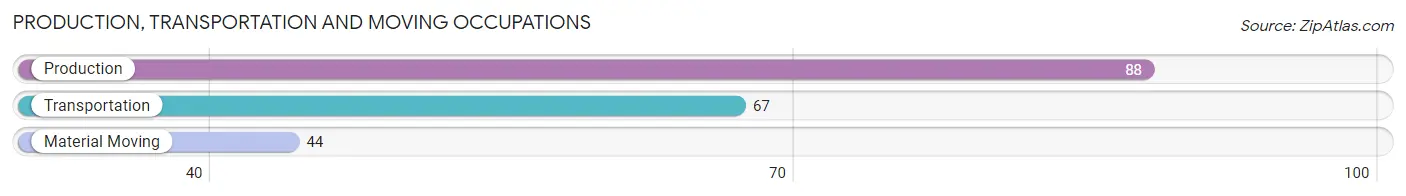
Production, Transportation and Moving Occupations
The most common Production, Transportation and Moving occupations in McSwain are Production (88 | 4.0%), Transportation (67 | 3.1%), and Material Moving (44 | 2.0%).
Production, Transportation and Moving Occupations by Sex
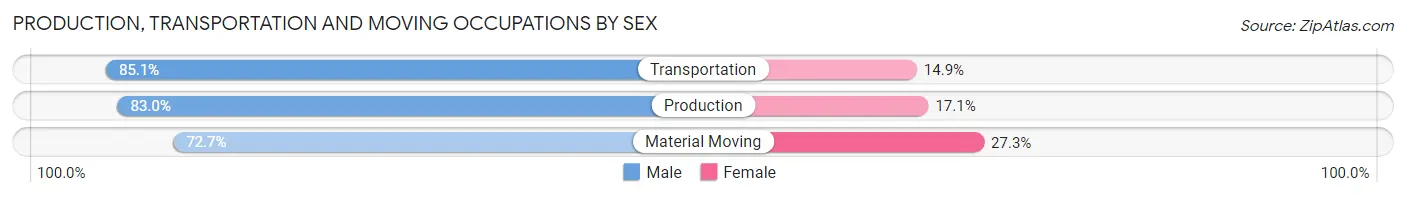
| Occupation | Male | Female |
| Production | 73 (83.0%) | 15 (17.1%) |
| Transportation | 57 (85.1%) | 10 (14.9%) |
| Material Moving | 32 (72.7%) | 12 (27.3%) |
| Total (Category) | 162 (81.4%) | 37 (18.6%) |
| Total (Overall) | 1,316 (60.1%) | 875 (39.9%) |
Employment Industries by Sex in McSwain
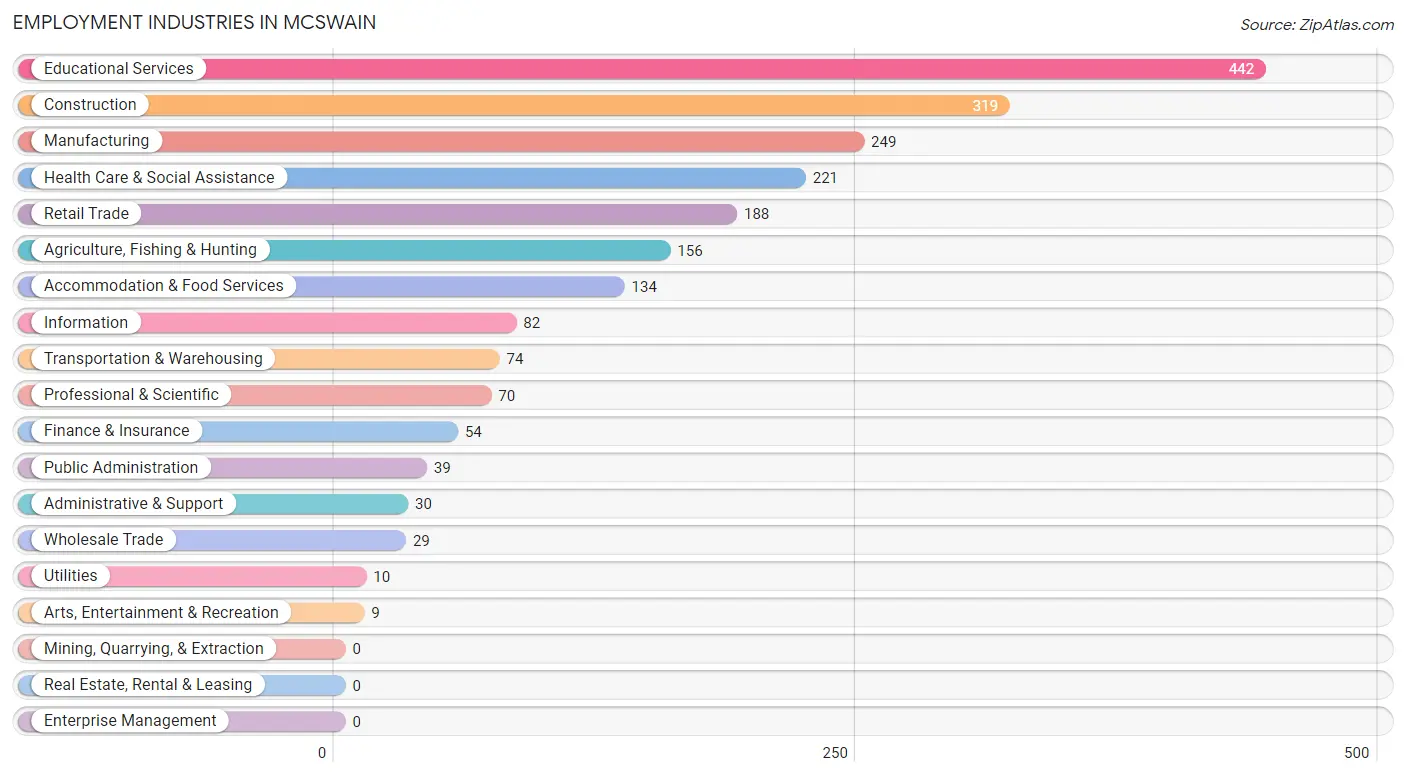
Employment Industries in McSwain
The major employment industries in McSwain include Educational Services (442 | 20.2%), Construction (319 | 14.6%), Manufacturing (249 | 11.4%), Health Care & Social Assistance (221 | 10.1%), and Retail Trade (188 | 8.6%).
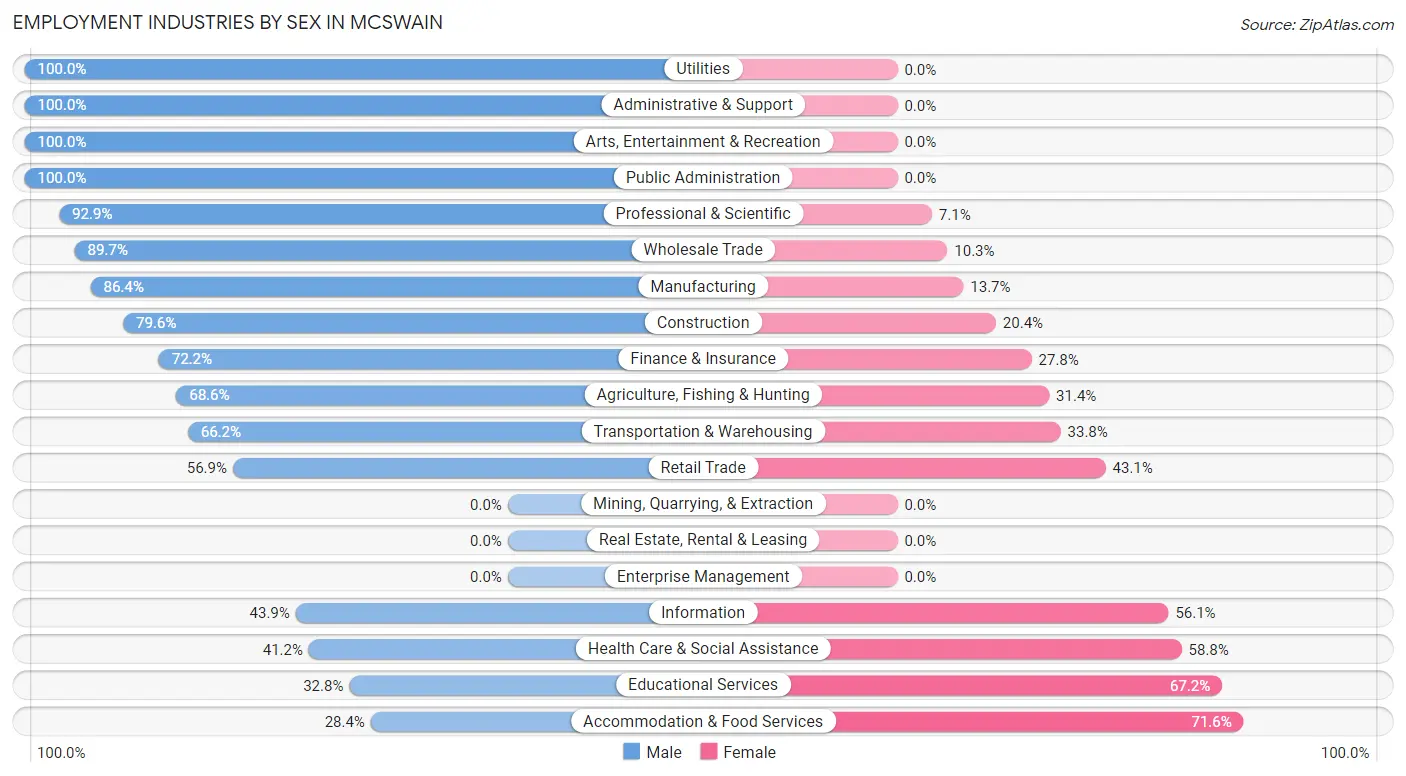
Employment Industries by Sex in McSwain
The McSwain industries that see more men than women are Utilities (100.0%), Administrative & Support (100.0%), and Arts, Entertainment & Recreation (100.0%), whereas the industries that tend to have a higher number of women are Accommodation & Food Services (71.6%), Educational Services (67.2%), and Health Care & Social Assistance (58.8%).
| Industry | Male | Female |
| Agriculture, Fishing & Hunting | 107 (68.6%) | 49 (31.4%) |
| Mining, Quarrying, & Extraction | 0 (0.0%) | 0 (0.0%) |
| Construction | 254 (79.6%) | 65 (20.4%) |
| Manufacturing | 215 (86.4%) | 34 (13.7%) |
| Wholesale Trade | 26 (89.7%) | 3 (10.3%) |
| Retail Trade | 107 (56.9%) | 81 (43.1%) |
| Transportation & Warehousing | 49 (66.2%) | 25 (33.8%) |
| Utilities | 10 (100.0%) | 0 (0.0%) |
| Information | 36 (43.9%) | 46 (56.1%) |
| Finance & Insurance | 39 (72.2%) | 15 (27.8%) |
| Real Estate, Rental & Leasing | 0 (0.0%) | 0 (0.0%) |
| Professional & Scientific | 65 (92.9%) | 5 (7.1%) |
| Enterprise Management | 0 (0.0%) | 0 (0.0%) |
| Administrative & Support | 30 (100.0%) | 0 (0.0%) |
| Educational Services | 145 (32.8%) | 297 (67.2%) |
| Health Care & Social Assistance | 91 (41.2%) | 130 (58.8%) |
| Arts, Entertainment & Recreation | 9 (100.0%) | 0 (0.0%) |
| Accommodation & Food Services | 38 (28.4%) | 96 (71.6%) |
| Public Administration | 39 (100.0%) | 0 (0.0%) |
| Total | 1,316 (60.1%) | 875 (39.9%) |
Education in McSwain
School Enrollment in McSwain
The most common levels of schooling among the 1,682 students in McSwain are elementary school (458 | 27.2%), middle school (395 | 23.5%), and college / undergraduate (296 | 17.6%).
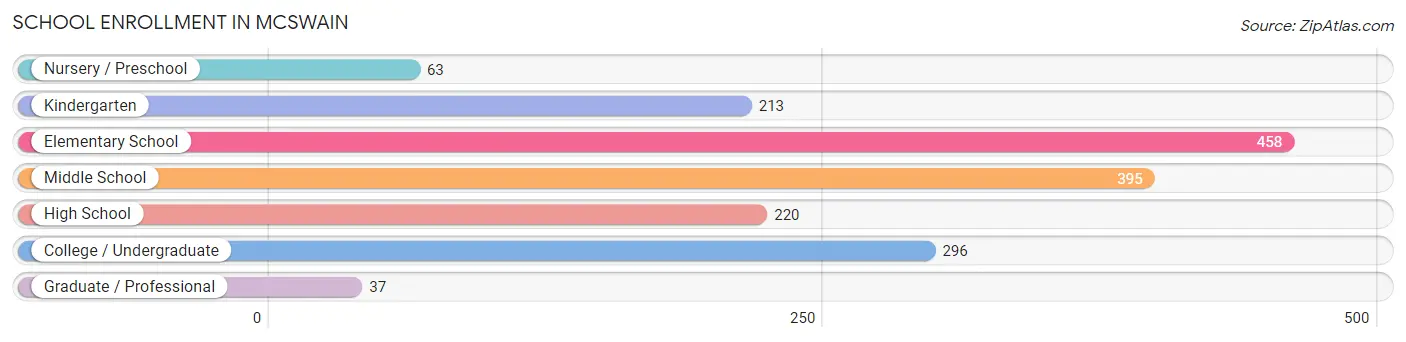
| School Level | # Students | % Students |
| Nursery / Preschool | 63 | 3.7% |
| Kindergarten | 213 | 12.7% |
| Elementary School | 458 | 27.2% |
| Middle School | 395 | 23.5% |
| High School | 220 | 13.1% |
| College / Undergraduate | 296 | 17.6% |
| Graduate / Professional | 37 | 2.2% |
| Total | 1,682 | 100.0% |
School Enrollment by Age by Funding Source in McSwain
Out of a total of 1,682 students who are enrolled in schools in McSwain, 235 (14.0%) attend a private institution, while the remaining 1,447 (86.0%) are enrolled in public schools. The age group of 3 to 4 year olds has the highest likelihood of being enrolled in private schools, with 15 (23.8% in the age bracket) enrolled. Conversely, the age group of 18 to 19 year olds has the lowest likelihood of being enrolled in a private school, with 165 (100.0% in the age bracket) attending a public institution.
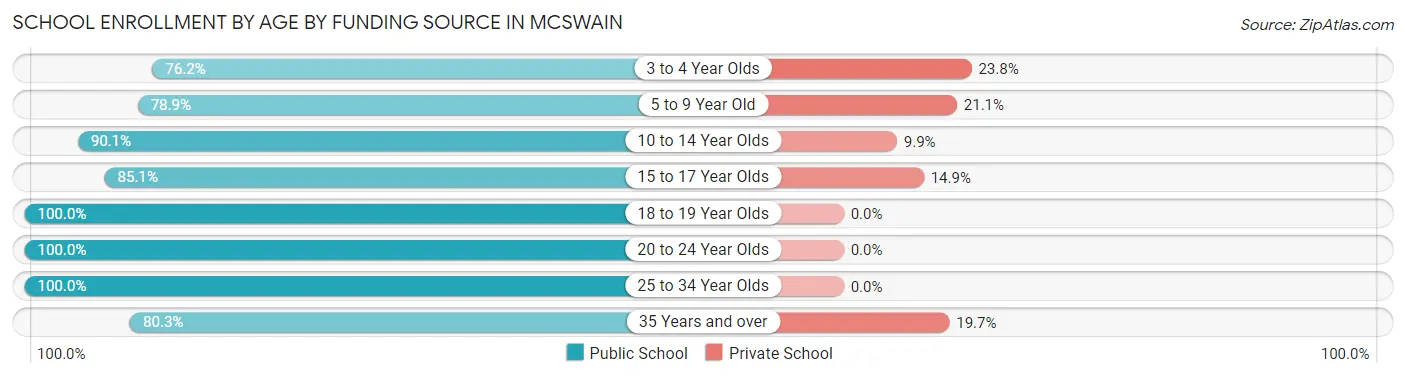
| Age Bracket | Public School | Private School |
| 3 to 4 Year Olds | 48 (76.2%) | 15 (23.8%) |
| 5 to 9 Year Old | 524 (78.9%) | 140 (21.1%) |
| 10 to 14 Year Olds | 400 (90.1%) | 44 (9.9%) |
| 15 to 17 Year Olds | 137 (85.1%) | 24 (14.9%) |
| 18 to 19 Year Olds | 165 (100.0%) | 0 (0.0%) |
| 20 to 24 Year Olds | 70 (100.0%) | 0 (0.0%) |
| 25 to 34 Year Olds | 54 (100.0%) | 0 (0.0%) |
| 35 Years and over | 49 (80.3%) | 12 (19.7%) |
| Total | 1,447 (86.0%) | 235 (14.0%) |
Educational Attainment by Field of Study in McSwain
Business (244 | 18.1%), science & technology (187 | 13.8%), bio, nature & agricultural (180 | 13.3%), education (122 | 9.0%), and arts & humanities (121 | 9.0%) are the most common fields of study among 1,351 individuals in McSwain who have obtained a bachelor's degree or higher.
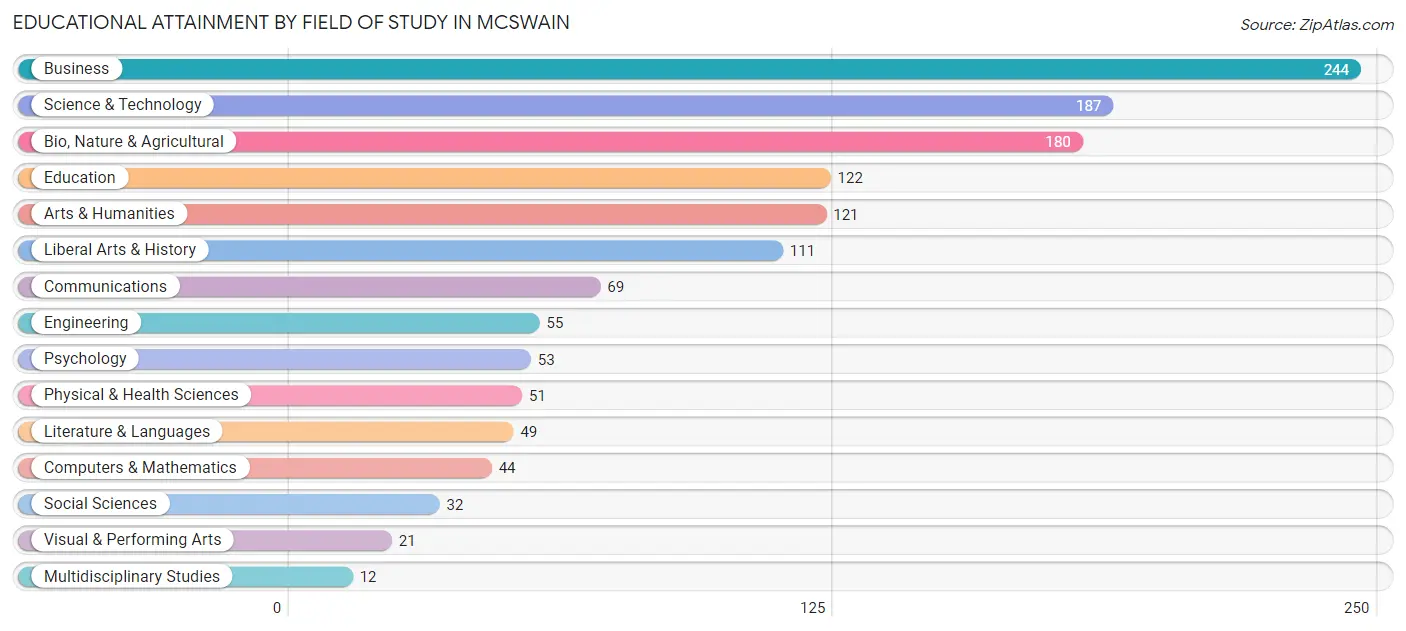
| Field of Study | # Graduates | % Graduates |
| Computers & Mathematics | 44 | 3.3% |
| Bio, Nature & Agricultural | 180 | 13.3% |
| Physical & Health Sciences | 51 | 3.8% |
| Psychology | 53 | 3.9% |
| Social Sciences | 32 | 2.4% |
| Engineering | 55 | 4.1% |
| Multidisciplinary Studies | 12 | 0.9% |
| Science & Technology | 187 | 13.8% |
| Business | 244 | 18.1% |
| Education | 122 | 9.0% |
| Literature & Languages | 49 | 3.6% |
| Liberal Arts & History | 111 | 8.2% |
| Visual & Performing Arts | 21 | 1.5% |
| Communications | 69 | 5.1% |
| Arts & Humanities | 121 | 9.0% |
| Total | 1,351 | 100.0% |
Transportation & Commute in McSwain
Vehicle Availability by Sex in McSwain
The most prevalent vehicle ownership categories in McSwain are males with 3 vehicles (409, accounting for 31.1%) and females with 3 vehicles (234, making up 50.2%).
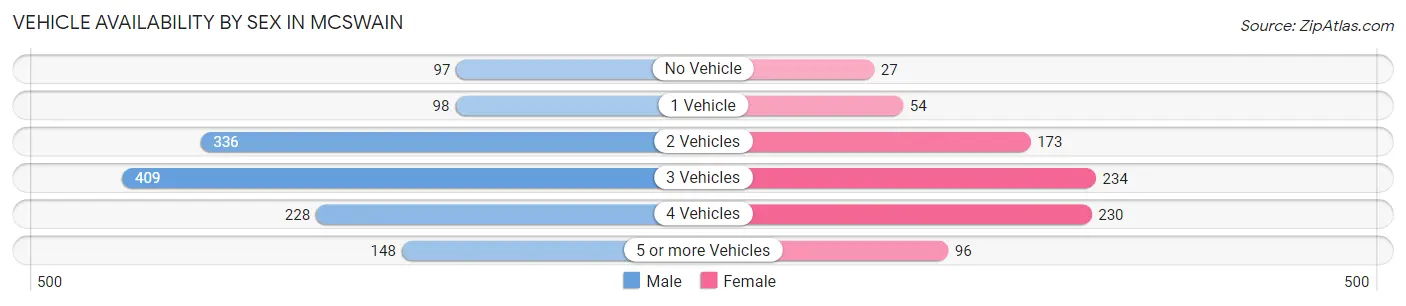
| Vehicles Available | Male | Female |
| No Vehicle | 97 (7.4%) | 27 (3.3%) |
| 1 Vehicle | 98 (7.4%) | 54 (6.6%) |
| 2 Vehicles | 336 (25.5%) | 173 (21.2%) |
| 3 Vehicles | 409 (31.1%) | 234 (28.7%) |
| 4 Vehicles | 228 (17.3%) | 230 (28.3%) |
| 5 or more Vehicles | 148 (11.3%) | 96 (11.8%) |
| Total | 1,316 (100.0%) | 814 (100.0%) |
Commute Time in McSwain
The most frequently occuring commute durations in McSwain are 20 to 24 minutes (389 commuters, 20.1%), 15 to 19 minutes (383 commuters, 19.8%), and 10 to 14 minutes (350 commuters, 18.0%).
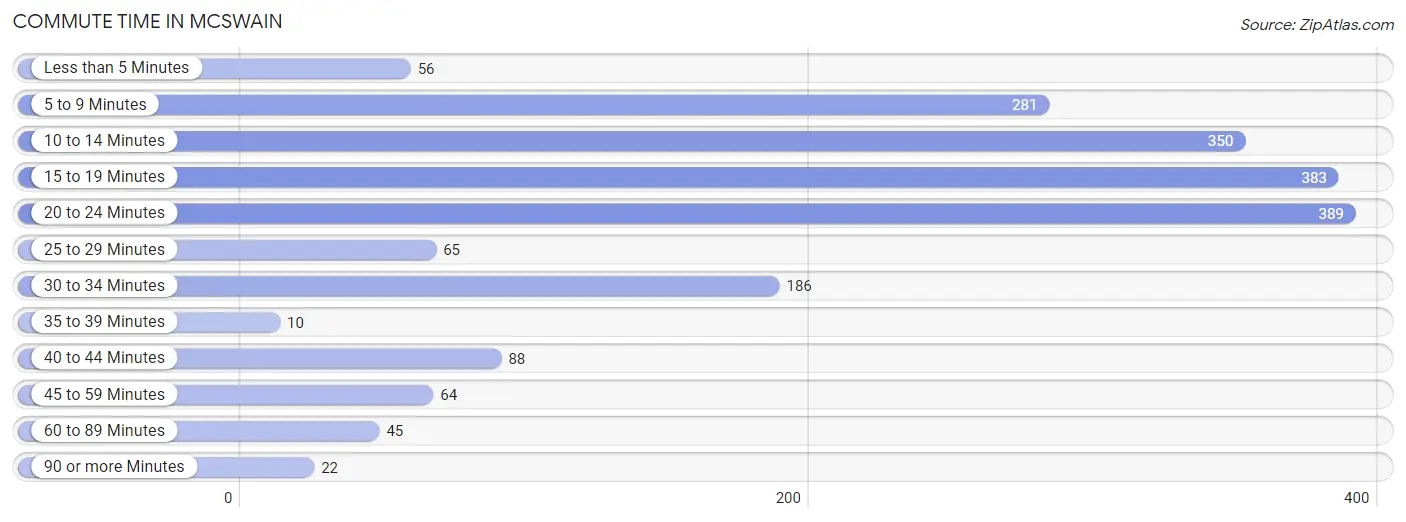
| Commute Time | # Commuters | % Commuters |
| Less than 5 Minutes | 56 | 2.9% |
| 5 to 9 Minutes | 281 | 14.5% |
| 10 to 14 Minutes | 350 | 18.0% |
| 15 to 19 Minutes | 383 | 19.8% |
| 20 to 24 Minutes | 389 | 20.1% |
| 25 to 29 Minutes | 65 | 3.4% |
| 30 to 34 Minutes | 186 | 9.6% |
| 35 to 39 Minutes | 10 | 0.5% |
| 40 to 44 Minutes | 88 | 4.5% |
| 45 to 59 Minutes | 64 | 3.3% |
| 60 to 89 Minutes | 45 | 2.3% |
| 90 or more Minutes | 22 | 1.1% |
Commute Time by Sex in McSwain
The most common commute times in McSwain are 15 to 19 minutes (269 commuters, 21.3%) for males and 10 to 14 minutes (199 commuters, 29.3%) for females.
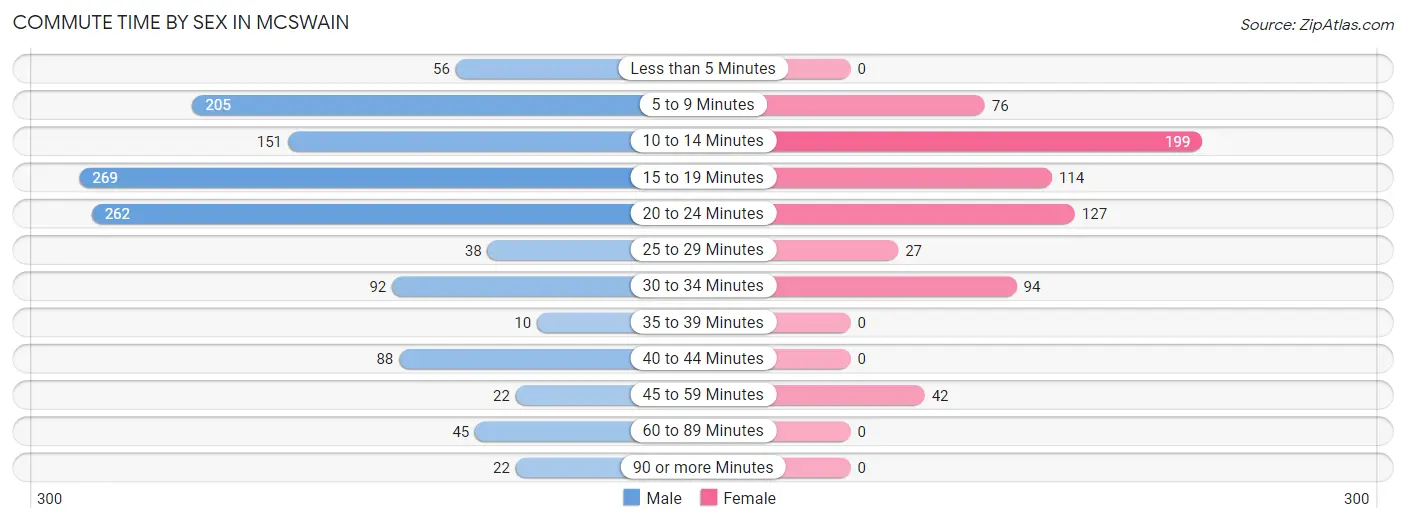
| Commute Time | Male | Female |
| Less than 5 Minutes | 56 (4.4%) | 0 (0.0%) |
| 5 to 9 Minutes | 205 (16.3%) | 76 (11.2%) |
| 10 to 14 Minutes | 151 (12.0%) | 199 (29.3%) |
| 15 to 19 Minutes | 269 (21.3%) | 114 (16.8%) |
| 20 to 24 Minutes | 262 (20.8%) | 127 (18.7%) |
| 25 to 29 Minutes | 38 (3.0%) | 27 (4.0%) |
| 30 to 34 Minutes | 92 (7.3%) | 94 (13.8%) |
| 35 to 39 Minutes | 10 (0.8%) | 0 (0.0%) |
| 40 to 44 Minutes | 88 (7.0%) | 0 (0.0%) |
| 45 to 59 Minutes | 22 (1.8%) | 42 (6.2%) |
| 60 to 89 Minutes | 45 (3.6%) | 0 (0.0%) |
| 90 or more Minutes | 22 (1.8%) | 0 (0.0%) |
Time of Departure to Work by Sex in McSwain
The most frequent times of departure to work in McSwain are 7:00 AM to 7:29 AM (350, 27.8%) for males and 7:30 AM to 7:59 AM (216, 31.8%) for females.
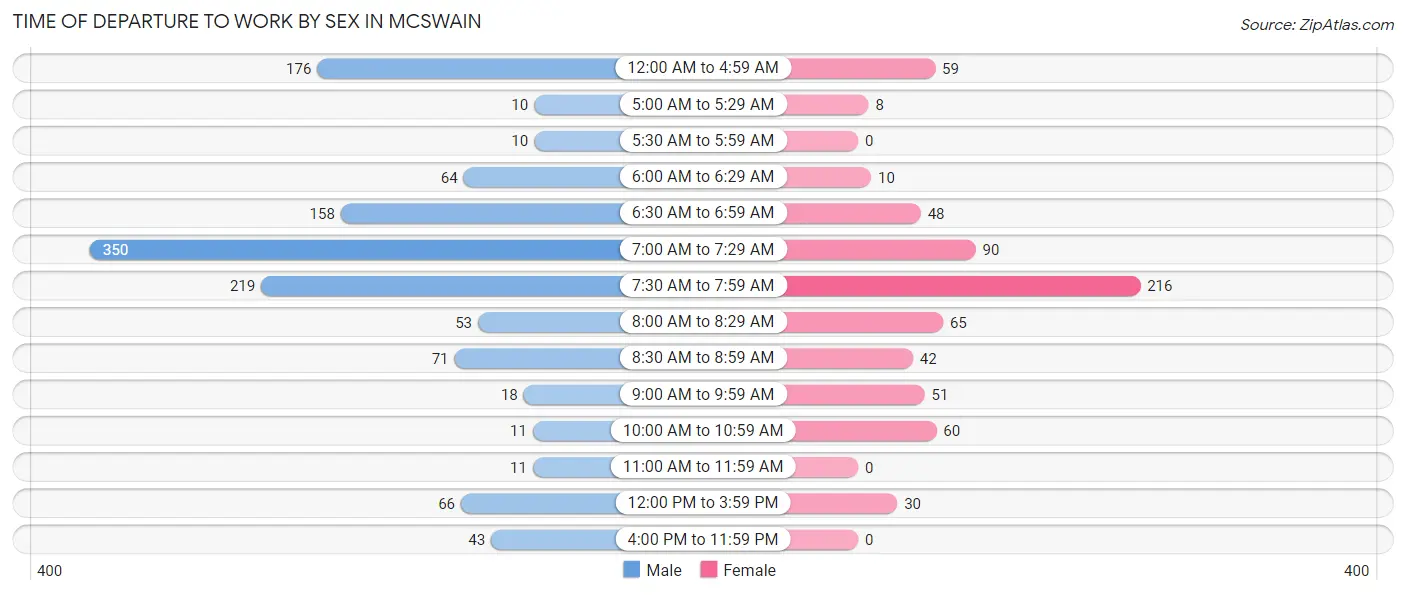
| Time of Departure | Male | Female |
| 12:00 AM to 4:59 AM | 176 (14.0%) | 59 (8.7%) |
| 5:00 AM to 5:29 AM | 10 (0.8%) | 8 (1.2%) |
| 5:30 AM to 5:59 AM | 10 (0.8%) | 0 (0.0%) |
| 6:00 AM to 6:29 AM | 64 (5.1%) | 10 (1.5%) |
| 6:30 AM to 6:59 AM | 158 (12.5%) | 48 (7.1%) |
| 7:00 AM to 7:29 AM | 350 (27.8%) | 90 (13.3%) |
| 7:30 AM to 7:59 AM | 219 (17.4%) | 216 (31.8%) |
| 8:00 AM to 8:29 AM | 53 (4.2%) | 65 (9.6%) |
| 8:30 AM to 8:59 AM | 71 (5.6%) | 42 (6.2%) |
| 9:00 AM to 9:59 AM | 18 (1.4%) | 51 (7.5%) |
| 10:00 AM to 10:59 AM | 11 (0.9%) | 60 (8.8%) |
| 11:00 AM to 11:59 AM | 11 (0.9%) | 0 (0.0%) |
| 12:00 PM to 3:59 PM | 66 (5.2%) | 30 (4.4%) |
| 4:00 PM to 11:59 PM | 43 (3.4%) | 0 (0.0%) |
| Total | 1,260 (100.0%) | 679 (100.0%) |
Housing Occupancy in McSwain
Occupancy by Ownership in McSwain
Of the total 1,548 dwellings in McSwain, owner-occupied units account for 1,218 (78.7%), while renter-occupied units make up 330 (21.3%).
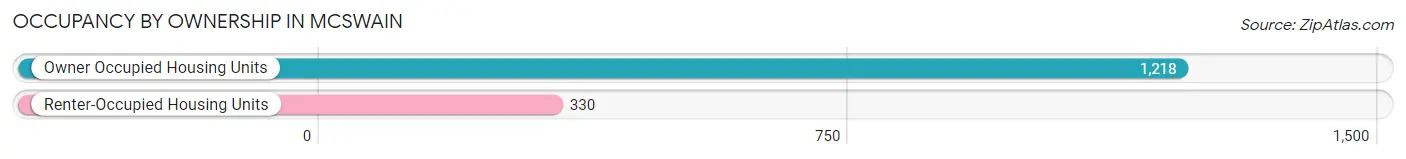
| Occupancy | # Housing Units | % Housing Units |
| Owner Occupied Housing Units | 1,218 | 78.7% |
| Renter-Occupied Housing Units | 330 | 21.3% |
| Total Occupied Housing Units | 1,548 | 100.0% |
Occupancy by Household Size in McSwain
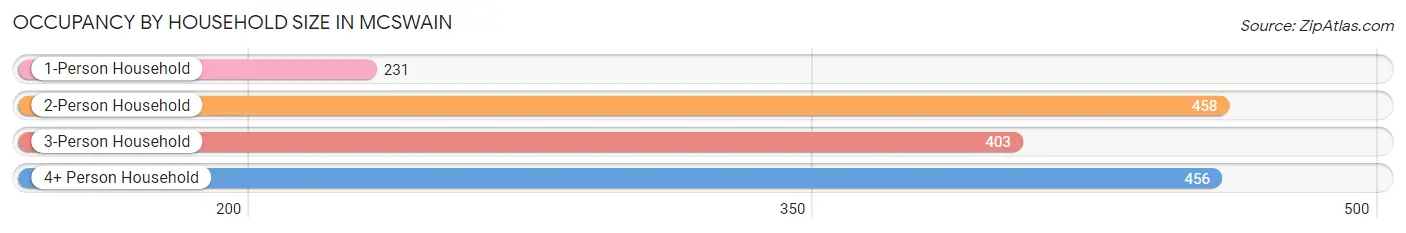
| Household Size | # Housing Units | % Housing Units |
| 1-Person Household | 231 | 14.9% |
| 2-Person Household | 458 | 29.6% |
| 3-Person Household | 403 | 26.0% |
| 4+ Person Household | 456 | 29.5% |
| Total Housing Units | 1,548 | 100.0% |
Occupancy by Ownership by Household Size in McSwain
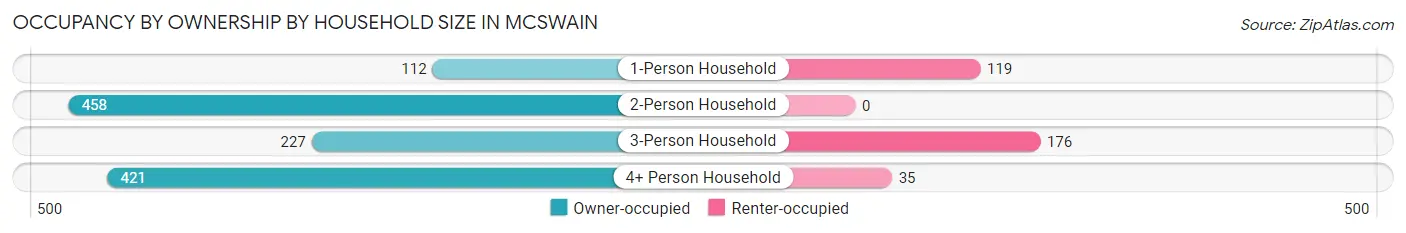
| Household Size | Owner-occupied | Renter-occupied |
| 1-Person Household | 112 (48.5%) | 119 (51.5%) |
| 2-Person Household | 458 (100.0%) | 0 (0.0%) |
| 3-Person Household | 227 (56.3%) | 176 (43.7%) |
| 4+ Person Household | 421 (92.3%) | 35 (7.7%) |
| Total Housing Units | 1,218 (78.7%) | 330 (21.3%) |
Occupancy by Educational Attainment in McSwain
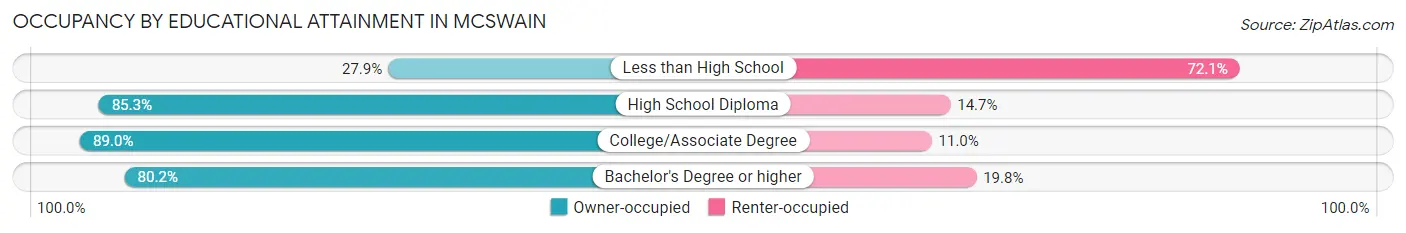
| Household Size | Owner-occupied | Renter-occupied |
| Less than High School | 38 (27.9%) | 98 (72.1%) |
| High School Diploma | 238 (85.3%) | 41 (14.7%) |
| College/Associate Degree | 340 (89.0%) | 42 (11.0%) |
| Bachelor's Degree or higher | 602 (80.2%) | 149 (19.8%) |
Occupancy by Age of Householder in McSwain
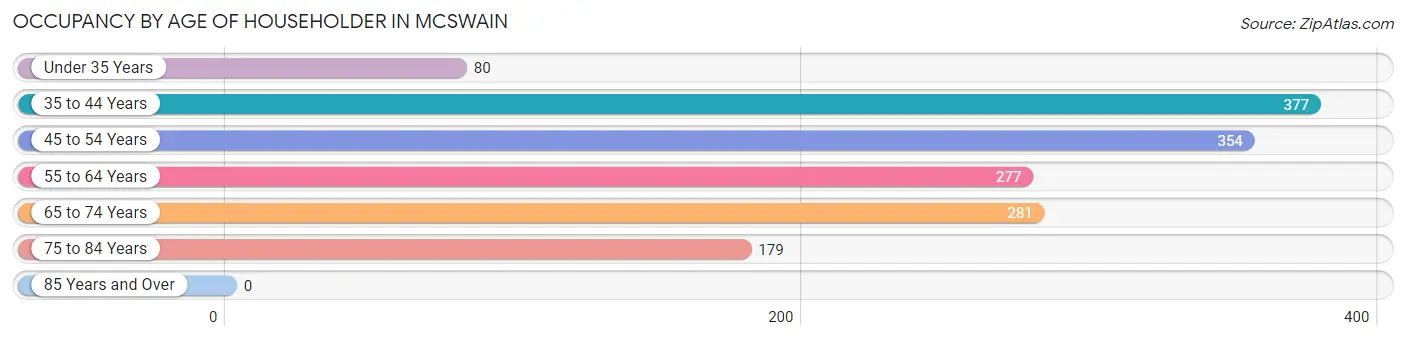
| Age Bracket | # Households | % Households |
| Under 35 Years | 80 | 5.2% |
| 35 to 44 Years | 377 | 24.3% |
| 45 to 54 Years | 354 | 22.9% |
| 55 to 64 Years | 277 | 17.9% |
| 65 to 74 Years | 281 | 18.1% |
| 75 to 84 Years | 179 | 11.6% |
| 85 Years and Over | 0 | 0.0% |
| Total | 1,548 | 100.0% |
Housing Finances in McSwain
Median Income by Occupancy in McSwain
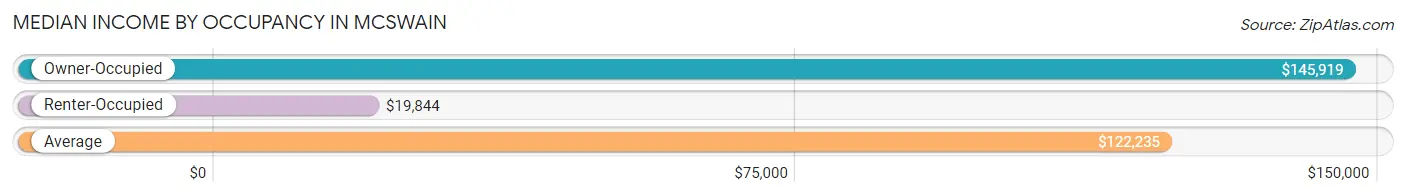
| Occupancy Type | # Households | Median Income |
| Owner-Occupied | 1,218 (78.7%) | $145,919 |
| Renter-Occupied | 330 (21.3%) | $19,844 |
| Average | 1,548 (100.0%) | $122,235 |
Occupancy by Householder Income Bracket in McSwain
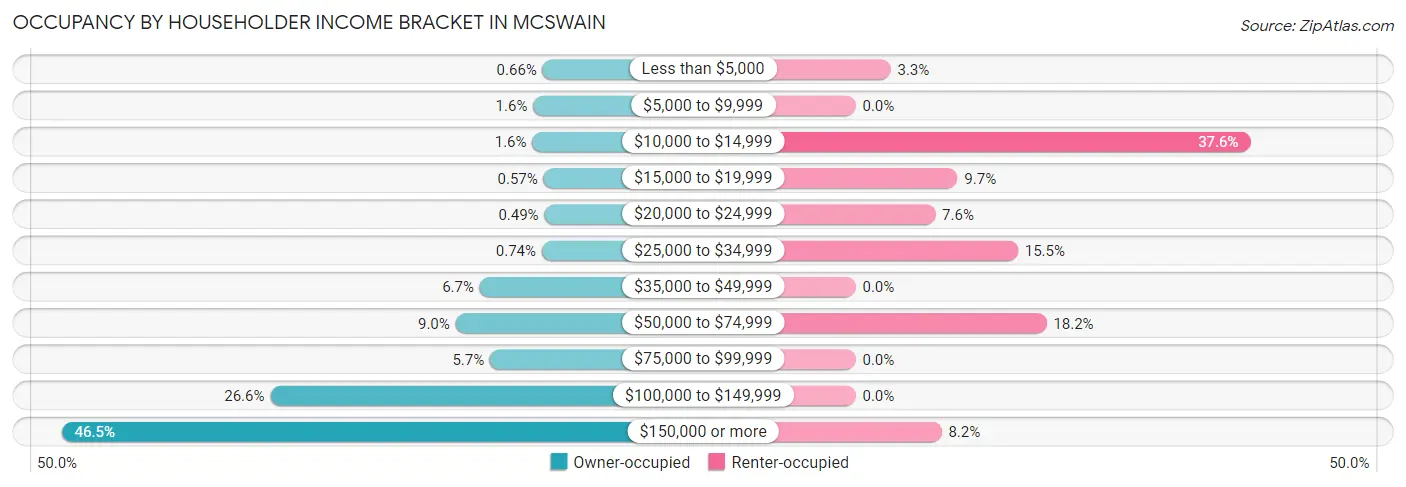
| Income Bracket | Owner-occupied | Renter-occupied |
| Less than $5,000 | 8 (0.7%) | 11 (3.3%) |
| $5,000 to $9,999 | 19 (1.6%) | 0 (0.0%) |
| $10,000 to $14,999 | 20 (1.6%) | 124 (37.6%) |
| $15,000 to $19,999 | 7 (0.6%) | 32 (9.7%) |
| $20,000 to $24,999 | 6 (0.5%) | 25 (7.6%) |
| $25,000 to $34,999 | 9 (0.7%) | 51 (15.4%) |
| $35,000 to $49,999 | 81 (6.7%) | 0 (0.0%) |
| $50,000 to $74,999 | 109 (8.9%) | 60 (18.2%) |
| $75,000 to $99,999 | 69 (5.7%) | 0 (0.0%) |
| $100,000 to $149,999 | 324 (26.6%) | 0 (0.0%) |
| $150,000 or more | 566 (46.5%) | 27 (8.2%) |
| Total | 1,218 (100.0%) | 330 (100.0%) |
Monthly Housing Cost Tiers in McSwain
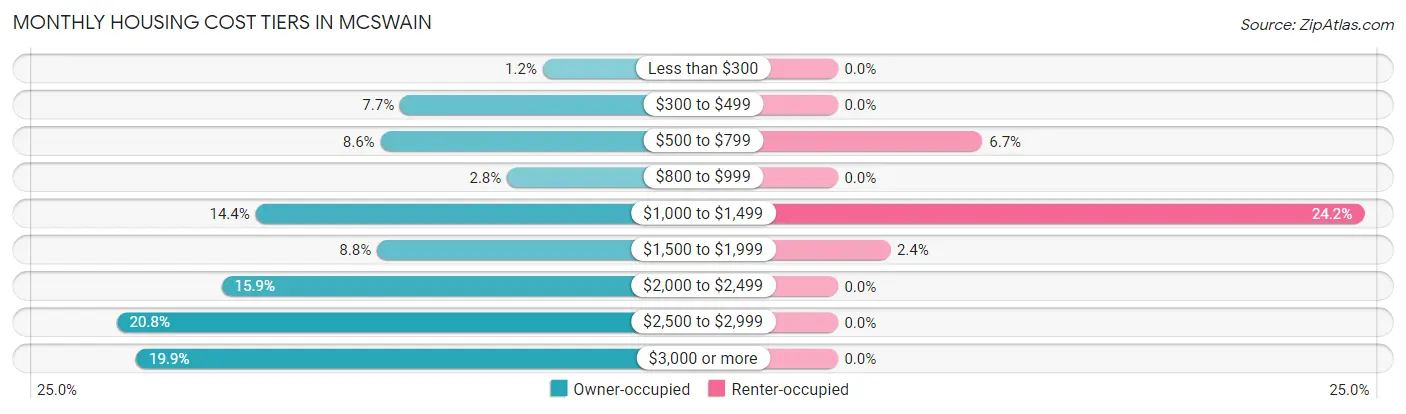
| Monthly Cost | Owner-occupied | Renter-occupied |
| Less than $300 | 14 (1.1%) | 0 (0.0%) |
| $300 to $499 | 94 (7.7%) | 0 (0.0%) |
| $500 to $799 | 105 (8.6%) | 22 (6.7%) |
| $800 to $999 | 34 (2.8%) | 0 (0.0%) |
| $1,000 to $1,499 | 175 (14.4%) | 80 (24.2%) |
| $1,500 to $1,999 | 107 (8.8%) | 8 (2.4%) |
| $2,000 to $2,499 | 194 (15.9%) | 0 (0.0%) |
| $2,500 to $2,999 | 253 (20.8%) | 0 (0.0%) |
| $3,000 or more | 242 (19.9%) | 0 (0.0%) |
| Total | 1,218 (100.0%) | 330 (100.0%) |
Physical Housing Characteristics in McSwain
Housing Structures in McSwain
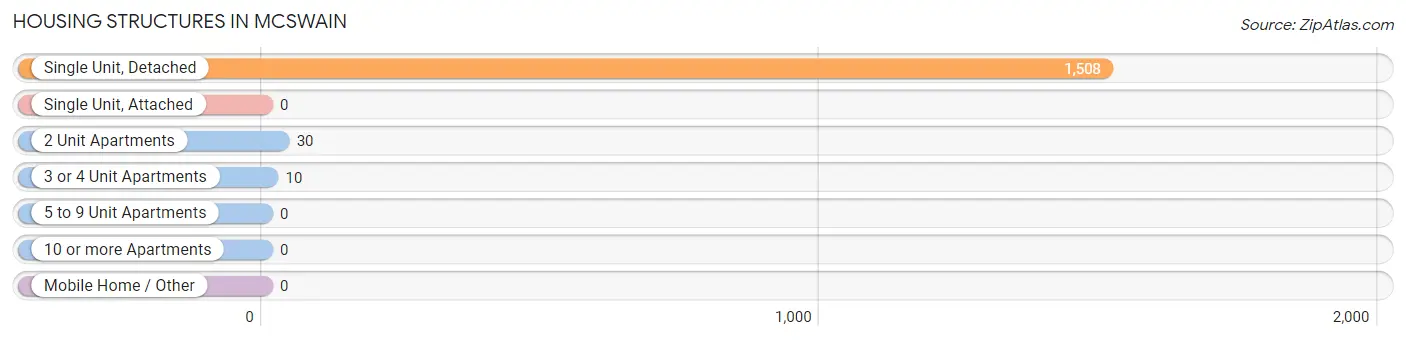
| Structure Type | # Housing Units | % Housing Units |
| Single Unit, Detached | 1,508 | 97.4% |
| Single Unit, Attached | 0 | 0.0% |
| 2 Unit Apartments | 30 | 1.9% |
| 3 or 4 Unit Apartments | 10 | 0.6% |
| 5 to 9 Unit Apartments | 0 | 0.0% |
| 10 or more Apartments | 0 | 0.0% |
| Mobile Home / Other | 0 | 0.0% |
| Total | 1,548 | 100.0% |
Housing Structures by Occupancy in McSwain
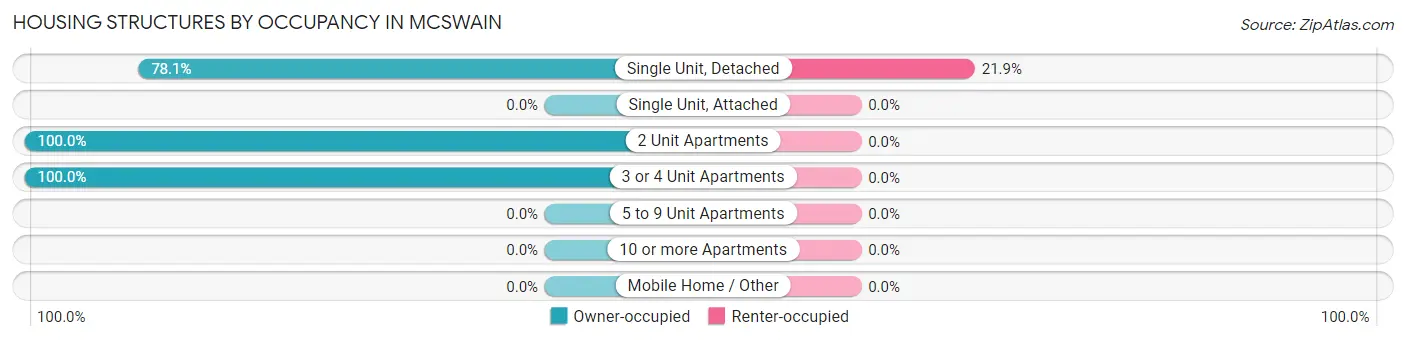
| Structure Type | Owner-occupied | Renter-occupied |
| Single Unit, Detached | 1,178 (78.1%) | 330 (21.9%) |
| Single Unit, Attached | 0 (0.0%) | 0 (0.0%) |
| 2 Unit Apartments | 30 (100.0%) | 0 (0.0%) |
| 3 or 4 Unit Apartments | 10 (100.0%) | 0 (0.0%) |
| 5 to 9 Unit Apartments | 0 (0.0%) | 0 (0.0%) |
| 10 or more Apartments | 0 (0.0%) | 0 (0.0%) |
| Mobile Home / Other | 0 (0.0%) | 0 (0.0%) |
| Total | 1,218 (78.7%) | 330 (21.3%) |
Housing Structures by Number of Rooms in McSwain
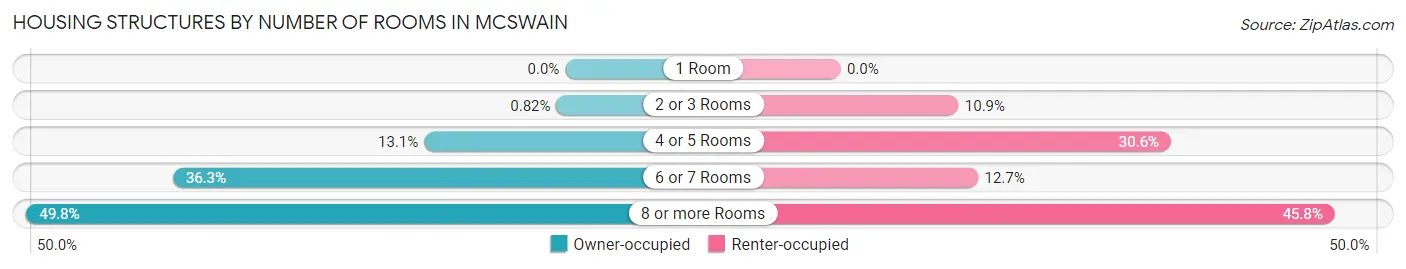
| Number of Rooms | Owner-occupied | Renter-occupied |
| 1 Room | 0 (0.0%) | 0 (0.0%) |
| 2 or 3 Rooms | 10 (0.8%) | 36 (10.9%) |
| 4 or 5 Rooms | 159 (13.1%) | 101 (30.6%) |
| 6 or 7 Rooms | 442 (36.3%) | 42 (12.7%) |
| 8 or more Rooms | 607 (49.8%) | 151 (45.8%) |
| Total | 1,218 (100.0%) | 330 (100.0%) |
Housing Structure by Heating Type in McSwain
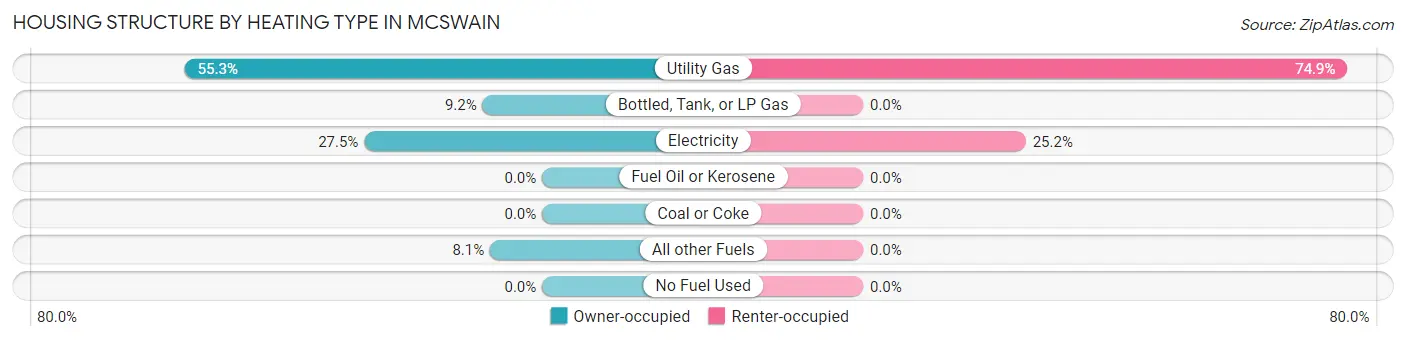
| Heating Type | Owner-occupied | Renter-occupied |
| Utility Gas | 673 (55.2%) | 247 (74.9%) |
| Bottled, Tank, or LP Gas | 112 (9.2%) | 0 (0.0%) |
| Electricity | 335 (27.5%) | 83 (25.2%) |
| Fuel Oil or Kerosene | 0 (0.0%) | 0 (0.0%) |
| Coal or Coke | 0 (0.0%) | 0 (0.0%) |
| All other Fuels | 98 (8.1%) | 0 (0.0%) |
| No Fuel Used | 0 (0.0%) | 0 (0.0%) |
| Total | 1,218 (100.0%) | 330 (100.0%) |
Household Vehicle Usage in McSwain
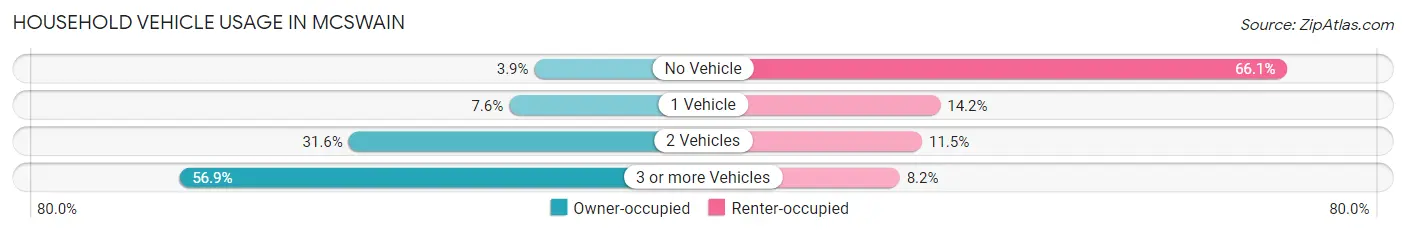
| Vehicles per Household | Owner-occupied | Renter-occupied |
| No Vehicle | 47 (3.9%) | 218 (66.1%) |
| 1 Vehicle | 93 (7.6%) | 47 (14.2%) |
| 2 Vehicles | 385 (31.6%) | 38 (11.5%) |
| 3 or more Vehicles | 693 (56.9%) | 27 (8.2%) |
| Total | 1,218 (100.0%) | 330 (100.0%) |
Real Estate & Mortgages in McSwain
Real Estate and Mortgage Overview in McSwain
| Characteristic | Without Mortgage | With Mortgage |
| Housing Units | 331 | 887 |
| Median Property Value | $576,400 | $612,500 |
| Median Household Income | $120,750 | $453 |
| Monthly Housing Costs | $689 | $242 |
| Real Estate Taxes | $3,922 | $0 |
Property Value by Mortgage Status in McSwain
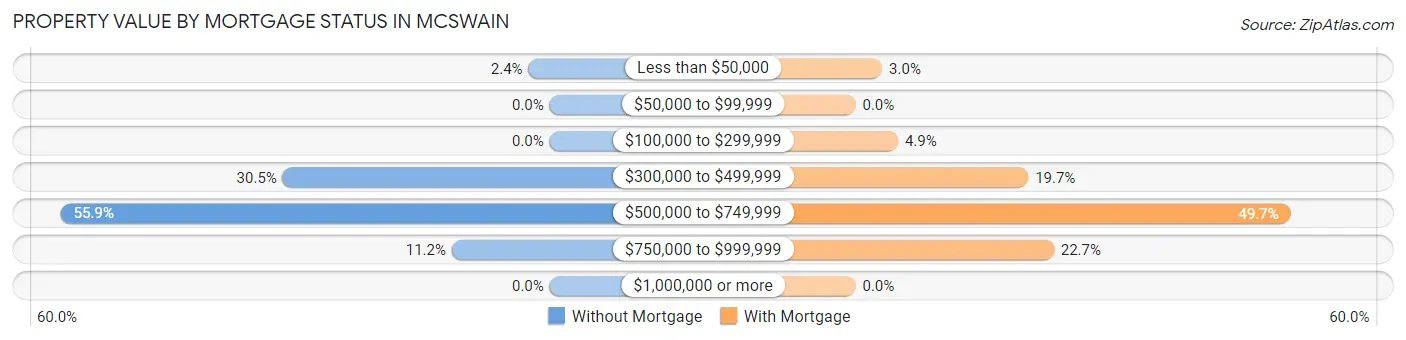
| Property Value | Without Mortgage | With Mortgage |
| Less than $50,000 | 8 (2.4%) | 27 (3.0%) |
| $50,000 to $99,999 | 0 (0.0%) | 0 (0.0%) |
| $100,000 to $299,999 | 0 (0.0%) | 43 (4.9%) |
| $300,000 to $499,999 | 101 (30.5%) | 175 (19.7%) |
| $500,000 to $749,999 | 185 (55.9%) | 441 (49.7%) |
| $750,000 to $999,999 | 37 (11.2%) | 201 (22.7%) |
| $1,000,000 or more | 0 (0.0%) | 0 (0.0%) |
| Total | 331 (100.0%) | 887 (100.0%) |
Household Income by Mortgage Status in McSwain
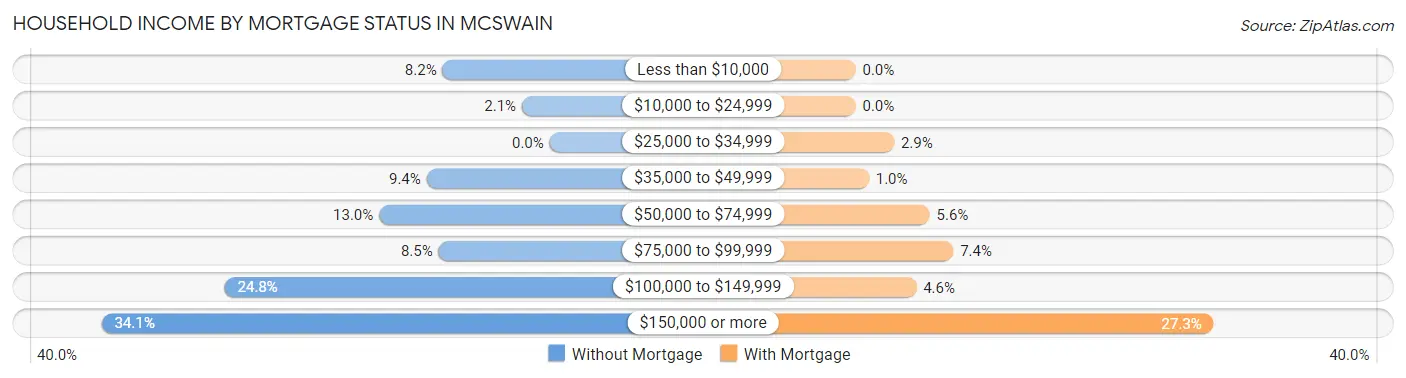
| Household Income | Without Mortgage | With Mortgage |
| Less than $10,000 | 27 (8.2%) | 0 (0.0%) |
| $10,000 to $24,999 | 7 (2.1%) | 0 (0.0%) |
| $25,000 to $34,999 | 0 (0.0%) | 26 (2.9%) |
| $35,000 to $49,999 | 31 (9.4%) | 9 (1.0%) |
| $50,000 to $74,999 | 43 (13.0%) | 50 (5.6%) |
| $75,000 to $99,999 | 28 (8.5%) | 66 (7.4%) |
| $100,000 to $149,999 | 82 (24.8%) | 41 (4.6%) |
| $150,000 or more | 113 (34.1%) | 242 (27.3%) |
| Total | 331 (100.0%) | 887 (100.0%) |
Property Value to Household Income Ratio in McSwain
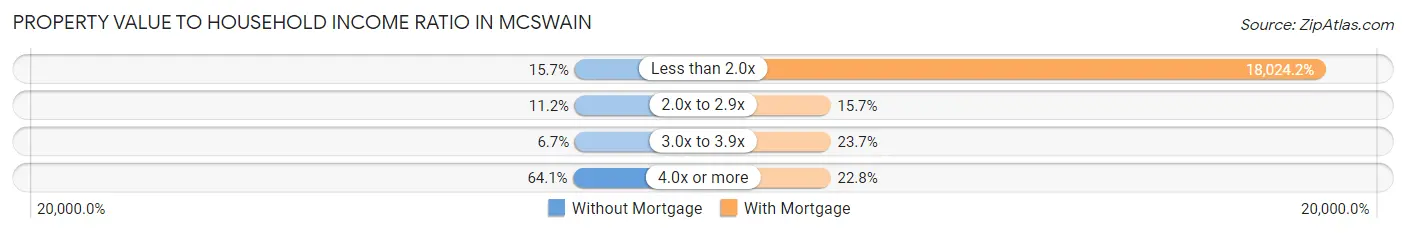
| Value-to-Income Ratio | Without Mortgage | With Mortgage |
| Less than 2.0x | 52 (15.7%) | 159,875 (18,024.2%) |
| 2.0x to 2.9x | 37 (11.2%) | 139 (15.7%) |
| 3.0x to 3.9x | 22 (6.7%) | 210 (23.7%) |
| 4.0x or more | 212 (64.0%) | 202 (22.8%) |
| Total | 331 (100.0%) | 887 (100.0%) |
Real Estate Taxes by Mortgage Status in McSwain
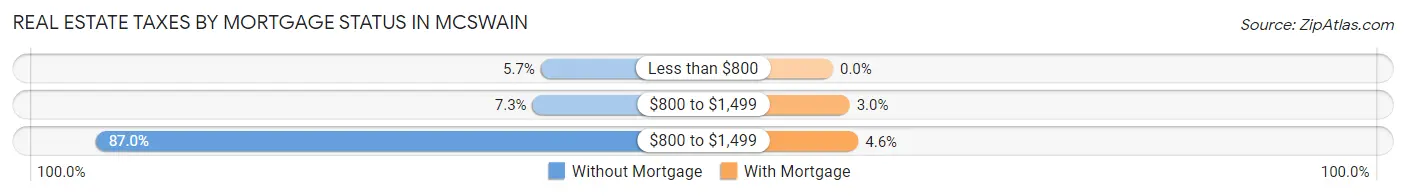
| Property Taxes | Without Mortgage | With Mortgage |
| Less than $800 | 19 (5.7%) | 0 (0.0%) |
| $800 to $1,499 | 24 (7.2%) | 27 (3.0%) |
| $800 to $1,499 | 288 (87.0%) | 41 (4.6%) |
| Total | 331 (100.0%) | 887 (100.0%) |
Health & Disability in McSwain
Health Insurance Coverage by Age in McSwain
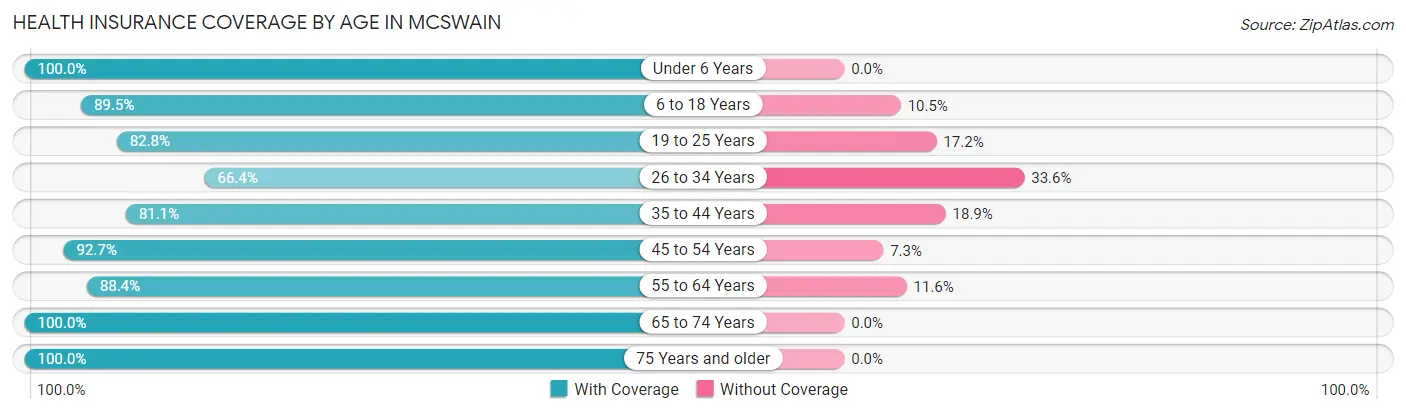
| Age Bracket | With Coverage | Without Coverage |
| Under 6 Years | 197 (100.0%) | 0 (0.0%) |
| 6 to 18 Years | 1,276 (89.5%) | 150 (10.5%) |
| 19 to 25 Years | 265 (82.8%) | 55 (17.2%) |
| 26 to 34 Years | 196 (66.4%) | 99 (33.6%) |
| 35 to 44 Years | 601 (81.1%) | 140 (18.9%) |
| 45 to 54 Years | 651 (92.7%) | 51 (7.3%) |
| 55 to 64 Years | 540 (88.4%) | 71 (11.6%) |
| 65 to 74 Years | 450 (100.0%) | 0 (0.0%) |
| 75 Years and older | 300 (100.0%) | 0 (0.0%) |
| Total | 4,476 (88.8%) | 566 (11.2%) |
Health Insurance Coverage by Citizenship Status in McSwain
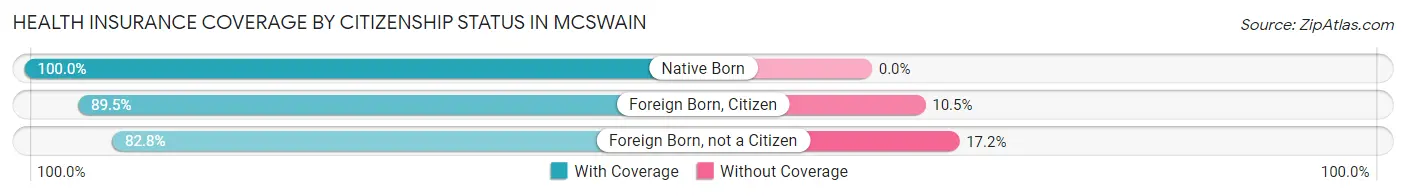
| Citizenship Status | With Coverage | Without Coverage |
| Native Born | 197 (100.0%) | 0 (0.0%) |
| Foreign Born, Citizen | 1,276 (89.5%) | 150 (10.5%) |
| Foreign Born, not a Citizen | 265 (82.8%) | 55 (17.2%) |
Health Insurance Coverage by Household Income in McSwain
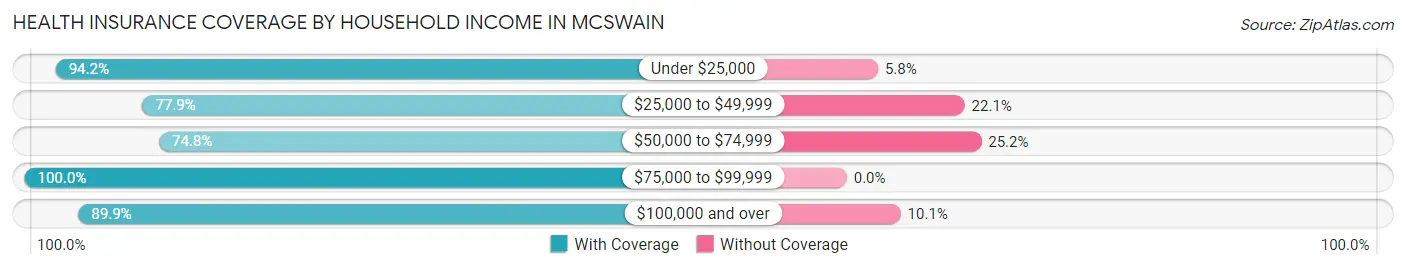
| Household Income | With Coverage | Without Coverage |
| Under $25,000 | 548 (94.2%) | 34 (5.8%) |
| $25,000 to $49,999 | 180 (77.9%) | 51 (22.1%) |
| $50,000 to $74,999 | 374 (74.8%) | 126 (25.2%) |
| $75,000 to $99,999 | 196 (100.0%) | 0 (0.0%) |
| $100,000 and over | 3,165 (89.9%) | 355 (10.1%) |
Public vs Private Health Insurance Coverage by Age in McSwain
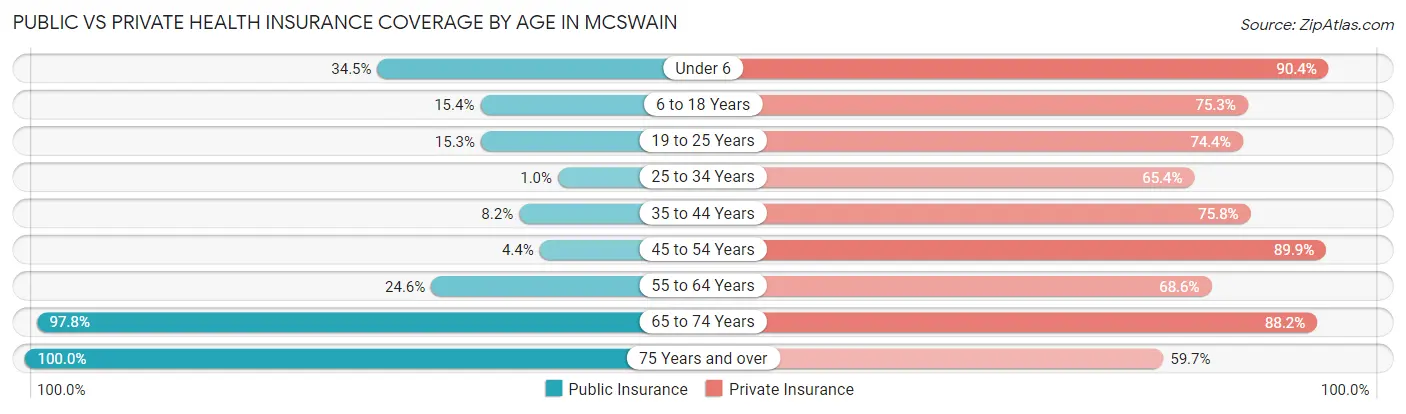
| Age Bracket | Public Insurance | Private Insurance |
| Under 6 | 68 (34.5%) | 178 (90.4%) |
| 6 to 18 Years | 220 (15.4%) | 1,074 (75.3%) |
| 19 to 25 Years | 49 (15.3%) | 238 (74.4%) |
| 25 to 34 Years | 3 (1.0%) | 193 (65.4%) |
| 35 to 44 Years | 61 (8.2%) | 562 (75.8%) |
| 45 to 54 Years | 31 (4.4%) | 631 (89.9%) |
| 55 to 64 Years | 150 (24.5%) | 419 (68.6%) |
| 65 to 74 Years | 440 (97.8%) | 397 (88.2%) |
| 75 Years and over | 300 (100.0%) | 179 (59.7%) |
| Total | 1,322 (26.2%) | 3,871 (76.8%) |
Disability Status by Sex by Age in McSwain
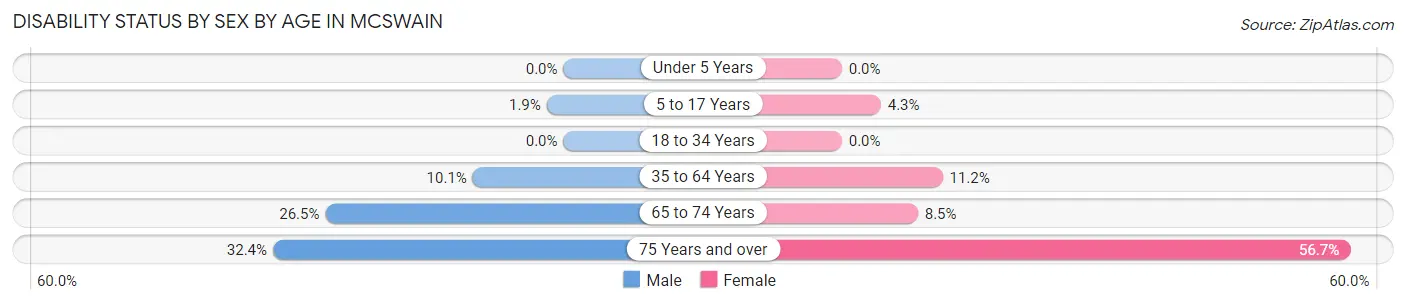
| Age Bracket | Male | Female |
| Under 5 Years | 0 (0.0%) | 0 (0.0%) |
| 5 to 17 Years | 15 (1.9%) | 20 (4.3%) |
| 18 to 34 Years | 0 (0.0%) | 0 (0.0%) |
| 35 to 64 Years | 103 (10.1%) | 116 (11.2%) |
| 65 to 74 Years | 66 (26.5%) | 17 (8.5%) |
| 75 Years and over | 44 (32.4%) | 93 (56.7%) |
Disability Class by Sex by Age in McSwain
Disability Class: Hearing Difficulty
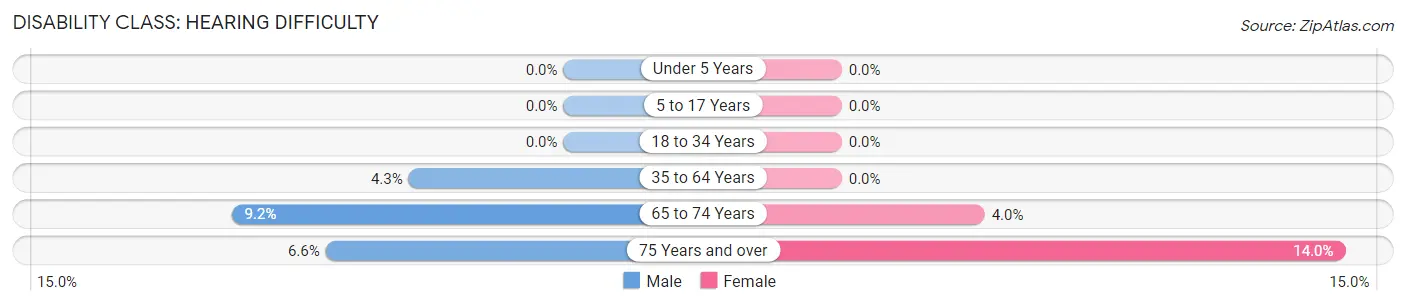
| Age Bracket | Male | Female |
| Under 5 Years | 0 (0.0%) | 0 (0.0%) |
| 5 to 17 Years | 0 (0.0%) | 0 (0.0%) |
| 18 to 34 Years | 0 (0.0%) | 0 (0.0%) |
| 35 to 64 Years | 44 (4.3%) | 0 (0.0%) |
| 65 to 74 Years | 23 (9.2%) | 8 (4.0%) |
| 75 Years and over | 9 (6.6%) | 23 (14.0%) |
Disability Class: Vision Difficulty
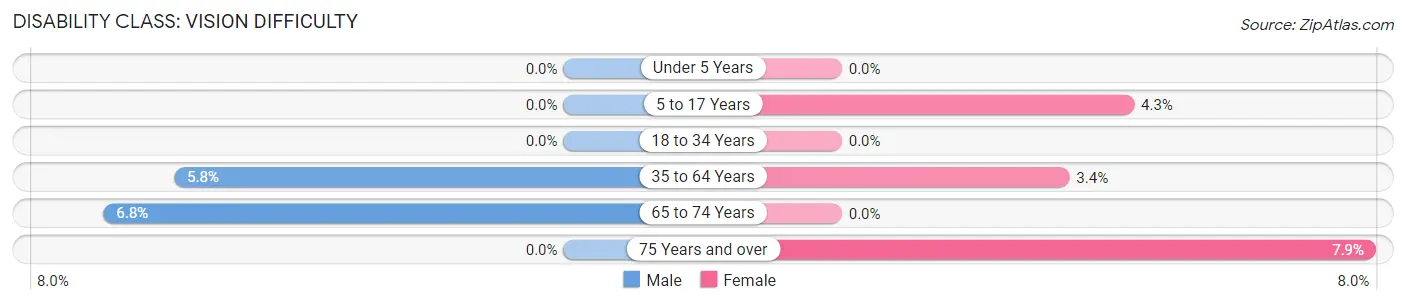
| Age Bracket | Male | Female |
| Under 5 Years | 0 (0.0%) | 0 (0.0%) |
| 5 to 17 Years | 0 (0.0%) | 20 (4.3%) |
| 18 to 34 Years | 0 (0.0%) | 0 (0.0%) |
| 35 to 64 Years | 59 (5.8%) | 35 (3.4%) |
| 65 to 74 Years | 17 (6.8%) | 0 (0.0%) |
| 75 Years and over | 0 (0.0%) | 13 (7.9%) |
Disability Class: Cognitive Difficulty
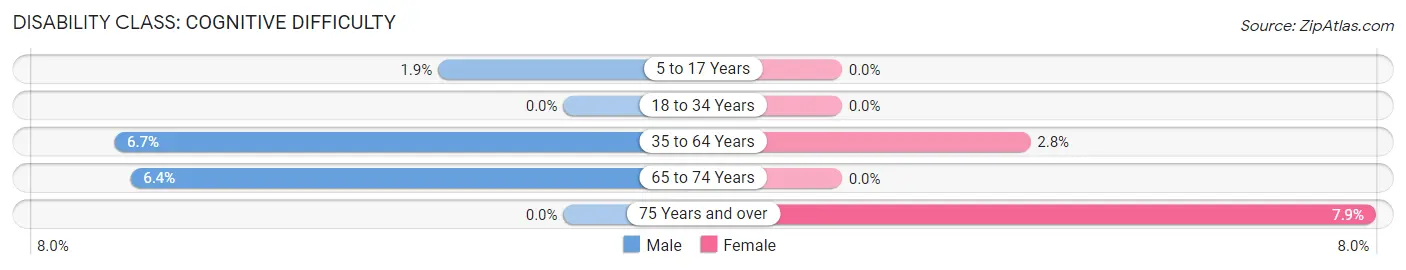
| Age Bracket | Male | Female |
| 5 to 17 Years | 15 (1.9%) | 0 (0.0%) |
| 18 to 34 Years | 0 (0.0%) | 0 (0.0%) |
| 35 to 64 Years | 68 (6.7%) | 29 (2.8%) |
| 65 to 74 Years | 16 (6.4%) | 0 (0.0%) |
| 75 Years and over | 0 (0.0%) | 13 (7.9%) |
Disability Class: Ambulatory Difficulty
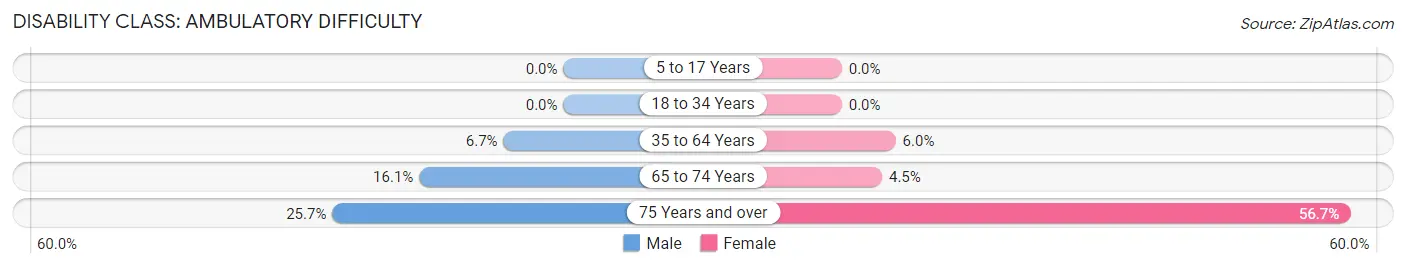
| Age Bracket | Male | Female |
| 5 to 17 Years | 0 (0.0%) | 0 (0.0%) |
| 18 to 34 Years | 0 (0.0%) | 0 (0.0%) |
| 35 to 64 Years | 68 (6.7%) | 62 (6.0%) |
| 65 to 74 Years | 40 (16.1%) | 9 (4.5%) |
| 75 Years and over | 35 (25.7%) | 93 (56.7%) |
Disability Class: Self-Care Difficulty
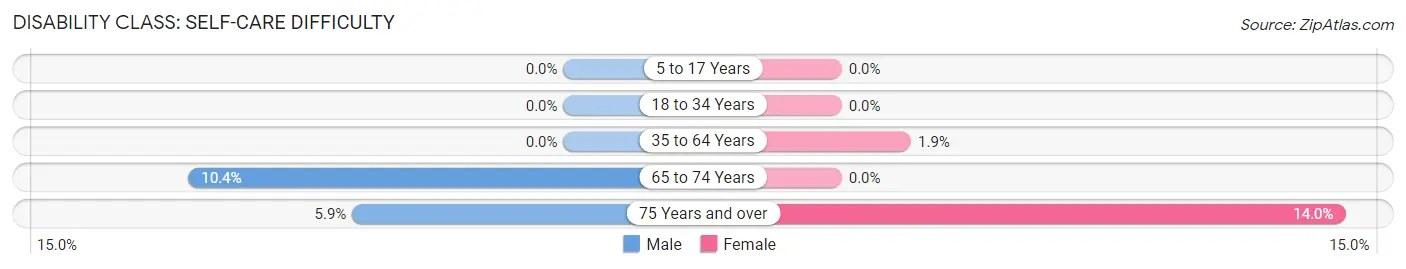
| Age Bracket | Male | Female |
| 5 to 17 Years | 0 (0.0%) | 0 (0.0%) |
| 18 to 34 Years | 0 (0.0%) | 0 (0.0%) |
| 35 to 64 Years | 0 (0.0%) | 20 (1.9%) |
| 65 to 74 Years | 26 (10.4%) | 0 (0.0%) |
| 75 Years and over | 8 (5.9%) | 23 (14.0%) |
Technology Access in McSwain
Computing Device Access in McSwain
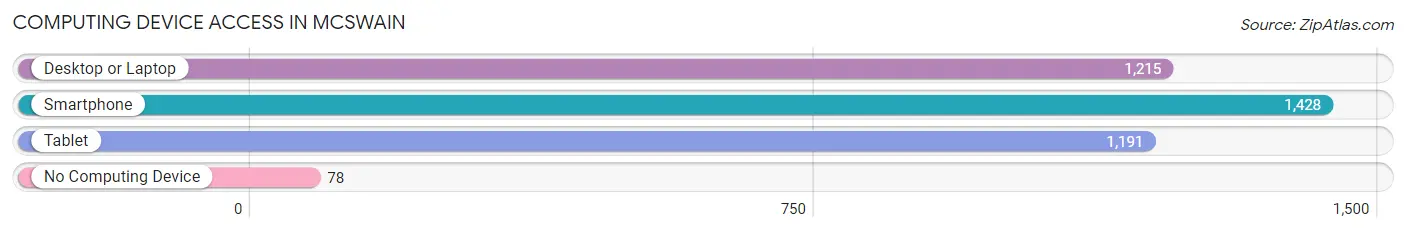
| Device Type | # Households | % Households |
| Desktop or Laptop | 1,215 | 78.5% |
| Smartphone | 1,428 | 92.2% |
| Tablet | 1,191 | 76.9% |
| No Computing Device | 78 | 5.0% |
| Total | 1,548 | 100.0% |
Internet Access in McSwain
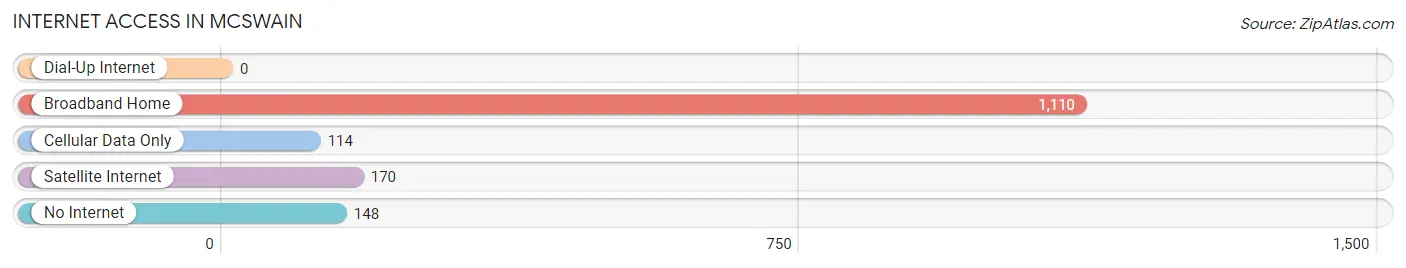
| Internet Type | # Households | % Households |
| Dial-Up Internet | 0 | 0.0% |
| Broadband Home | 1,110 | 71.7% |
| Cellular Data Only | 114 | 7.4% |
| Satellite Internet | 170 | 11.0% |
| No Internet | 148 | 9.6% |
| Total | 1,548 | 100.0% |
McSwain Summary
Mcswain is a small unincorporated community located in Merced County, California. It is situated in the San Joaquin Valley, approximately 8 miles east of the city of Merced. The population of Mcswain was estimated to be around 1,000 in 2020.
History
Mcswain was founded in the late 1800s by a group of settlers from the Midwest. The town was named after a local rancher, John McSwain, who owned a large ranch in the area. The town was originally a farming community, with many of the settlers growing wheat, barley, and other crops.
In the early 1900s, the town began to grow as more people moved to the area. The town was home to a number of businesses, including a general store, a blacksmith shop, and a post office. The town also had a school, which was built in the early 1900s.
In the 1950s, the town began to decline as many of the residents moved away. The town was eventually abandoned in the late 1960s.
Geography
Mcswain is located in the San Joaquin Valley, approximately 8 miles east of the city of Merced. The town is situated on the banks of the Merced River, which flows through the area. The town is surrounded by rolling hills and farmland.
The climate in Mcswain is generally warm and dry, with temperatures ranging from the mid-50s to the mid-90s in the summer months. The area receives an average of 10 inches of rain per year.
Economy
The economy of Mcswain is largely based on agriculture. The town is home to a number of farms, which grow a variety of crops, including wheat, barley, and other grains. The town also has a number of small businesses, including a general store, a blacksmith shop, and a post office.
Demographics
The population of Mcswain was estimated to be around 1,000 in 2020. The town is predominantly white, with a small Hispanic population. The median household income in Mcswain is around $50,000. The town has a high rate of poverty, with around 25% of the population living below the poverty line.
Common Questions
What is Per Capita Income in McSwain?
Per Capita income in McSwain is $68,324.
What is the Median Family Income in McSwain?
Median Family Income in McSwain is $137,370.
What is the Median Household income in McSwain?
Median Household Income in McSwain is $122,235.
What is Income or Wage Gap in McSwain?
Income or Wage Gap in McSwain is 19.5%.
Women in McSwain earn 80.5 cents for every dollar earned by a man.
What is Inequality or Gini Index in McSwain?
Inequality or Gini Index in McSwain is 0.60.
What is the Total Population of McSwain?
Total Population of McSwain is 5,042.
What is the Total Male Population of McSwain?
Total Male Population of McSwain is 2,887.
What is the Total Female Population of McSwain?
Total Female Population of McSwain is 2,155.
What is the Ratio of Males per 100 Females in McSwain?
There are 133.97 Males per 100 Females in McSwain.
What is the Ratio of Females per 100 Males in McSwain?
There are 74.64 Females per 100 Males in McSwain.
What is the Median Population Age in McSwain?
Median Population Age in McSwain is 38.1 Years.
What is the Average Family Size in McSwain
Average Family Size in McSwain is 3.6 People.
What is the Average Household Size in McSwain
Average Household Size in McSwain is 3.2 People.
How Large is the Labor Force in McSwain?
There are 2,286 People in the Labor Forcein in McSwain.
What is the Percentage of People in the Labor Force in McSwain?
61.4% of People are in the Labor Force in McSwain.
What is the Unemployment Rate in McSwain?
Unemployment Rate in McSwain is 4.1%.