Bayview CDP Humboldt County, CA Map & Demographics
Bayview CDP Humboldt County Overview
$31,943
PER CAPITA INCOME
$44,375
AVG FAMILY INCOME
$32,553
AVG HOUSEHOLD INCOME
58.4%
WAGE / INCOME GAP [ % ]
41.6¢/ $1
WAGE / INCOME GAP [ $ ]
$13,381
FAMILY INCOME DEFICIT
0.61
INEQUALITY / GINI INDEX
2,719
TOTAL POPULATION
1,247
MALE POPULATION
1,472
FEMALE POPULATION
84.71
MALES / 100 FEMALES
118.04
FEMALES / 100 MALES
41.2
MEDIAN AGE
3.0
AVG FAMILY SIZE
2.5
AVG HOUSEHOLD SIZE
1,247
LABOR FORCE [ PEOPLE ]
57.8%
PERCENT IN LABOR FORCE
9.7%
UNEMPLOYMENT RATE
Income in Bayview CDP Humboldt County
Income Overview in Bayview CDP Humboldt County
Per Capita Income in Bayview CDP Humboldt County is $31,943, while median incomes of families and households are $44,375 and $32,553 respectively.
| Characteristic | Number | Measure |
| Per Capita Income | 2,719 | $31,943 |
| Median Family Income | 676 | $44,375 |
| Mean Family Income | 676 | $103,270 |
| Median Household Income | 1,096 | $32,553 |
| Mean Household Income | 1,096 | $79,564 |
| Income Deficit | 676 | $13,381 |
| Wage / Income Gap (%) | 2,719 | 58.45% |
| Wage / Income Gap ($) | 2,719 | 41.55¢ per $1 |
| Gini / Inequality Index | 2,719 | 0.61 |
Earnings by Sex in Bayview CDP Humboldt County
Average Earnings in Bayview CDP Humboldt County are $26,675, $35,919 for men and $14,926 for women, a difference of 58.5%.
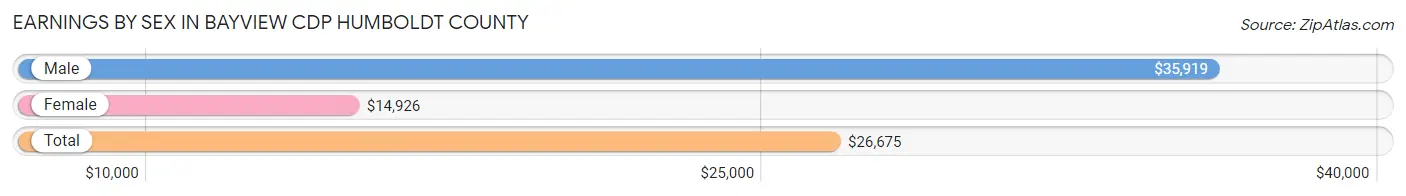
| Sex | Number | Average Earnings |
| Male | 675 (52.8%) | $35,919 |
| Female | 604 (47.2%) | $14,926 |
| Total | 1,279 (100.0%) | $26,675 |
Earnings by Sex by Income Bracket in Bayview CDP Humboldt County
The most common earnings brackets in Bayview CDP Humboldt County are $12,500 to $14,999 for men (139 | 20.6%) and $5,000 to $7,499 for women (79 | 13.1%).
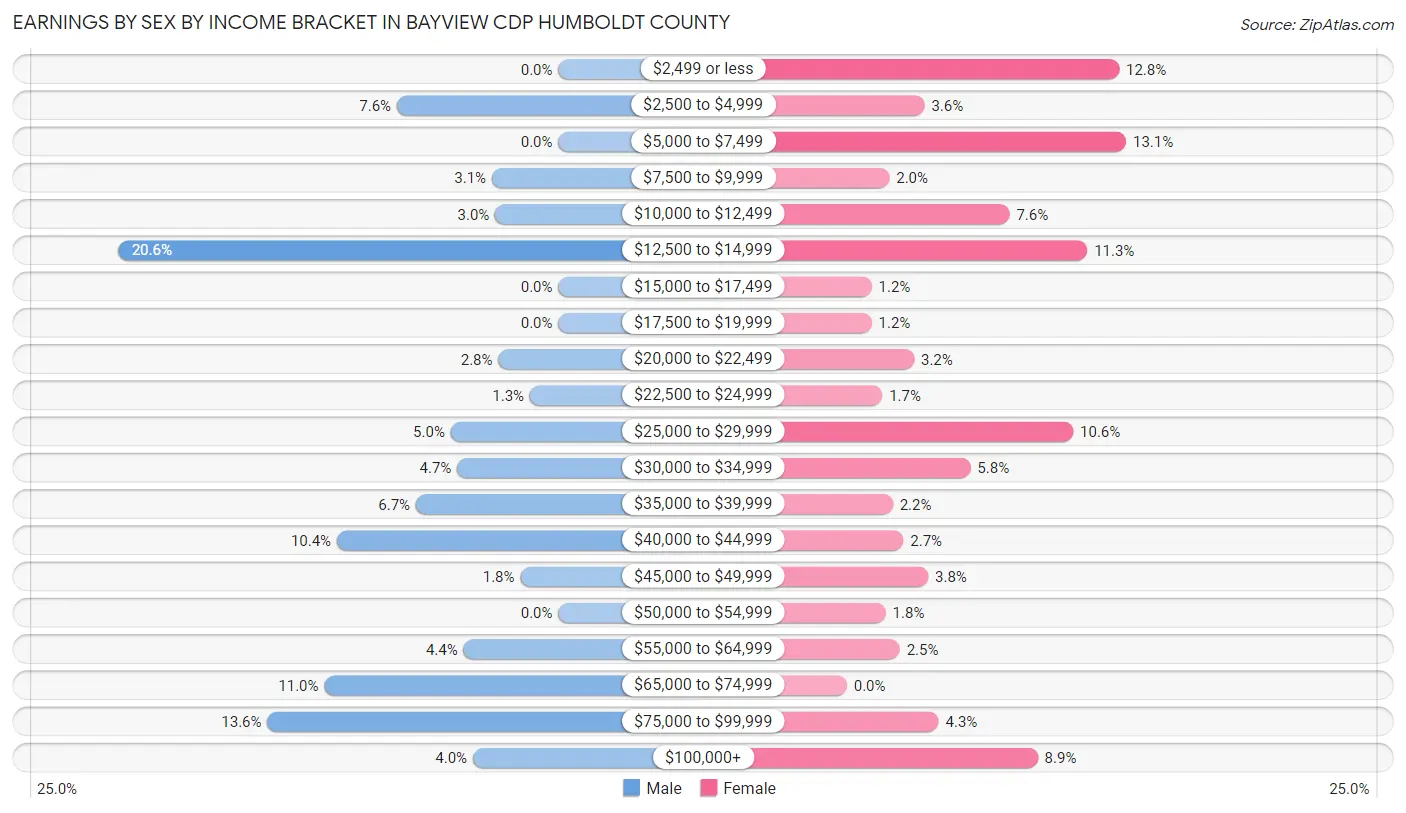
| Income | Male | Female |
| $2,499 or less | 0 (0.0%) | 77 (12.8%) |
| $2,500 to $4,999 | 51 (7.6%) | 22 (3.6%) |
| $5,000 to $7,499 | 0 (0.0%) | 79 (13.1%) |
| $7,500 to $9,999 | 21 (3.1%) | 12 (2.0%) |
| $10,000 to $12,499 | 20 (3.0%) | 46 (7.6%) |
| $12,500 to $14,999 | 139 (20.6%) | 68 (11.3%) |
| $15,000 to $17,499 | 0 (0.0%) | 7 (1.2%) |
| $17,500 to $19,999 | 0 (0.0%) | 7 (1.2%) |
| $20,000 to $22,499 | 19 (2.8%) | 19 (3.2%) |
| $22,500 to $24,999 | 9 (1.3%) | 10 (1.7%) |
| $25,000 to $29,999 | 34 (5.0%) | 64 (10.6%) |
| $30,000 to $34,999 | 32 (4.7%) | 35 (5.8%) |
| $35,000 to $39,999 | 45 (6.7%) | 13 (2.1%) |
| $40,000 to $44,999 | 70 (10.4%) | 16 (2.6%) |
| $45,000 to $49,999 | 12 (1.8%) | 23 (3.8%) |
| $50,000 to $54,999 | 0 (0.0%) | 11 (1.8%) |
| $55,000 to $64,999 | 30 (4.4%) | 15 (2.5%) |
| $65,000 to $74,999 | 74 (11.0%) | 0 (0.0%) |
| $75,000 to $99,999 | 92 (13.6%) | 26 (4.3%) |
| $100,000+ | 27 (4.0%) | 54 (8.9%) |
| Total | 675 (100.0%) | 604 (100.0%) |
Earnings by Sex by Educational Attainment in Bayview CDP Humboldt County
Average earnings in Bayview CDP Humboldt County are $38,409 for men and $27,446 for women, a difference of 28.5%. Men with an educational attainment of bachelor's degree enjoy the highest average annual earnings of $60,982, while those with high school diploma education earn the least with $34,375. Women with an educational attainment of college or associate's degree earn the most with the average annual earnings of $27,661, while those with less than high school education have the smallest earnings of $21,625.
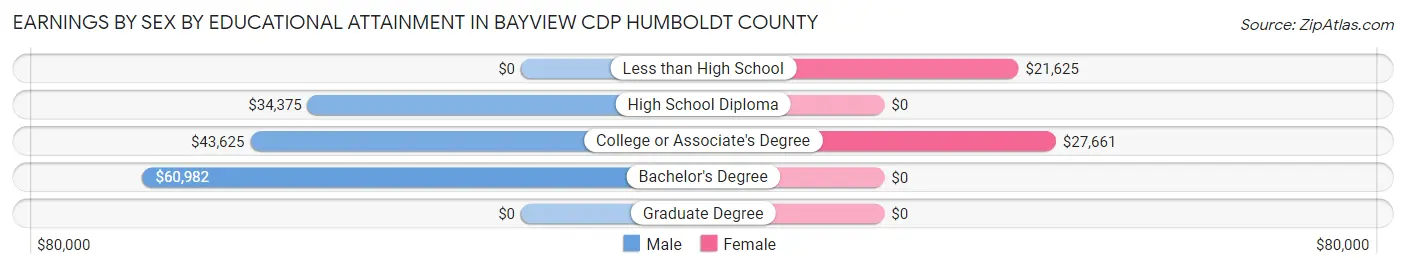
| Educational Attainment | Male Income | Female Income |
| Less than High School | - | - |
| High School Diploma | $34,375 | $0 |
| College or Associate's Degree | $43,625 | $27,661 |
| Bachelor's Degree | $60,982 | $0 |
| Graduate Degree | - | - |
| Total | $38,409 | $27,446 |
Family Income in Bayview CDP Humboldt County
Family Income Brackets in Bayview CDP Humboldt County
According to the Bayview CDP Humboldt County family income data, there are 140 families falling into the $10,000 to $14,999 income range, which is the most common income bracket and makes up 20.7% of all families. Conversely, the less than $10,000 income bracket is the least frequent group with only 21 families (3.1%) belonging to this category.
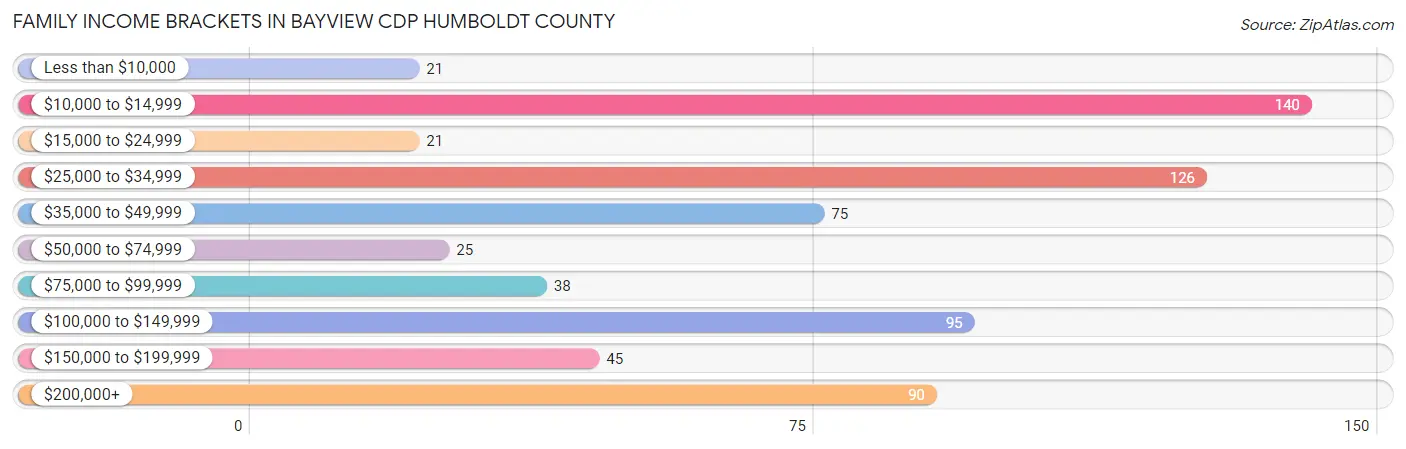
| Income Bracket | # Families | % Families |
| Less than $10,000 | 21 | 3.1% |
| $10,000 to $14,999 | 140 | 20.7% |
| $15,000 to $24,999 | 21 | 3.1% |
| $25,000 to $34,999 | 126 | 18.6% |
| $35,000 to $49,999 | 75 | 11.1% |
| $50,000 to $74,999 | 25 | 3.7% |
| $75,000 to $99,999 | 38 | 5.6% |
| $100,000 to $149,999 | 95 | 14.1% |
| $150,000 to $199,999 | 45 | 6.7% |
| $200,000+ | 90 | 13.3% |
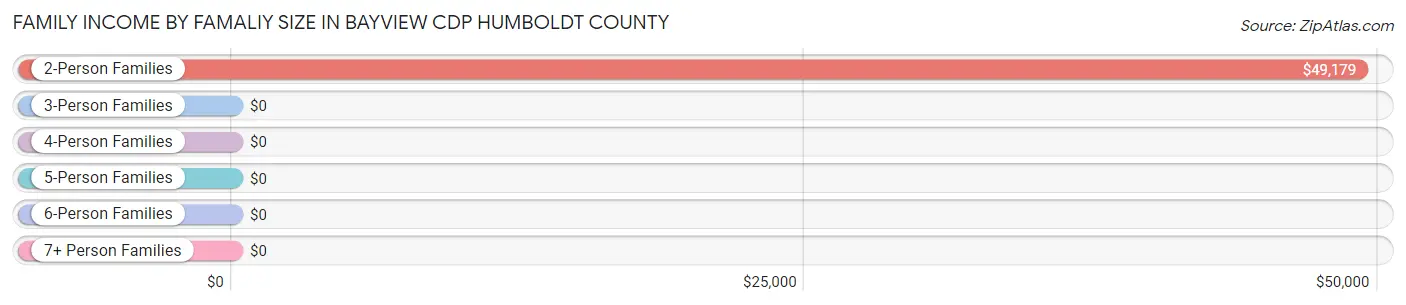
Family Income by Famaliy Size in Bayview CDP Humboldt County
2-person families (279 | 41.3%) account for the highest median family income in Bayview CDP Humboldt County with $49,179 per family, while 2-person families (279 | 41.3%) have the highest median income of $24,590 per family member.
| Income Bracket | # Families | Median Income |
| 2-Person Families | 279 (41.3%) | $49,179 |
| 3-Person Families | 166 (24.6%) | $0 |
| 4-Person Families | 211 (31.2%) | $0 |
| 5-Person Families | 20 (3.0%) | $0 |
| 6-Person Families | 0 (0.0%) | $0 |
| 7+ Person Families | 0 (0.0%) | $0 |
| Total | 676 (100.0%) | $44,375 |
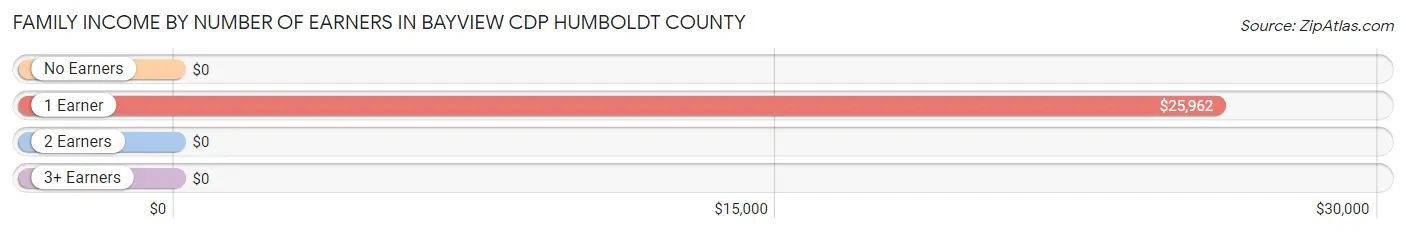
Family Income by Number of Earners in Bayview CDP Humboldt County
| Number of Earners | # Families | Median Income |
| No Earners | 79 (11.7%) | $0 |
| 1 Earner | 318 (47.0%) | $25,962 |
| 2 Earners | 257 (38.0%) | $0 |
| 3+ Earners | 22 (3.3%) | $0 |
| Total | 676 (100.0%) | $44,375 |
Household Income in Bayview CDP Humboldt County
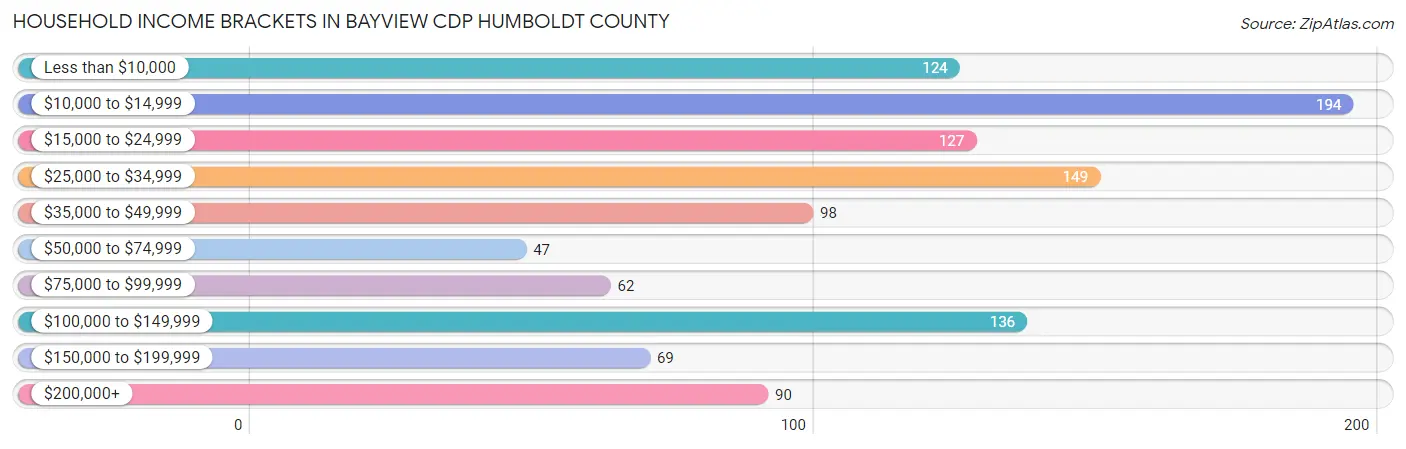
Household Income Brackets in Bayview CDP Humboldt County
With 194 households falling in the category, the $10,000 to $14,999 income range is the most frequent in Bayview CDP Humboldt County, accounting for 17.7% of all households. In contrast, only 47 households (4.3%) fall into the $50,000 to $74,999 income bracket, making it the least populous group.
| Income Bracket | # Households | % Households |
| Less than $10,000 | 124 | 11.3% |
| $10,000 to $14,999 | 194 | 17.7% |
| $15,000 to $24,999 | 127 | 11.6% |
| $25,000 to $34,999 | 149 | 13.6% |
| $35,000 to $49,999 | 98 | 8.9% |
| $50,000 to $74,999 | 47 | 4.3% |
| $75,000 to $99,999 | 62 | 5.7% |
| $100,000 to $149,999 | 136 | 12.4% |
| $150,000 to $199,999 | 69 | 6.3% |
| $200,000+ | 90 | 8.2% |
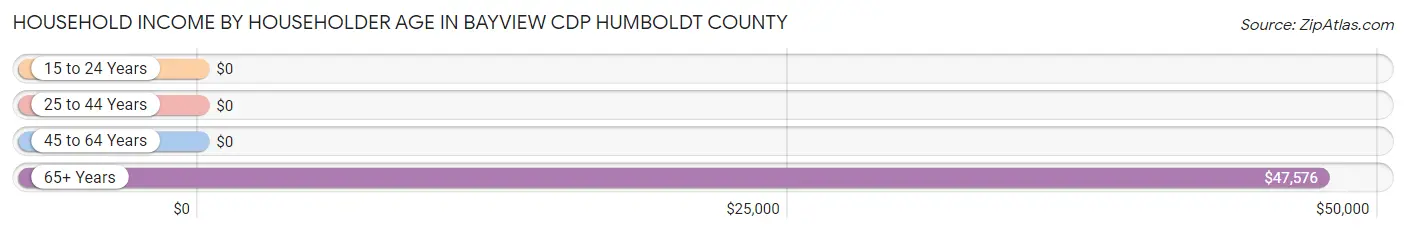
Household Income by Householder Age in Bayview CDP Humboldt County
The median household income in Bayview CDP Humboldt County is $32,553, with the highest median household income of $47,576 found in the 65+ years age bracket for the primary householder. A total of 284 households (25.9%) fall into this category. Meanwhile, the 15 to 24 years age bracket for the primary householder has the lowest median household income of $0, with 69 households (6.3%) in this group.
| Income Bracket | # Households | Median Income |
| 15 to 24 Years | 69 (6.3%) | $0 |
| 25 to 44 Years | 288 (26.3%) | $0 |
| 45 to 64 Years | 455 (41.5%) | $0 |
| 65+ Years | 284 (25.9%) | $47,576 |
| Total | 1,096 (100.0%) | $32,553 |
Poverty in Bayview CDP Humboldt County
Income Below Poverty by Sex and Age in Bayview CDP Humboldt County
With 31.7% poverty level for males and 38.7% for females among the residents of Bayview CDP Humboldt County, 18 to 24 year old males and 5 year old females are the most vulnerable to poverty, with 16 males (100.0%) and 35 females (100.0%) in their respective age groups living below the poverty level.
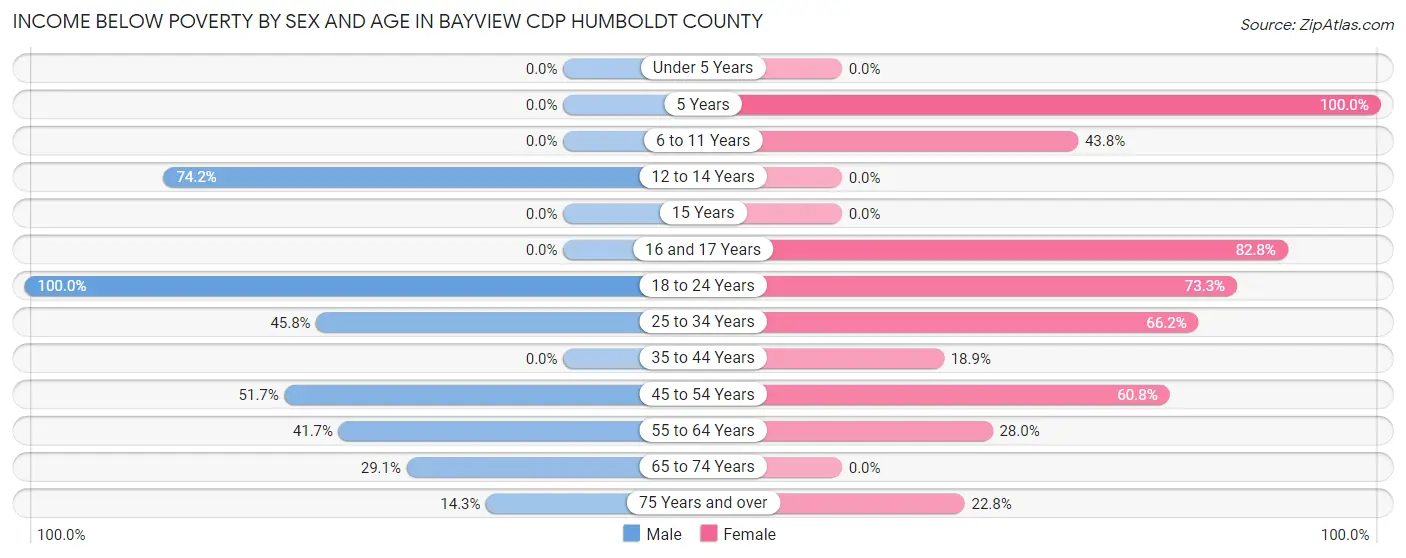
| Age Bracket | Male | Female |
| Under 5 Years | 0 (0.0%) | 0 (0.0%) |
| 5 Years | 0 (0.0%) | 35 (100.0%) |
| 6 to 11 Years | 0 (0.0%) | 32 (43.8%) |
| 12 to 14 Years | 95 (74.2%) | 0 (0.0%) |
| 15 Years | 0 (0.0%) | 0 (0.0%) |
| 16 and 17 Years | 0 (0.0%) | 96 (82.8%) |
| 18 to 24 Years | 16 (100.0%) | 99 (73.3%) |
| 25 to 34 Years | 66 (45.8%) | 98 (66.2%) |
| 35 to 44 Years | 0 (0.0%) | 42 (18.9%) |
| 45 to 54 Years | 119 (51.7%) | 104 (60.8%) |
| 55 to 64 Years | 55 (41.7%) | 33 (28.0%) |
| 65 to 74 Years | 34 (29.1%) | 0 (0.0%) |
| 75 Years and over | 10 (14.3%) | 31 (22.8%) |
| Total | 395 (31.7%) | 570 (38.7%) |
Income Above Poverty by Sex and Age in Bayview CDP Humboldt County
According to the poverty statistics in Bayview CDP Humboldt County, males aged under 5 years and females aged under 5 years are the age groups that are most secure financially, with 100.0% of males and 100.0% of females in these age groups living above the poverty line.
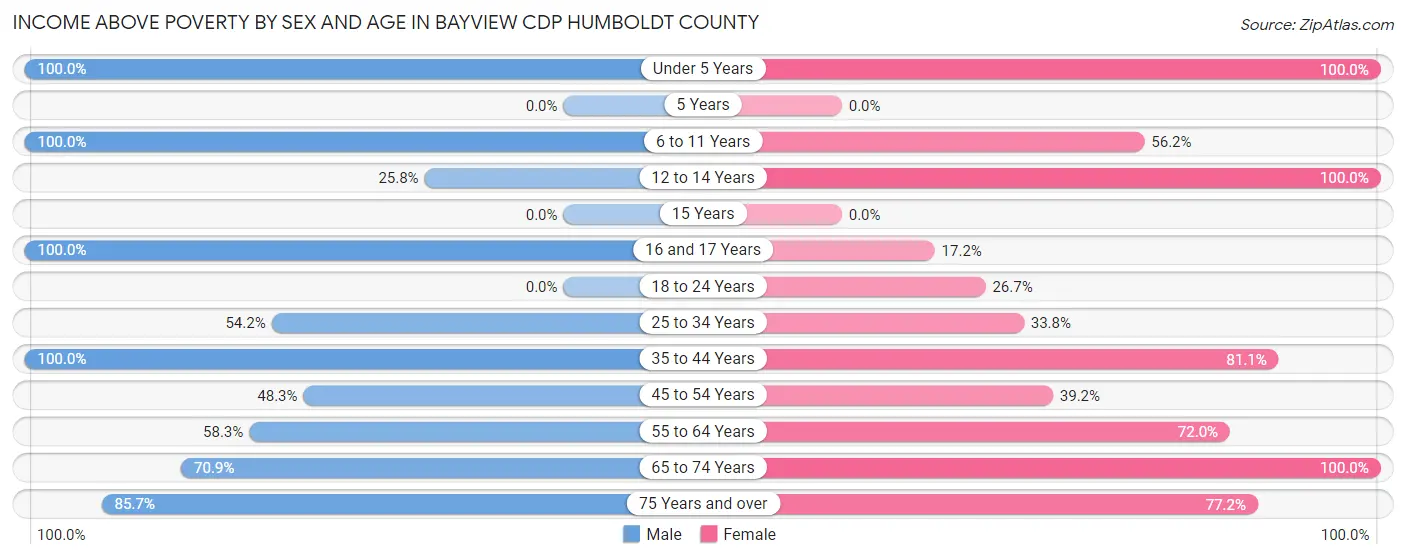
| Age Bracket | Male | Female |
| Under 5 Years | 103 (100.0%) | 112 (100.0%) |
| 5 Years | 0 (0.0%) | 0 (0.0%) |
| 6 to 11 Years | 77 (100.0%) | 41 (56.2%) |
| 12 to 14 Years | 33 (25.8%) | 34 (100.0%) |
| 15 Years | 0 (0.0%) | 0 (0.0%) |
| 16 and 17 Years | 67 (100.0%) | 20 (17.2%) |
| 18 to 24 Years | 0 (0.0%) | 36 (26.7%) |
| 25 to 34 Years | 78 (54.2%) | 50 (33.8%) |
| 35 to 44 Years | 163 (100.0%) | 180 (81.1%) |
| 45 to 54 Years | 111 (48.3%) | 67 (39.2%) |
| 55 to 64 Years | 77 (58.3%) | 85 (72.0%) |
| 65 to 74 Years | 83 (70.9%) | 172 (100.0%) |
| 75 Years and over | 60 (85.7%) | 105 (77.2%) |
| Total | 852 (68.3%) | 902 (61.3%) |
Income Below Poverty Among Married-Couple Families in Bayview CDP Humboldt County
The poverty statistics for married-couple families in Bayview CDP Humboldt County show that 26.0% or 116 of the total 447 families live below the poverty line. Families with 1 or 2 children have the highest poverty rate of 39.7%, comprising of 94 families. On the other hand, families with no children have the lowest poverty rate of 10.5%, which includes 22 families.
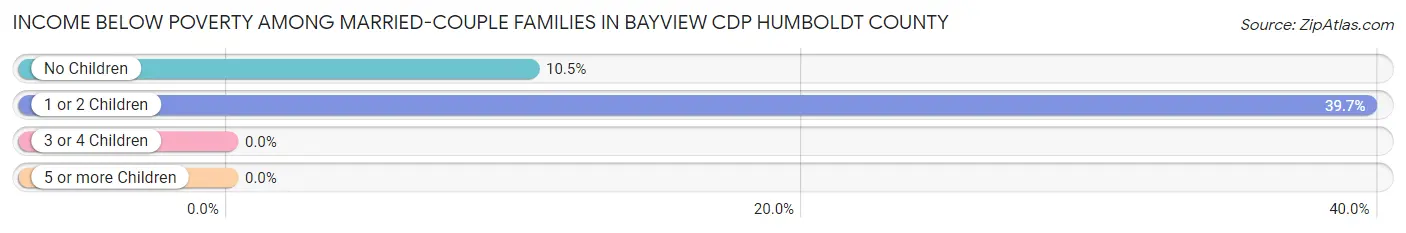
| Children | Above Poverty | Below Poverty |
| No Children | 188 (89.5%) | 22 (10.5%) |
| 1 or 2 Children | 143 (60.3%) | 94 (39.7%) |
| 3 or 4 Children | 0 (0.0%) | 0 (0.0%) |
| 5 or more Children | 0 (0.0%) | 0 (0.0%) |
| Total | 331 (74.1%) | 116 (26.0%) |
Income Below Poverty Among Single-Parent Households in Bayview CDP Humboldt County
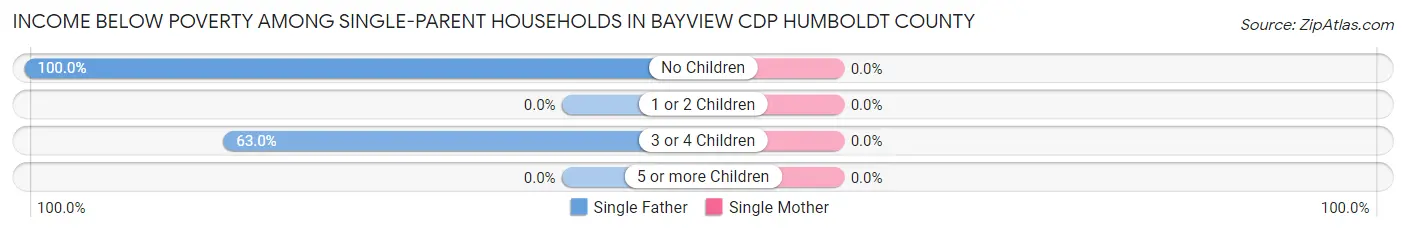
| Children | Single Father | Single Mother |
| No Children | 32 (100.0%) | 0 (0.0%) |
| 1 or 2 Children | 0 (0.0%) | 0 (0.0%) |
| 3 or 4 Children | 34 (63.0%) | 0 (0.0%) |
| 5 or more Children | 0 (0.0%) | 0 (0.0%) |
| Total | 66 (56.4%) | 0 (0.0%) |
Income Below Poverty Among Married-Couple vs Single-Parent Households in Bayview CDP Humboldt County
The poverty data for Bayview CDP Humboldt County shows that 116 of the married-couple family households (26.0%) and 66 of the single-parent households (28.8%) are living below the poverty level. Within the married-couple family households, those with 1 or 2 children have the highest poverty rate, with 94 households (39.7%) falling below the poverty line. Among the single-parent households, those with 3 or 4 children have the highest poverty rate, with 34 household (63.0%) living below poverty.
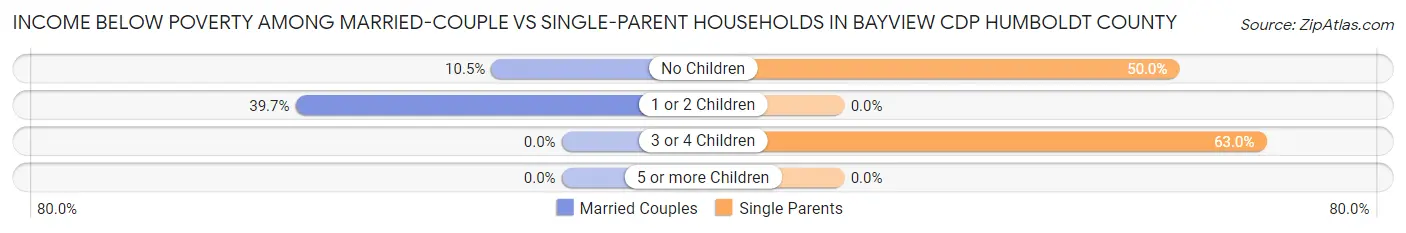
| Children | Married-Couple Families | Single-Parent Households |
| No Children | 22 (10.5%) | 32 (50.0%) |
| 1 or 2 Children | 94 (39.7%) | 0 (0.0%) |
| 3 or 4 Children | 0 (0.0%) | 34 (63.0%) |
| 5 or more Children | 0 (0.0%) | 0 (0.0%) |
| Total | 116 (26.0%) | 66 (28.8%) |
Race in Bayview CDP Humboldt County
The most populous races in Bayview CDP Humboldt County are White / Caucasian (2,176 | 80.0%), Hispanic or Latino (257 | 9.5%), and Asian (180 | 6.6%).
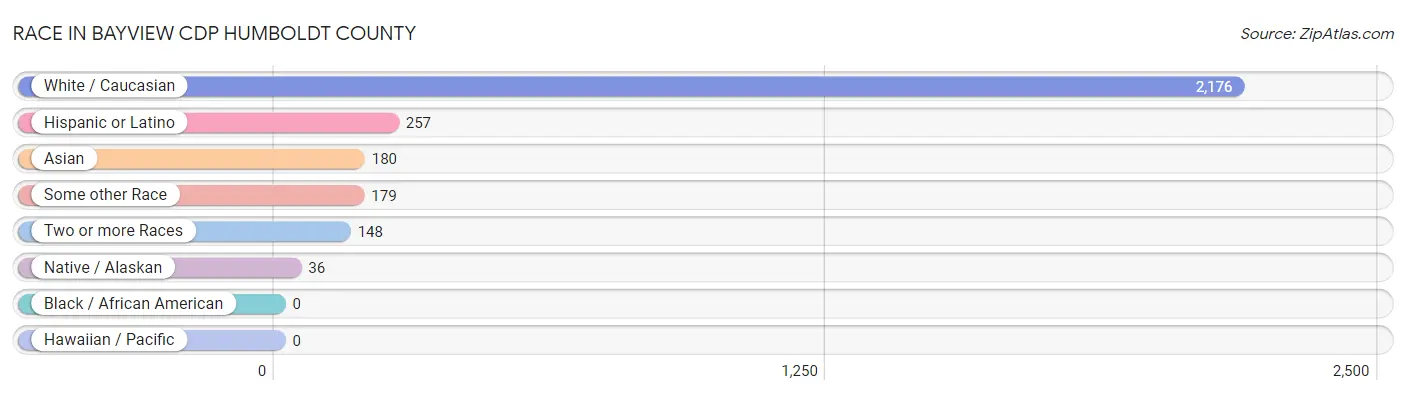
| Race | # Population | % Population |
| Asian | 180 | 6.6% |
| Black / African American | 0 | 0.0% |
| Hawaiian / Pacific | 0 | 0.0% |
| Hispanic or Latino | 257 | 9.5% |
| Native / Alaskan | 36 | 1.3% |
| White / Caucasian | 2,176 | 80.0% |
| Two or more Races | 148 | 5.4% |
| Some other Race | 179 | 6.6% |
| Total | 2,719 | 100.0% |
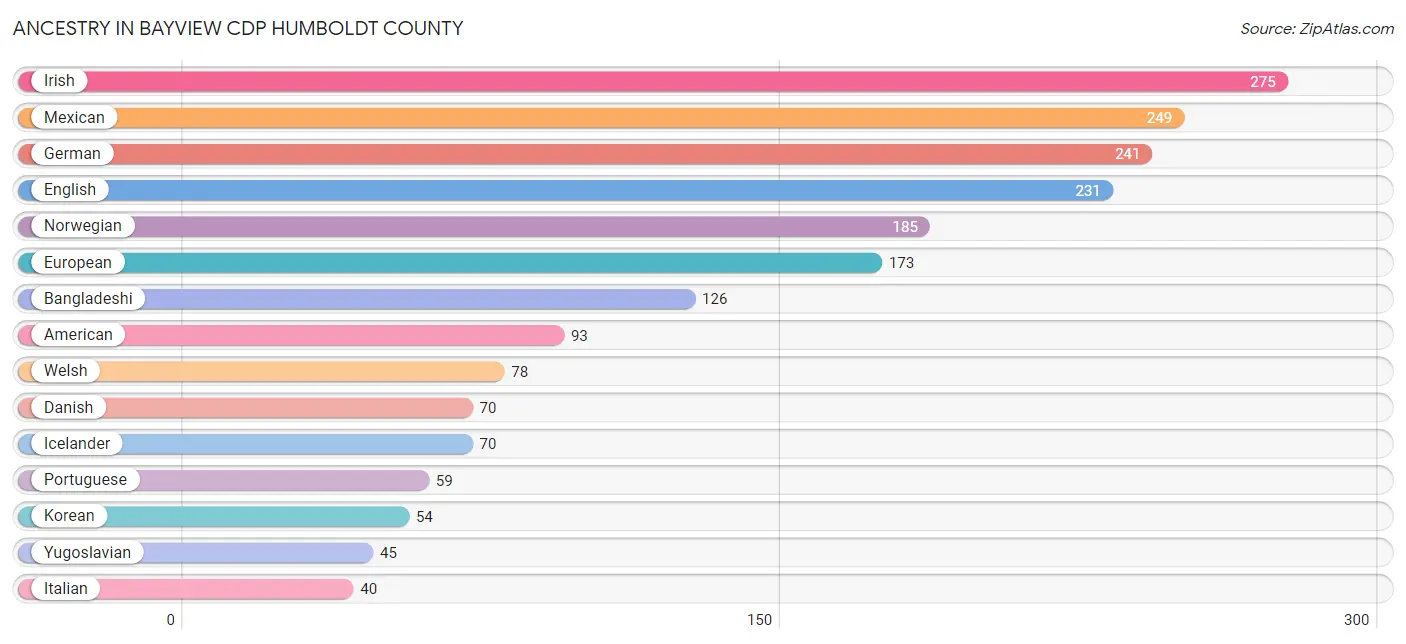
Ancestry in Bayview CDP Humboldt County
The most populous ancestries reported in Bayview CDP Humboldt County are Irish (275 | 10.1%), Mexican (249 | 9.2%), German (241 | 8.9%), English (231 | 8.5%), and Norwegian (185 | 6.8%), together accounting for 43.4% of all Bayview CDP Humboldt County residents.
| Ancestry | # Population | % Population |
| American | 93 | 3.4% |
| Austrian | 22 | 0.8% |
| Bangladeshi | 126 | 4.6% |
| British | 12 | 0.4% |
| Choctaw | 7 | 0.3% |
| Danish | 70 | 2.6% |
| Dutch | 9 | 0.3% |
| English | 231 | 8.5% |
| European | 173 | 6.4% |
| Finnish | 17 | 0.6% |
| French | 37 | 1.4% |
| French Canadian | 33 | 1.2% |
| German | 241 | 8.9% |
| Icelander | 70 | 2.6% |
| Irish | 275 | 10.1% |
| Italian | 40 | 1.5% |
| Korean | 54 | 2.0% |
| Mexican | 249 | 9.2% |
| Norwegian | 185 | 6.8% |
| Portuguese | 59 | 2.2% |
| Russian | 14 | 0.5% |
| Scotch-Irish | 12 | 0.4% |
| Scottish | 31 | 1.1% |
| Spanish | 8 | 0.3% |
| Swedish | 12 | 0.4% |
| Welsh | 78 | 2.9% |
| Yugoslavian | 45 | 1.7% | View All 27 Rows |
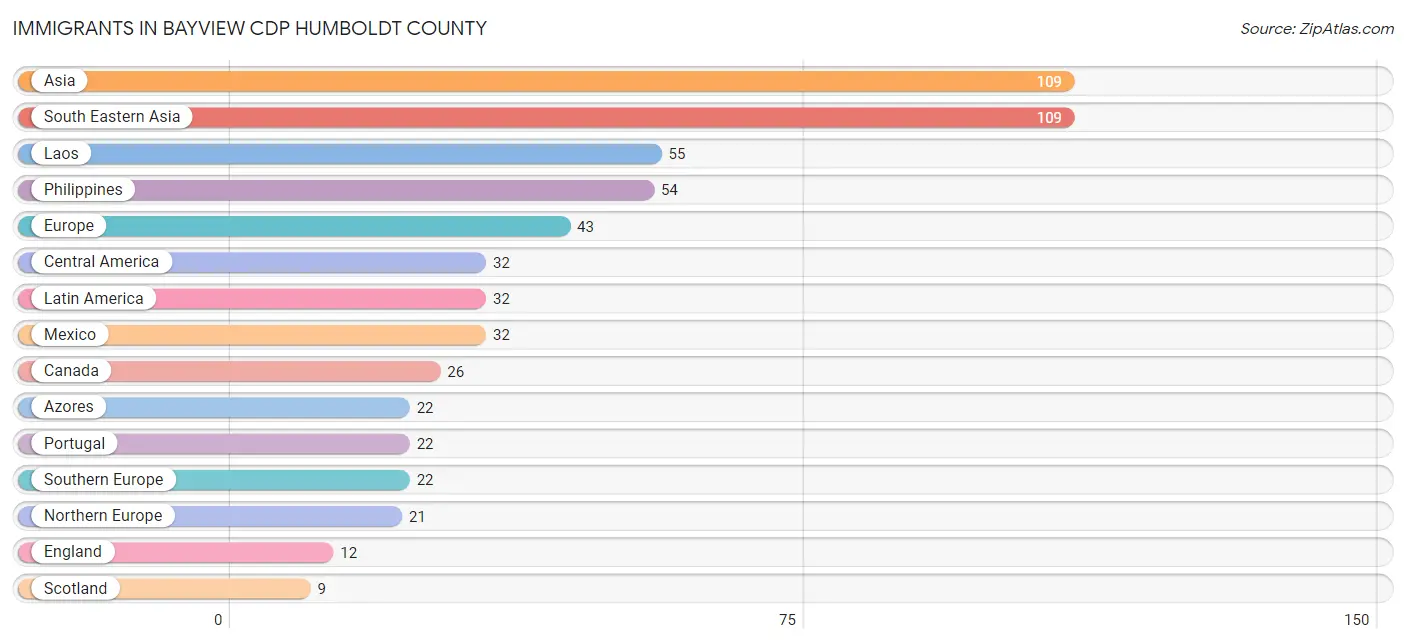
Immigrants in Bayview CDP Humboldt County
The most numerous immigrant groups reported in Bayview CDP Humboldt County came from Asia (109 | 4.0%), South Eastern Asia (109 | 4.0%), Laos (55 | 2.0%), Philippines (54 | 2.0%), and Europe (43 | 1.6%), together accounting for 13.6% of all Bayview CDP Humboldt County residents.
| Immigration Origin | # Population | % Population |
| Asia | 109 | 4.0% |
| Azores | 22 | 0.8% |
| Canada | 26 | 1.0% |
| Central America | 32 | 1.2% |
| England | 12 | 0.4% |
| Europe | 43 | 1.6% |
| Laos | 55 | 2.0% |
| Latin America | 32 | 1.2% |
| Mexico | 32 | 1.2% |
| Northern Europe | 21 | 0.8% |
| Philippines | 54 | 2.0% |
| Portugal | 22 | 0.8% |
| Scotland | 9 | 0.3% |
| South Eastern Asia | 109 | 4.0% |
| Southern Europe | 22 | 0.8% | View All 15 Rows |
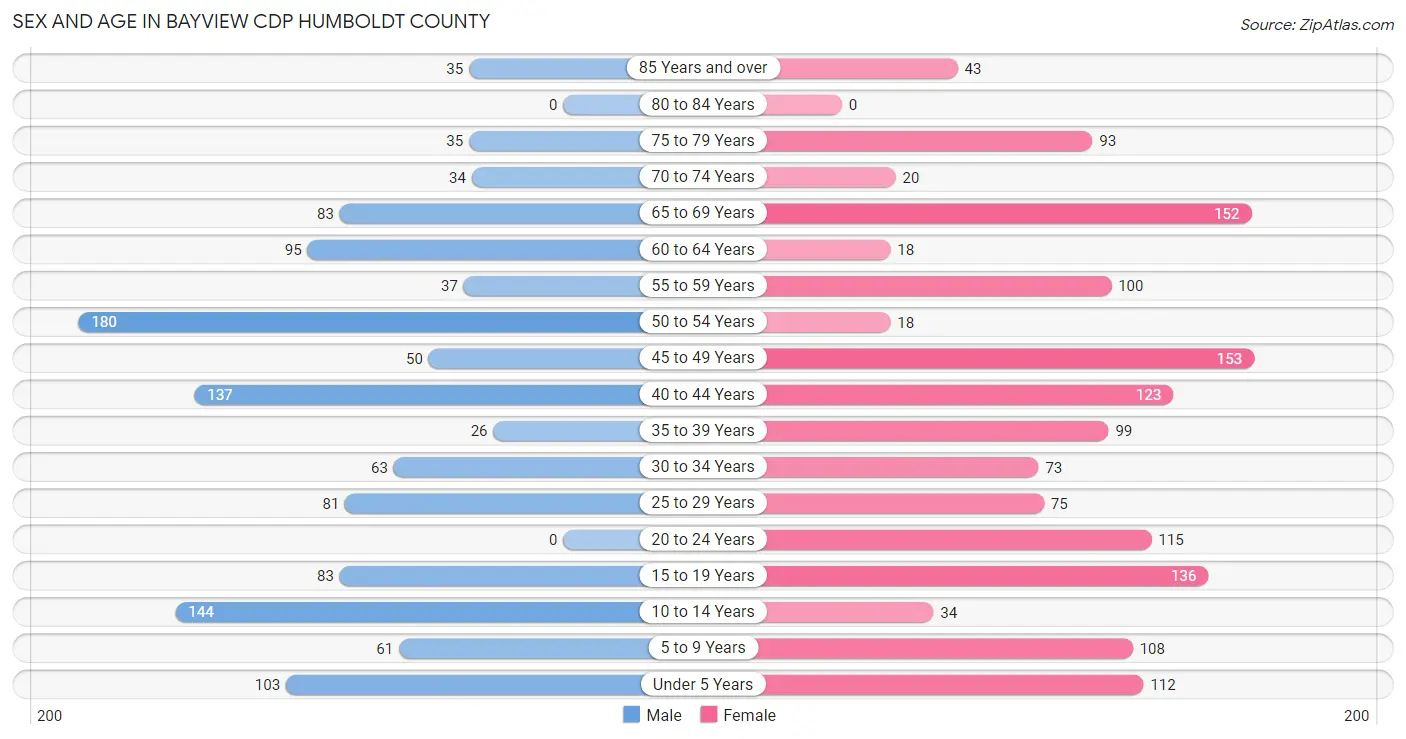
Sex and Age in Bayview CDP Humboldt County
Sex and Age in Bayview CDP Humboldt County
The most populous age groups in Bayview CDP Humboldt County are 50 to 54 Years (180 | 14.4%) for men and 45 to 49 Years (153 | 10.4%) for women.
| Age Bracket | Male | Female |
| Under 5 Years | 103 (8.3%) | 112 (7.6%) |
| 5 to 9 Years | 61 (4.9%) | 108 (7.3%) |
| 10 to 14 Years | 144 (11.6%) | 34 (2.3%) |
| 15 to 19 Years | 83 (6.7%) | 136 (9.2%) |
| 20 to 24 Years | 0 (0.0%) | 115 (7.8%) |
| 25 to 29 Years | 81 (6.5%) | 75 (5.1%) |
| 30 to 34 Years | 63 (5.1%) | 73 (5.0%) |
| 35 to 39 Years | 26 (2.1%) | 99 (6.7%) |
| 40 to 44 Years | 137 (11.0%) | 123 (8.4%) |
| 45 to 49 Years | 50 (4.0%) | 153 (10.4%) |
| 50 to 54 Years | 180 (14.4%) | 18 (1.2%) |
| 55 to 59 Years | 37 (3.0%) | 100 (6.8%) |
| 60 to 64 Years | 95 (7.6%) | 18 (1.2%) |
| 65 to 69 Years | 83 (6.7%) | 152 (10.3%) |
| 70 to 74 Years | 34 (2.7%) | 20 (1.4%) |
| 75 to 79 Years | 35 (2.8%) | 93 (6.3%) |
| 80 to 84 Years | 0 (0.0%) | 0 (0.0%) |
| 85 Years and over | 35 (2.8%) | 43 (2.9%) |
| Total | 1,247 (100.0%) | 1,472 (100.0%) |
Families and Households in Bayview CDP Humboldt County
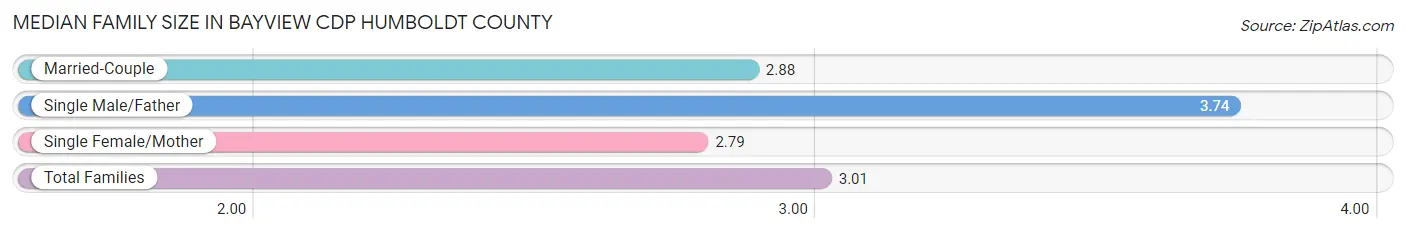
Median Family Size in Bayview CDP Humboldt County
The median family size in Bayview CDP Humboldt County is 3.01 persons per family, with single male/father families (117 | 17.3%) accounting for the largest median family size of 3.74 persons per family. On the other hand, single female/mother families (112 | 16.6%) represent the smallest median family size with 2.79 persons per family.
| Family Type | # Families | Family Size |
| Married-Couple | 447 (66.1%) | 2.88 |
| Single Male/Father | 117 (17.3%) | 3.74 |
| Single Female/Mother | 112 (16.6%) | 2.79 |
| Total Families | 676 (100.0%) | 3.01 |
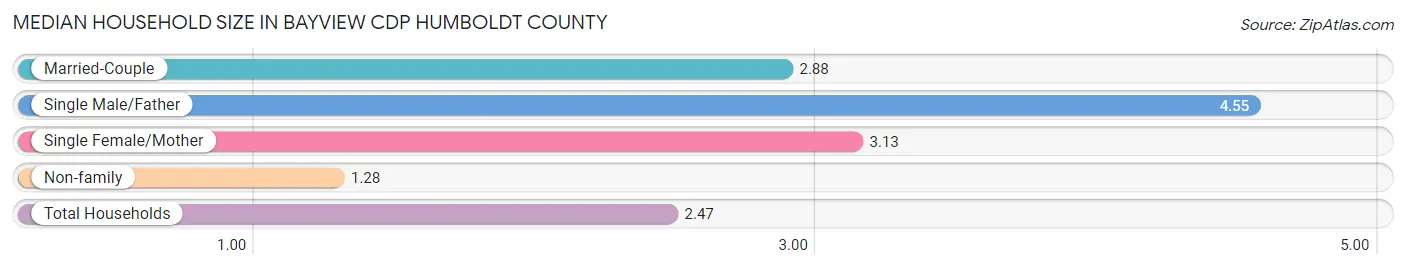
Median Household Size in Bayview CDP Humboldt County
The median household size in Bayview CDP Humboldt County is 2.47 persons per household, with single male/father households (117 | 10.7%) accounting for the largest median household size of 4.55 persons per household. non-family households (420 | 38.3%) represent the smallest median household size with 1.28 persons per household.
| Household Type | # Households | Household Size |
| Married-Couple | 447 (40.8%) | 2.88 |
| Single Male/Father | 117 (10.7%) | 4.55 |
| Single Female/Mother | 112 (10.2%) | 3.13 |
| Non-family | 420 (38.3%) | 1.28 |
| Total Households | 1,096 (100.0%) | 2.47 |
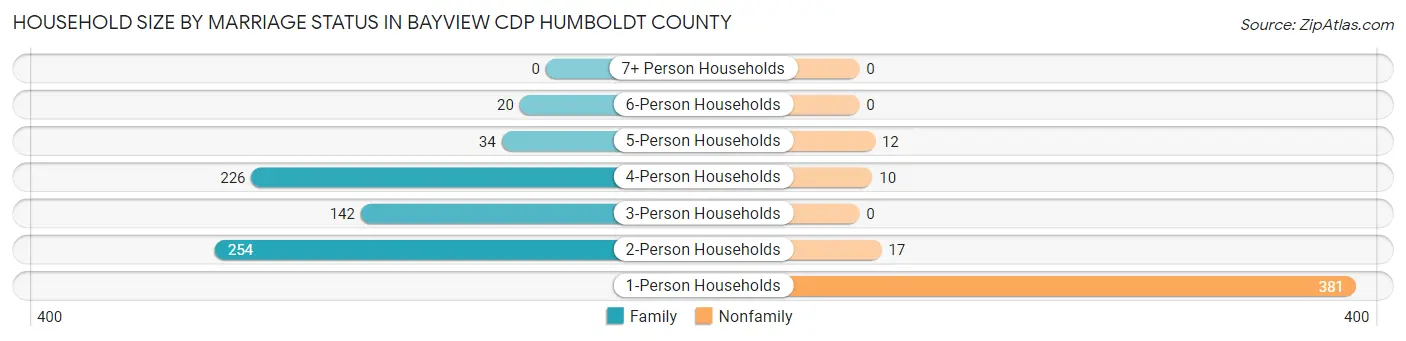
Household Size by Marriage Status in Bayview CDP Humboldt County
Out of a total of 1,096 households in Bayview CDP Humboldt County, 676 (61.7%) are family households, while 420 (38.3%) are nonfamily households. The most numerous type of family households are 2-person households, comprising 254, and the most common type of nonfamily households are 1-person households, comprising 381.
| Household Size | Family Households | Nonfamily Households |
| 1-Person Households | - | 381 (34.8%) |
| 2-Person Households | 254 (23.2%) | 17 (1.5%) |
| 3-Person Households | 142 (13.0%) | 0 (0.0%) |
| 4-Person Households | 226 (20.6%) | 10 (0.9%) |
| 5-Person Households | 34 (3.1%) | 12 (1.1%) |
| 6-Person Households | 20 (1.8%) | 0 (0.0%) |
| 7+ Person Households | 0 (0.0%) | 0 (0.0%) |
| Total | 676 (61.7%) | 420 (38.3%) |
Female Fertility in Bayview CDP Humboldt County
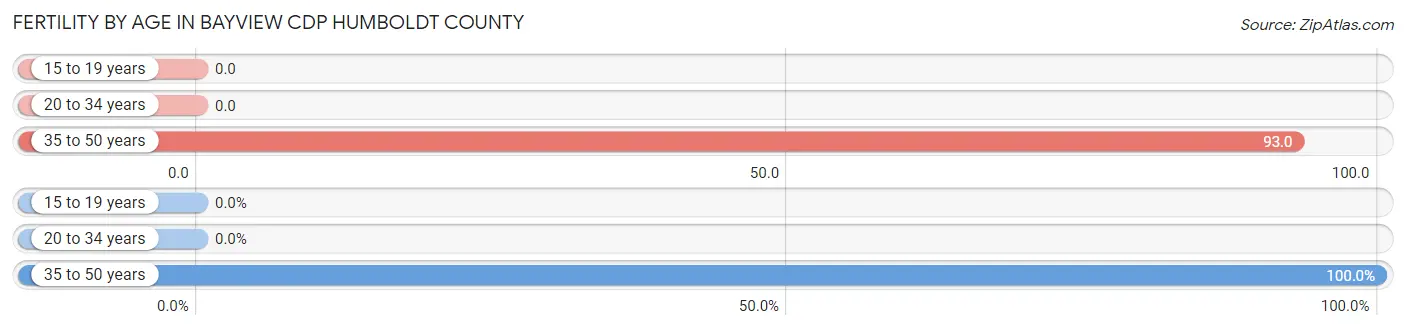
Fertility by Age in Bayview CDP Humboldt County
Average fertility rate in Bayview CDP Humboldt County is 45.0 births per 1,000 women. Women in the age bracket of 35 to 50 years have the highest fertility rate with 93.0 births per 1,000 women. Women in the age bracket of 35 to 50 years acount for 100.0% of all women with births.
| Age Bracket | Women with Births | Births / 1,000 Women |
| 15 to 19 years | 0 (0.0%) | 0.0 |
| 20 to 34 years | 0 (0.0%) | 0.0 |
| 35 to 50 years | 35 (100.0%) | 93.0 |
| Total | 35 (100.0%) | 45.0 |
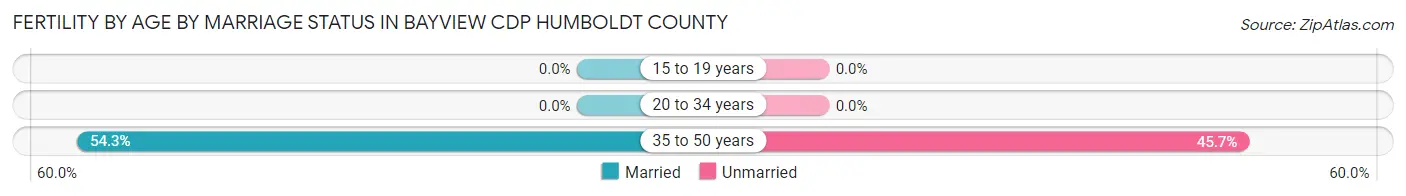
Fertility by Age by Marriage Status in Bayview CDP Humboldt County
54.3% of women with births (35) in Bayview CDP Humboldt County are married. The highest percentage of unmarried women with births falls into 35 to 50 years age bracket with 45.7% of them unmarried at the time of birth, while the lowest percentage of unmarried women with births belong to 35 to 50 years age bracket with 45.7% of them unmarried.
| Age Bracket | Married | Unmarried |
| 15 to 19 years | 0 (0.0%) | 0 (0.0%) |
| 20 to 34 years | 0 (0.0%) | 0 (0.0%) |
| 35 to 50 years | 19 (54.3%) | 16 (45.7%) |
| Total | 19 (54.3%) | 16 (45.7%) |
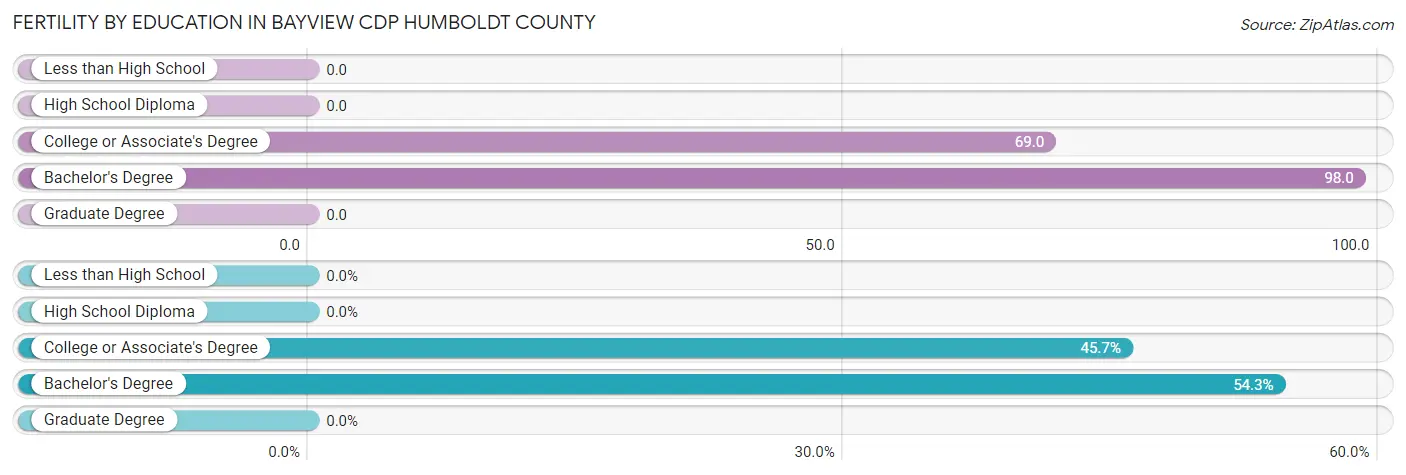
Fertility by Education in Bayview CDP Humboldt County
| Educational Attainment | Women with Births | Births / 1,000 Women |
| Less than High School | 0 (0.0%) | 0.0 |
| High School Diploma | 0 (0.0%) | 0.0 |
| College or Associate's Degree | 16 (45.7%) | 69.0 |
| Bachelor's Degree | 19 (54.3%) | 98.0 |
| Graduate Degree | 0 (0.0%) | 0.0 |
| Total | 35 (100.0%) | 45.0 |
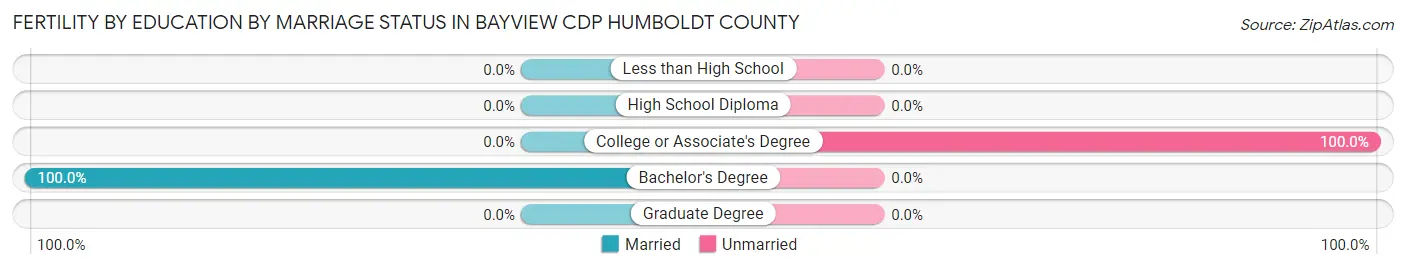
Fertility by Education by Marriage Status in Bayview CDP Humboldt County
45.7% of women with births in Bayview CDP Humboldt County are unmarried. Women with the educational attainment of bachelor's degree are most likely to be married with 100.0% of them married at childbirth, while women with the educational attainment of college or associate's degree are least likely to be married with 100.0% of them unmarried at childbirth.
| Educational Attainment | Married | Unmarried |
| Less than High School | 0 (0.0%) | 0 (0.0%) |
| High School Diploma | 0 (0.0%) | 0 (0.0%) |
| College or Associate's Degree | 0 (0.0%) | 16 (100.0%) |
| Bachelor's Degree | 19 (100.0%) | 0 (0.0%) |
| Graduate Degree | 0 (0.0%) | 0 (0.0%) |
| Total | 19 (54.3%) | 16 (45.7%) |
Employment Characteristics in Bayview CDP Humboldt County
Employment by Class of Employer in Bayview CDP Humboldt County
Among the 1,039 employed individuals in Bayview CDP Humboldt County, private company employees (638 | 61.4%), self-employed (not incorporated) (125 | 12.0%), and local government employees (112 | 10.8%) make up the most common classes of employment.
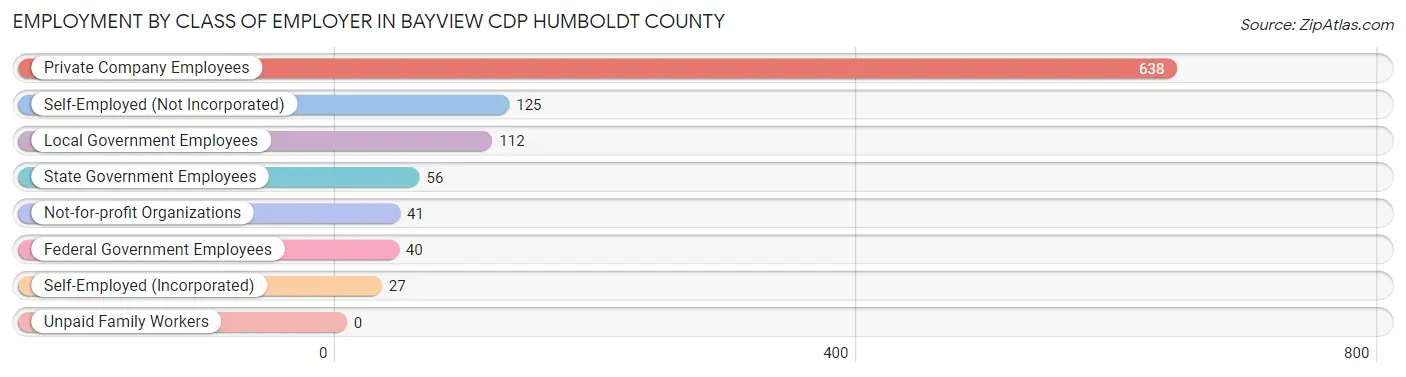
| Employer Class | # Employees | % Employees |
| Private Company Employees | 638 | 61.4% |
| Self-Employed (Incorporated) | 27 | 2.6% |
| Self-Employed (Not Incorporated) | 125 | 12.0% |
| Not-for-profit Organizations | 41 | 4.0% |
| Local Government Employees | 112 | 10.8% |
| State Government Employees | 56 | 5.4% |
| Federal Government Employees | 40 | 3.8% |
| Unpaid Family Workers | 0 | 0.0% |
| Total | 1,039 | 100.0% |
Employment Status by Age in Bayview CDP Humboldt County
According to the labor force statistics for Bayview CDP Humboldt County, out of the total population over 16 years of age (2,157), 57.8% or 1,247 individuals are in the labor force, with 9.7% or 121 of them unemployed. The age group with the highest labor force participation rate is 35 to 44 years, with 91.7% or 353 individuals in the labor force. Within the labor force, the 25 to 29 years age range has the highest percentage of unemployed individuals, with 68.8% or 77 of them being unemployed.
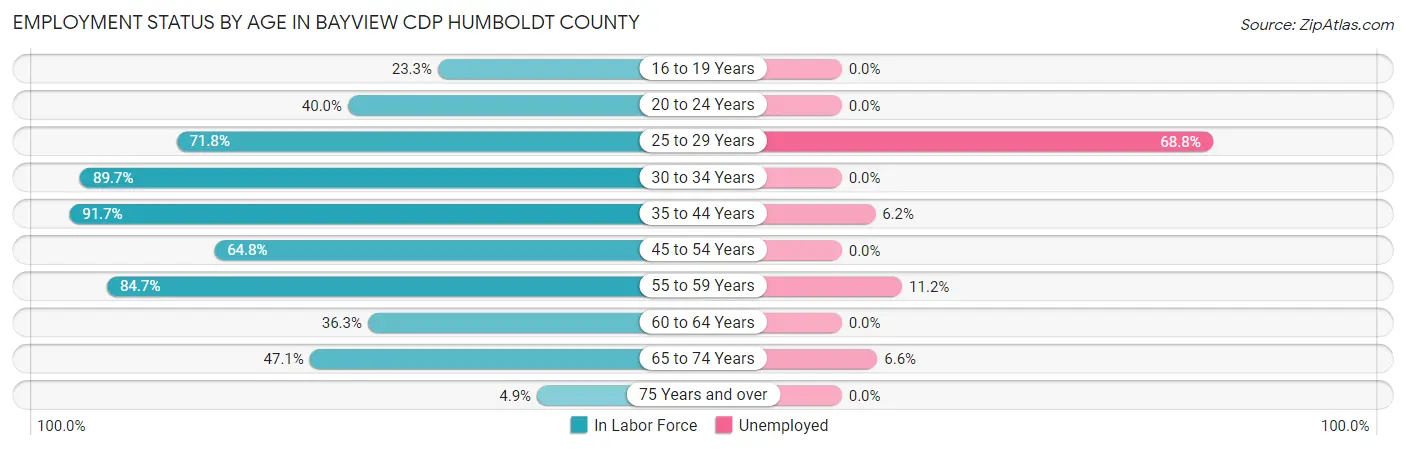
| Age Bracket | In Labor Force | Unemployed |
| 16 to 19 Years | 51 (23.3%) | 0 (0.0%) |
| 20 to 24 Years | 46 (40.0%) | 0 (0.0%) |
| 25 to 29 Years | 112 (71.8%) | 77 (68.8%) |
| 30 to 34 Years | 122 (89.7%) | 0 (0.0%) |
| 35 to 44 Years | 353 (91.7%) | 22 (6.2%) |
| 45 to 54 Years | 260 (64.8%) | 0 (0.0%) |
| 55 to 59 Years | 116 (84.7%) | 13 (11.2%) |
| 60 to 64 Years | 41 (36.3%) | 0 (0.0%) |
| 65 to 74 Years | 136 (47.1%) | 9 (6.6%) |
| 75 Years and over | 10 (4.9%) | 0 (0.0%) |
| Total | 1,247 (57.8%) | 121 (9.7%) |
Employment Status by Educational Attainment in Bayview CDP Humboldt County
According to labor force statistics for Bayview CDP Humboldt County, 75.6% of individuals (1,004) out of the total population between 25 and 64 years of age (1,328) are in the labor force, with 11.2% or 112 of them being unemployed. The group with the highest labor force participation rate are those with the educational attainment of bachelor's degree or higher, with 89.3% or 292 individuals in the labor force. Within the labor force, individuals with bachelor's degree or higher education have the highest percentage of unemployment, with 18.2% or 53 of them being unemployed.
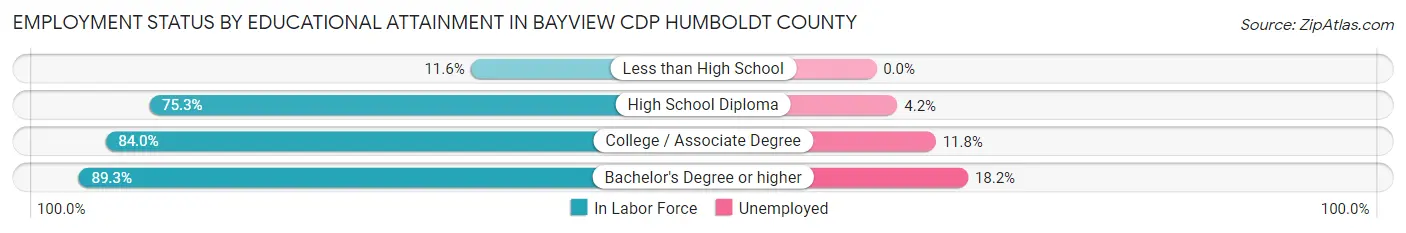
| Educational Attainment | In Labor Force | Unemployed |
| Less than High School | 15 (11.6%) | 0 (0.0%) |
| High School Diploma | 308 (75.3%) | 17 (4.2%) |
| College / Associate Degree | 389 (84.0%) | 55 (11.8%) |
| Bachelor's Degree or higher | 292 (89.3%) | 60 (18.2%) |
| Total | 1,004 (75.6%) | 149 (11.2%) |
Employment Occupations by Sex in Bayview CDP Humboldt County
Management, Business, Science and Arts Occupations
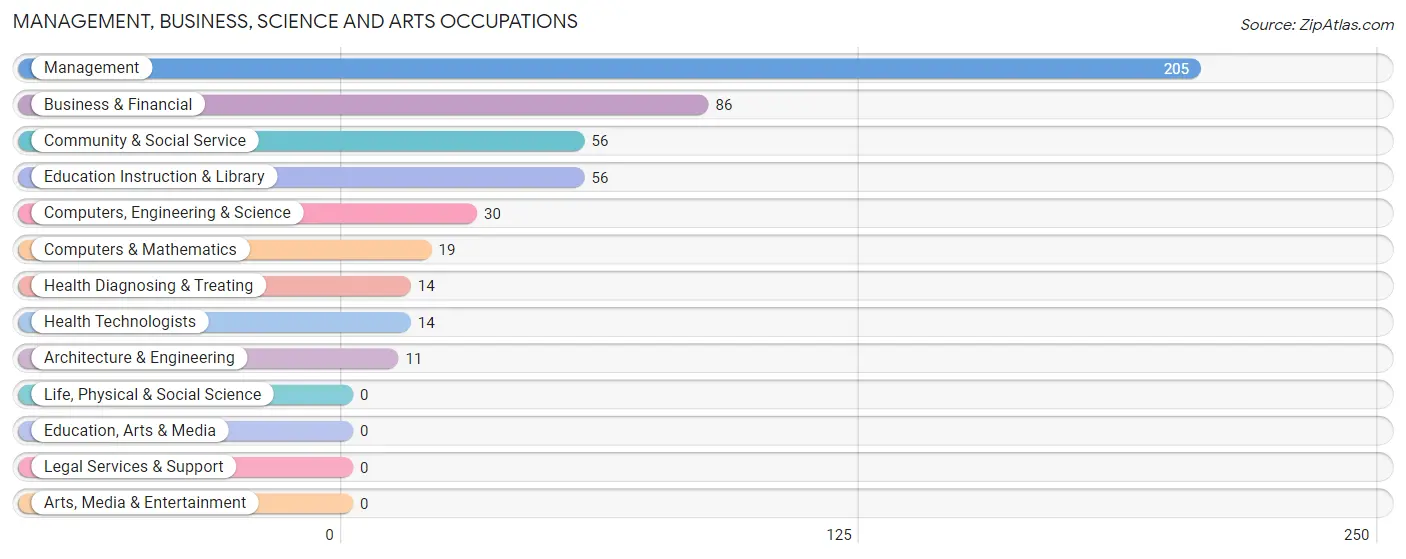
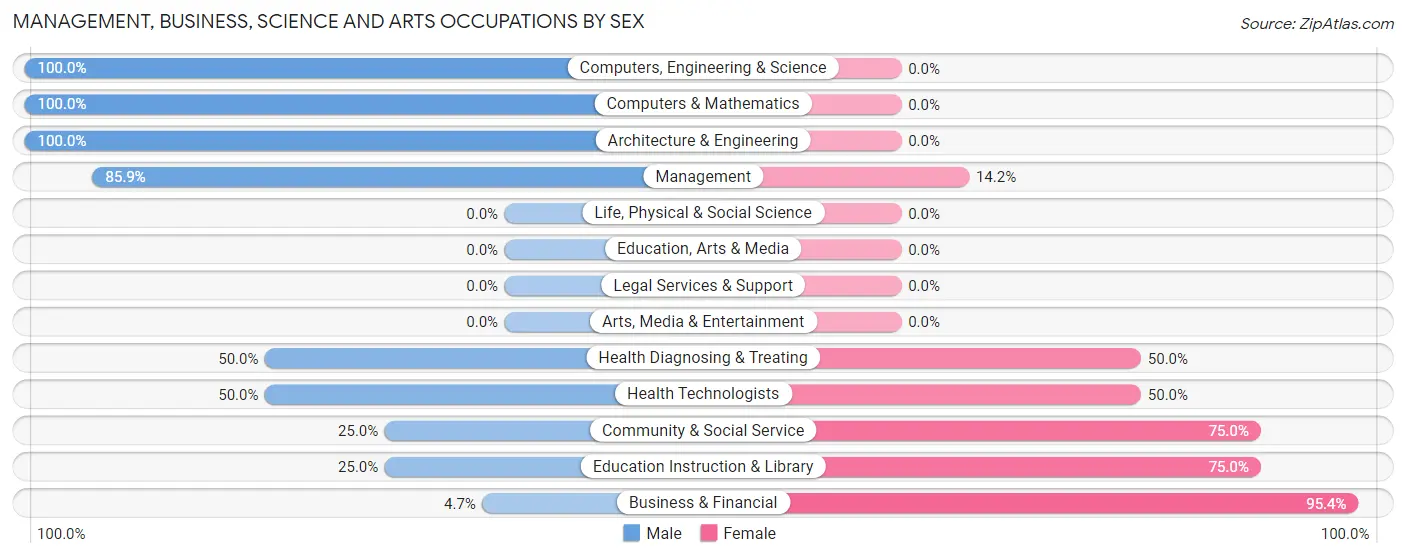
The most common Management, Business, Science and Arts occupations in Bayview CDP Humboldt County are Management (205 | 18.2%), Business & Financial (86 | 7.6%), Community & Social Service (56 | 5.0%), Education Instruction & Library (56 | 5.0%), and Computers, Engineering & Science (30 | 2.7%).
Management, Business, Science and Arts Occupations by Sex
Within the Management, Business, Science and Arts occupations in Bayview CDP Humboldt County, the most male-oriented occupations are Computers, Engineering & Science (100.0%), Computers & Mathematics (100.0%), and Architecture & Engineering (100.0%), while the most female-oriented occupations are Business & Financial (95.4%), Community & Social Service (75.0%), and Education Instruction & Library (75.0%).
| Occupation | Male | Female |
| Management | 176 (85.9%) | 29 (14.1%) |
| Business & Financial | 4 (4.6%) | 82 (95.4%) |
| Computers, Engineering & Science | 30 (100.0%) | 0 (0.0%) |
| Computers & Mathematics | 19 (100.0%) | 0 (0.0%) |
| Architecture & Engineering | 11 (100.0%) | 0 (0.0%) |
| Life, Physical & Social Science | 0 (0.0%) | 0 (0.0%) |
| Community & Social Service | 14 (25.0%) | 42 (75.0%) |
| Education, Arts & Media | 0 (0.0%) | 0 (0.0%) |
| Legal Services & Support | 0 (0.0%) | 0 (0.0%) |
| Education Instruction & Library | 14 (25.0%) | 42 (75.0%) |
| Arts, Media & Entertainment | 0 (0.0%) | 0 (0.0%) |
| Health Diagnosing & Treating | 7 (50.0%) | 7 (50.0%) |
| Health Technologists | 7 (50.0%) | 7 (50.0%) |
| Total (Category) | 231 (59.1%) | 160 (40.9%) |
| Total (Overall) | 611 (54.3%) | 515 (45.7%) |
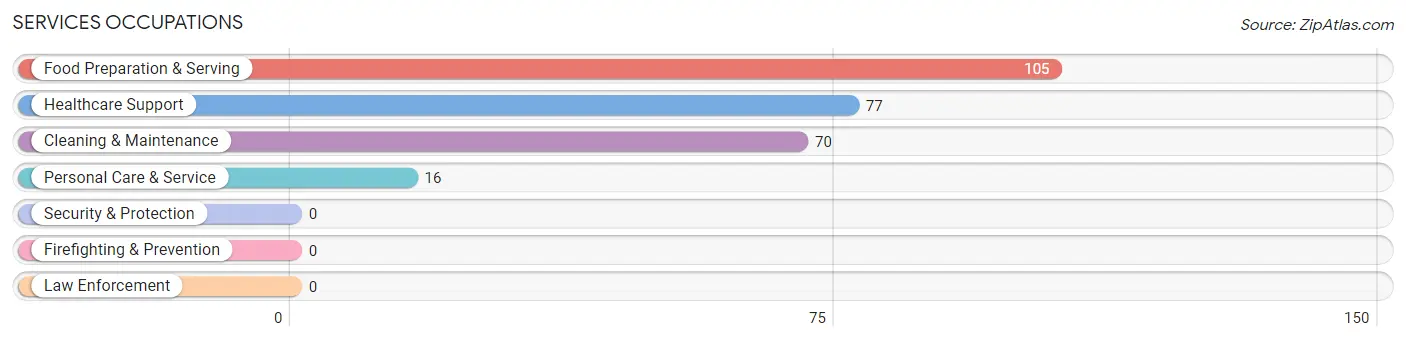
Services Occupations
The most common Services occupations in Bayview CDP Humboldt County are Food Preparation & Serving (105 | 9.3%), Healthcare Support (77 | 6.8%), Cleaning & Maintenance (70 | 6.2%), and Personal Care & Service (16 | 1.4%).
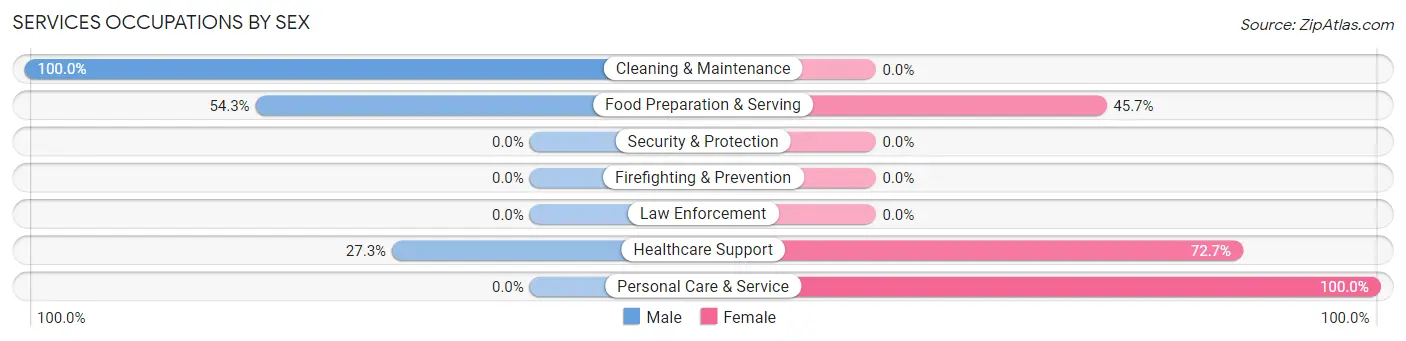
Services Occupations by Sex
Within the Services occupations in Bayview CDP Humboldt County, the most male-oriented occupations are Cleaning & Maintenance (100.0%), Food Preparation & Serving (54.3%), and Healthcare Support (27.3%), while the most female-oriented occupations are Personal Care & Service (100.0%), Healthcare Support (72.7%), and Food Preparation & Serving (45.7%).
| Occupation | Male | Female |
| Healthcare Support | 21 (27.3%) | 56 (72.7%) |
| Security & Protection | 0 (0.0%) | 0 (0.0%) |
| Firefighting & Prevention | 0 (0.0%) | 0 (0.0%) |
| Law Enforcement | 0 (0.0%) | 0 (0.0%) |
| Food Preparation & Serving | 57 (54.3%) | 48 (45.7%) |
| Cleaning & Maintenance | 70 (100.0%) | 0 (0.0%) |
| Personal Care & Service | 0 (0.0%) | 16 (100.0%) |
| Total (Category) | 148 (55.2%) | 120 (44.8%) |
| Total (Overall) | 611 (54.3%) | 515 (45.7%) |
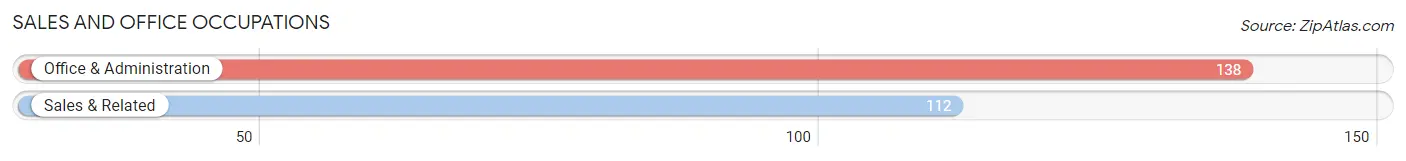
Sales and Office Occupations
The most common Sales and Office occupations in Bayview CDP Humboldt County are Office & Administration (138 | 12.3%), and Sales & Related (112 | 10.0%).
Sales and Office Occupations by Sex
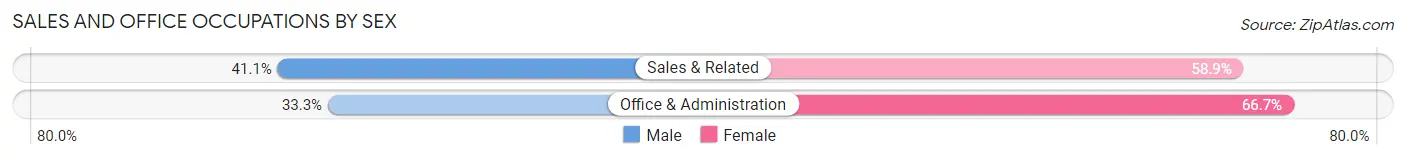
| Occupation | Male | Female |
| Sales & Related | 46 (41.1%) | 66 (58.9%) |
| Office & Administration | 46 (33.3%) | 92 (66.7%) |
| Total (Category) | 92 (36.8%) | 158 (63.2%) |
| Total (Overall) | 611 (54.3%) | 515 (45.7%) |
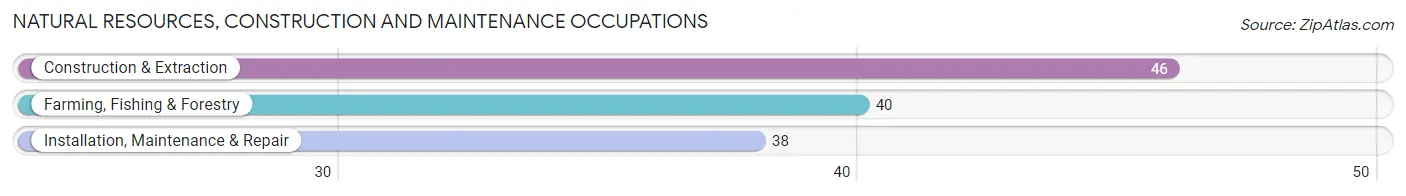
Natural Resources, Construction and Maintenance Occupations
The most common Natural Resources, Construction and Maintenance occupations in Bayview CDP Humboldt County are Construction & Extraction (46 | 4.1%), Farming, Fishing & Forestry (40 | 3.5%), and Installation, Maintenance & Repair (38 | 3.4%).
Natural Resources, Construction and Maintenance Occupations by Sex
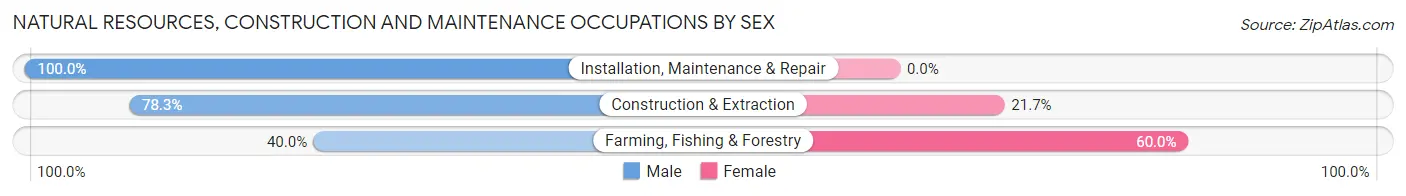
| Occupation | Male | Female |
| Farming, Fishing & Forestry | 16 (40.0%) | 24 (60.0%) |
| Construction & Extraction | 36 (78.3%) | 10 (21.7%) |
| Installation, Maintenance & Repair | 38 (100.0%) | 0 (0.0%) |
| Total (Category) | 90 (72.6%) | 34 (27.4%) |
| Total (Overall) | 611 (54.3%) | 515 (45.7%) |
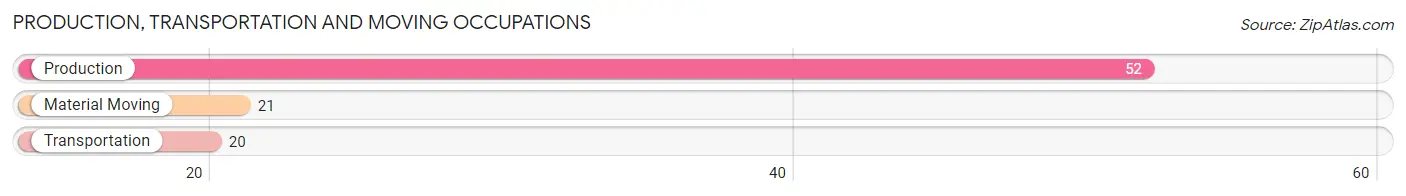
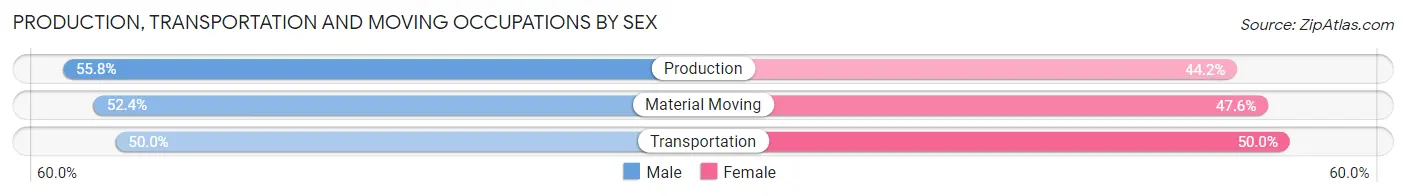
Production, Transportation and Moving Occupations
The most common Production, Transportation and Moving occupations in Bayview CDP Humboldt County are Production (52 | 4.6%), Material Moving (21 | 1.9%), and Transportation (20 | 1.8%).
Production, Transportation and Moving Occupations by Sex
| Occupation | Male | Female |
| Production | 29 (55.8%) | 23 (44.2%) |
| Transportation | 10 (50.0%) | 10 (50.0%) |
| Material Moving | 11 (52.4%) | 10 (47.6%) |
| Total (Category) | 50 (53.8%) | 43 (46.2%) |
| Total (Overall) | 611 (54.3%) | 515 (45.7%) |
Employment Industries by Sex in Bayview CDP Humboldt County
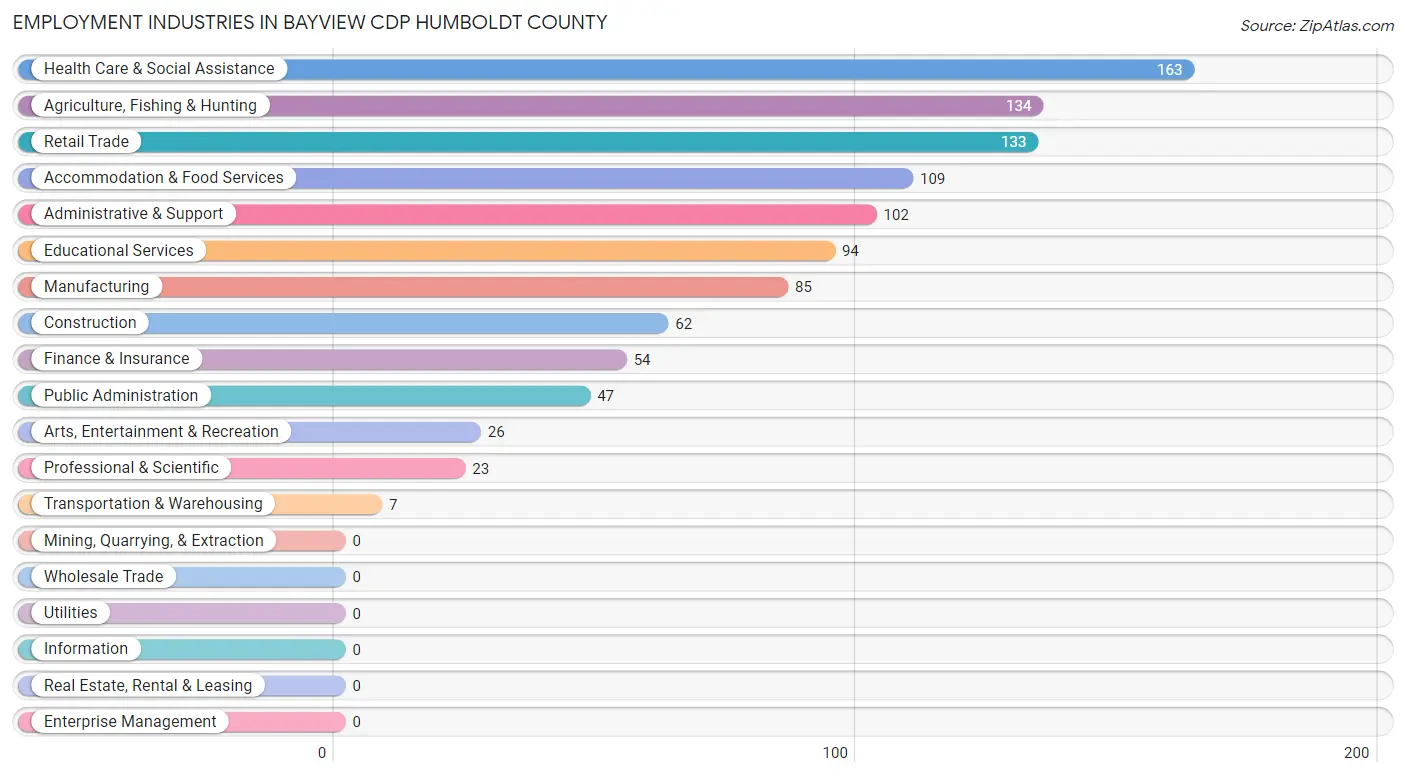
Employment Industries in Bayview CDP Humboldt County
The major employment industries in Bayview CDP Humboldt County include Health Care & Social Assistance (163 | 14.5%), Agriculture, Fishing & Hunting (134 | 11.9%), Retail Trade (133 | 11.8%), Accommodation & Food Services (109 | 9.7%), and Administrative & Support (102 | 9.1%).
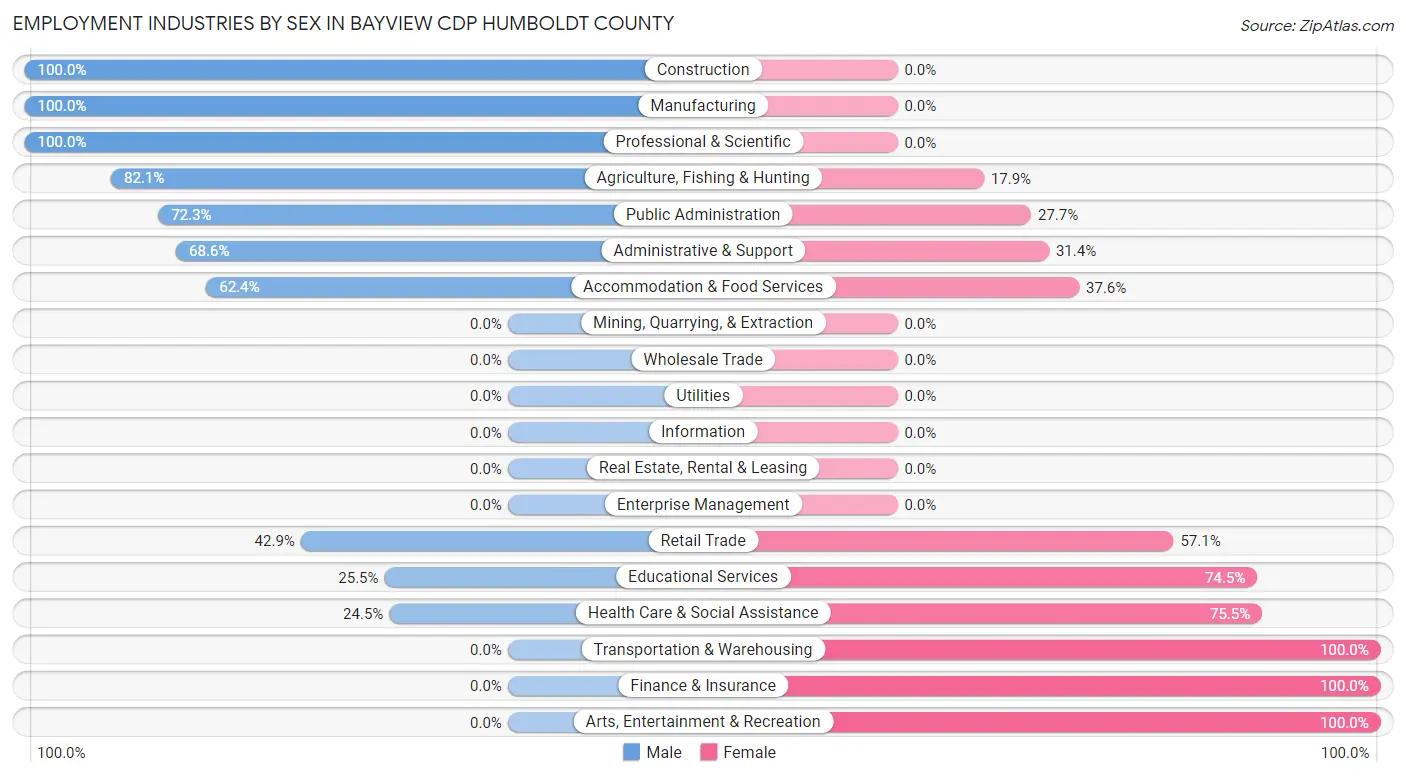
Employment Industries by Sex in Bayview CDP Humboldt County
The Bayview CDP Humboldt County industries that see more men than women are Construction (100.0%), Manufacturing (100.0%), and Professional & Scientific (100.0%), whereas the industries that tend to have a higher number of women are Transportation & Warehousing (100.0%), Finance & Insurance (100.0%), and Arts, Entertainment & Recreation (100.0%).
| Industry | Male | Female |
| Agriculture, Fishing & Hunting | 110 (82.1%) | 24 (17.9%) |
| Mining, Quarrying, & Extraction | 0 (0.0%) | 0 (0.0%) |
| Construction | 62 (100.0%) | 0 (0.0%) |
| Manufacturing | 85 (100.0%) | 0 (0.0%) |
| Wholesale Trade | 0 (0.0%) | 0 (0.0%) |
| Retail Trade | 57 (42.9%) | 76 (57.1%) |
| Transportation & Warehousing | 0 (0.0%) | 7 (100.0%) |
| Utilities | 0 (0.0%) | 0 (0.0%) |
| Information | 0 (0.0%) | 0 (0.0%) |
| Finance & Insurance | 0 (0.0%) | 54 (100.0%) |
| Real Estate, Rental & Leasing | 0 (0.0%) | 0 (0.0%) |
| Professional & Scientific | 23 (100.0%) | 0 (0.0%) |
| Enterprise Management | 0 (0.0%) | 0 (0.0%) |
| Administrative & Support | 70 (68.6%) | 32 (31.4%) |
| Educational Services | 24 (25.5%) | 70 (74.5%) |
| Health Care & Social Assistance | 40 (24.5%) | 123 (75.5%) |
| Arts, Entertainment & Recreation | 0 (0.0%) | 26 (100.0%) |
| Accommodation & Food Services | 68 (62.4%) | 41 (37.6%) |
| Public Administration | 34 (72.3%) | 13 (27.7%) |
| Total | 611 (54.3%) | 515 (45.7%) |
Education in Bayview CDP Humboldt County
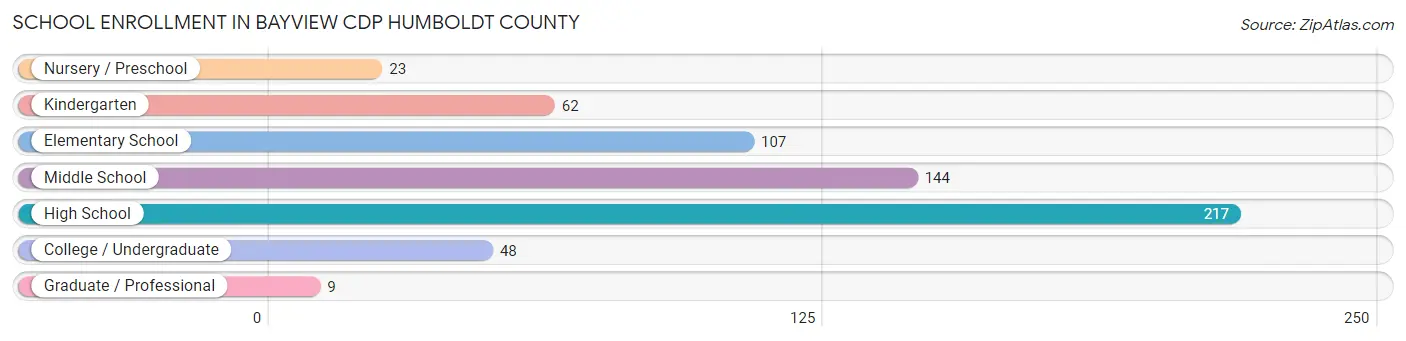
School Enrollment in Bayview CDP Humboldt County
The most common levels of schooling among the 610 students in Bayview CDP Humboldt County are high school (217 | 35.6%), middle school (144 | 23.6%), and elementary school (107 | 17.5%).
| School Level | # Students | % Students |
| Nursery / Preschool | 23 | 3.8% |
| Kindergarten | 62 | 10.2% |
| Elementary School | 107 | 17.5% |
| Middle School | 144 | 23.6% |
| High School | 217 | 35.6% |
| College / Undergraduate | 48 | 7.9% |
| Graduate / Professional | 9 | 1.5% |
| Total | 610 | 100.0% |
School Enrollment by Age by Funding Source in Bayview CDP Humboldt County
Out of a total of 610 students who are enrolled in schools in Bayview CDP Humboldt County, 115 (18.9%) attend a private institution, while the remaining 495 (81.1%) are enrolled in public schools. The age group of 15 to 17 year olds has the highest likelihood of being enrolled in private schools, with 96 (52.5% in the age bracket) enrolled. Conversely, the age group of 3 to 4 year olds has the lowest likelihood of being enrolled in a private school, with 23 (100.0% in the age bracket) attending a public institution.
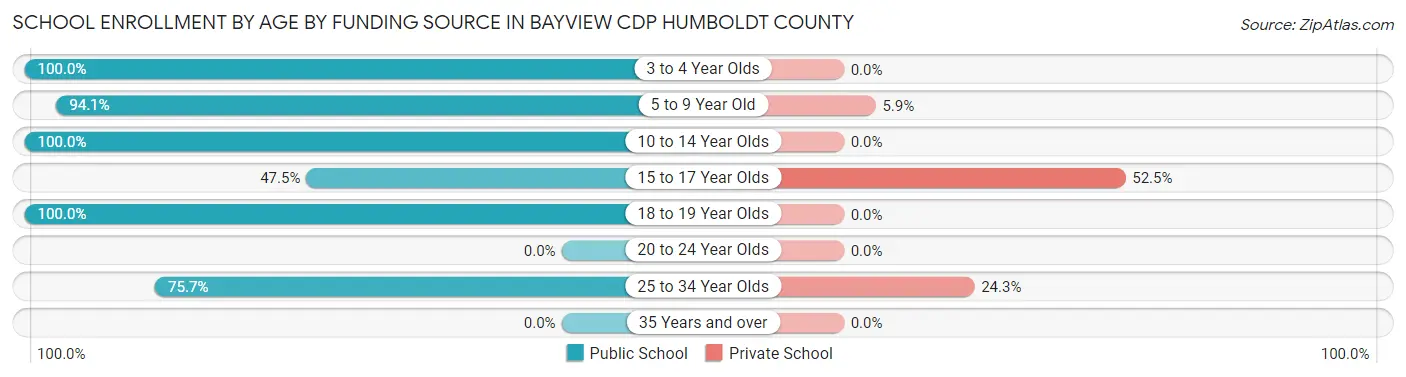
| Age Bracket | Public School | Private School |
| 3 to 4 Year Olds | 23 (100.0%) | 0 (0.0%) |
| 5 to 9 Year Old | 159 (94.1%) | 10 (5.9%) |
| 10 to 14 Year Olds | 178 (100.0%) | 0 (0.0%) |
| 15 to 17 Year Olds | 87 (47.5%) | 96 (52.5%) |
| 18 to 19 Year Olds | 20 (100.0%) | 0 (0.0%) |
| 20 to 24 Year Olds | 0 (0.0%) | 0 (0.0%) |
| 25 to 34 Year Olds | 28 (75.7%) | 9 (24.3%) |
| 35 Years and over | 0 (0.0%) | 0 (0.0%) |
| Total | 495 (81.1%) | 115 (18.9%) |
Educational Attainment by Field of Study in Bayview CDP Humboldt County
Business (71 | 16.4%), science & technology (64 | 14.7%), communications (47 | 10.8%), multidisciplinary studies (45 | 10.4%), and bio, nature & agricultural (37 | 8.5%) are the most common fields of study among 434 individuals in Bayview CDP Humboldt County who have obtained a bachelor's degree or higher.
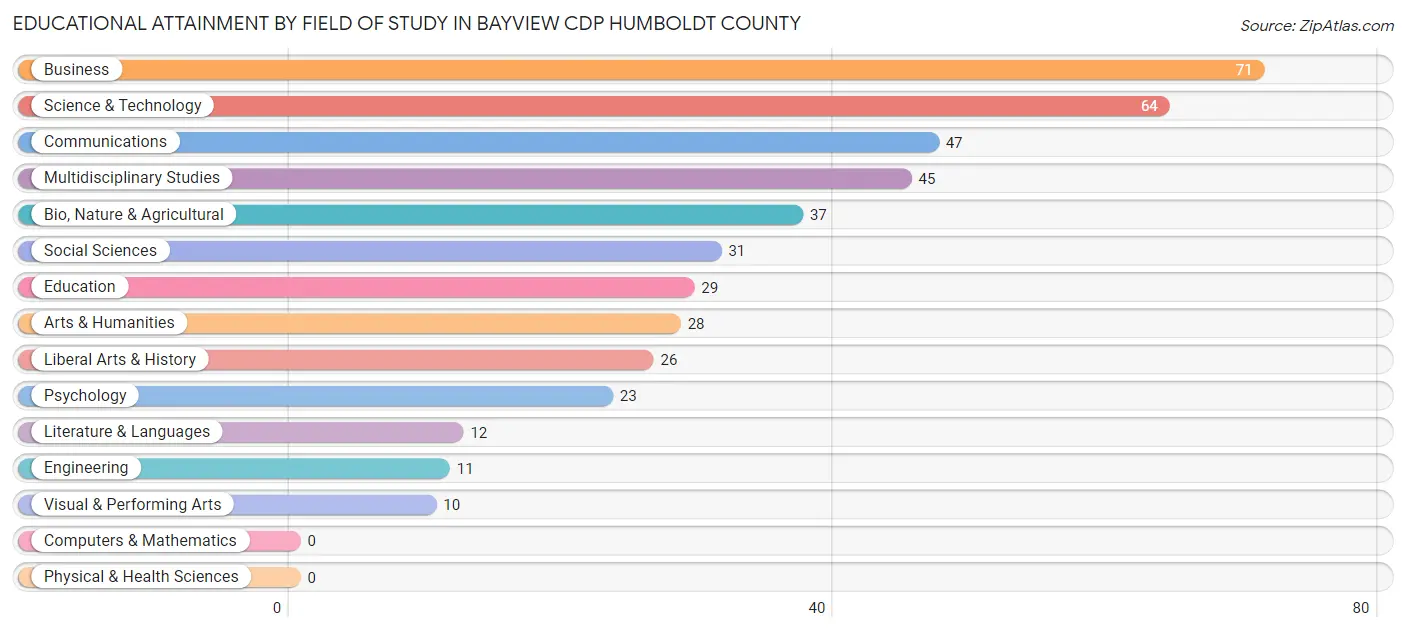
| Field of Study | # Graduates | % Graduates |
| Computers & Mathematics | 0 | 0.0% |
| Bio, Nature & Agricultural | 37 | 8.5% |
| Physical & Health Sciences | 0 | 0.0% |
| Psychology | 23 | 5.3% |
| Social Sciences | 31 | 7.1% |
| Engineering | 11 | 2.5% |
| Multidisciplinary Studies | 45 | 10.4% |
| Science & Technology | 64 | 14.7% |
| Business | 71 | 16.4% |
| Education | 29 | 6.7% |
| Literature & Languages | 12 | 2.8% |
| Liberal Arts & History | 26 | 6.0% |
| Visual & Performing Arts | 10 | 2.3% |
| Communications | 47 | 10.8% |
| Arts & Humanities | 28 | 6.5% |
| Total | 434 | 100.0% |
Transportation & Commute in Bayview CDP Humboldt County
Vehicle Availability by Sex in Bayview CDP Humboldt County
The most prevalent vehicle ownership categories in Bayview CDP Humboldt County are males with 2 vehicles (188, accounting for 32.5%) and females with 2 vehicles (119, making up 42.1%).
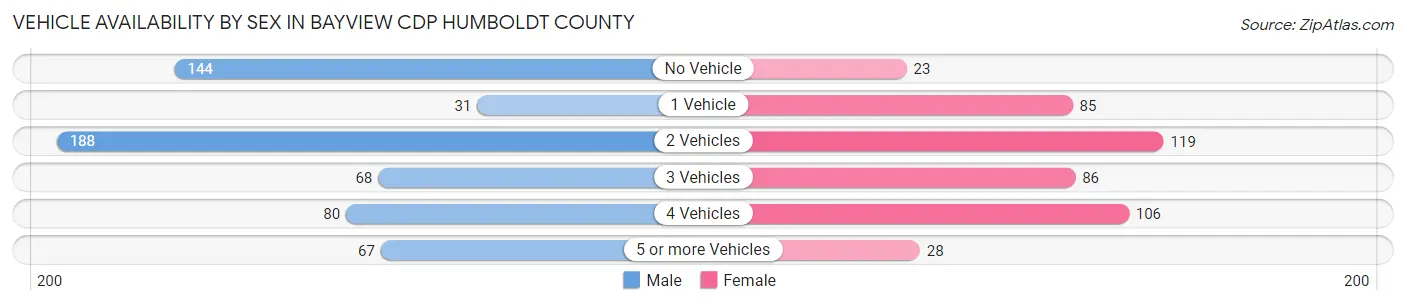
| Vehicles Available | Male | Female |
| No Vehicle | 144 (24.9%) | 23 (5.1%) |
| 1 Vehicle | 31 (5.4%) | 85 (19.0%) |
| 2 Vehicles | 188 (32.5%) | 119 (26.6%) |
| 3 Vehicles | 68 (11.8%) | 86 (19.2%) |
| 4 Vehicles | 80 (13.8%) | 106 (23.7%) |
| 5 or more Vehicles | 67 (11.6%) | 28 (6.3%) |
| Total | 578 (100.0%) | 447 (100.0%) |
Commute Time in Bayview CDP Humboldt County
The most frequently occuring commute durations in Bayview CDP Humboldt County are 15 to 19 minutes (338 commuters, 32.9%), 10 to 14 minutes (258 commuters, 25.2%), and 5 to 9 minutes (182 commuters, 17.7%).
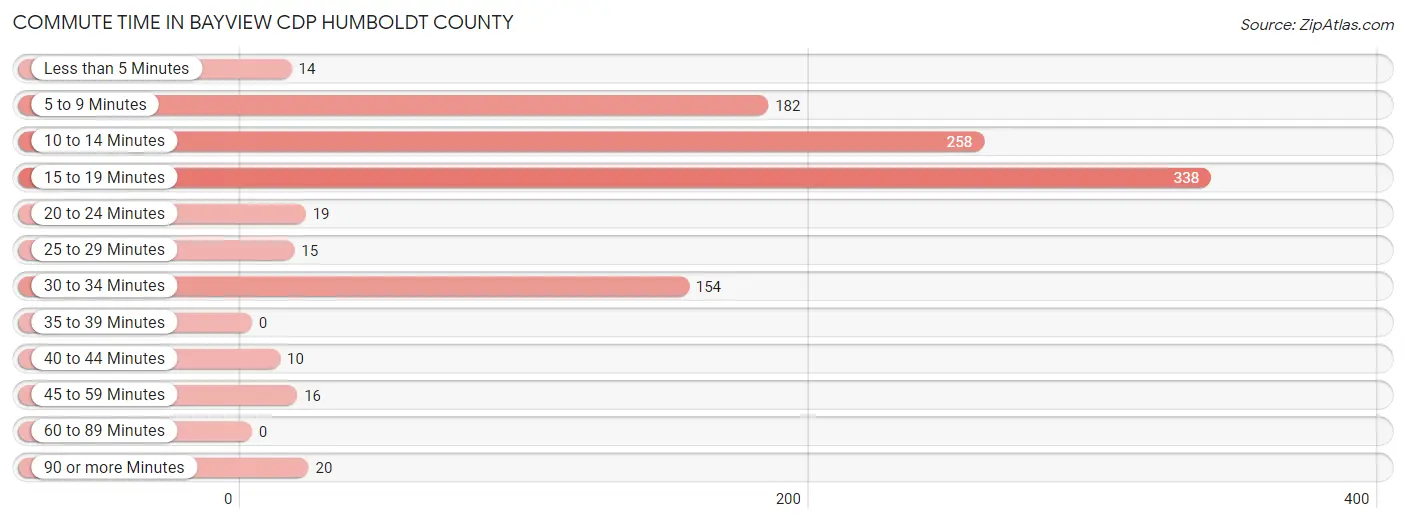
| Commute Time | # Commuters | % Commuters |
| Less than 5 Minutes | 14 | 1.4% |
| 5 to 9 Minutes | 182 | 17.7% |
| 10 to 14 Minutes | 258 | 25.2% |
| 15 to 19 Minutes | 338 | 32.9% |
| 20 to 24 Minutes | 19 | 1.8% |
| 25 to 29 Minutes | 15 | 1.5% |
| 30 to 34 Minutes | 154 | 15.0% |
| 35 to 39 Minutes | 0 | 0.0% |
| 40 to 44 Minutes | 10 | 1.0% |
| 45 to 59 Minutes | 16 | 1.6% |
| 60 to 89 Minutes | 0 | 0.0% |
| 90 or more Minutes | 20 | 1.9% |
Commute Time by Sex in Bayview CDP Humboldt County
The most common commute times in Bayview CDP Humboldt County are 15 to 19 minutes (247 commuters, 41.7%) for males and 10 to 14 minutes (165 commuters, 38.0%) for females.
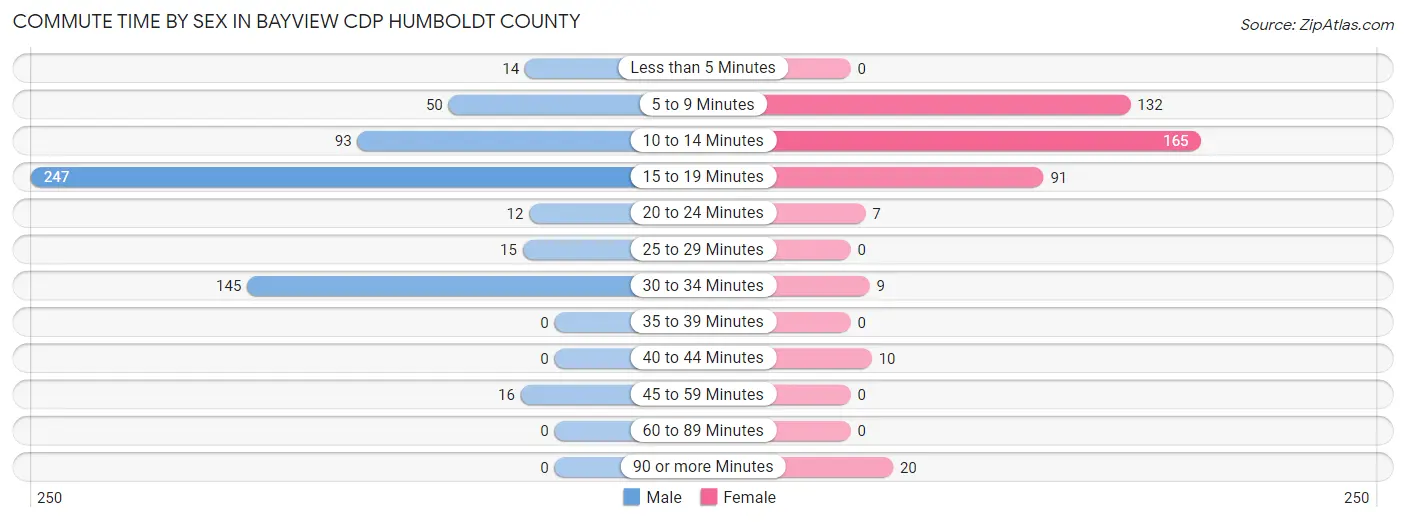
| Commute Time | Male | Female |
| Less than 5 Minutes | 14 (2.4%) | 0 (0.0%) |
| 5 to 9 Minutes | 50 (8.5%) | 132 (30.4%) |
| 10 to 14 Minutes | 93 (15.7%) | 165 (38.0%) |
| 15 to 19 Minutes | 247 (41.7%) | 91 (21.0%) |
| 20 to 24 Minutes | 12 (2.0%) | 7 (1.6%) |
| 25 to 29 Minutes | 15 (2.5%) | 0 (0.0%) |
| 30 to 34 Minutes | 145 (24.5%) | 9 (2.1%) |
| 35 to 39 Minutes | 0 (0.0%) | 0 (0.0%) |
| 40 to 44 Minutes | 0 (0.0%) | 10 (2.3%) |
| 45 to 59 Minutes | 16 (2.7%) | 0 (0.0%) |
| 60 to 89 Minutes | 0 (0.0%) | 0 (0.0%) |
| 90 or more Minutes | 0 (0.0%) | 20 (4.6%) |
Time of Departure to Work by Sex in Bayview CDP Humboldt County
The most frequent times of departure to work in Bayview CDP Humboldt County are 6:30 AM to 6:59 AM (130, 22.0%) for males and 8:00 AM to 8:29 AM (137, 31.6%) for females.
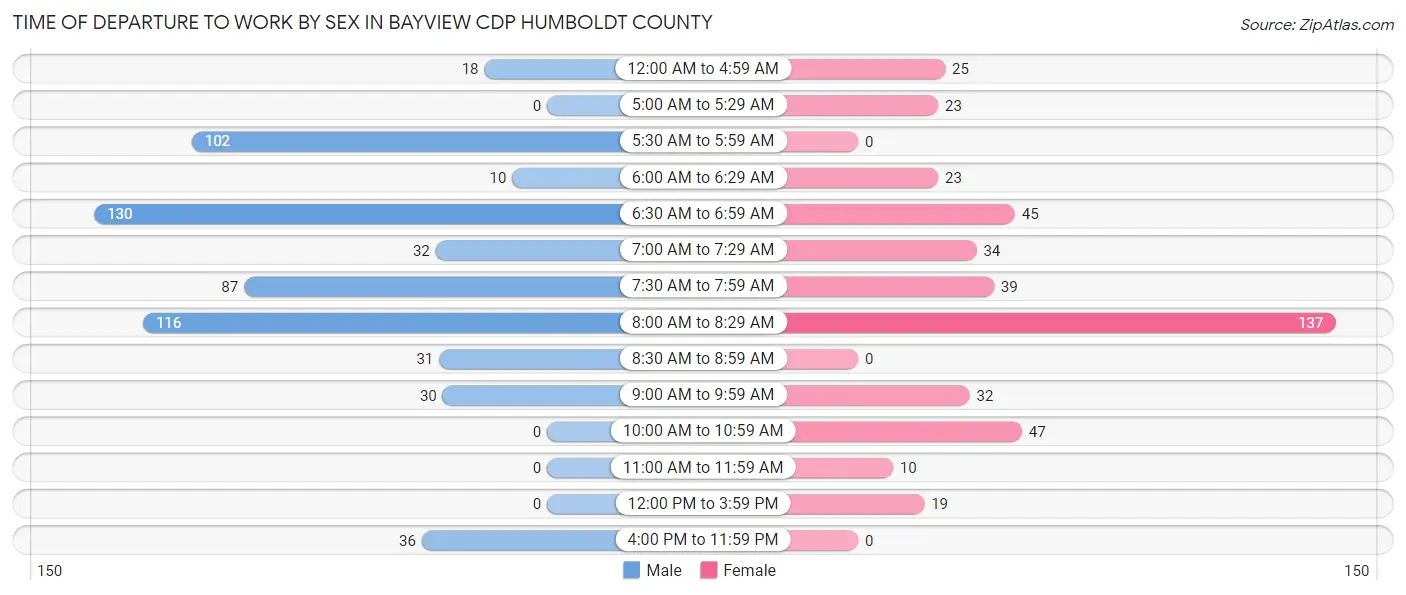
| Time of Departure | Male | Female |
| 12:00 AM to 4:59 AM | 18 (3.0%) | 25 (5.8%) |
| 5:00 AM to 5:29 AM | 0 (0.0%) | 23 (5.3%) |
| 5:30 AM to 5:59 AM | 102 (17.2%) | 0 (0.0%) |
| 6:00 AM to 6:29 AM | 10 (1.7%) | 23 (5.3%) |
| 6:30 AM to 6:59 AM | 130 (22.0%) | 45 (10.4%) |
| 7:00 AM to 7:29 AM | 32 (5.4%) | 34 (7.8%) |
| 7:30 AM to 7:59 AM | 87 (14.7%) | 39 (9.0%) |
| 8:00 AM to 8:29 AM | 116 (19.6%) | 137 (31.6%) |
| 8:30 AM to 8:59 AM | 31 (5.2%) | 0 (0.0%) |
| 9:00 AM to 9:59 AM | 30 (5.1%) | 32 (7.4%) |
| 10:00 AM to 10:59 AM | 0 (0.0%) | 47 (10.8%) |
| 11:00 AM to 11:59 AM | 0 (0.0%) | 10 (2.3%) |
| 12:00 PM to 3:59 PM | 0 (0.0%) | 19 (4.4%) |
| 4:00 PM to 11:59 PM | 36 (6.1%) | 0 (0.0%) |
| Total | 592 (100.0%) | 434 (100.0%) |
Housing Occupancy in Bayview CDP Humboldt County
Occupancy by Ownership in Bayview CDP Humboldt County
Of the total 1,096 dwellings in Bayview CDP Humboldt County, owner-occupied units account for 747 (68.2%), while renter-occupied units make up 349 (31.8%).
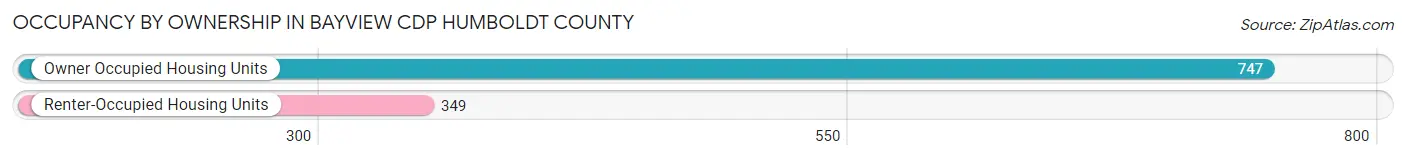
| Occupancy | # Housing Units | % Housing Units |
| Owner Occupied Housing Units | 747 | 68.2% |
| Renter-Occupied Housing Units | 349 | 31.8% |
| Total Occupied Housing Units | 1,096 | 100.0% |
Occupancy by Household Size in Bayview CDP Humboldt County
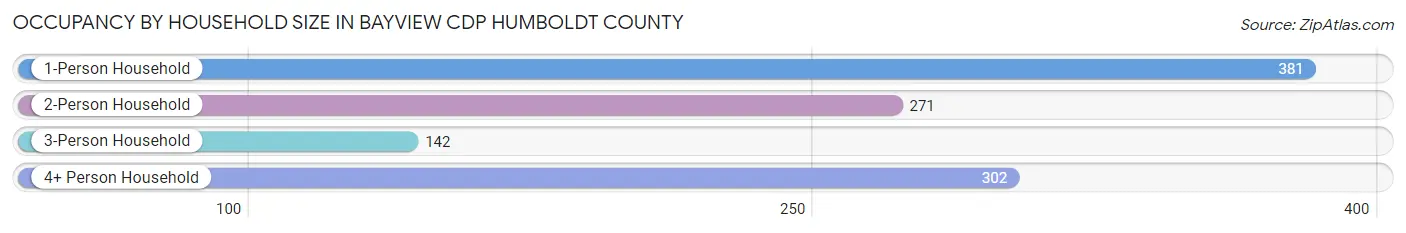
| Household Size | # Housing Units | % Housing Units |
| 1-Person Household | 381 | 34.8% |
| 2-Person Household | 271 | 24.7% |
| 3-Person Household | 142 | 13.0% |
| 4+ Person Household | 302 | 27.6% |
| Total Housing Units | 1,096 | 100.0% |
Occupancy by Ownership by Household Size in Bayview CDP Humboldt County
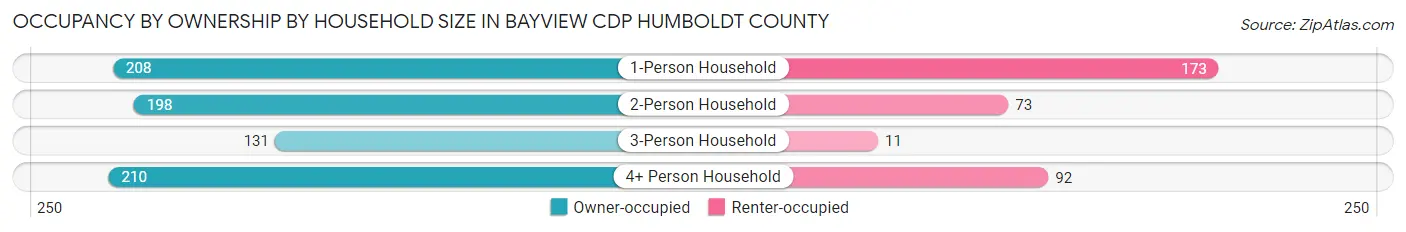
| Household Size | Owner-occupied | Renter-occupied |
| 1-Person Household | 208 (54.6%) | 173 (45.4%) |
| 2-Person Household | 198 (73.1%) | 73 (26.9%) |
| 3-Person Household | 131 (92.2%) | 11 (7.7%) |
| 4+ Person Household | 210 (69.5%) | 92 (30.5%) |
| Total Housing Units | 747 (68.2%) | 349 (31.8%) |
Occupancy by Educational Attainment in Bayview CDP Humboldt County
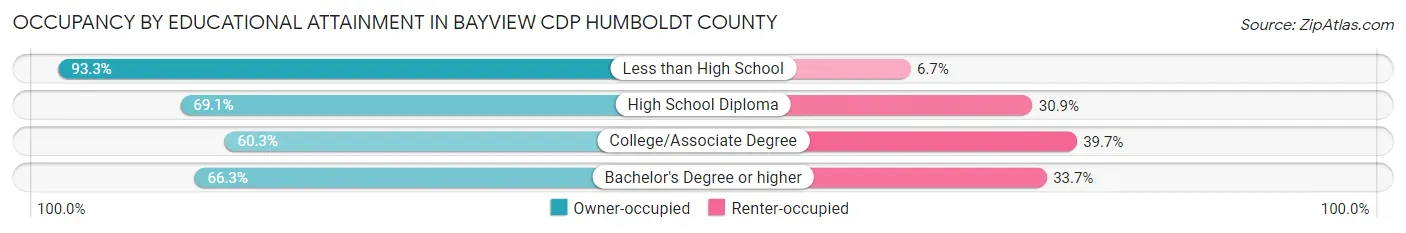
| Household Size | Owner-occupied | Renter-occupied |
| Less than High School | 139 (93.3%) | 10 (6.7%) |
| High School Diploma | 206 (69.1%) | 92 (30.9%) |
| College/Associate Degree | 286 (60.3%) | 188 (39.7%) |
| Bachelor's Degree or higher | 116 (66.3%) | 59 (33.7%) |
Occupancy by Age of Householder in Bayview CDP Humboldt County
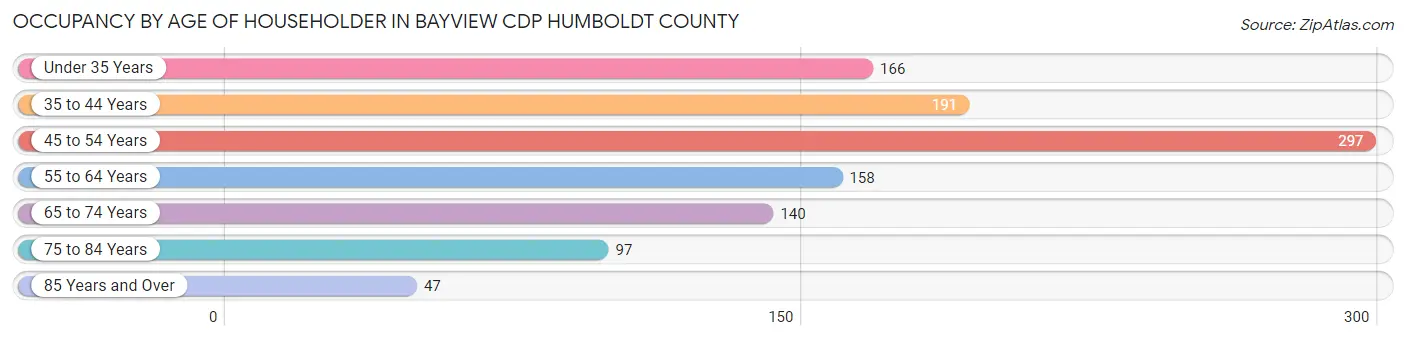
| Age Bracket | # Households | % Households |
| Under 35 Years | 166 | 15.1% |
| 35 to 44 Years | 191 | 17.4% |
| 45 to 54 Years | 297 | 27.1% |
| 55 to 64 Years | 158 | 14.4% |
| 65 to 74 Years | 140 | 12.8% |
| 75 to 84 Years | 97 | 8.8% |
| 85 Years and Over | 47 | 4.3% |
| Total | 1,096 | 100.0% |
Housing Finances in Bayview CDP Humboldt County
Median Income by Occupancy in Bayview CDP Humboldt County
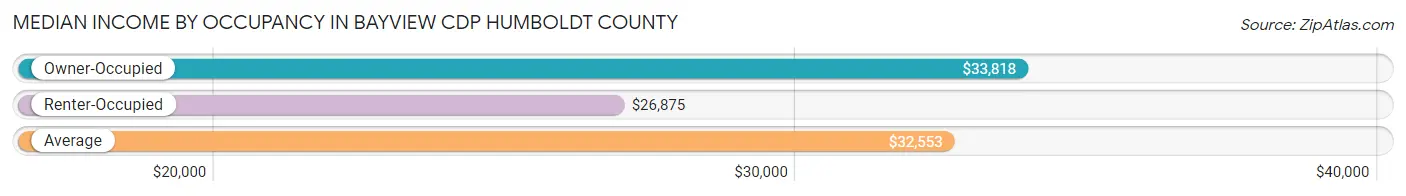
| Occupancy Type | # Households | Median Income |
| Owner-Occupied | 747 (68.2%) | $33,818 |
| Renter-Occupied | 349 (31.8%) | $26,875 |
| Average | 1,096 (100.0%) | $32,553 |
Occupancy by Householder Income Bracket in Bayview CDP Humboldt County
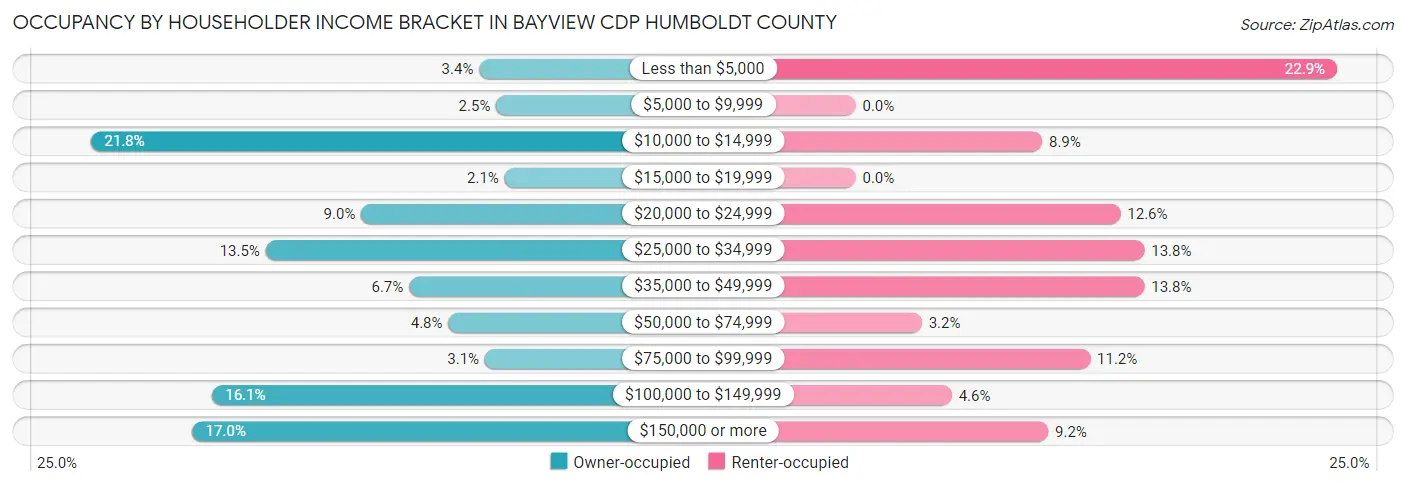
| Income Bracket | Owner-occupied | Renter-occupied |
| Less than $5,000 | 25 (3.4%) | 80 (22.9%) |
| $5,000 to $9,999 | 19 (2.5%) | 0 (0.0%) |
| $10,000 to $14,999 | 163 (21.8%) | 31 (8.9%) |
| $15,000 to $19,999 | 16 (2.1%) | 0 (0.0%) |
| $20,000 to $24,999 | 67 (9.0%) | 44 (12.6%) |
| $25,000 to $34,999 | 101 (13.5%) | 48 (13.8%) |
| $35,000 to $49,999 | 50 (6.7%) | 48 (13.8%) |
| $50,000 to $74,999 | 36 (4.8%) | 11 (3.2%) |
| $75,000 to $99,999 | 23 (3.1%) | 39 (11.2%) |
| $100,000 to $149,999 | 120 (16.1%) | 16 (4.6%) |
| $150,000 or more | 127 (17.0%) | 32 (9.2%) |
| Total | 747 (100.0%) | 349 (100.0%) |
Monthly Housing Cost Tiers in Bayview CDP Humboldt County
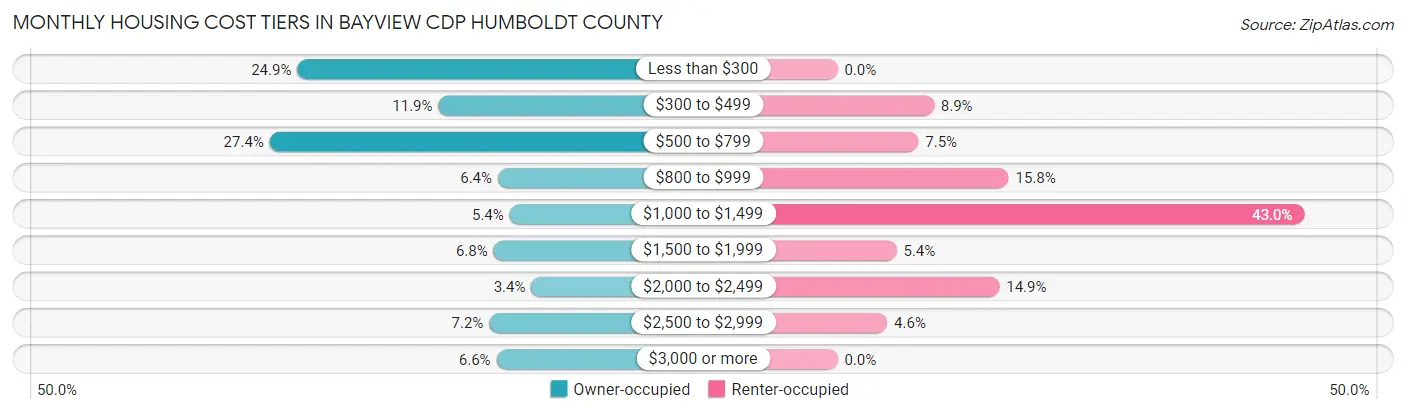
| Monthly Cost | Owner-occupied | Renter-occupied |
| Less than $300 | 186 (24.9%) | 0 (0.0%) |
| $300 to $499 | 89 (11.9%) | 31 (8.9%) |
| $500 to $799 | 205 (27.4%) | 26 (7.4%) |
| $800 to $999 | 48 (6.4%) | 55 (15.8%) |
| $1,000 to $1,499 | 40 (5.3%) | 150 (43.0%) |
| $1,500 to $1,999 | 51 (6.8%) | 19 (5.4%) |
| $2,000 to $2,499 | 25 (3.4%) | 52 (14.9%) |
| $2,500 to $2,999 | 54 (7.2%) | 16 (4.6%) |
| $3,000 or more | 49 (6.6%) | 0 (0.0%) |
| Total | 747 (100.0%) | 349 (100.0%) |
Physical Housing Characteristics in Bayview CDP Humboldt County
Housing Structures in Bayview CDP Humboldt County
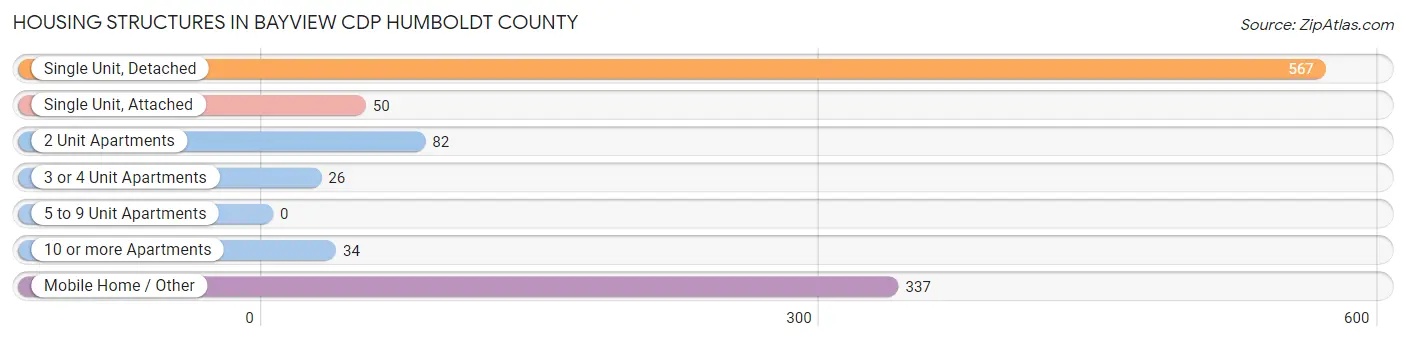
| Structure Type | # Housing Units | % Housing Units |
| Single Unit, Detached | 567 | 51.7% |
| Single Unit, Attached | 50 | 4.6% |
| 2 Unit Apartments | 82 | 7.5% |
| 3 or 4 Unit Apartments | 26 | 2.4% |
| 5 to 9 Unit Apartments | 0 | 0.0% |
| 10 or more Apartments | 34 | 3.1% |
| Mobile Home / Other | 337 | 30.7% |
| Total | 1,096 | 100.0% |
Housing Structures by Occupancy in Bayview CDP Humboldt County
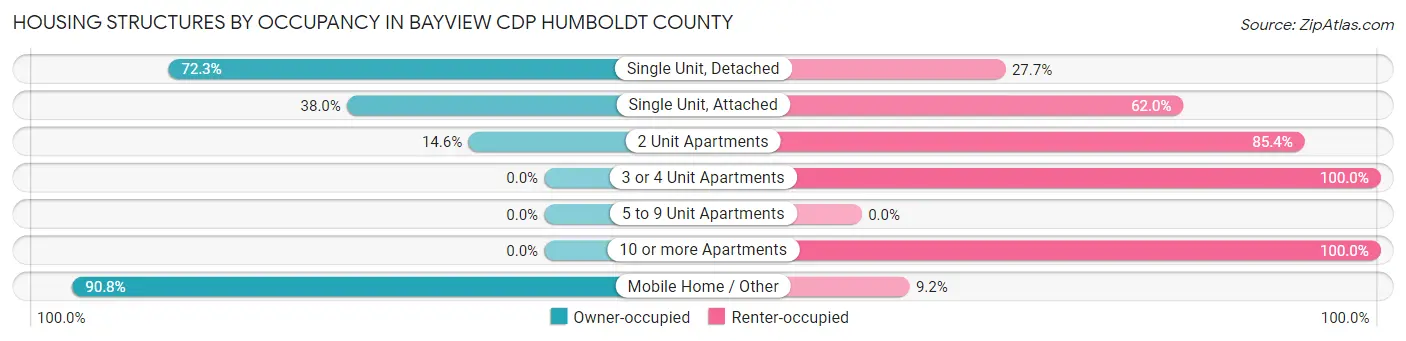
| Structure Type | Owner-occupied | Renter-occupied |
| Single Unit, Detached | 410 (72.3%) | 157 (27.7%) |
| Single Unit, Attached | 19 (38.0%) | 31 (62.0%) |
| 2 Unit Apartments | 12 (14.6%) | 70 (85.4%) |
| 3 or 4 Unit Apartments | 0 (0.0%) | 26 (100.0%) |
| 5 to 9 Unit Apartments | 0 (0.0%) | 0 (0.0%) |
| 10 or more Apartments | 0 (0.0%) | 34 (100.0%) |
| Mobile Home / Other | 306 (90.8%) | 31 (9.2%) |
| Total | 747 (68.2%) | 349 (31.8%) |
Housing Structures by Number of Rooms in Bayview CDP Humboldt County
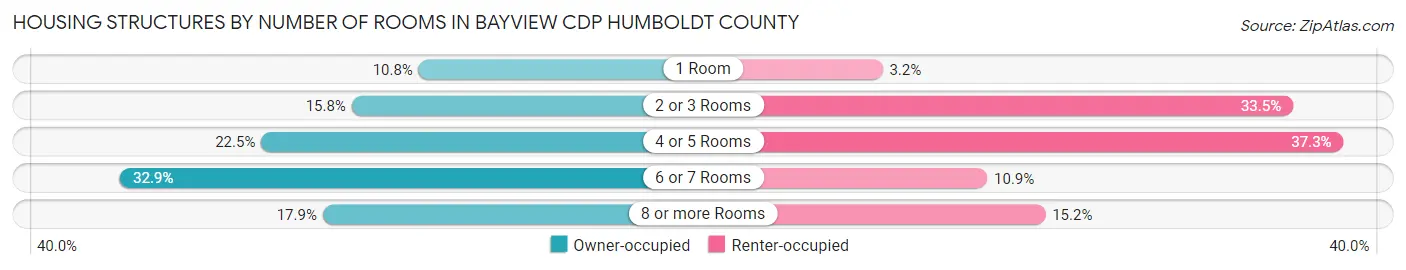
| Number of Rooms | Owner-occupied | Renter-occupied |
| 1 Room | 81 (10.8%) | 11 (3.2%) |
| 2 or 3 Rooms | 118 (15.8%) | 117 (33.5%) |
| 4 or 5 Rooms | 168 (22.5%) | 130 (37.2%) |
| 6 or 7 Rooms | 246 (32.9%) | 38 (10.9%) |
| 8 or more Rooms | 134 (17.9%) | 53 (15.2%) |
| Total | 747 (100.0%) | 349 (100.0%) |
Housing Structure by Heating Type in Bayview CDP Humboldt County
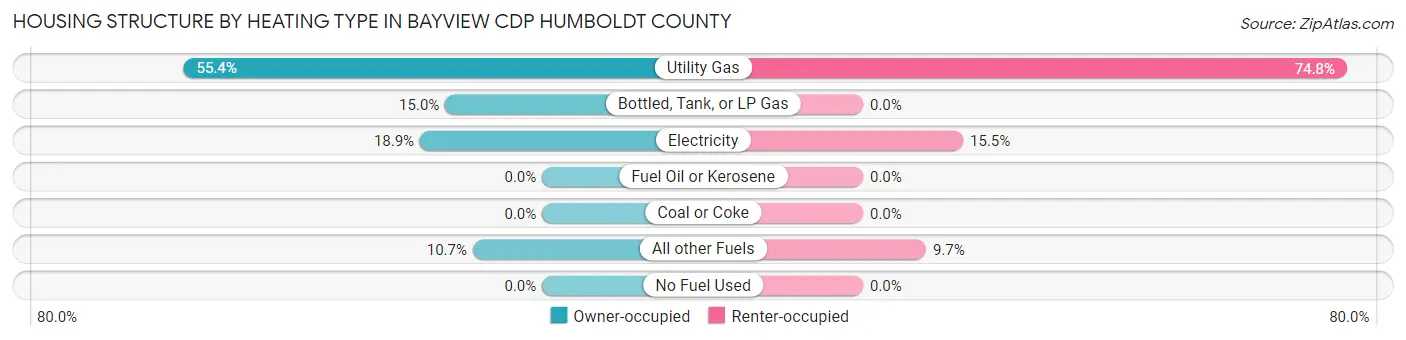
| Heating Type | Owner-occupied | Renter-occupied |
| Utility Gas | 414 (55.4%) | 261 (74.8%) |
| Bottled, Tank, or LP Gas | 112 (15.0%) | 0 (0.0%) |
| Electricity | 141 (18.9%) | 54 (15.5%) |
| Fuel Oil or Kerosene | 0 (0.0%) | 0 (0.0%) |
| Coal or Coke | 0 (0.0%) | 0 (0.0%) |
| All other Fuels | 80 (10.7%) | 34 (9.7%) |
| No Fuel Used | 0 (0.0%) | 0 (0.0%) |
| Total | 747 (100.0%) | 349 (100.0%) |
Household Vehicle Usage in Bayview CDP Humboldt County
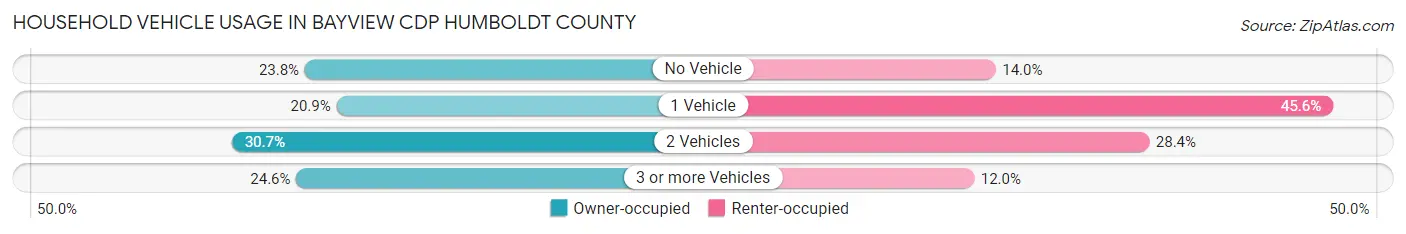
| Vehicles per Household | Owner-occupied | Renter-occupied |
| No Vehicle | 178 (23.8%) | 49 (14.0%) |
| 1 Vehicle | 156 (20.9%) | 159 (45.6%) |
| 2 Vehicles | 229 (30.7%) | 99 (28.4%) |
| 3 or more Vehicles | 184 (24.6%) | 42 (12.0%) |
| Total | 747 (100.0%) | 349 (100.0%) |
Real Estate & Mortgages in Bayview CDP Humboldt County
Real Estate and Mortgage Overview in Bayview CDP Humboldt County
| Characteristic | Without Mortgage | With Mortgage |
| Housing Units | 529 | 218 |
| Median Property Value | - | - |
| Median Household Income | $30,685 | $39 |
| Monthly Housing Costs | $476 | $49 |
| Real Estate Taxes | $2,104 | $0 |
Property Value by Mortgage Status in Bayview CDP Humboldt County
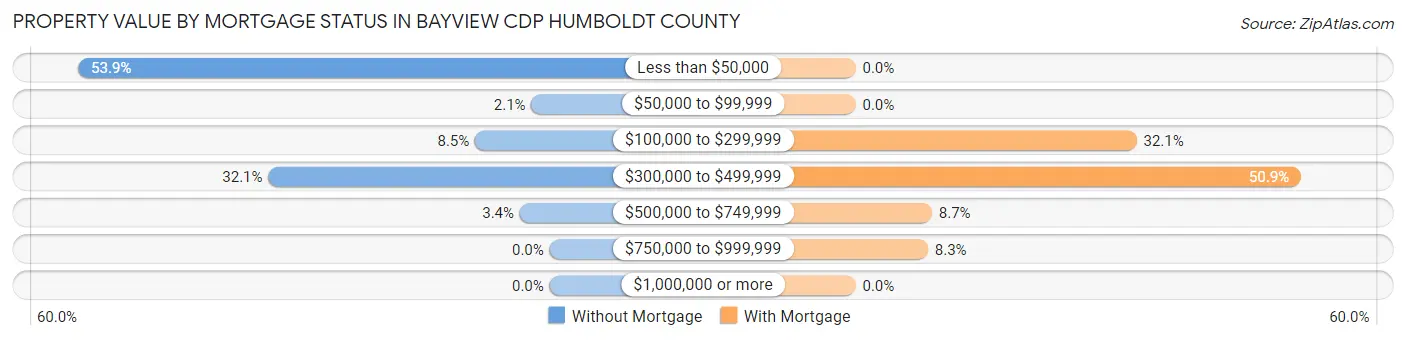
| Property Value | Without Mortgage | With Mortgage |
| Less than $50,000 | 285 (53.9%) | 0 (0.0%) |
| $50,000 to $99,999 | 11 (2.1%) | 0 (0.0%) |
| $100,000 to $299,999 | 45 (8.5%) | 70 (32.1%) |
| $300,000 to $499,999 | 170 (32.1%) | 111 (50.9%) |
| $500,000 to $749,999 | 18 (3.4%) | 19 (8.7%) |
| $750,000 to $999,999 | 0 (0.0%) | 18 (8.3%) |
| $1,000,000 or more | 0 (0.0%) | 0 (0.0%) |
| Total | 529 (100.0%) | 218 (100.0%) |
Household Income by Mortgage Status in Bayview CDP Humboldt County
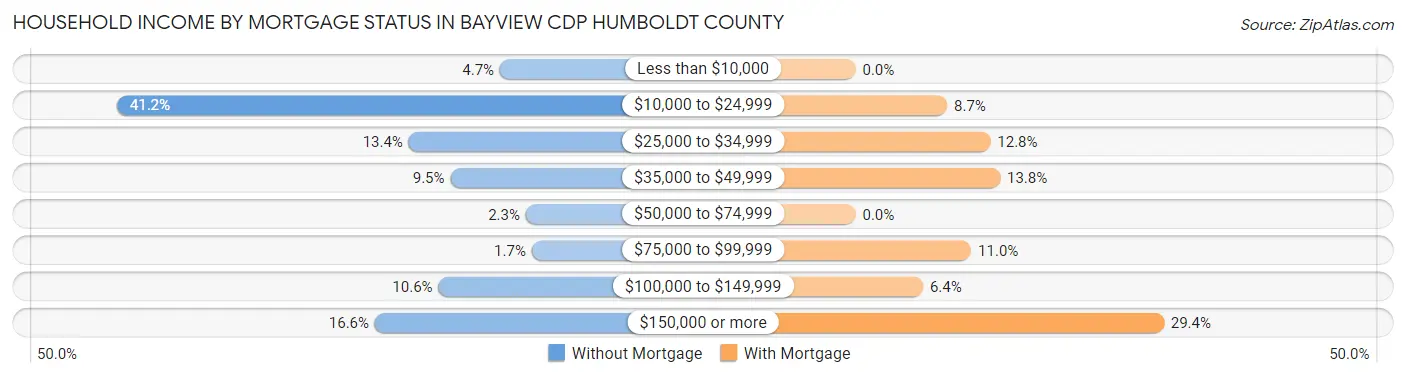
| Household Income | Without Mortgage | With Mortgage |
| Less than $10,000 | 25 (4.7%) | 0 (0.0%) |
| $10,000 to $24,999 | 218 (41.2%) | 19 (8.7%) |
| $25,000 to $34,999 | 71 (13.4%) | 28 (12.8%) |
| $35,000 to $49,999 | 50 (9.5%) | 30 (13.8%) |
| $50,000 to $74,999 | 12 (2.3%) | 0 (0.0%) |
| $75,000 to $99,999 | 9 (1.7%) | 24 (11.0%) |
| $100,000 to $149,999 | 56 (10.6%) | 14 (6.4%) |
| $150,000 or more | 88 (16.6%) | 64 (29.4%) |
| Total | 529 (100.0%) | 218 (100.0%) |
Property Value to Household Income Ratio in Bayview CDP Humboldt County
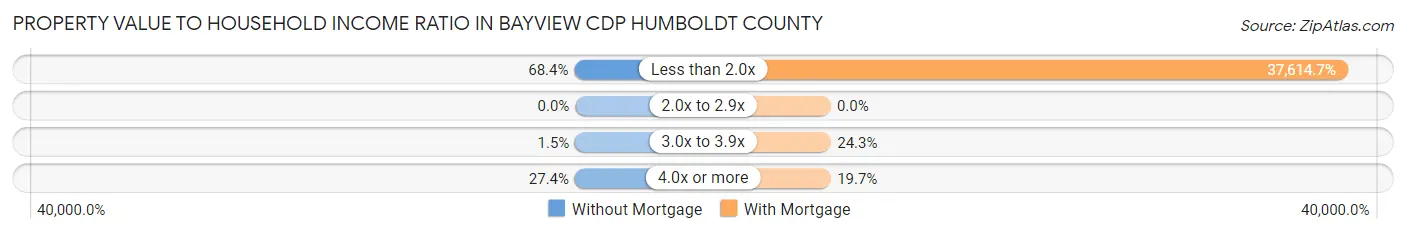
| Value-to-Income Ratio | Without Mortgage | With Mortgage |
| Less than 2.0x | 362 (68.4%) | 82,000 (37,614.7%) |
| 2.0x to 2.9x | 0 (0.0%) | 0 (0.0%) |
| 3.0x to 3.9x | 8 (1.5%) | 53 (24.3%) |
| 4.0x or more | 145 (27.4%) | 43 (19.7%) |
| Total | 529 (100.0%) | 218 (100.0%) |
Real Estate Taxes by Mortgage Status in Bayview CDP Humboldt County
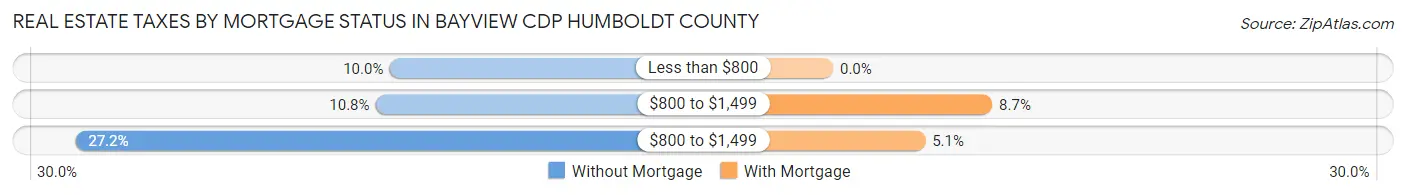
| Property Taxes | Without Mortgage | With Mortgage |
| Less than $800 | 53 (10.0%) | 0 (0.0%) |
| $800 to $1,499 | 57 (10.8%) | 19 (8.7%) |
| $800 to $1,499 | 144 (27.2%) | 11 (5.1%) |
| Total | 529 (100.0%) | 218 (100.0%) |
Health & Disability in Bayview CDP Humboldt County
Health Insurance Coverage by Age in Bayview CDP Humboldt County
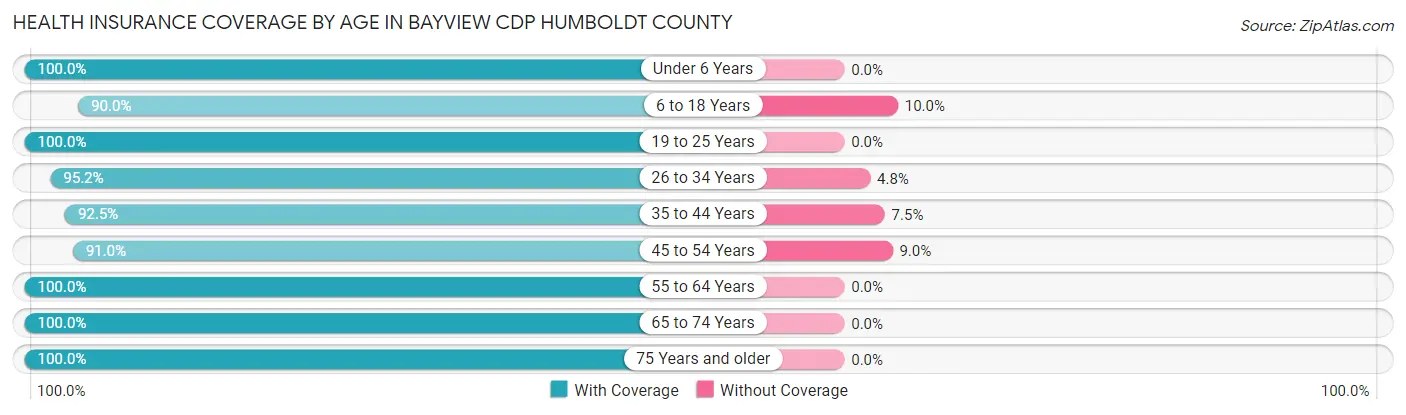
| Age Bracket | With Coverage | Without Coverage |
| Under 6 Years | 250 (100.0%) | 0 (0.0%) |
| 6 to 18 Years | 460 (90.0%) | 51 (10.0%) |
| 19 to 25 Years | 157 (100.0%) | 0 (0.0%) |
| 26 to 34 Years | 257 (95.2%) | 13 (4.8%) |
| 35 to 44 Years | 356 (92.5%) | 29 (7.5%) |
| 45 to 54 Years | 365 (91.0%) | 36 (9.0%) |
| 55 to 64 Years | 250 (100.0%) | 0 (0.0%) |
| 65 to 74 Years | 289 (100.0%) | 0 (0.0%) |
| 75 Years and older | 206 (100.0%) | 0 (0.0%) |
| Total | 2,590 (95.3%) | 129 (4.7%) |
Health Insurance Coverage by Citizenship Status in Bayview CDP Humboldt County
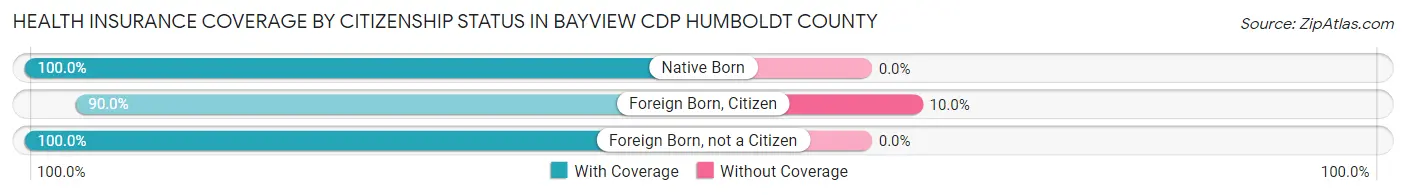
| Citizenship Status | With Coverage | Without Coverage |
| Native Born | 250 (100.0%) | 0 (0.0%) |
| Foreign Born, Citizen | 460 (90.0%) | 51 (10.0%) |
| Foreign Born, not a Citizen | 157 (100.0%) | 0 (0.0%) |
Health Insurance Coverage by Household Income in Bayview CDP Humboldt County
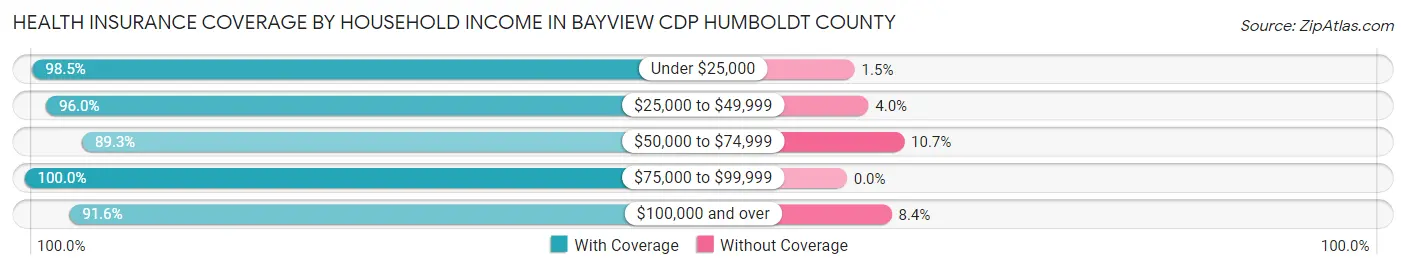
| Household Income | With Coverage | Without Coverage |
| Under $25,000 | 939 (98.5%) | 14 (1.5%) |
| $25,000 to $49,999 | 523 (96.0%) | 22 (4.0%) |
| $50,000 to $74,999 | 108 (89.3%) | 13 (10.7%) |
| $75,000 to $99,999 | 131 (100.0%) | 0 (0.0%) |
| $100,000 and over | 875 (91.6%) | 80 (8.4%) |
Public vs Private Health Insurance Coverage by Age in Bayview CDP Humboldt County
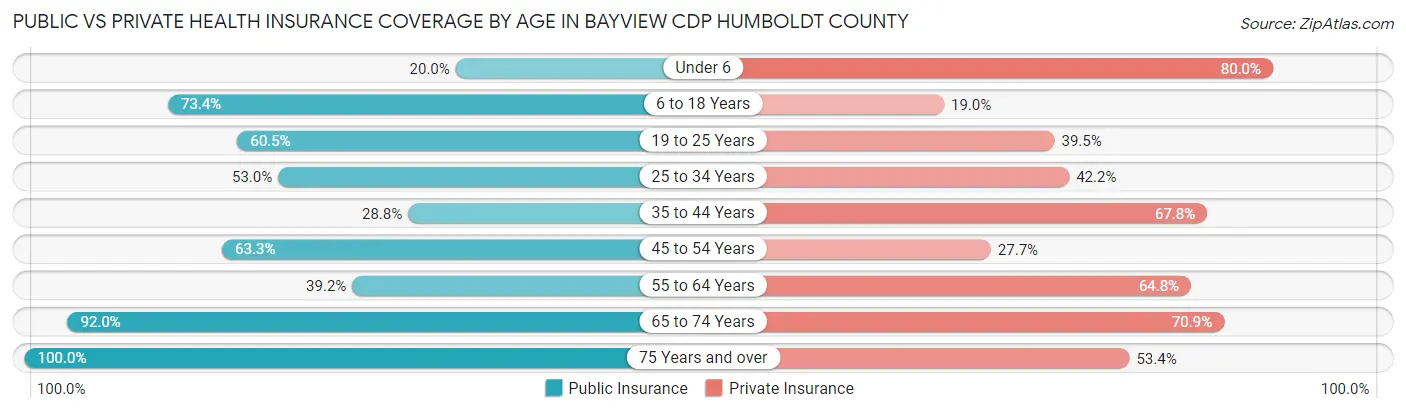
| Age Bracket | Public Insurance | Private Insurance |
| Under 6 | 50 (20.0%) | 200 (80.0%) |
| 6 to 18 Years | 375 (73.4%) | 97 (19.0%) |
| 19 to 25 Years | 95 (60.5%) | 62 (39.5%) |
| 25 to 34 Years | 143 (53.0%) | 114 (42.2%) |
| 35 to 44 Years | 111 (28.8%) | 261 (67.8%) |
| 45 to 54 Years | 254 (63.3%) | 111 (27.7%) |
| 55 to 64 Years | 98 (39.2%) | 162 (64.8%) |
| 65 to 74 Years | 266 (92.0%) | 205 (70.9%) |
| 75 Years and over | 206 (100.0%) | 110 (53.4%) |
| Total | 1,598 (58.8%) | 1,322 (48.6%) |
Disability Status by Sex by Age in Bayview CDP Humboldt County
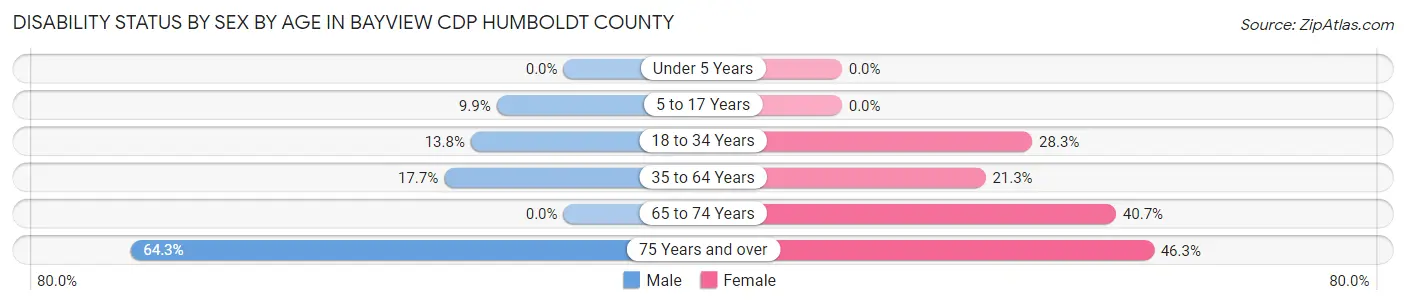
| Age Bracket | Male | Female |
| Under 5 Years | 0 (0.0%) | 0 (0.0%) |
| 5 to 17 Years | 27 (9.9%) | 0 (0.0%) |
| 18 to 34 Years | 22 (13.8%) | 80 (28.3%) |
| 35 to 64 Years | 93 (17.7%) | 109 (21.3%) |
| 65 to 74 Years | 0 (0.0%) | 70 (40.7%) |
| 75 Years and over | 45 (64.3%) | 63 (46.3%) |
Disability Class by Sex by Age in Bayview CDP Humboldt County
Disability Class: Hearing Difficulty
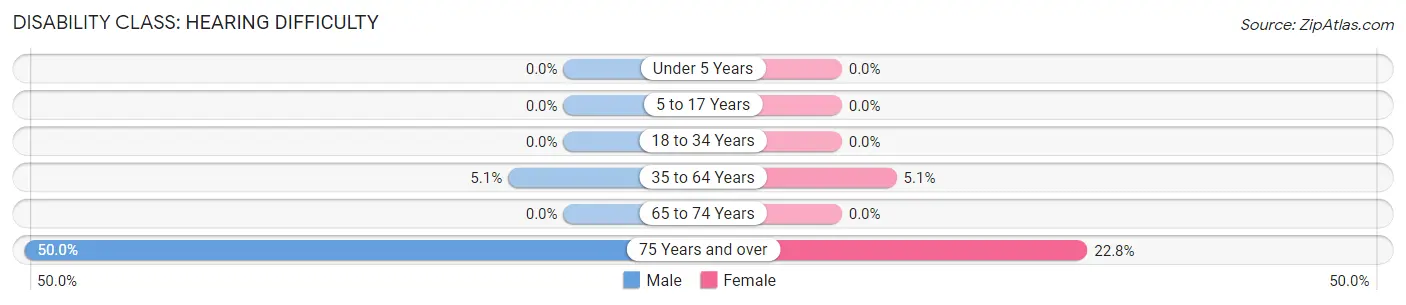
| Age Bracket | Male | Female |
| Under 5 Years | 0 (0.0%) | 0 (0.0%) |
| 5 to 17 Years | 0 (0.0%) | 0 (0.0%) |
| 18 to 34 Years | 0 (0.0%) | 0 (0.0%) |
| 35 to 64 Years | 27 (5.1%) | 26 (5.1%) |
| 65 to 74 Years | 0 (0.0%) | 0 (0.0%) |
| 75 Years and over | 35 (50.0%) | 31 (22.8%) |
Disability Class: Vision Difficulty
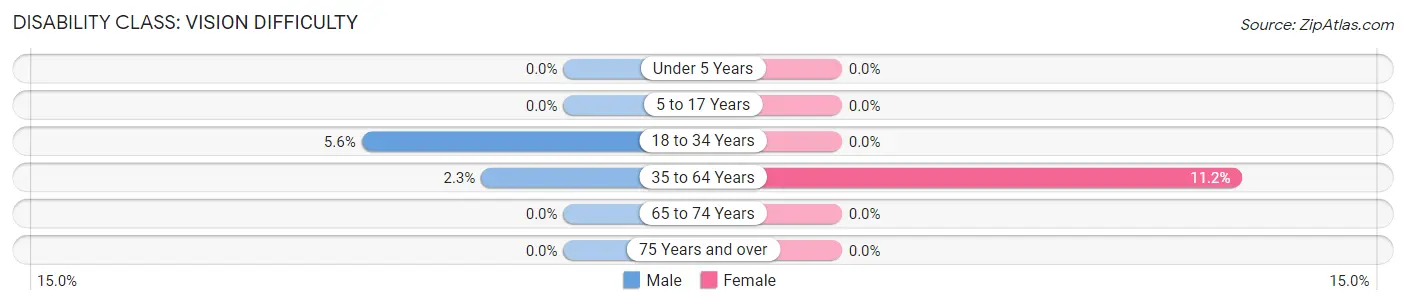
| Age Bracket | Male | Female |
| Under 5 Years | 0 (0.0%) | 0 (0.0%) |
| 5 to 17 Years | 0 (0.0%) | 0 (0.0%) |
| 18 to 34 Years | 9 (5.6%) | 0 (0.0%) |
| 35 to 64 Years | 12 (2.3%) | 57 (11.2%) |
| 65 to 74 Years | 0 (0.0%) | 0 (0.0%) |
| 75 Years and over | 0 (0.0%) | 0 (0.0%) |
Disability Class: Cognitive Difficulty
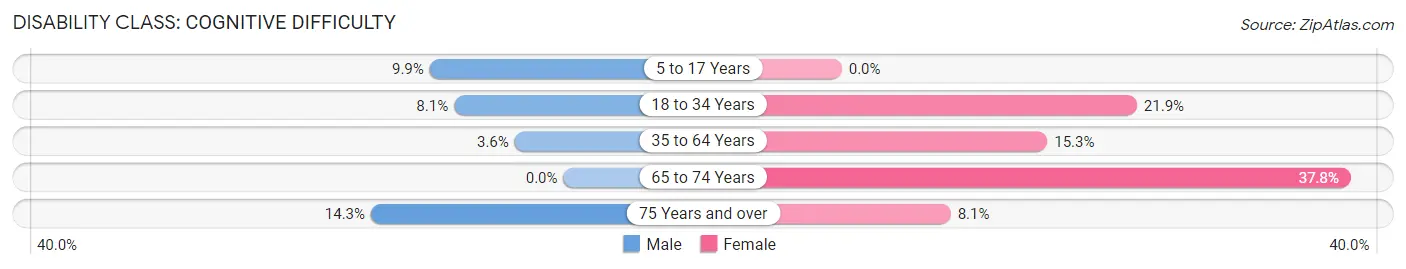
| Age Bracket | Male | Female |
| 5 to 17 Years | 27 (9.9%) | 0 (0.0%) |
| 18 to 34 Years | 13 (8.1%) | 62 (21.9%) |
| 35 to 64 Years | 19 (3.6%) | 78 (15.3%) |
| 65 to 74 Years | 0 (0.0%) | 65 (37.8%) |
| 75 Years and over | 10 (14.3%) | 11 (8.1%) |
Disability Class: Ambulatory Difficulty
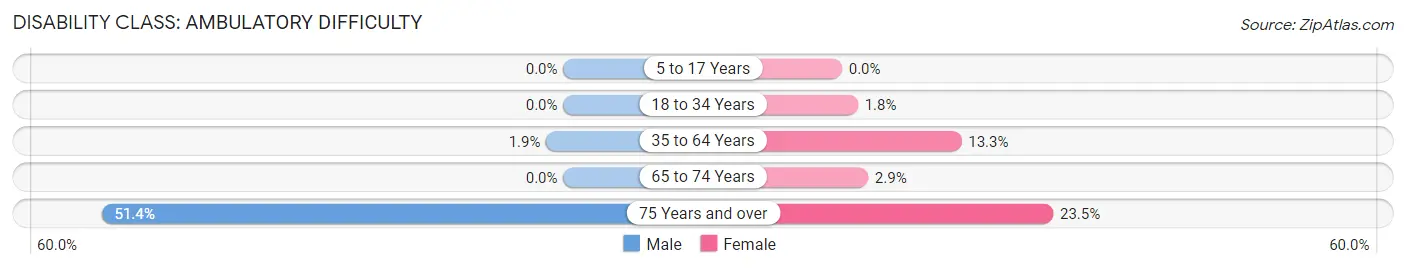
| Age Bracket | Male | Female |
| 5 to 17 Years | 0 (0.0%) | 0 (0.0%) |
| 18 to 34 Years | 0 (0.0%) | 5 (1.8%) |
| 35 to 64 Years | 10 (1.9%) | 68 (13.3%) |
| 65 to 74 Years | 0 (0.0%) | 5 (2.9%) |
| 75 Years and over | 36 (51.4%) | 32 (23.5%) |
Disability Class: Self-Care Difficulty
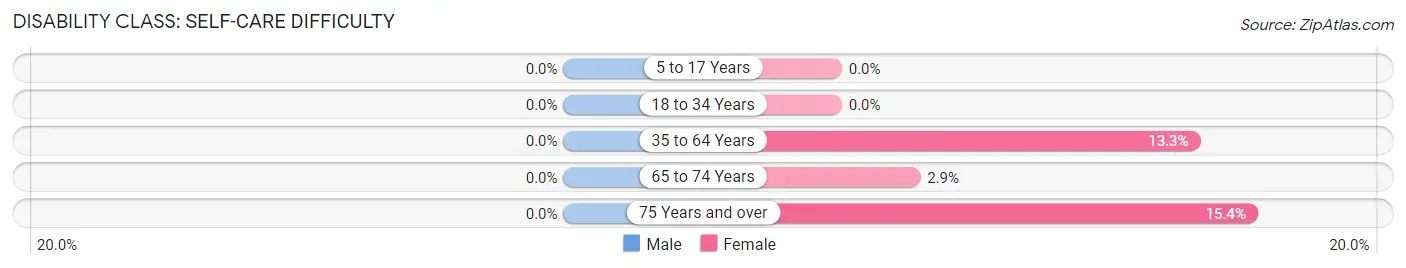
| Age Bracket | Male | Female |
| 5 to 17 Years | 0 (0.0%) | 0 (0.0%) |
| 18 to 34 Years | 0 (0.0%) | 0 (0.0%) |
| 35 to 64 Years | 0 (0.0%) | 68 (13.3%) |
| 65 to 74 Years | 0 (0.0%) | 5 (2.9%) |
| 75 Years and over | 0 (0.0%) | 21 (15.4%) |
Technology Access in Bayview CDP Humboldt County
Computing Device Access in Bayview CDP Humboldt County
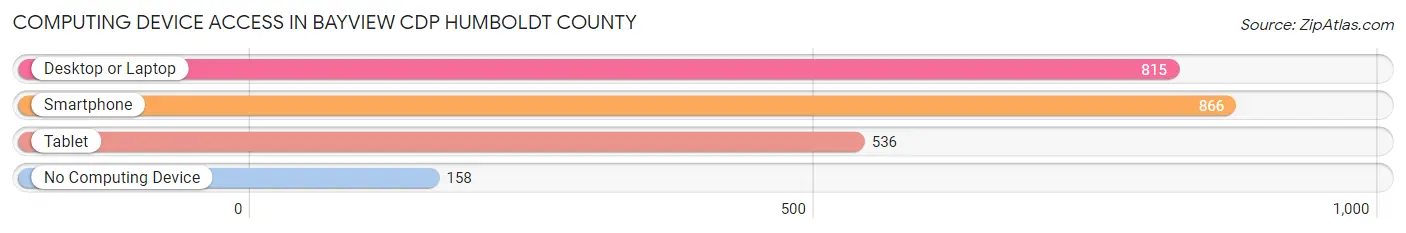
| Device Type | # Households | % Households |
| Desktop or Laptop | 815 | 74.4% |
| Smartphone | 866 | 79.0% |
| Tablet | 536 | 48.9% |
| No Computing Device | 158 | 14.4% |
| Total | 1,096 | 100.0% |
Internet Access in Bayview CDP Humboldt County
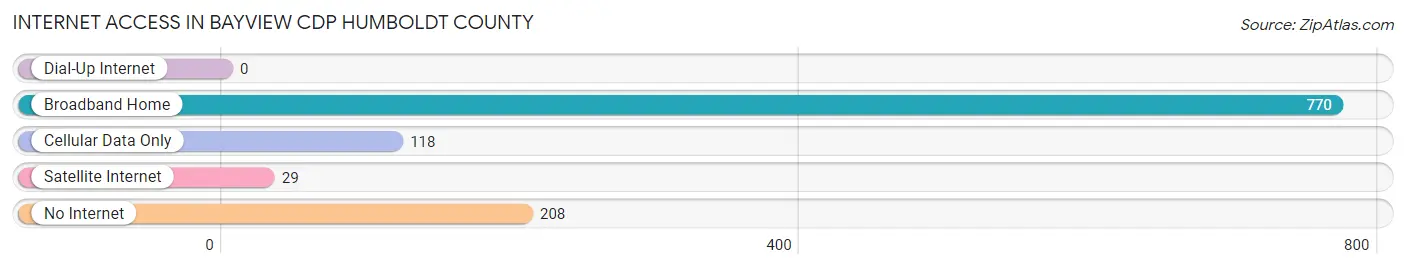
| Internet Type | # Households | % Households |
| Dial-Up Internet | 0 | 0.0% |
| Broadband Home | 770 | 70.3% |
| Cellular Data Only | 118 | 10.8% |
| Satellite Internet | 29 | 2.6% |
| No Internet | 208 | 19.0% |
| Total | 1,096 | 100.0% |
Bayview CDP Humboldt County Summary
Introduction
Bayview Cdp is a census-designated place (CDP) located in Humboldt County, California. It is situated on the northern coast of California, approximately 200 miles north of San Francisco. The population of Bayview Cdp was 1,845 at the 2010 census. The CDP is located in the heart of the Redwood Empire, and is surrounded by lush forests and stunning coastal views.
History
The area that is now Bayview Cdp was originally inhabited by the Wiyot people, who lived in the area for thousands of years before the arrival of European settlers. The first European settlers arrived in the area in the late 1800s, and the town of Bayview was established in 1891. The town was named after the bay that it overlooks, which was named by Spanish explorer Sebastián Vizcaíno in 1603.
The town of Bayview was initially a logging and fishing community, and the local economy was largely based on these industries. In the early 1900s, the town began to grow and develop, and by the 1950s it had become a popular tourist destination. The town was incorporated in 1959, and the population has grown steadily since then.
Geography
Bayview Cdp is located in Humboldt County, California, on the northern coast of the state. It is situated on the Pacific Ocean, approximately 200 miles north of San Francisco. The CDP has a total area of 4.2 square miles, all of which is land.
The terrain of Bayview Cdp is mostly flat, with some rolling hills. The climate is mild and temperate, with cool, wet winters and warm, dry summers. The average annual temperature is around 55°F, and the average annual precipitation is around 40 inches.
Economy
The economy of Bayview Cdp is largely based on tourism and fishing. The town is a popular destination for tourists, who come to enjoy the stunning coastal views and the lush forests of the Redwood Empire. The local fishing industry is also important to the economy, and the town is home to several commercial fishing boats.
In addition to tourism and fishing, Bayview Cdp is also home to several small businesses, including restaurants, shops, and other services. The town is also home to a number of art galleries, which showcase the work of local artists.
Demographics
As of the 2010 census, the population of Bayview Cdp was 1,845. The racial makeup of the CDP was 87.3% White, 0.7% African American, 0.7% Native American, 0.7% Asian, 0.2% Pacific Islander, 8.2% from other races, and 2.2% from two or more races. Hispanic or Latino of any race were 16.2% of the population.
The median income for a household in Bayview Cdp was $41,250, and the median income for a family was $48,750. The per capita income for the CDP was $20,945. About 11.2% of families and 14.2% of the population were below the poverty line, including 18.2% of those under age 18 and 8.2% of those age 65 or over.
Conclusion
Bayview Cdp is a census-designated place located in Humboldt County, California. It is situated on the northern coast of the state, and is surrounded by lush forests and stunning coastal views. The population of Bayview Cdp was 1,845 at the 2010 census. The economy of the CDP is largely based on tourism and fishing, and the town is home to several small businesses, restaurants, and art galleries. The racial makeup of the CDP is mostly White, with a significant Hispanic or Latino population. The median income for a household in Bayview Cdp was $41,250, and the per capita income was $20,945.
Common Questions
What is Per Capita Income in Bayview CDP Humboldt County?
Per Capita income in Bayview CDP Humboldt County is $31,943.
What is the Median Family Income in Bayview CDP Humboldt County?
Median Family Income in Bayview CDP Humboldt County is $44,375.
What is the Median Household income in Bayview CDP Humboldt County?
Median Household Income in Bayview CDP Humboldt County is $32,553.
What is Income or Wage Gap in Bayview CDP Humboldt County?
Income or Wage Gap in Bayview CDP Humboldt County is 58.4%.
Women in Bayview CDP Humboldt County earn 41.6 cents for every dollar earned by a man.
What is Family Income Deficit in Bayview CDP Humboldt County?
Family Income Deficit in Bayview CDP Humboldt County is $13,381.
Families that are below poverty line in Bayview CDP Humboldt County earn $13,381 less on average than the poverty threshold level.
What is Inequality or Gini Index in Bayview CDP Humboldt County?
Inequality or Gini Index in Bayview CDP Humboldt County is 0.61.
What is the Total Population of Bayview CDP Humboldt County?
Total Population of Bayview CDP Humboldt County is 2,719.
What is the Total Male Population of Bayview CDP Humboldt County?
Total Male Population of Bayview CDP Humboldt County is 1,247.
What is the Total Female Population of Bayview CDP Humboldt County?
Total Female Population of Bayview CDP Humboldt County is 1,472.
What is the Ratio of Males per 100 Females in Bayview CDP Humboldt County?
There are 84.71 Males per 100 Females in Bayview CDP Humboldt County.
What is the Ratio of Females per 100 Males in Bayview CDP Humboldt County?
There are 118.04 Females per 100 Males in Bayview CDP Humboldt County.
What is the Median Population Age in Bayview CDP Humboldt County?
Median Population Age in Bayview CDP Humboldt County is 41.2 Years.
What is the Average Family Size in Bayview CDP Humboldt County
Average Family Size in Bayview CDP Humboldt County is 3.0 People.
What is the Average Household Size in Bayview CDP Humboldt County
Average Household Size in Bayview CDP Humboldt County is 2.5 People.
How Large is the Labor Force in Bayview CDP Humboldt County?
There are 1,247 People in the Labor Forcein in Bayview CDP Humboldt County.
What is the Percentage of People in the Labor Force in Bayview CDP Humboldt County?
57.8% of People are in the Labor Force in Bayview CDP Humboldt County.
What is the Unemployment Rate in Bayview CDP Humboldt County?
Unemployment Rate in Bayview CDP Humboldt County is 9.7%.