Cities with the Highest Percentage of Households Without a Vehicle in Nevada
RELATED REPORTS & OPTIONS
Households without a Cars
Nevada
Compare Cities
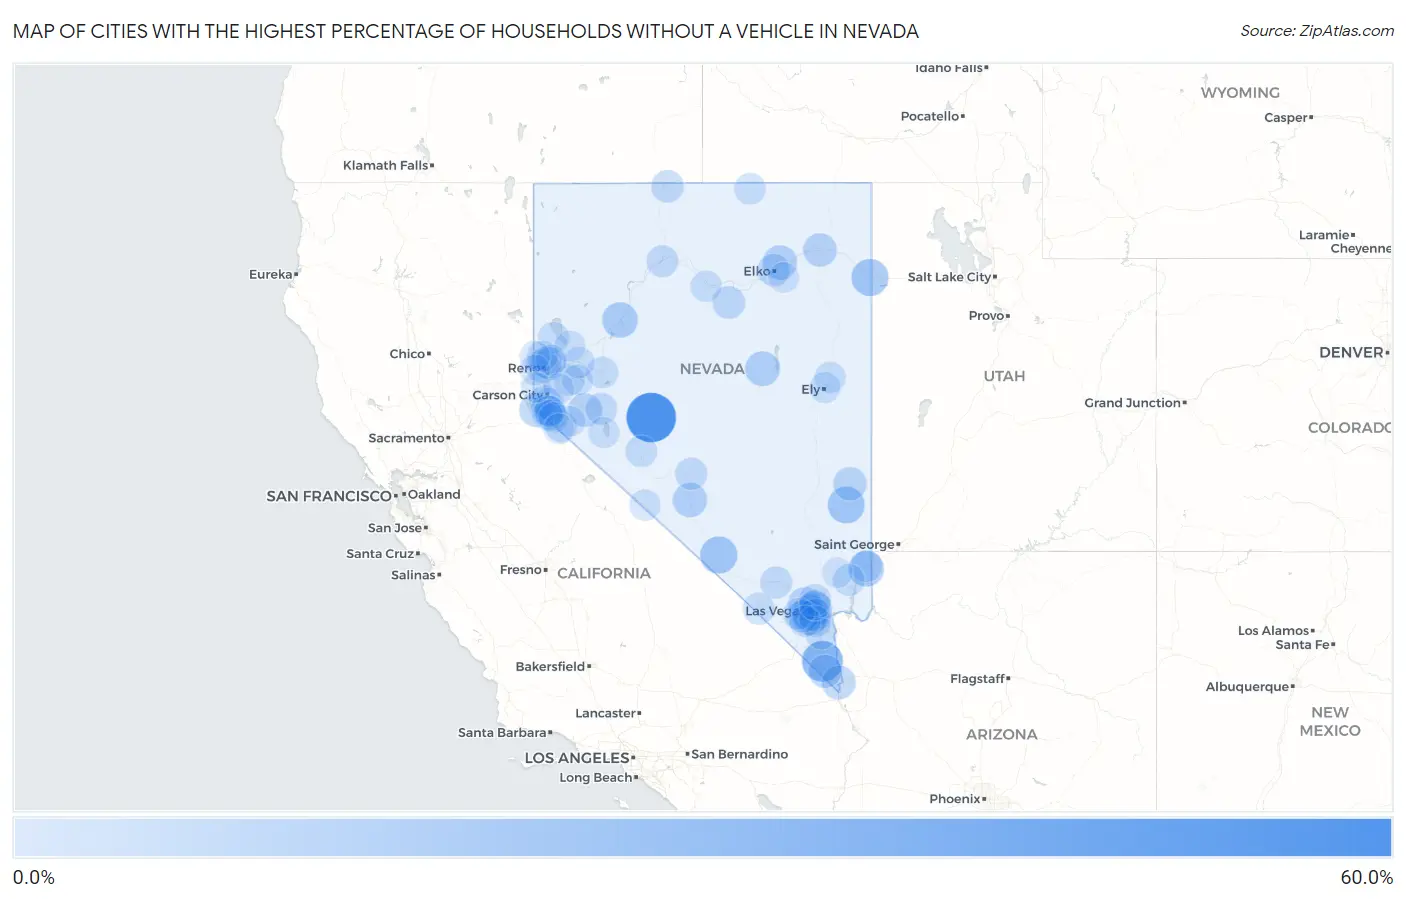
Map of Cities with the Highest Percentage of Households Without a Vehicle in Nevada
0.0%
60.0%
Cities with the Highest Percentage of Households Without a Vehicle in Nevada
| City | Housholds Without a Car | vs State | vs National | |
| 1. | Gabbs | 57.1% | 7.1%(+50.0)#1 | 8.3%(+48.8)#197 |
| 2. | Searchlight | 30.8% | 7.1%(+23.7)#2 | 8.3%(+22.5)#553 |
| 3. | Beatty | 19.8% | 7.1%(+12.7)#3 | 8.3%(+11.5)#1,448 |
| 4. | West Wendover | 19.4% | 7.1%(+12.3)#4 | 8.3%(+11.1)#1,511 |
| 5. | Caliente | 19.3% | 7.1%(+12.2)#5 | 8.3%(+11.0)#1,540 |
| 6. | Winchester | 15.3% | 7.1%(+8.20)#6 | 8.3%(+7.00)#2,566 |
| 7. | Bunkerville | 15.3% | 7.1%(+8.20)#7 | 8.3%(+7.00)#2,588 |
| 8. | Lovelock | 15.0% | 7.1%(+7.90)#8 | 8.3%(+6.70)#2,687 |
| 9. | Paradise | 14.2% | 7.1%(+7.10)#9 | 8.3%(+5.90)#3,005 |
| 10. | Eureka | 13.2% | 7.1%(+6.10)#10 | 8.3%(+4.90)#3,482 |
| 11. | Goldfield | 12.4% | 7.1%(+5.30)#11 | 8.3%(+4.10)#3,922 |
| 12. | Osino | 12.0% | 7.1%(+4.90)#12 | 8.3%(+3.70)#4,146 |
| 13. | Sunrise Manor | 11.8% | 7.1%(+4.70)#13 | 8.3%(+3.50)#4,242 |
| 14. | Laughlin | 10.4% | 7.1%(+3.30)#14 | 8.3%(+2.10)#5,307 |
| 15. | Stateline | 10.4% | 7.1%(+3.30)#15 | 8.3%(+2.10)#5,337 |
| 16. | Yerington | 10.1% | 7.1%(+3.00)#16 | 8.3%(+1.80)#5,590 |
| 17. | Wells | 9.9% | 7.1%(+2.80)#17 | 8.3%(+1.60)#5,784 |
| 18. | Las Vegas | 9.5% | 7.1%(+2.40)#18 | 8.3%(+1.20)#6,095 |
| 19. | Pioche | 9.5% | 7.1%(+2.40)#19 | 8.3%(+1.20)#6,157 |
| 20. | Cal Nev Ari | 8.8% | 7.1%(+1.70)#20 | 8.3%(+0.500)#6,975 |
| 21. | Reno | 8.5% | 7.1%(+1.40)#21 | 8.3%(+0.200)#7,213 |
| 22. | Whitney | 7.6% | 7.1%(+0.500)#22 | 8.3%(-0.700)#8,388 |
| 23. | Crescent Valley | 7.4% | 7.1%(+0.300)#23 | 8.3%(-0.900)#8,773 |
| 24. | Elko | 6.9% | 7.1%(-0.200)#24 | 8.3%(-1.40)#9,431 |
| 25. | Fort Mcdermitt | 6.5% | 7.1%(-0.600)#25 | 8.3%(-1.80)#10,205 |
| 26. | Carson | 6.3% | 7.1%(-0.800)#26 | 8.3%(-2.00)#10,398 |
| 27. | Spring Valley | 6.1% | 7.1%(-1.000)#27 | 8.3%(-2.20)#10,751 |
| 28. | Tonopah | 5.8% | 7.1%(-1.30)#28 | 8.3%(-2.50)#11,416 |
| 29. | Indian Springs | 5.3% | 7.1%(-1.80)#29 | 8.3%(-3.00)#12,449 |
| 30. | North Las Vegas | 5.2% | 7.1%(-1.90)#30 | 8.3%(-3.10)#12,511 |
| 31. | Winnemucca | 5.2% | 7.1%(-1.90)#31 | 8.3%(-3.10)#12,547 |
| 32. | Sparks | 5.1% | 7.1%(-2.00)#32 | 8.3%(-3.20)#12,707 |
| 33. | Schurz | 5.1% | 7.1%(-2.00)#33 | 8.3%(-3.20)#12,822 |
| 34. | Sun Valley | 5.0% | 7.1%(-2.10)#34 | 8.3%(-3.30)#12,910 |
| 35. | Mesquite | 4.7% | 7.1%(-2.40)#35 | 8.3%(-3.60)#13,560 |
| 36. | Pahrump | 4.5% | 7.1%(-2.60)#36 | 8.3%(-3.80)#13,934 |
| 37. | Moapa Valley | 4.5% | 7.1%(-2.60)#37 | 8.3%(-3.80)#13,988 |
| 38. | Mina | 4.4% | 7.1%(-2.70)#38 | 8.3%(-3.90)#14,348 |
| 39. | Fallon | 4.3% | 7.1%(-2.80)#39 | 8.3%(-4.00)#14,394 |
| 40. | Indian Hills | 4.3% | 7.1%(-2.80)#40 | 8.3%(-4.00)#14,414 |
| 41. | Henderson | 4.0% | 7.1%(-3.10)#41 | 8.3%(-4.30)#15,032 |
| 42. | Summerlin South | 3.8% | 7.1%(-3.30)#42 | 8.3%(-4.50)#15,519 |
| 43. | Johnson Lane | 3.7% | 7.1%(-3.40)#43 | 8.3%(-4.60)#15,844 |
| 44. | Minden | 3.7% | 7.1%(-3.40)#44 | 8.3%(-4.60)#15,869 |
| 45. | Topaz Ranch Estates | 3.7% | 7.1%(-3.40)#45 | 8.3%(-4.60)#15,901 |
| 46. | Owyhee | 3.7% | 7.1%(-3.40)#46 | 8.3%(-4.60)#15,930 |
| 47. | Boulder City | 3.6% | 7.1%(-3.50)#47 | 8.3%(-4.70)#16,055 |
| 48. | Enterprise | 3.4% | 7.1%(-3.70)#48 | 8.3%(-4.90)#16,515 |
| 49. | Sutcliffe | 3.4% | 7.1%(-3.70)#49 | 8.3%(-4.90)#16,721 |
| 50. | Gardnerville | 3.3% | 7.1%(-3.80)#50 | 8.3%(-5.00)#16,817 |
| 51. | Stagecoach | 3.2% | 7.1%(-3.90)#51 | 8.3%(-5.10)#17,104 |
| 52. | Battle Mountain | 3.1% | 7.1%(-4.00)#52 | 8.3%(-5.20)#17,304 |
| 53. | Ruhenstroth | 3.1% | 7.1%(-4.00)#53 | 8.3%(-5.20)#17,354 |
| 54. | Mcgill | 3.1% | 7.1%(-4.00)#54 | 8.3%(-5.20)#17,394 |
| 55. | Fernley | 2.8% | 7.1%(-4.30)#55 | 8.3%(-5.50)#17,996 |
| 56. | Lemmon Valley | 2.8% | 7.1%(-4.30)#56 | 8.3%(-5.50)#18,044 |
| 57. | Ely | 2.8% | 7.1%(-4.30)#57 | 8.3%(-5.50)#18,060 |
| 58. | Dyer | 2.8% | 7.1%(-4.30)#58 | 8.3%(-5.50)#18,195 |
| 59. | Nellis Afb | 2.7% | 7.1%(-4.40)#59 | 8.3%(-5.60)#18,313 |
| 60. | Nixon | 2.7% | 7.1%(-4.40)#60 | 8.3%(-5.60)#18,447 |
| 61. | Silver Springs | 2.6% | 7.1%(-4.50)#61 | 8.3%(-5.70)#18,534 |
| 62. | Walker Lake | 2.5% | 7.1%(-4.60)#62 | 8.3%(-5.80)#18,945 |
| 63. | Spanish Springs | 2.2% | 7.1%(-4.90)#63 | 8.3%(-6.10)#19,515 |
| 64. | Dayton | 1.8% | 7.1%(-5.30)#64 | 8.3%(-6.50)#20,523 |
| 65. | Smith Valley | 1.6% | 7.1%(-5.50)#65 | 8.3%(-6.70)#21,103 |
| 66. | East Valley | 1.4% | 7.1%(-5.70)#66 | 8.3%(-6.90)#21,577 |
| 67. | Spring Creek | 1.3% | 7.1%(-5.80)#67 | 8.3%(-7.00)#21,724 |
| 68. | Verdi | 1.3% | 7.1%(-5.80)#68 | 8.3%(-7.00)#21,847 |
| 69. | Gardnerville Ranchos | 1.1% | 7.1%(-6.00)#69 | 8.3%(-7.20)#22,202 |
| 70. | Cold Springs | 1.1% | 7.1%(-6.00)#70 | 8.3%(-7.20)#22,206 |
| 71. | Carter Springs | 1.1% | 7.1%(-6.00)#71 | 8.3%(-7.20)#22,363 |
| 72. | Topaz Lake | 1.1% | 7.1%(-6.00)#72 | 8.3%(-7.20)#22,401 |
| 73. | Incline Village | 0.80% | 7.1%(-6.30)#73 | 8.3%(-7.50)#22,904 |
| 74. | Moapa Town | 0.70% | 7.1%(-6.40)#74 | 8.3%(-7.60)#23,206 |
1
2Common Questions
What are the Top 10 Cities with the Highest Percentage of Households Without a Vehicle in Nevada?
Top 10 Cities with the Highest Percentage of Households Without a Vehicle in Nevada are:
#1
57.1%
#2
30.8%
#3
19.8%
#4
19.4%
#5
19.3%
#6
15.3%
#7
15.3%
#8
15.0%
#9
14.2%
#10
13.2%
What city has the Highest Percentage of Households Without a Vehicle in Nevada?
Gabbs has the Highest Percentage of Households Without a Vehicle in Nevada with 57.1%.
What is the Percentage of Households Without a Vehicle in the State of Nevada?
Percentage of Households Without a Vehicle in Nevada is 7.1%.
What is the Percentage of Households Without a Vehicle in the United States?
Percentage of Households Without a Vehicle in the United States is 8.3%.