Zip Codes with the Highest Percentage of Households Without a Vehicle in Sacramento, CA

RELATED REPORTS & OPTIONS

Households without a Cars
Population
Families and Households
Female Fertility
Female Fertility (Unmarried)
Race (Community Size)
Race (Percentage)
Ancestry (Community Size)
AfghanAfricanAlbanianAleutAmericanApacheArabArgentineanArmenianAssyrian / Chaldean / SyriacAustralianAustrianBangladeshiBarbadianBasqueBelgianBelizeanBhutaneseBlackfeetBolivianBrazilianBritishBritish West IndianBulgarianBurmeseCajunCambodianCanadianCape VerdeanCelticCentral AmericanCentral American IndianCherokeeChickasawChileanChippewaChoctawColombianComancheCosta RicanCreeCreekCroatianCrowCubanCzechCzechoslovakianDanishDominicanDutchEastern EuropeanEcuadorianEgyptianEnglishEstonianEthiopianEuropeanFijianFilipinoFinnishFrenchFrench American IndianFrench CanadianGermanGerman RussianGhanaianGreekGuamanian / ChamorroGuatemalanGuyaneseHaitianHonduranHopiHungarianIcelanderIndian (Asian)IndonesianInupiatIranianIraqiIrishIroquoisIsraeliItalianJamaicanJapaneseJordanianKenyanKoreanLaotianLatvianLebaneseLiberianLithuanianLuxembourgerMalaysianMalteseMenomineeMexicanMexican American IndianMongolianMoroccanNative HawaiianNavajoNepaleseNicaraguanNigerianNorthern EuropeanNorwegianOkinawanOsagePaiutePakistaniPalestinianPanamanianPennsylvania GermanPeruvianPimaPolishPortuguesePotawatomiPuebloPuerto RicanPuget Sound SalishRomanianRussianSalvadoranSamoanScandinavianScotch-IrishScottishSeminoleSenegaleseSerbianShoshoneSierra LeoneanSiouxSlavicSlovakSloveneSouth AfricanSouth AmericanSouth American IndianSpaniardSpanishSpanish AmericanSpanish American IndianSri LankanSubsaharan AfricanSwedishSwissSyrianTaiwaneseThaiTlingit-HaidaTohono O'OdhamTonganTrinidadian and TobagonianTurkishUgandanUkrainianVenezuelanVietnameseWelshWest IndianYaquiYugoslavian
Ancestry (Percentage)
AfghanAfricanAlbanianAleutAmericanApacheArabArgentineanArmenianAssyrian / Chaldean / SyriacAustralianAustrianBangladeshiBarbadianBasqueBelgianBelizeanBhutaneseBlackfeetBolivianBrazilianBritishBritish West IndianBulgarianBurmeseCajunCambodianCanadianCape VerdeanCelticCentral AmericanCentral American IndianCherokeeChickasawChileanChippewaChoctawColombianComancheCosta RicanCreeCreekCroatianCrowCubanCzechCzechoslovakianDanishDominicanDutchEastern EuropeanEcuadorianEgyptianEnglishEstonianEthiopianEuropeanFijianFilipinoFinnishFrenchFrench American IndianFrench CanadianGermanGerman RussianGhanaianGreekGuamanian / ChamorroGuatemalanGuyaneseHaitianHonduranHopiHungarianIcelanderIndian (Asian)IndonesianInupiatIranianIraqiIrishIroquoisIsraeliItalianJamaicanJapaneseJordanianKenyanKoreanLaotianLatvianLebaneseLiberianLithuanianLuxembourgerMalaysianMalteseMenomineeMexicanMexican American IndianMongolianMoroccanNative HawaiianNavajoNepaleseNicaraguanNigerianNorthern EuropeanNorwegianOkinawanOsagePaiutePakistaniPalestinianPanamanianPennsylvania GermanPeruvianPimaPolishPortuguesePotawatomiPuebloPuerto RicanPuget Sound SalishRomanianRussianSalvadoranSamoanScandinavianScotch-IrishScottishSeminoleSenegaleseSerbianShoshoneSierra LeoneanSiouxSlavicSlovakSloveneSouth AfricanSouth AmericanSouth American IndianSpaniardSpanishSpanish AmericanSpanish American IndianSri LankanSubsaharan AfricanSwedishSwissSyrianTaiwaneseThaiTlingit-HaidaTohono O'OdhamTonganTrinidadian and TobagonianTurkishUgandanUkrainianVenezuelanVietnameseWelshWest IndianYaquiYugoslavian
Immigrant Origin (Total)
AfghanistanAfricaArgentinaArmeniaAsiaAustraliaAustriaAzoresBangladeshBelarusBelizeBoliviaBosnia and HerzegovinaBrazilBulgariaBurma / MyanmarCabo VerdeCambodiaCameroonCanadaCaribbeanCentral AmericaChileChinaColombiaCosta RicaCroatiaCubaCzechoslovakiaDenmarkDominican RepublicEastern AfricaEastern AsiaEastern EuropeEcuadorEgyptEl SalvadorEnglandEritreaEthiopiaEuropeFijiFranceGermanyGhanaGreeceGuatemalaGuyanaHaitiHondurasHong KongHungaryIndiaIndonesiaIranIraqIrelandIsraelItalyJamaicaJapanJordanKazakhstanKenyaKoreaKuwaitLaosLatin AmericaLatviaLebanonLiberiaLithuaniaMalaysiaMexicoMicronesiaMiddle AfricaMoldovaMoroccoNepalNetherlandsNicaraguaNigeriaNorth MacedoniaNorthern AfricaNorthern EuropeNorwayOceaniaPakistanPanamaPeruPhilippinesPolandPortugalRomaniaRussiaSaudi ArabiaScotlandSenegalSerbiaSierra LeoneSingaporeSomaliaSouth AfricaSouth AmericaSouth Central AsiaSouth Eastern AsiaSouthern EuropeSpainSri LankaSudanSwedenSwitzerlandSyriaTaiwanThailandTrinidad and TobagoTurkeyUgandaUkraineUzbekistanVenezuelaVietnamWestern AfricaWestern AsiaWestern EuropeZimbabwe
Immigrant Origin (Percentage)
AfghanistanAfricaArgentinaArmeniaAsiaAustraliaAustriaAzoresBangladeshBelarusBelizeBoliviaBosnia and HerzegovinaBrazilBulgariaBurma / MyanmarCabo VerdeCambodiaCameroonCanadaCaribbeanCentral AmericaChileChinaColombiaCosta RicaCroatiaCubaCzechoslovakiaDenmarkDominican RepublicEastern AfricaEastern AsiaEastern EuropeEcuadorEgyptEl SalvadorEnglandEritreaEthiopiaEuropeFijiFranceGermanyGhanaGreeceGuatemalaGuyanaHaitiHondurasHong KongHungaryIndiaIndonesiaIranIraqIrelandIsraelItalyJamaicaJapanJordanKazakhstanKenyaKoreaKuwaitLaosLatin AmericaLatviaLebanonLiberiaLithuaniaMalaysiaMexicoMicronesiaMiddle AfricaMoldovaMoroccoNepalNetherlandsNicaraguaNigeriaNorth MacedoniaNorthern AfricaNorthern EuropeNorwayOceaniaPakistanPanamaPeruPhilippinesPolandPortugalRomaniaRussiaSaudi ArabiaScotlandSenegalSerbiaSierra LeoneSingaporeSomaliaSouth AfricaSouth AmericaSouth Central AsiaSouth Eastern AsiaSouthern EuropeSpainSri LankaSudanSwedenSwitzerlandSyriaTaiwanThailandTrinidad and TobagoTurkeyUgandaUkraineUzbekistanVenezuelaVietnamWestern AfricaWestern AsiaWestern EuropeZimbabwe
Income
Income (Families)
Income (Households)
Poverty
Poverty (Families)
Unemployment
Employment Occupations
Employment Industries
Employer Class
Commute Time
Commute Means
School Enrollment
Education by Degree Field
Occupancy
Finances
Physical Characteristics
Sacramento
States
California Cities
AlamedaAlhambraAnaheimAntiochApple ValleyArcadiaAuburnBakersfieldBerkeleyBeverly HillsBuena ParkBurbankCamarilloCanoga ParkCanyon CountryCarlsbadCarsonCastro ValleyChicoChinoChula VistaCitrus HeightsClovisComptonConcordCoronaCosta MesaCovinaCulver CityDaly CityDanvilleDavisDesert Hot SpringsDowneyDuarteEl CajonEl MonteElk GroveEncinoEscondidoEurekaFairfieldFontanaFremontFresnoFullertonGarden GroveGardenaGlendaleGlendoraGrass ValleyHaywardHemetHesperiaHuntington BeachIndioInglewoodIrvineLa MesaLa PuenteLake ElsinoreLakewoodLancasterLivermoreLodiLong BeachLos AltosLos AngelesLos GatosMaderaMantecaMenifeeMercedMission ViejoModestoMonterey ParkMoreno ValleyMountain ViewMurrietaNapaNewport BeachNorth HollywoodNorthridgeNovatoOaklandOceansideOntarioOrangeOrovilleOxnardPalm DesertPalm SpringsPalmdalePalo AltoPasadenaPerrisPetalumaPleasantonPomonaPortervilleRancho CordovaRancho CucamongaRancho Santa FeReddingRedlandsRedondo BeachRedwood CityRialtoRichmondRiversideRocklinRosevilleSacramentoSalinasSan BernardinoSan ClementeSan DiegoSan FranciscoSan GabrielSan JacintoSan JoseSan LeandroSan Luis ObispoSan MarcosSan MateoSan PedroSan RafaelSan RamonSanta AnaSanta BarbaraSanta ClaraSanta ClaritaSanta CruzSanta MariaSanta MonicaSanta RosaSherman OaksSimi ValleySpring ValleyStocktonSunnyvaleTemeculaThousand OaksTorranceTracyTurlockTustinUplandVacavilleValenciaVallejoVan NuysVenturaVictorvilleVisaliaVistaWalnut CreekWest CovinaWest SacramentoWhittierWoodlandWoodland HillsYorba LindaYuba City
Compare Zip Codes
Comparison Subject

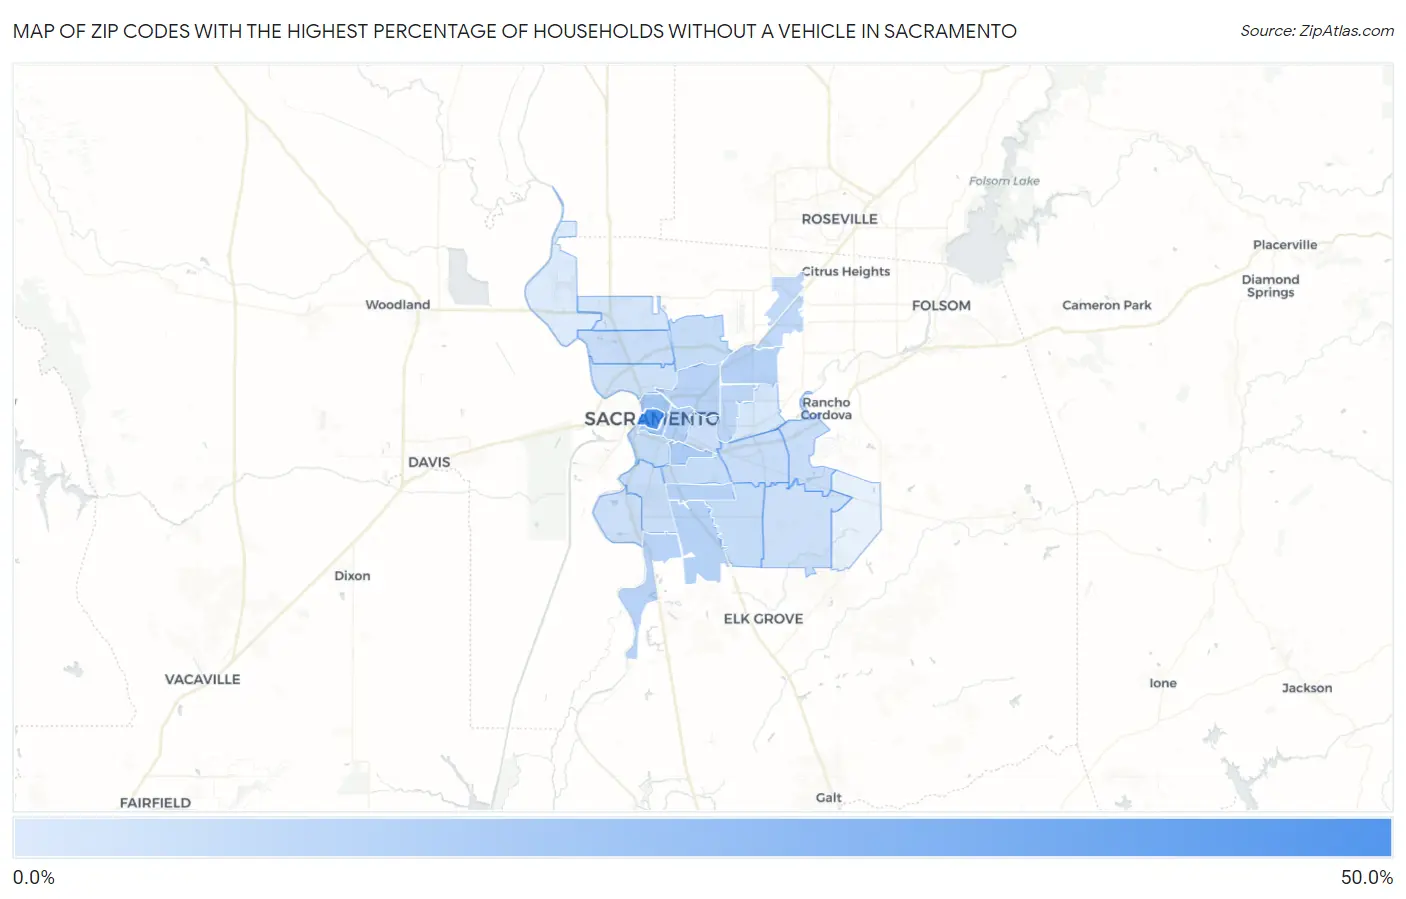
Map of Zip Codes with the Highest Percentage of Households Without a Vehicle in Sacramento

0.0%
50.0%
Zip Codes with the Highest Percentage of Households Without a Vehicle in Sacramento Map

Zip Codes with the Highest Percentage of Households Without a Vehicle in Sacramento, CA

Zip Code Housholds Without a Car vs State vs National
1.9581441.4%6.9%(+34.5)#198.3%(+33.1)#483
2.9581115.0%6.9%(+8.10)#1128.3%(+6.70)#2,389
3.9581713.0%6.9%(+6.10)#1528.3%(+4.70)#3,095
4.9581610.7%6.9%(+3.80)#2008.3%(+2.40)#4,315
5.9582410.3%6.9%(+3.40)#2198.3%(+2.00)#4,625
6.9582110.1%6.9%(+3.20)#2258.3%(+1.80)#4,767
7.9582310.0%6.9%(+3.10)#2328.3%(+1.70)#4,833
8.958159.7%6.9%(+2.80)#2448.3%(+1.40)#5,105
9.958329.3%6.9%(+2.40)#2648.3%(+1.00)#5,452
10.958258.7%6.9%(+1.80)#2988.3%(+0.400)#6,059
11.958418.0%6.9%(+1.10)#3588.3%(-0.300)#6,927
12.958427.2%6.9%(+0.300)#4358.3%(-1.10)#8,197
13.958386.4%6.9%(-0.500)#5328.3%(-1.90)#9,561
14.958186.4%6.9%(-0.500)#5398.3%(-1.90)#9,590
15.958206.2%6.9%(-0.700)#5688.3%(-2.10)#9,984
16.958286.1%6.9%(-0.800)#5798.3%(-2.20)#10,170
17.958275.8%6.9%(-1.10)#6448.3%(-2.50)#10,923
18.958225.6%6.9%(-1.30)#6668.3%(-2.70)#11,346
19.958265.6%6.9%(-1.30)#6678.3%(-2.70)#11,351
20.958345.4%6.9%(-1.50)#6908.3%(-2.90)#11,840
21.958195.0%6.9%(-1.90)#7488.3%(-3.30)#12,885
22.958294.8%6.9%(-2.10)#7698.3%(-3.50)#13,355
23.958314.3%6.9%(-2.60)#8548.3%(-4.00)#14,771
24.958333.8%6.9%(-3.10)#9668.3%(-4.50)#16,333
25.958352.9%6.9%(-4.00)#1,1408.3%(-5.40)#19,381
26.958642.3%6.9%(-4.60)#1,2508.3%(-6.00)#21,390
27.958370.80%6.9%(-6.10)#1,4568.3%(-7.50)#26,317

Common Questions

What are the Top 10 Zip Codes with the Highest Percentage of Households Without a Vehicle in Sacramento, CA?
Top 10 Zip Codes with the Highest Percentage of Households Without a Vehicle in Sacramento, CA are:
#1
41.4%
#2
15.0%
#3
13.0%
#4
10.7%
#5
10.3%
#6
10.1%
#7
10.0%
#8
9.7%
#9
9.3%
#10
8.7%
What zip code has the Highest Percentage of Households Without a Vehicle in Sacramento, CA?
95814 has the Highest Percentage of Households Without a Vehicle in Sacramento, CA with 41.4%.
What is the Percentage of Households Without a Vehicle in Sacramento, CA?
Percentage of Households Without a Vehicle in Sacramento is 8.0%.
What is the Percentage of Households Without a Vehicle in California?
Percentage of Households Without a Vehicle in California is 6.9%.
What is the Percentage of Households Without a Vehicle in the United States?
Percentage of Households Without a Vehicle in the United States is 8.3%.