Cities with the Highest Percentage of Households Without a Vehicle in Virginia
RELATED REPORTS & OPTIONS
Households without a Cars
Virginia
Compare Cities
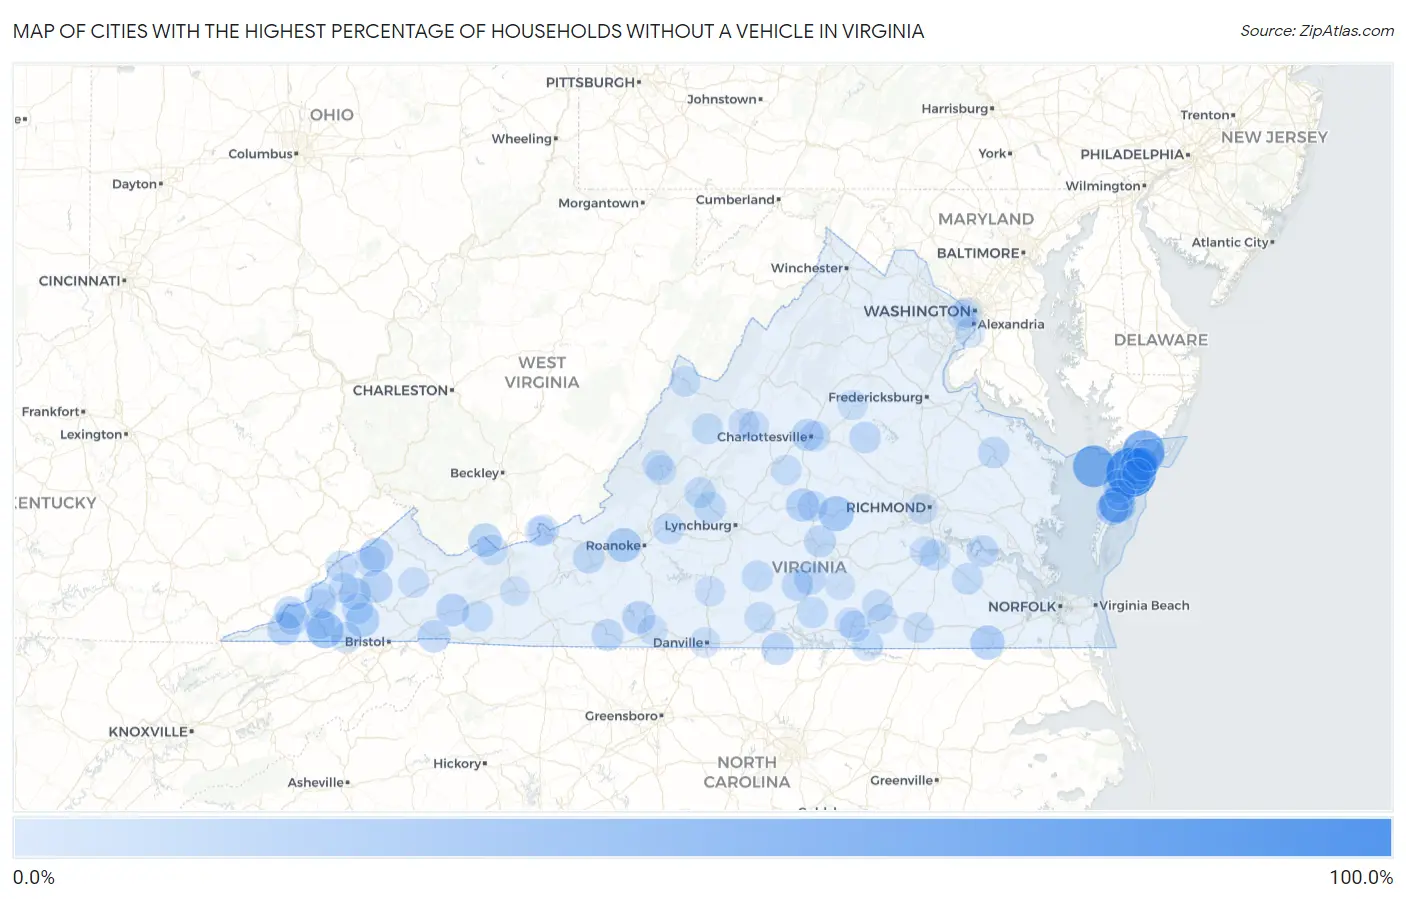
Map of Cities with the Highest Percentage of Households Without a Vehicle in Virginia
0.0%
100.0%
Cities with the Highest Percentage of Households Without a Vehicle in Virginia
| City | Housholds Without a Car | vs State | vs National | |
| 1. | Whitesville | 90.7% | 6.1%(+84.6)#1 | 8.3%(+82.4)#93 |
| 2. | Locust Mount | 64.6% | 6.1%(+58.5)#2 | 8.3%(+56.3)#171 |
| 3. | Oak Hall | 59.5% | 6.1%(+53.4)#3 | 8.3%(+51.2)#188 |
| 4. | Tangier | 58.7% | 6.1%(+52.6)#4 | 8.3%(+50.4)#190 |
| 5. | Mcdowell | 53.3% | 6.1%(+47.2)#5 | 8.3%(+45.0)#220 |
| 6. | Nelsonia | 41.4% | 6.1%(+35.3)#6 | 8.3%(+33.1)#329 |
| 7. | Clinchport | 38.1% | 6.1%(+32.0)#7 | 8.3%(+29.8)#368 |
| 8. | Cats Bridge | 37.5% | 6.1%(+31.4)#8 | 8.3%(+29.2)#382 |
| 9. | Kincora | 35.6% | 6.1%(+29.5)#9 | 8.3%(+27.3)#416 |
| 10. | Willis Wharf | 33.8% | 6.1%(+27.7)#10 | 8.3%(+25.5)#465 |
| 11. | Cumberland | 31.9% | 6.1%(+25.8)#11 | 8.3%(+23.6)#524 |
| 12. | Savage Town | 31.3% | 6.1%(+25.2)#12 | 8.3%(+23.0)#537 |
| 13. | Cliftondale Park | 29.6% | 6.1%(+23.5)#13 | 8.3%(+21.3)#612 |
| 14. | Glenvar | 29.2% | 6.1%(+23.1)#14 | 8.3%(+20.9)#626 |
| 15. | Southampton Meadows | 28.8% | 6.1%(+22.7)#15 | 8.3%(+20.5)#645 |
| 16. | Nickelsville | 27.6% | 6.1%(+21.5)#16 | 8.3%(+19.3)#699 |
| 17. | Breaks | 27.1% | 6.1%(+21.0)#17 | 8.3%(+18.8)#722 |
| 18. | Savageville | 26.6% | 6.1%(+20.5)#18 | 8.3%(+18.3)#751 |
| 19. | Pastoria | 26.3% | 6.1%(+20.2)#19 | 8.3%(+18.0)#768 |
| 20. | Haysi | 25.8% | 6.1%(+19.7)#20 | 8.3%(+17.5)#799 |
| 21. | Pocahontas | 25.3% | 6.1%(+19.2)#21 | 8.3%(+17.0)#829 |
| 22. | Mappsville | 24.7% | 6.1%(+18.6)#22 | 8.3%(+16.4)#877 |
| 23. | Buckingham Courthouse | 24.6% | 6.1%(+18.5)#23 | 8.3%(+16.3)#882 |
| 24. | Falls Mills | 24.3% | 6.1%(+18.2)#24 | 8.3%(+16.0)#903 |
| 25. | Exmore | 24.2% | 6.1%(+18.1)#25 | 8.3%(+15.9)#908 |
| 26. | Bassett | 23.9% | 6.1%(+17.8)#26 | 8.3%(+15.6)#934 |
| 27. | Jonesville | 23.8% | 6.1%(+17.7)#27 | 8.3%(+15.5)#943 |
| 28. | Dante | 23.5% | 6.1%(+17.4)#28 | 8.3%(+15.2)#970 |
| 29. | Seven Mile Ford | 23.4% | 6.1%(+17.3)#29 | 8.3%(+15.1)#981 |
| 30. | Rio | 22.5% | 6.1%(+16.4)#30 | 8.3%(+14.2)#1,053 |
| 31. | Virgilina | 22.4% | 6.1%(+16.3)#31 | 8.3%(+14.1)#1,072 |
| 32. | Pennington Gap | 22.1% | 6.1%(+16.0)#32 | 8.3%(+13.8)#1,103 |
| 33. | Baywood | 22.0% | 6.1%(+15.9)#33 | 8.3%(+13.7)#1,124 |
| 34. | Damascus | 21.8% | 6.1%(+15.7)#34 | 8.3%(+13.5)#1,153 |
| 35. | St Charles | 21.4% | 6.1%(+15.3)#35 | 8.3%(+13.1)#1,206 |
| 36. | Riverview | 21.3% | 6.1%(+15.2)#36 | 8.3%(+13.0)#1,217 |
| 37. | University Of Virginia | 20.6% | 6.1%(+14.5)#37 | 8.3%(+12.3)#1,316 |
| 38. | Stuart | 19.9% | 6.1%(+13.8)#38 | 8.3%(+11.6)#1,427 |
| 39. | Claremont | 19.7% | 6.1%(+13.6)#39 | 8.3%(+11.4)#1,462 |
| 40. | Farmville | 19.6% | 6.1%(+13.5)#40 | 8.3%(+11.3)#1,471 |
| 41. | Keysville | 19.6% | 6.1%(+13.5)#41 | 8.3%(+11.3)#1,487 |
| 42. | Atlantic | 19.4% | 6.1%(+13.3)#42 | 8.3%(+11.1)#1,520 |
| 43. | Tappahannock | 19.3% | 6.1%(+13.2)#43 | 8.3%(+11.0)#1,536 |
| 44. | Drakes Branch | 19.2% | 6.1%(+13.1)#44 | 8.3%(+10.9)#1,558 |
| 45. | Merrimac | 19.0% | 6.1%(+12.9)#45 | 8.3%(+10.7)#1,575 |
| 46. | Louisa | 19.0% | 6.1%(+12.9)#46 | 8.3%(+10.7)#1,577 |
| 47. | Big Island | 18.6% | 6.1%(+12.5)#47 | 8.3%(+10.3)#1,665 |
| 48. | Brookneal | 18.4% | 6.1%(+12.3)#48 | 8.3%(+10.1)#1,700 |
| 49. | Appalachia | 18.1% | 6.1%(+12.0)#49 | 8.3%(+9.80)#1,754 |
| 50. | Pound | 18.0% | 6.1%(+11.9)#50 | 8.3%(+9.70)#1,777 |
| 51. | Dungannon | 17.8% | 6.1%(+11.7)#51 | 8.3%(+9.50)#1,840 |
| 52. | Waverly | 17.7% | 6.1%(+11.6)#52 | 8.3%(+9.40)#1,847 |
| 53. | Glasgow | 17.7% | 6.1%(+11.6)#53 | 8.3%(+9.40)#1,852 |
| 54. | Moneta | 17.6% | 6.1%(+11.5)#54 | 8.3%(+9.30)#1,880 |
| 55. | Ebony | 17.4% | 6.1%(+11.3)#55 | 8.3%(+9.10)#1,943 |
| 56. | Montvale | 17.3% | 6.1%(+11.2)#56 | 8.3%(+9.00)#1,962 |
| 57. | Sugar Grove | 17.2% | 6.1%(+11.1)#57 | 8.3%(+8.90)#1,980 |
| 58. | Chase City | 17.1% | 6.1%(+11.0)#58 | 8.3%(+8.80)#2,000 |
| 59. | Halifax | 17.1% | 6.1%(+11.0)#59 | 8.3%(+8.80)#2,001 |
| 60. | Weber City | 16.7% | 6.1%(+10.6)#60 | 8.3%(+8.40)#2,098 |
| 61. | La Crosse | 16.7% | 6.1%(+10.6)#61 | 8.3%(+8.40)#2,105 |
| 62. | Stickleyville | 16.7% | 6.1%(+10.6)#62 | 8.3%(+8.40)#2,114 |
| 63. | Craigsville | 16.6% | 6.1%(+10.5)#63 | 8.3%(+8.30)#2,143 |
| 64. | Petersburg | 16.5% | 6.1%(+10.4)#64 | 8.3%(+8.20)#2,154 |
| 65. | Alberta | 16.1% | 6.1%(+10.00)#65 | 8.3%(+7.80)#2,296 |
| 66. | Duffield | 16.1% | 6.1%(+10.00)#66 | 8.3%(+7.80)#2,299 |
| 67. | Emporia | 16.0% | 6.1%(+9.90)#67 | 8.3%(+7.70)#2,307 |
| 68. | Pantops | 15.8% | 6.1%(+9.70)#68 | 8.3%(+7.50)#2,381 |
| 69. | Jolivue | 15.8% | 6.1%(+9.70)#69 | 8.3%(+7.50)#2,397 |
| 70. | Keller | 15.8% | 6.1%(+9.70)#70 | 8.3%(+7.50)#2,409 |
| 71. | Dillwyn | 15.7% | 6.1%(+9.60)#71 | 8.3%(+7.40)#2,442 |
| 72. | Rich Creek | 15.4% | 6.1%(+9.30)#72 | 8.3%(+7.10)#2,546 |
| 73. | Schuyler | 15.4% | 6.1%(+9.30)#73 | 8.3%(+7.10)#2,551 |
| 74. | Metompkin | 15.4% | 6.1%(+9.30)#74 | 8.3%(+7.10)#2,553 |
| 75. | Bluefield | 15.2% | 6.1%(+9.10)#75 | 8.3%(+6.90)#2,612 |
| 76. | Monterey | 15.1% | 6.1%(+9.00)#76 | 8.3%(+6.80)#2,670 |
| 77. | Honaker | 14.9% | 6.1%(+8.80)#77 | 8.3%(+6.60)#2,729 |
| 78. | Seven Corners | 14.8% | 6.1%(+8.70)#78 | 8.3%(+6.50)#2,753 |
| 79. | Hybla Valley | 14.6% | 6.1%(+8.50)#79 | 8.3%(+6.30)#2,822 |
| 80. | Clinchco | 14.5% | 6.1%(+8.40)#80 | 8.3%(+6.20)#2,903 |
| 81. | Eggleston | 14.3% | 6.1%(+8.20)#81 | 8.3%(+6.00)#2,997 |
| 82. | Richmond | 14.2% | 6.1%(+8.10)#82 | 8.3%(+5.90)#3,004 |
| 83. | Arlington | 14.1% | 6.1%(+8.00)#83 | 8.3%(+5.80)#3,045 |
| 84. | Fishersville | 14.1% | 6.1%(+8.00)#84 | 8.3%(+5.80)#3,050 |
| 85. | Wise | 14.1% | 6.1%(+8.00)#85 | 8.3%(+5.80)#3,057 |
| 86. | Danville | 13.9% | 6.1%(+7.80)#86 | 8.3%(+5.60)#3,128 |
| 87. | Orange | 13.9% | 6.1%(+7.80)#87 | 8.3%(+5.60)#3,142 |
| 88. | South Hill | 13.9% | 6.1%(+7.80)#88 | 8.3%(+5.60)#3,143 |
| 89. | Gretna | 13.9% | 6.1%(+7.80)#89 | 8.3%(+5.60)#3,155 |
| 90. | Clifton Forge | 13.8% | 6.1%(+7.70)#90 | 8.3%(+5.50)#3,188 |
| 91. | Glen Lyn | 13.8% | 6.1%(+7.70)#91 | 8.3%(+5.50)#3,218 |
| 92. | Lawrenceville | 13.7% | 6.1%(+7.60)#92 | 8.3%(+5.40)#3,244 |
| 93. | Tacoma | 13.6% | 6.1%(+7.50)#93 | 8.3%(+5.30)#3,306 |
| 94. | Matoaca | 13.4% | 6.1%(+7.30)#94 | 8.3%(+5.10)#3,375 |
| 95. | Victoria | 13.3% | 6.1%(+7.20)#95 | 8.3%(+5.00)#3,412 |
| 96. | Iron Gate | 13.3% | 6.1%(+7.20)#96 | 8.3%(+5.00)#3,428 |
| 97. | Martinsville | 13.2% | 6.1%(+7.10)#97 | 8.3%(+4.90)#3,443 |
| 98. | Big Rock | 13.1% | 6.1%(+7.00)#98 | 8.3%(+4.80)#3,530 |
| 99. | Wytheville | 12.9% | 6.1%(+6.80)#99 | 8.3%(+4.60)#3,586 |
| 100. | Big Stone Gap | 12.9% | 6.1%(+6.80)#100 | 8.3%(+4.60)#3,593 |
Common Questions
What are the Top 10 Cities with the Highest Percentage of Households Without a Vehicle in Virginia?
Top 10 Cities with the Highest Percentage of Households Without a Vehicle in Virginia are:
#1
90.7%
#2
59.5%
#3
58.7%
#4
41.4%
#5
38.1%
#6
37.5%
#7
31.9%
#8
31.3%
#9
29.2%
#10
28.8%
What city has the Highest Percentage of Households Without a Vehicle in Virginia?
Whitesville has the Highest Percentage of Households Without a Vehicle in Virginia with 90.7%.
What is the Percentage of Households Without a Vehicle in the State of Virginia?
Percentage of Households Without a Vehicle in Virginia is 6.1%.
What is the Percentage of Households Without a Vehicle in the United States?
Percentage of Households Without a Vehicle in the United States is 8.3%.