Oakland, CA Map & Demographics
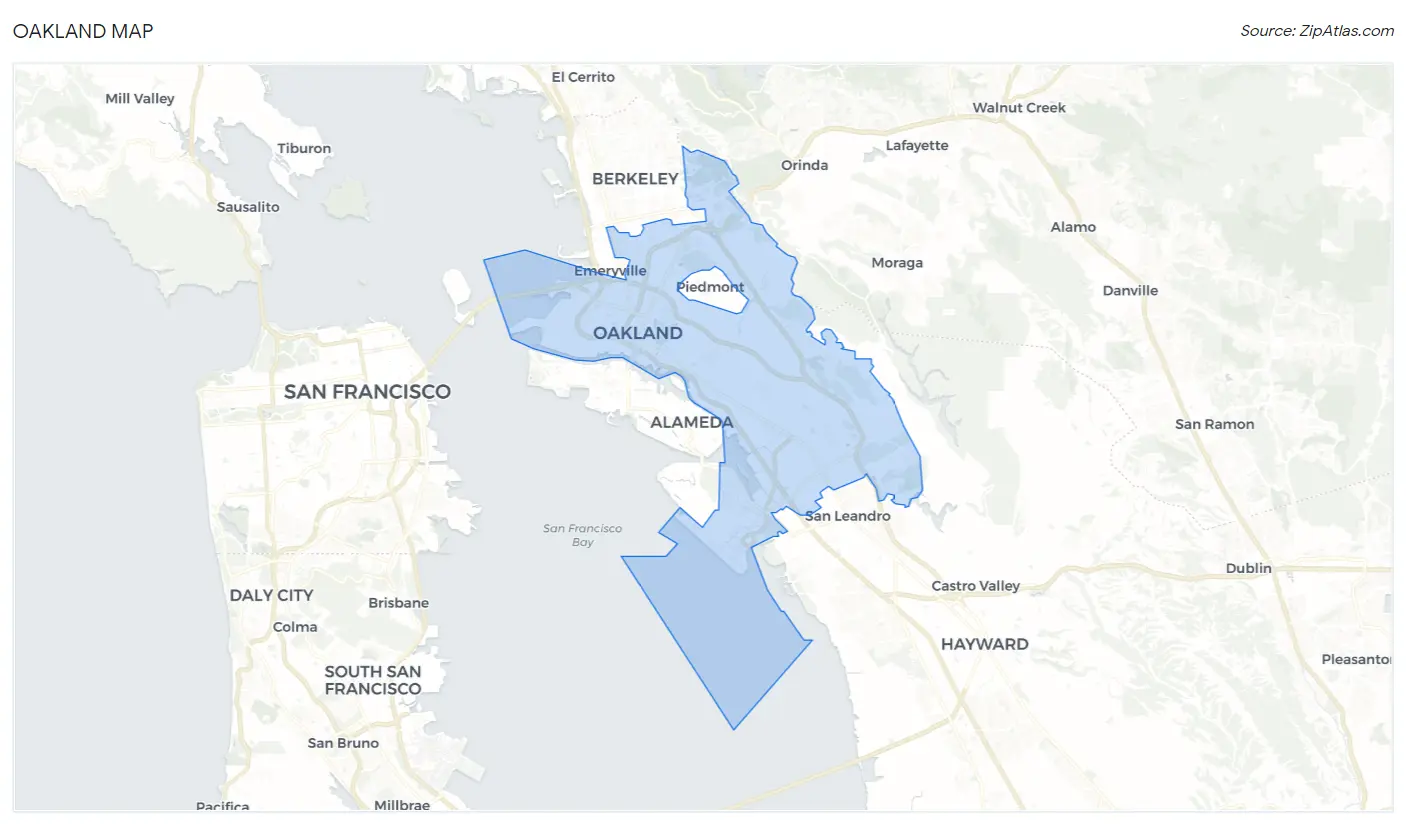
Oakland Map
Oakland Overview
$56,628
PER CAPITA INCOME
$109,997
AVG FAMILY INCOME
$94,389
AVG HOUSEHOLD INCOME
9.7%
WAGE / INCOME GAP [ % ]
90.3¢/ $1
WAGE / INCOME GAP [ $ ]
$10,733
FAMILY INCOME DEFICIT
0.51
INEQUALITY / GINI INDEX
437,825
TOTAL POPULATION
215,257
MALE POPULATION
222,568
FEMALE POPULATION
96.72
MALES / 100 FEMALES
103.40
FEMALES / 100 MALES
37.5
MEDIAN AGE
3.3
AVG FAMILY SIZE
2.5
AVG HOUSEHOLD SIZE
248,211
LABOR FORCE [ PEOPLE ]
68.4%
PERCENT IN LABOR FORCE
5.8%
UNEMPLOYMENT RATE
Oakland Zip Codes
Income in Oakland
Income Overview in Oakland
Per Capita Income in Oakland is $56,628, while median incomes of families and households are $109,997 and $94,389 respectively.
| Characteristic | Number | Measure |
| Per Capita Income | 437,825 | $56,628 |
| Median Family Income | 91,738 | $109,997 |
| Mean Family Income | 91,738 | $160,429 |
| Median Household Income | 170,282 | $94,389 |
| Mean Household Income | 170,282 | $139,468 |
| Income Deficit | 91,738 | $10,733 |
| Wage / Income Gap (%) | 437,825 | 9.68% |
| Wage / Income Gap ($) | 437,825 | 90.32¢ per $1 |
| Gini / Inequality Index | 437,825 | 0.51 |
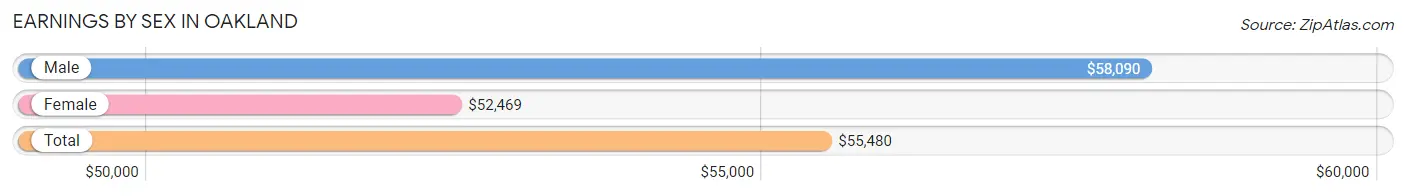
Earnings by Sex in Oakland
Average Earnings in Oakland are $55,480, $58,090 for men and $52,469 for women, a difference of 9.7%.
| Sex | Number | Average Earnings |
| Male | 131,962 (51.9%) | $58,090 |
| Female | 122,170 (48.1%) | $52,469 |
| Total | 254,132 (100.0%) | $55,480 |
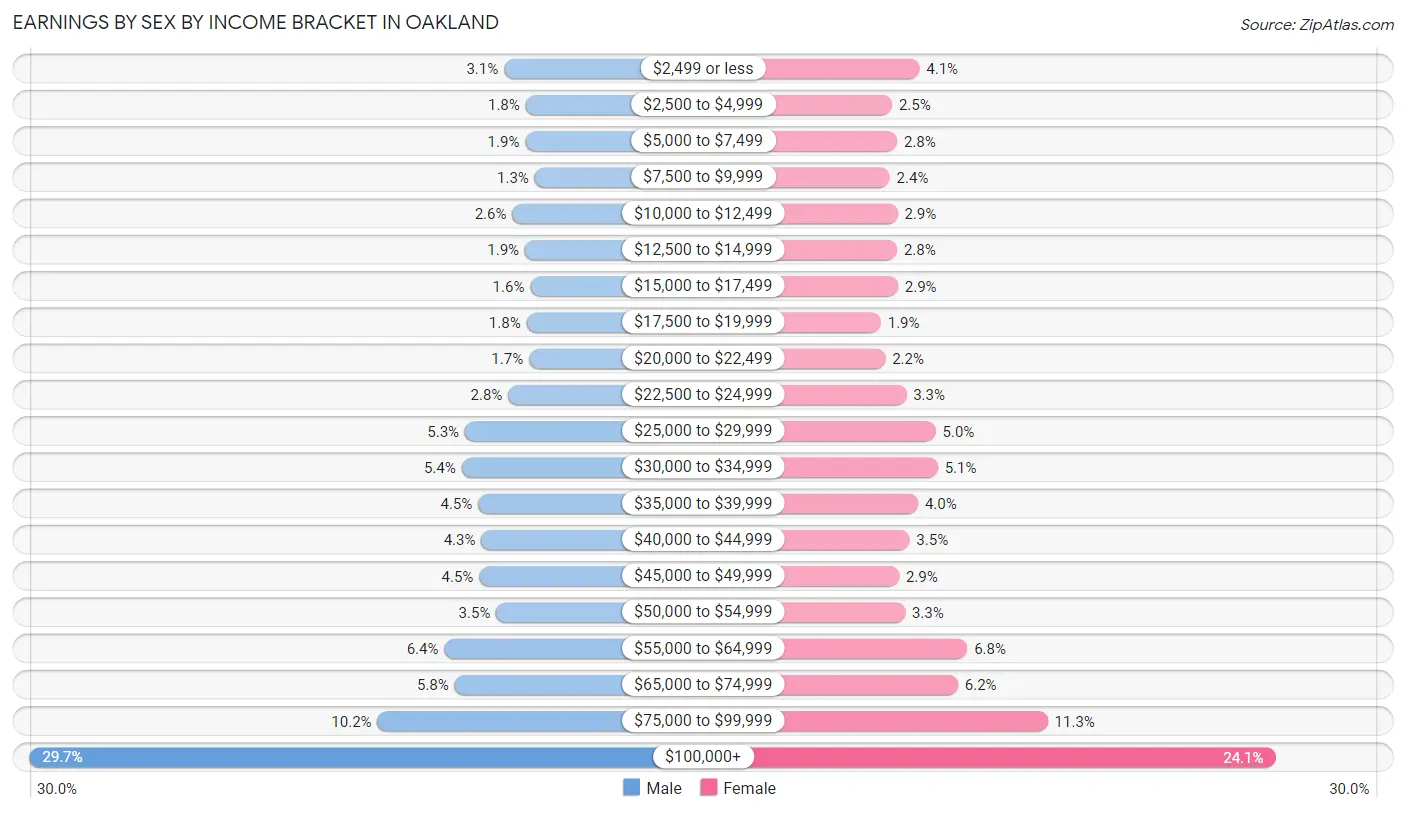
Earnings by Sex by Income Bracket in Oakland
The most common earnings brackets in Oakland are $100,000+ for men (39,233 | 29.7%) and $100,000+ for women (29,416 | 24.1%).
| Income | Male | Female |
| $2,499 or less | 4,029 (3.0%) | 4,983 (4.1%) |
| $2,500 to $4,999 | 2,430 (1.8%) | 3,108 (2.5%) |
| $5,000 to $7,499 | 2,452 (1.9%) | 3,446 (2.8%) |
| $7,500 to $9,999 | 1,758 (1.3%) | 2,948 (2.4%) |
| $10,000 to $12,499 | 3,418 (2.6%) | 3,487 (2.9%) |
| $12,500 to $14,999 | 2,486 (1.9%) | 3,442 (2.8%) |
| $15,000 to $17,499 | 2,084 (1.6%) | 3,511 (2.9%) |
| $17,500 to $19,999 | 2,365 (1.8%) | 2,337 (1.9%) |
| $20,000 to $22,499 | 2,175 (1.7%) | 2,640 (2.2%) |
| $22,500 to $24,999 | 3,716 (2.8%) | 4,075 (3.3%) |
| $25,000 to $29,999 | 6,929 (5.2%) | 6,091 (5.0%) |
| $30,000 to $34,999 | 7,179 (5.4%) | 6,248 (5.1%) |
| $35,000 to $39,999 | 5,946 (4.5%) | 4,881 (4.0%) |
| $40,000 to $44,999 | 5,711 (4.3%) | 4,304 (3.5%) |
| $45,000 to $49,999 | 5,869 (4.4%) | 3,574 (2.9%) |
| $50,000 to $54,999 | 4,609 (3.5%) | 3,995 (3.3%) |
| $55,000 to $64,999 | 8,459 (6.4%) | 8,268 (6.8%) |
| $65,000 to $74,999 | 7,695 (5.8%) | 7,628 (6.2%) |
| $75,000 to $99,999 | 13,419 (10.2%) | 13,788 (11.3%) |
| $100,000+ | 39,233 (29.7%) | 29,416 (24.1%) |
| Total | 131,962 (100.0%) | 122,170 (100.0%) |
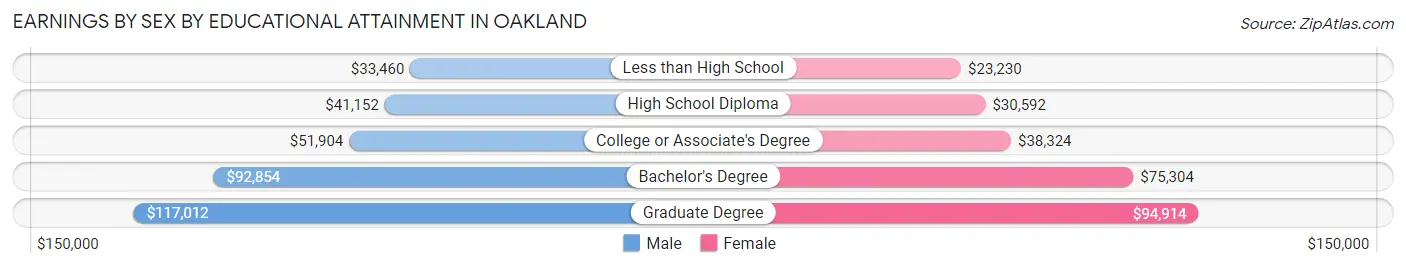
Earnings by Sex by Educational Attainment in Oakland
Average earnings in Oakland are $63,809 for men and $57,753 for women, a difference of 9.5%. Men with an educational attainment of graduate degree enjoy the highest average annual earnings of $117,012, while those with less than high school education earn the least with $33,460. Women with an educational attainment of graduate degree earn the most with the average annual earnings of $94,914, while those with less than high school education have the smallest earnings of $23,230.
| Educational Attainment | Male Income | Female Income |
| Less than High School | $33,460 | $23,230 |
| High School Diploma | $41,152 | $30,592 |
| College or Associate's Degree | $51,904 | $38,324 |
| Bachelor's Degree | $92,854 | $75,304 |
| Graduate Degree | $117,012 | $94,914 |
| Total | $63,809 | $57,753 |
Family Income in Oakland
Family Income Brackets in Oakland
According to the Oakland family income data, there are 24,678 families falling into the $200,000+ income range, which is the most common income bracket and makes up 26.9% of all families. Conversely, the $10,000 to $14,999 income bracket is the least frequent group with only 1,743 families (1.9%) belonging to this category.
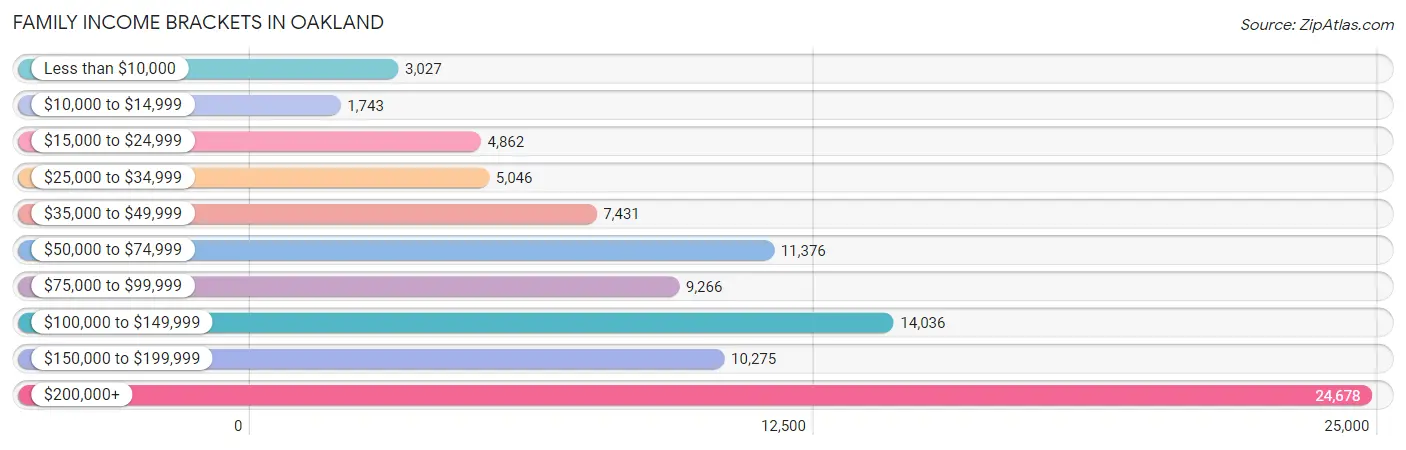
| Income Bracket | # Families | % Families |
| Less than $10,000 | 3,027 | 3.3% |
| $10,000 to $14,999 | 1,743 | 1.9% |
| $15,000 to $24,999 | 4,862 | 5.3% |
| $25,000 to $34,999 | 5,046 | 5.5% |
| $35,000 to $49,999 | 7,431 | 8.1% |
| $50,000 to $74,999 | 11,376 | 12.4% |
| $75,000 to $99,999 | 9,266 | 10.1% |
| $100,000 to $149,999 | 14,036 | 15.3% |
| $150,000 to $199,999 | 10,275 | 11.2% |
| $200,000+ | 24,678 | 26.9% |
Family Income by Famaliy Size in Oakland
4-person families (16,202 | 17.7%) account for the highest median family income in Oakland with $126,281 per family, while 2-person families (41,213 | 44.9%) have the highest median income of $53,829 per family member.
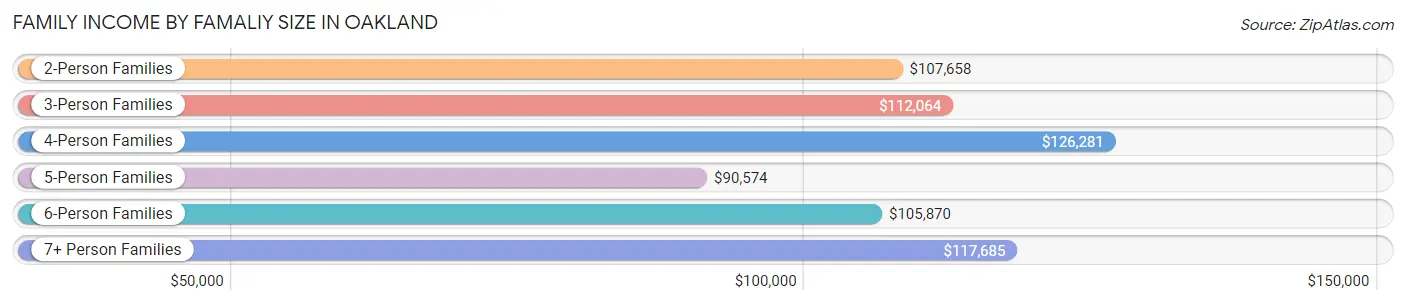
| Income Bracket | # Families | Median Income |
| 2-Person Families | 41,213 (44.9%) | $107,658 |
| 3-Person Families | 21,115 (23.0%) | $112,064 |
| 4-Person Families | 16,202 (17.7%) | $126,281 |
| 5-Person Families | 8,213 (8.9%) | $90,574 |
| 6-Person Families | 2,621 (2.9%) | $105,870 |
| 7+ Person Families | 2,374 (2.6%) | $117,685 |
| Total | 91,738 (100.0%) | $109,997 |
Family Income by Number of Earners in Oakland
The median family income in Oakland is $109,997, with families comprising 2 earners (42,740) having the highest median family income of $171,000, while families with no earners (9,940) have the lowest median family income of $28,376, accounting for 46.6% and 10.8% of families, respectively.
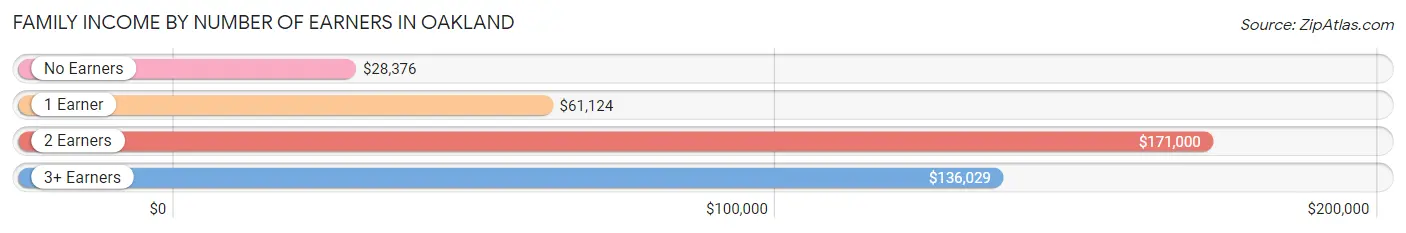
| Number of Earners | # Families | Median Income |
| No Earners | 9,940 (10.8%) | $28,376 |
| 1 Earner | 28,626 (31.2%) | $61,124 |
| 2 Earners | 42,740 (46.6%) | $171,000 |
| 3+ Earners | 10,432 (11.4%) | $136,029 |
| Total | 91,738 (100.0%) | $109,997 |
Household Income in Oakland
Household Income Brackets in Oakland
With 36,951 households falling in the category, the $200,000+ income range is the most frequent in Oakland, accounting for 21.7% of all households. In contrast, only 7,833 households (4.6%) fall into the $10,000 to $14,999 income bracket, making it the least populous group.
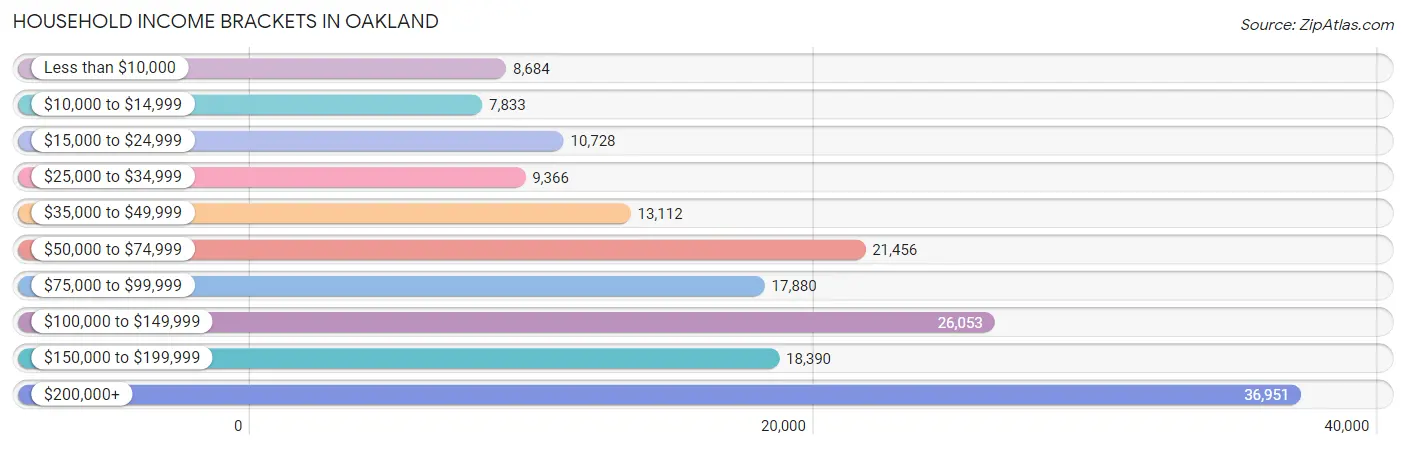
| Income Bracket | # Households | % Households |
| Less than $10,000 | 8,684 | 5.1% |
| $10,000 to $14,999 | 7,833 | 4.6% |
| $15,000 to $24,999 | 10,728 | 6.3% |
| $25,000 to $34,999 | 9,366 | 5.5% |
| $35,000 to $49,999 | 13,112 | 7.7% |
| $50,000 to $74,999 | 21,456 | 12.6% |
| $75,000 to $99,999 | 17,880 | 10.5% |
| $100,000 to $149,999 | 26,053 | 15.3% |
| $150,000 to $199,999 | 18,390 | 10.8% |
| $200,000+ | 36,951 | 21.7% |
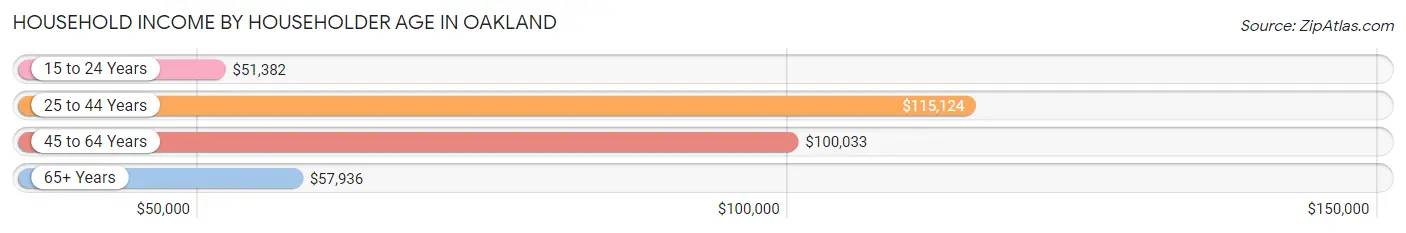
Household Income by Householder Age in Oakland
The median household income in Oakland is $94,389, with the highest median household income of $115,124 found in the 25 to 44 years age bracket for the primary householder. A total of 69,473 households (40.8%) fall into this category. Meanwhile, the 15 to 24 years age bracket for the primary householder has the lowest median household income of $51,382, with 3,538 households (2.1%) in this group.
| Income Bracket | # Households | Median Income |
| 15 to 24 Years | 3,538 (2.1%) | $51,382 |
| 25 to 44 Years | 69,473 (40.8%) | $115,124 |
| 45 to 64 Years | 58,864 (34.6%) | $100,033 |
| 65+ Years | 38,407 (22.6%) | $57,936 |
| Total | 170,282 (100.0%) | $94,389 |
Poverty in Oakland
Income Below Poverty by Sex and Age in Oakland
With 12.1% poverty level for males and 14.2% for females among the residents of Oakland, 12 to 14 year old males and 5 year old females are the most vulnerable to poverty, with 1,372 males (21.1%) and 424 females (22.3%) in their respective age groups living below the poverty level.
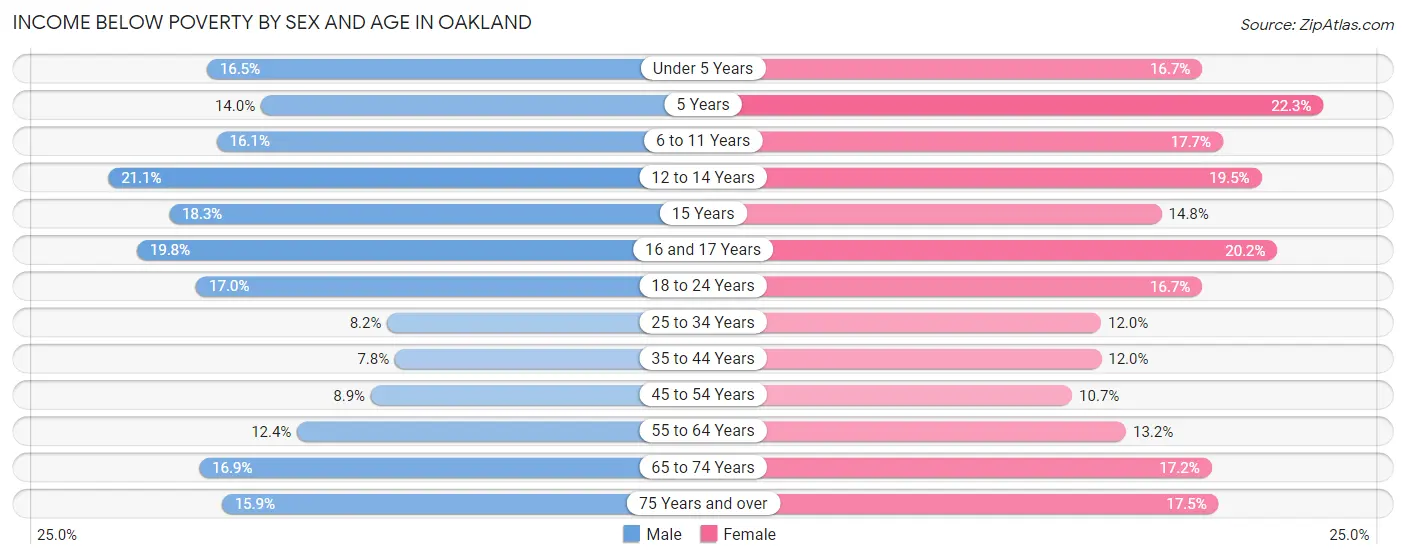
| Age Bracket | Male | Female |
| Under 5 Years | 1,891 (16.5%) | 2,144 (16.7%) |
| 5 Years | 408 (14.0%) | 424 (22.3%) |
| 6 to 11 Years | 2,279 (16.1%) | 2,241 (17.7%) |
| 12 to 14 Years | 1,372 (21.1%) | 1,330 (19.5%) |
| 15 Years | 433 (18.3%) | 304 (14.8%) |
| 16 and 17 Years | 875 (19.8%) | 864 (20.2%) |
| 18 to 24 Years | 2,554 (17.0%) | 2,491 (16.7%) |
| 25 to 34 Years | 3,346 (8.2%) | 5,196 (12.0%) |
| 35 to 44 Years | 2,806 (7.8%) | 4,237 (12.0%) |
| 45 to 54 Years | 2,603 (8.9%) | 2,858 (10.7%) |
| 55 to 64 Years | 3,007 (12.3%) | 3,329 (13.2%) |
| 65 to 74 Years | 2,747 (16.9%) | 3,366 (17.2%) |
| 75 Years and over | 1,556 (15.9%) | 2,586 (17.5%) |
| Total | 25,877 (12.1%) | 31,370 (14.2%) |
Income Above Poverty by Sex and Age in Oakland
According to the poverty statistics in Oakland, males aged 35 to 44 years and females aged 45 to 54 years are the age groups that are most secure financially, with 92.2% of males and 89.3% of females in these age groups living above the poverty line.
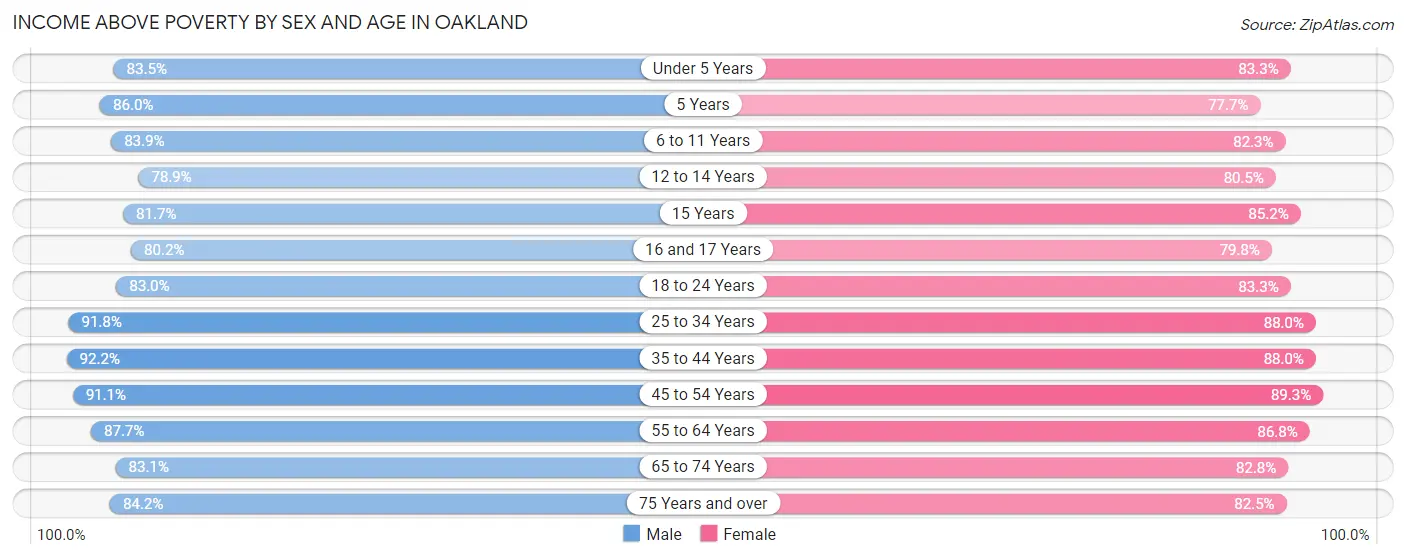
| Age Bracket | Male | Female |
| Under 5 Years | 9,539 (83.5%) | 10,680 (83.3%) |
| 5 Years | 2,500 (86.0%) | 1,474 (77.7%) |
| 6 to 11 Years | 11,885 (83.9%) | 10,431 (82.3%) |
| 12 to 14 Years | 5,123 (78.9%) | 5,500 (80.5%) |
| 15 Years | 1,933 (81.7%) | 1,744 (85.2%) |
| 16 and 17 Years | 3,546 (80.2%) | 3,411 (79.8%) |
| 18 to 24 Years | 12,433 (83.0%) | 12,403 (83.3%) |
| 25 to 34 Years | 37,622 (91.8%) | 38,002 (88.0%) |
| 35 to 44 Years | 33,102 (92.2%) | 30,952 (88.0%) |
| 45 to 54 Years | 26,546 (91.1%) | 23,867 (89.3%) |
| 55 to 64 Years | 21,346 (87.6%) | 21,919 (86.8%) |
| 65 to 74 Years | 13,507 (83.1%) | 16,246 (82.8%) |
| 75 Years and over | 8,262 (84.2%) | 12,212 (82.5%) |
| Total | 187,344 (87.9%) | 188,841 (85.8%) |
Income Below Poverty Among Married-Couple Families in Oakland
The poverty statistics for married-couple families in Oakland show that 5.6% or 3,463 of the total 61,405 families live below the poverty line. Families with 5 or more children have the highest poverty rate of 25.1%, comprising of 105 families. On the other hand, families with no children have the lowest poverty rate of 4.1%, which includes 1,412 families.
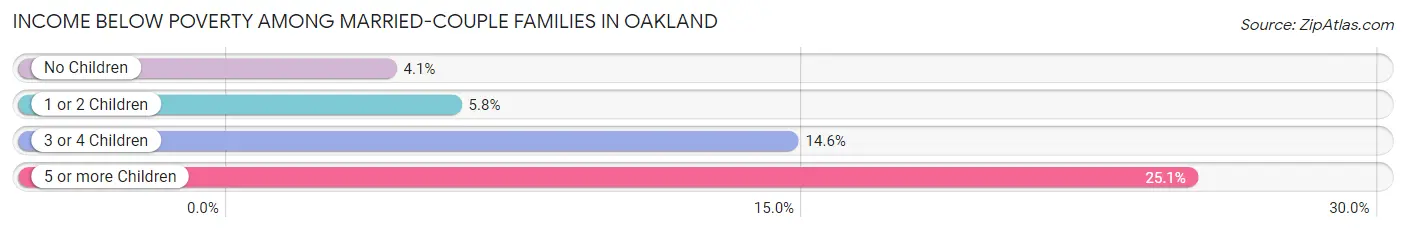
| Children | Above Poverty | Below Poverty |
| No Children | 32,709 (95.9%) | 1,412 (4.1%) |
| 1 or 2 Children | 21,257 (94.2%) | 1,318 (5.8%) |
| 3 or 4 Children | 3,662 (85.4%) | 628 (14.6%) |
| 5 or more Children | 314 (74.9%) | 105 (25.1%) |
| Total | 57,942 (94.4%) | 3,463 (5.6%) |
Income Below Poverty Among Single-Parent Households in Oakland
According to the poverty data in Oakland, 10.9% or 1,016 single-father households and 20.3% or 4,267 single-mother households are living below the poverty line. Among single-father households, those with 1 or 2 children have the highest poverty rate, with 730 households (14.9%) experiencing poverty. Likewise, among single-mother households, those with 5 or more children have the highest poverty rate, with 201 households (81.4%) falling below the poverty line.
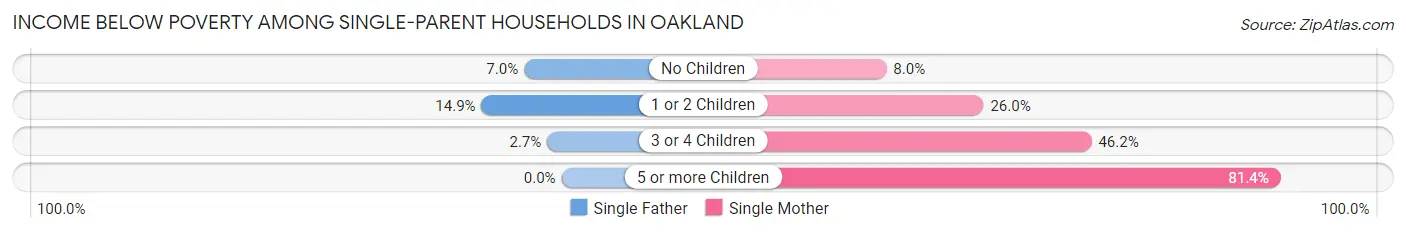
| Children | Single Father | Single Mother |
| No Children | 275 (7.0%) | 742 (8.0%) |
| 1 or 2 Children | 730 (14.9%) | 2,543 (26.0%) |
| 3 or 4 Children | 11 (2.7%) | 781 (46.2%) |
| 5 or more Children | 0 (0.0%) | 201 (81.4%) |
| Total | 1,016 (10.9%) | 4,267 (20.3%) |
Income Below Poverty Among Married-Couple vs Single-Parent Households in Oakland
The poverty data for Oakland shows that 3,463 of the married-couple family households (5.6%) and 5,283 of the single-parent households (17.4%) are living below the poverty level. Within the married-couple family households, those with 5 or more children have the highest poverty rate, with 105 households (25.1%) falling below the poverty line. Among the single-parent households, those with 5 or more children have the highest poverty rate, with 201 household (65.5%) living below poverty.
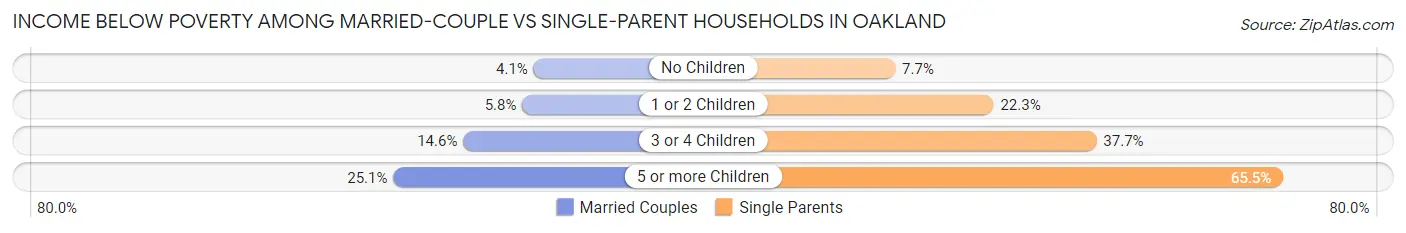
| Children | Married-Couple Families | Single-Parent Households |
| No Children | 1,412 (4.1%) | 1,017 (7.7%) |
| 1 or 2 Children | 1,318 (5.8%) | 3,273 (22.3%) |
| 3 or 4 Children | 628 (14.6%) | 792 (37.7%) |
| 5 or more Children | 105 (25.1%) | 201 (65.5%) |
| Total | 3,463 (5.6%) | 5,283 (17.4%) |
Race in Oakland
The most populous races in Oakland are White / Caucasian (141,569 | 32.3%), Hispanic or Latino (116,550 | 26.6%), and Black / African American (95,412 | 21.8%).
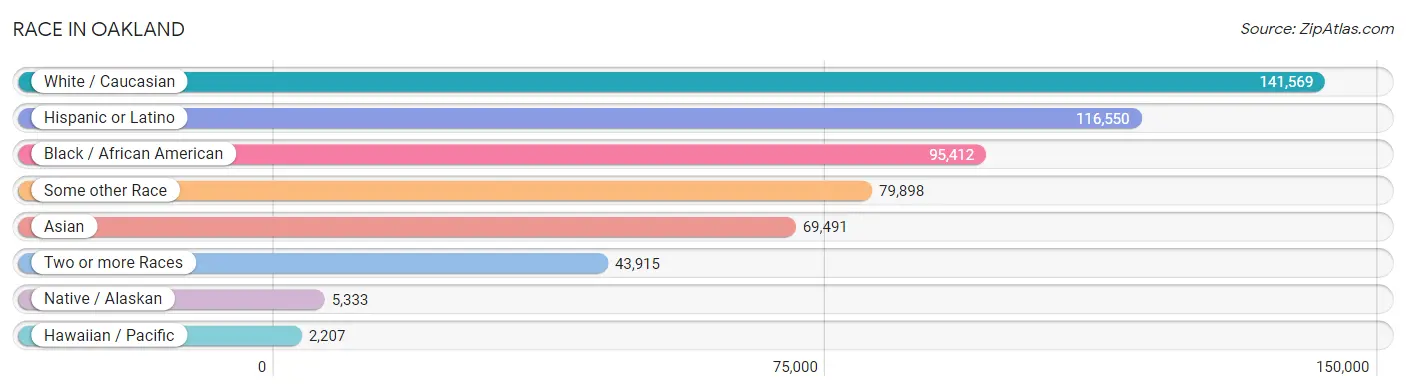
| Race | # Population | % Population |
| Asian | 69,491 | 15.9% |
| Black / African American | 95,412 | 21.8% |
| Hawaiian / Pacific | 2,207 | 0.5% |
| Hispanic or Latino | 116,550 | 26.6% |
| Native / Alaskan | 5,333 | 1.2% |
| White / Caucasian | 141,569 | 32.3% |
| Two or more Races | 43,915 | 10.0% |
| Some other Race | 79,898 | 18.2% |
| Total | 437,825 | 100.0% |
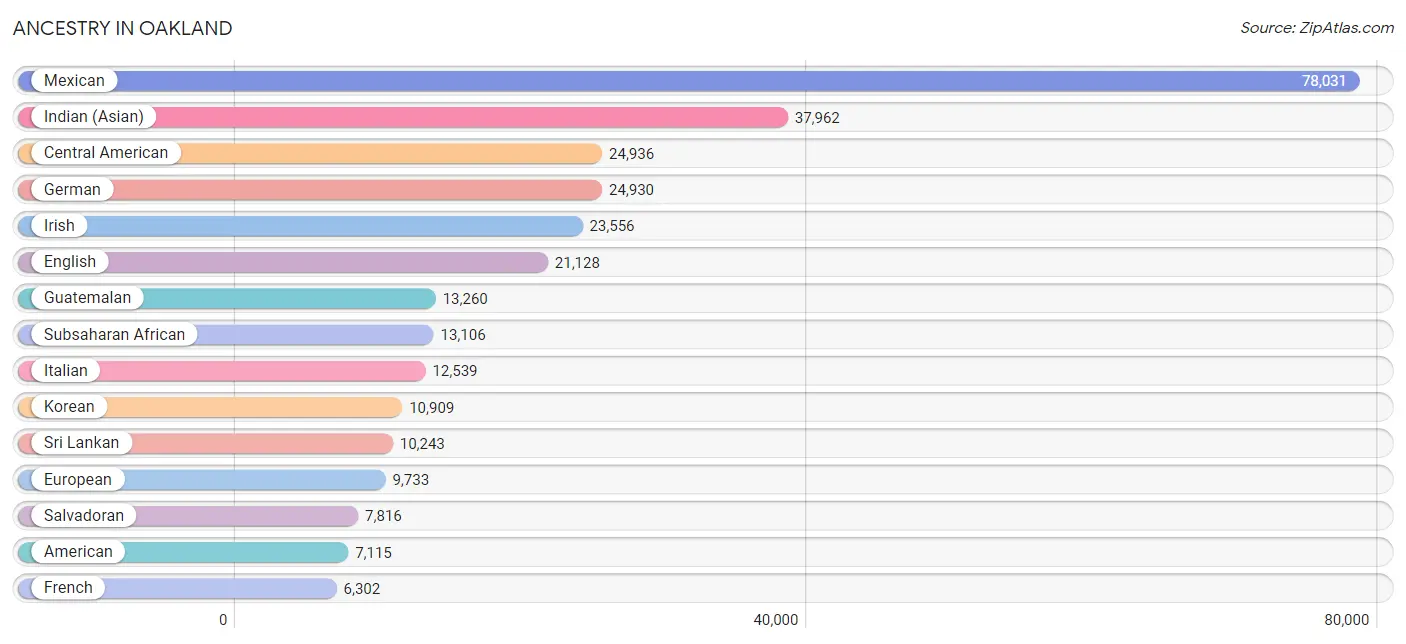
Ancestry in Oakland
The most populous ancestries reported in Oakland are Mexican (78,031 | 17.8%), Indian (Asian) (37,962 | 8.7%), Central American (24,936 | 5.7%), German (24,930 | 5.7%), and Irish (23,556 | 5.4%), together accounting for 43.3% of all Oakland residents.
| Ancestry | # Population | % Population |
| Afghan | 357 | 0.1% |
| African | 3,766 | 0.9% |
| Albanian | 20 | 0.0% |
| Aleut | 21 | 0.0% |
| Alsatian | 13 | 0.0% |
| American | 7,115 | 1.6% |
| Apache | 231 | 0.1% |
| Arab | 5,722 | 1.3% |
| Argentinean | 678 | 0.2% |
| Armenian | 801 | 0.2% |
| Assyrian / Chaldean / Syriac | 81 | 0.0% |
| Australian | 176 | 0.0% |
| Austrian | 860 | 0.2% |
| Bahamian | 26 | 0.0% |
| Bangladeshi | 334 | 0.1% |
| Barbadian | 116 | 0.0% |
| Basque | 127 | 0.0% |
| Belgian | 423 | 0.1% |
| Bermudan | 10 | 0.0% |
| Bhutanese | 5,089 | 1.2% |
| Blackfeet | 441 | 0.1% |
| Bolivian | 132 | 0.0% |
| Brazilian | 436 | 0.1% |
| British | 2,879 | 0.7% |
| British West Indian | 83 | 0.0% |
| Bulgarian | 78 | 0.0% |
| Burmese | 4,689 | 1.1% |
| Cajun | 87 | 0.0% |
| Cambodian | 429 | 0.1% |
| Canadian | 443 | 0.1% |
| Cape Verdean | 148 | 0.0% |
| Celtic | 29 | 0.0% |
| Central American | 24,936 | 5.7% |
| Central American Indian | 2,195 | 0.5% |
| Cherokee | 1,463 | 0.3% |
| Chickasaw | 78 | 0.0% |
| Chilean | 449 | 0.1% |
| Chinese | 63 | 0.0% |
| Chippewa | 136 | 0.0% |
| Choctaw | 455 | 0.1% |
| Colombian | 1,269 | 0.3% |
| Colville | 1 | 0.0% |
| Comanche | 9 | 0.0% |
| Costa Rican | 178 | 0.0% |
| Cree | 24 | 0.0% |
| Creek | 30 | 0.0% |
| Croatian | 549 | 0.1% |
| Crow | 87 | 0.0% |
| Cuban | 1,475 | 0.3% |
| Czech | 1,128 | 0.3% |
| Czechoslovakian | 198 | 0.1% |
| Danish | 1,524 | 0.4% |
| Dominican | 256 | 0.1% |
| Dutch | 2,136 | 0.5% |
| Dutch West Indian | 17 | 0.0% |
| Eastern European | 2,705 | 0.6% |
| Ecuadorian | 154 | 0.0% |
| Egyptian | 333 | 0.1% |
| English | 21,128 | 4.8% |
| Estonian | 33 | 0.0% |
| Ethiopian | 4,707 | 1.1% |
| European | 9,733 | 2.2% |
| Fijian | 5 | 0.0% |
| Filipino | 1,307 | 0.3% |
| Finnish | 774 | 0.2% |
| French | 6,302 | 1.4% |
| French American Indian | 22 | 0.0% |
| French Canadian | 747 | 0.2% |
| German | 24,930 | 5.7% |
| German Russian | 4 | 0.0% |
| Ghanaian | 111 | 0.0% |
| Greek | 1,406 | 0.3% |
| Guamanian / Chamorro | 438 | 0.1% |
| Guatemalan | 13,260 | 3.0% |
| Guyanese | 38 | 0.0% |
| Haitian | 510 | 0.1% |
| Honduran | 2,243 | 0.5% |
| Hopi | 6 | 0.0% |
| Hungarian | 1,336 | 0.3% |
| Icelander | 52 | 0.0% |
| Indian (Asian) | 37,962 | 8.7% |
| Indonesian | 447 | 0.1% |
| Inupiat | 49 | 0.0% |
| Iranian | 1,574 | 0.4% |
| Iraqi | 177 | 0.0% |
| Irish | 23,556 | 5.4% |
| Iroquois | 49 | 0.0% |
| Israeli | 197 | 0.0% |
| Italian | 12,539 | 2.9% |
| Jamaican | 1,057 | 0.2% |
| Japanese | 3,186 | 0.7% |
| Jordanian | 187 | 0.0% |
| Kenyan | 70 | 0.0% |
| Korean | 10,909 | 2.5% |
| Laotian | 432 | 0.1% |
| Latvian | 165 | 0.0% |
| Lebanese | 371 | 0.1% |
| Liberian | 150 | 0.0% |
| Lithuanian | 841 | 0.2% |
| Lumbee | 2 | 0.0% |
| Luxembourger | 11 | 0.0% |
| Macedonian | 88 | 0.0% |
| Malaysian | 1,519 | 0.4% |
| Maltese | 71 | 0.0% |
| Mexican | 78,031 | 17.8% |
| Mexican American Indian | 1,988 | 0.4% |
| Mongolian | 242 | 0.1% |
| Moroccan | 164 | 0.0% |
| Native Hawaiian | 880 | 0.2% |
| Navajo | 348 | 0.1% |
| Nepalese | 897 | 0.2% |
| New Zealander | 223 | 0.1% |
| Nicaraguan | 978 | 0.2% |
| Nigerian | 2,513 | 0.6% |
| Northern European | 1,204 | 0.3% |
| Norwegian | 3,688 | 0.8% |
| Okinawan | 68 | 0.0% |
| Ottawa | 22 | 0.0% |
| Paiute | 111 | 0.0% |
| Pakistani | 998 | 0.2% |
| Palestinian | 188 | 0.0% |
| Panamanian | 429 | 0.1% |
| Paraguayan | 2 | 0.0% |
| Pennsylvania German | 50 | 0.0% |
| Peruvian | 678 | 0.2% |
| Pima | 21 | 0.0% |
| Polish | 5,937 | 1.4% |
| Portuguese | 2,288 | 0.5% |
| Potawatomi | 12 | 0.0% |
| Pueblo | 122 | 0.0% |
| Puerto Rican | 2,838 | 0.6% |
| Romanian | 598 | 0.1% |
| Russian | 4,231 | 1.0% |
| Salvadoran | 7,816 | 1.8% |
| Samoan | 438 | 0.1% |
| Scandinavian | 708 | 0.2% |
| Scotch-Irish | 1,934 | 0.4% |
| Scottish | 4,895 | 1.1% |
| Seminole | 98 | 0.0% |
| Senegalese | 14 | 0.0% |
| Serbian | 127 | 0.0% |
| Shoshone | 45 | 0.0% |
| Sierra Leonean | 100 | 0.0% |
| Sioux | 390 | 0.1% |
| Slavic | 134 | 0.0% |
| Slovak | 241 | 0.1% |
| Slovene | 218 | 0.1% |
| Somali | 14 | 0.0% |
| South African | 195 | 0.0% |
| South American | 3,525 | 0.8% |
| South American Indian | 169 | 0.0% |
| Spaniard | 1,342 | 0.3% |
| Spanish | 1,204 | 0.3% |
| Spanish American Indian | 60 | 0.0% |
| Sri Lankan | 10,243 | 2.3% |
| Subsaharan African | 13,106 | 3.0% |
| Sudanese | 84 | 0.0% |
| Swedish | 3,291 | 0.7% |
| Swiss | 1,107 | 0.3% |
| Syrian | 350 | 0.1% |
| Thai | 6,195 | 1.4% |
| Tlingit-Haida | 39 | 0.0% |
| Tohono O'Odham | 5 | 0.0% |
| Tongan | 1,107 | 0.3% |
| Trinidadian and Tobagonian | 73 | 0.0% |
| Turkish | 331 | 0.1% |
| U.S. Virgin Islander | 18 | 0.0% |
| Ugandan | 23 | 0.0% |
| Ukrainian | 1,476 | 0.3% |
| Uruguayan | 8 | 0.0% |
| Venezuelan | 134 | 0.0% |
| Vietnamese | 80 | 0.0% |
| Welsh | 1,420 | 0.3% |
| West Indian | 410 | 0.1% |
| Yaqui | 65 | 0.0% |
| Yugoslavian | 103 | 0.0% |
| Yup'ik | 27 | 0.0% |
| Zimbabwean | 71 | 0.0% | View All 178 Rows |
Immigrants in Oakland
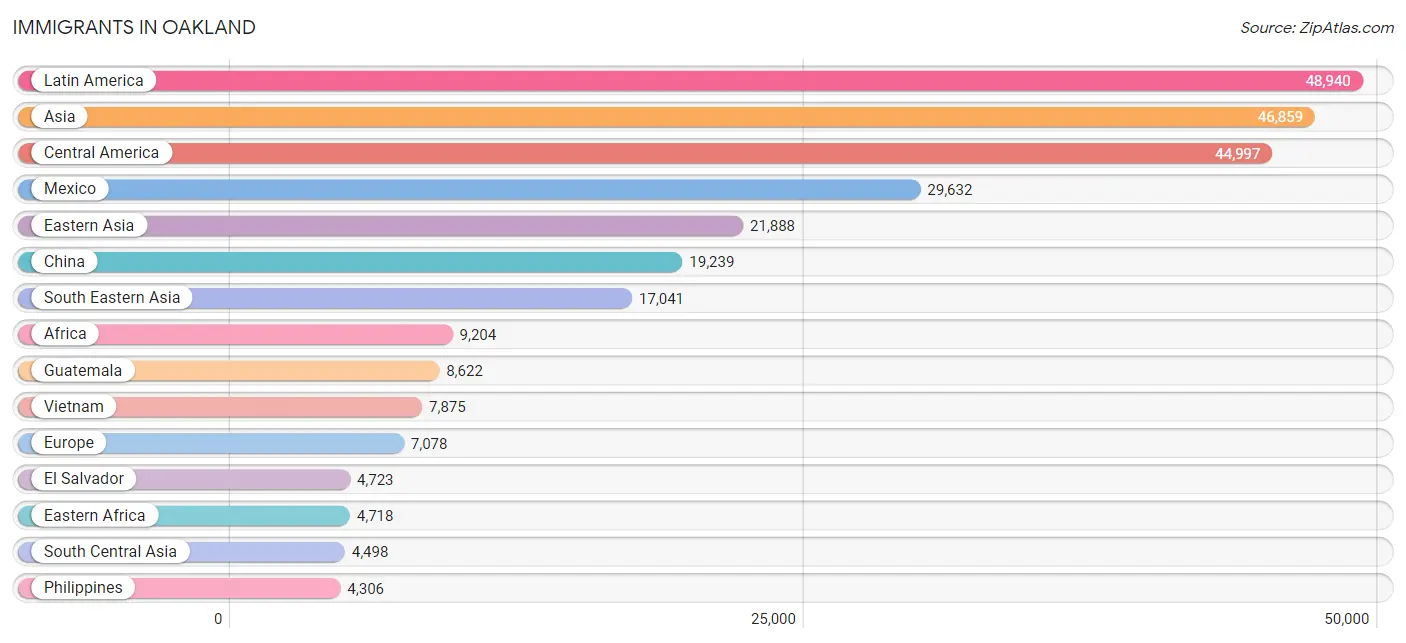
The most numerous immigrant groups reported in Oakland came from Latin America (48,940 | 11.2%), Asia (46,859 | 10.7%), Central America (44,997 | 10.3%), Mexico (29,632 | 6.8%), and Eastern Asia (21,888 | 5.0%), together accounting for 43.9% of all Oakland residents.
| Immigration Origin | # Population | % Population |
| Afghanistan | 267 | 0.1% |
| Africa | 9,204 | 2.1% |
| Albania | 20 | 0.0% |
| Argentina | 369 | 0.1% |
| Armenia | 57 | 0.0% |
| Asia | 46,859 | 10.7% |
| Australia | 254 | 0.1% |
| Austria | 100 | 0.0% |
| Azores | 36 | 0.0% |
| Bahamas | 45 | 0.0% |
| Bangladesh | 73 | 0.0% |
| Barbados | 86 | 0.0% |
| Belarus | 70 | 0.0% |
| Belgium | 127 | 0.0% |
| Belize | 44 | 0.0% |
| Bolivia | 25 | 0.0% |
| Bosnia and Herzegovina | 70 | 0.0% |
| Brazil | 503 | 0.1% |
| Bulgaria | 76 | 0.0% |
| Cambodia | 1,713 | 0.4% |
| Cameroon | 86 | 0.0% |
| Canada | 1,414 | 0.3% |
| Caribbean | 1,373 | 0.3% |
| Central America | 44,997 | 10.3% |
| Chile | 309 | 0.1% |
| China | 19,239 | 4.4% |
| Colombia | 669 | 0.2% |
| Congo | 13 | 0.0% |
| Costa Rica | 59 | 0.0% |
| Croatia | 9 | 0.0% |
| Cuba | 298 | 0.1% |
| Czechoslovakia | 103 | 0.0% |
| Denmark | 46 | 0.0% |
| Dominica | 21 | 0.0% |
| Dominican Republic | 111 | 0.0% |
| Eastern Africa | 4,718 | 1.1% |
| Eastern Asia | 21,888 | 5.0% |
| Eastern Europe | 1,670 | 0.4% |
| Ecuador | 108 | 0.0% |
| Egypt | 77 | 0.0% |
| El Salvador | 4,723 | 1.1% |
| England | 527 | 0.1% |
| Eritrea | 1,707 | 0.4% |
| Ethiopia | 2,061 | 0.5% |
| Europe | 7,078 | 1.6% |
| Fiji | 360 | 0.1% |
| France | 842 | 0.2% |
| Germany | 1,021 | 0.2% |
| Ghana | 140 | 0.0% |
| Greece | 88 | 0.0% |
| Grenada | 6 | 0.0% |
| Guatemala | 8,622 | 2.0% |
| Guyana | 53 | 0.0% |
| Haiti | 84 | 0.0% |
| Honduras | 1,340 | 0.3% |
| Hong Kong | 1,911 | 0.4% |
| Hungary | 54 | 0.0% |
| India | 2,506 | 0.6% |
| Indonesia | 261 | 0.1% |
| Iran | 946 | 0.2% |
| Iraq | 121 | 0.0% |
| Ireland | 233 | 0.1% |
| Israel | 198 | 0.1% |
| Italy | 418 | 0.1% |
| Jamaica | 565 | 0.1% |
| Japan | 671 | 0.2% |
| Jordan | 93 | 0.0% |
| Kazakhstan | 29 | 0.0% |
| Kenya | 143 | 0.0% |
| Korea | 1,674 | 0.4% |
| Kuwait | 53 | 0.0% |
| Laos | 1,088 | 0.3% |
| Latin America | 48,940 | 11.2% |
| Latvia | 5 | 0.0% |
| Lebanon | 76 | 0.0% |
| Liberia | 340 | 0.1% |
| Malaysia | 244 | 0.1% |
| Mexico | 29,632 | 6.8% |
| Middle Africa | 214 | 0.1% |
| Moldova | 88 | 0.0% |
| Morocco | 113 | 0.0% |
| Nepal | 76 | 0.0% |
| Netherlands | 125 | 0.0% |
| Nicaragua | 495 | 0.1% |
| Nigeria | 1,902 | 0.4% |
| North Macedonia | 11 | 0.0% |
| Northern Africa | 665 | 0.2% |
| Northern Europe | 2,175 | 0.5% |
| Norway | 79 | 0.0% |
| Oceania | 1,592 | 0.4% |
| Pakistan | 250 | 0.1% |
| Panama | 82 | 0.0% |
| Peru | 423 | 0.1% |
| Philippines | 4,306 | 1.0% |
| Poland | 328 | 0.1% |
| Portugal | 72 | 0.0% |
| Romania | 64 | 0.0% |
| Russia | 394 | 0.1% |
| Saudi Arabia | 189 | 0.0% |
| Scotland | 19 | 0.0% |
| Senegal | 134 | 0.0% |
| Serbia | 59 | 0.0% |
| Sierra Leone | 132 | 0.0% |
| Singapore | 207 | 0.1% |
| Somalia | 6 | 0.0% |
| South Africa | 141 | 0.0% |
| South America | 2,570 | 0.6% |
| South Central Asia | 4,498 | 1.0% |
| South Eastern Asia | 17,041 | 3.9% |
| Southern Europe | 844 | 0.2% |
| Spain | 266 | 0.1% |
| Sri Lanka | 301 | 0.1% |
| Sudan | 185 | 0.0% |
| Sweden | 196 | 0.0% |
| Switzerland | 112 | 0.0% |
| Syria | 331 | 0.1% |
| Taiwan | 1,292 | 0.3% |
| Thailand | 965 | 0.2% |
| Trinidad and Tobago | 67 | 0.0% |
| Turkey | 204 | 0.1% |
| Uganda | 198 | 0.1% |
| Ukraine | 173 | 0.0% |
| Uruguay | 8 | 0.0% |
| Uzbekistan | 9 | 0.0% |
| Venezuela | 86 | 0.0% |
| Vietnam | 7,875 | 1.8% |
| Western Africa | 3,173 | 0.7% |
| Western Asia | 3,322 | 0.8% |
| Western Europe | 2,327 | 0.5% |
| Yemen | 1,911 | 0.4% |
| Zaire | 115 | 0.0% |
| Zimbabwe | 348 | 0.1% | View All 132 Rows |
Sex and Age in Oakland
Sex and Age in Oakland
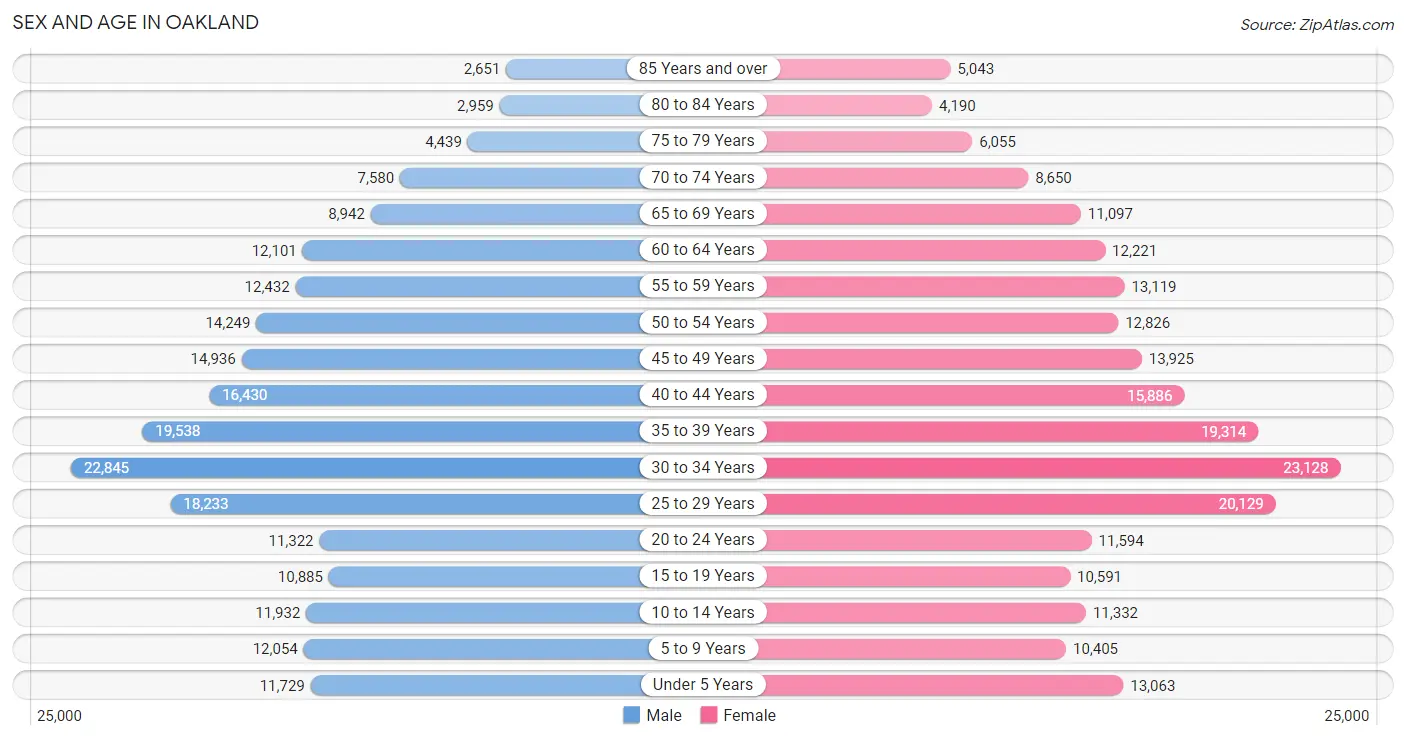
The most populous age groups in Oakland are 30 to 34 Years (22,845 | 10.6%) for men and 30 to 34 Years (23,128 | 10.4%) for women.
| Age Bracket | Male | Female |
| Under 5 Years | 11,729 (5.4%) | 13,063 (5.9%) |
| 5 to 9 Years | 12,054 (5.6%) | 10,405 (4.7%) |
| 10 to 14 Years | 11,932 (5.5%) | 11,332 (5.1%) |
| 15 to 19 Years | 10,885 (5.1%) | 10,591 (4.8%) |
| 20 to 24 Years | 11,322 (5.3%) | 11,594 (5.2%) |
| 25 to 29 Years | 18,233 (8.5%) | 20,129 (9.0%) |
| 30 to 34 Years | 22,845 (10.6%) | 23,128 (10.4%) |
| 35 to 39 Years | 19,538 (9.1%) | 19,314 (8.7%) |
| 40 to 44 Years | 16,430 (7.6%) | 15,886 (7.1%) |
| 45 to 49 Years | 14,936 (6.9%) | 13,925 (6.3%) |
| 50 to 54 Years | 14,249 (6.6%) | 12,826 (5.8%) |
| 55 to 59 Years | 12,432 (5.8%) | 13,119 (5.9%) |
| 60 to 64 Years | 12,101 (5.6%) | 12,221 (5.5%) |
| 65 to 69 Years | 8,942 (4.2%) | 11,097 (5.0%) |
| 70 to 74 Years | 7,580 (3.5%) | 8,650 (3.9%) |
| 75 to 79 Years | 4,439 (2.1%) | 6,055 (2.7%) |
| 80 to 84 Years | 2,959 (1.4%) | 4,190 (1.9%) |
| 85 Years and over | 2,651 (1.2%) | 5,043 (2.3%) |
| Total | 215,257 (100.0%) | 222,568 (100.0%) |
Families and Households in Oakland
Median Family Size in Oakland
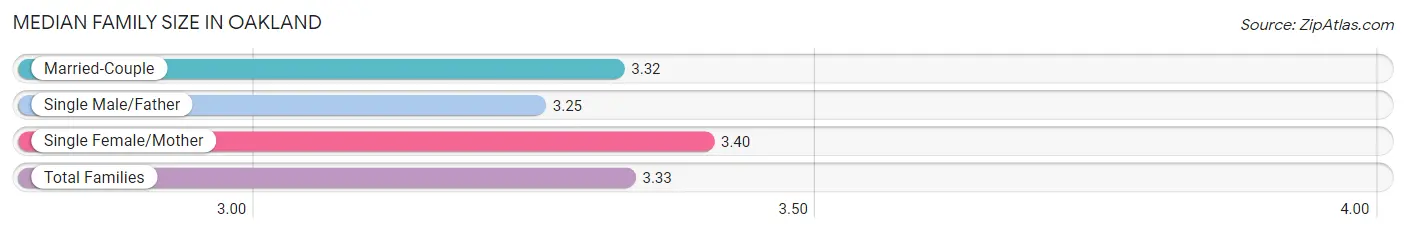
The median family size in Oakland is 3.33 persons per family, with single female/mother families (21,024 | 22.9%) accounting for the largest median family size of 3.4 persons per family. On the other hand, single male/father families (9,309 | 10.2%) represent the smallest median family size with 3.25 persons per family.
| Family Type | # Families | Family Size |
| Married-Couple | 61,405 (66.9%) | 3.32 |
| Single Male/Father | 9,309 (10.2%) | 3.25 |
| Single Female/Mother | 21,024 (22.9%) | 3.40 |
| Total Families | 91,738 (100.0%) | 3.33 |
Median Household Size in Oakland
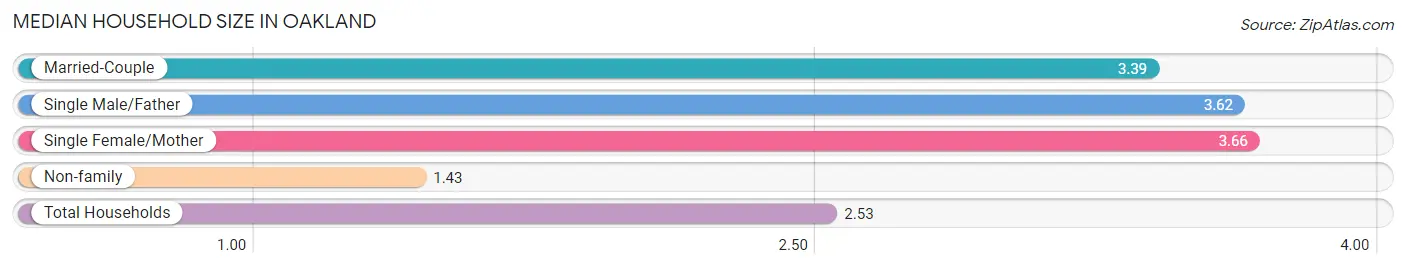
The median household size in Oakland is 2.53 persons per household, with single female/mother households (21,024 | 12.3%) accounting for the largest median household size of 3.66 persons per household. non-family households (78,544 | 46.1%) represent the smallest median household size with 1.43 persons per household.
| Household Type | # Households | Household Size |
| Married-Couple | 61,405 (36.1%) | 3.39 |
| Single Male/Father | 9,309 (5.5%) | 3.62 |
| Single Female/Mother | 21,024 (12.3%) | 3.66 |
| Non-family | 78,544 (46.1%) | 1.43 |
| Total Households | 170,282 (100.0%) | 2.53 |
Household Size by Marriage Status in Oakland
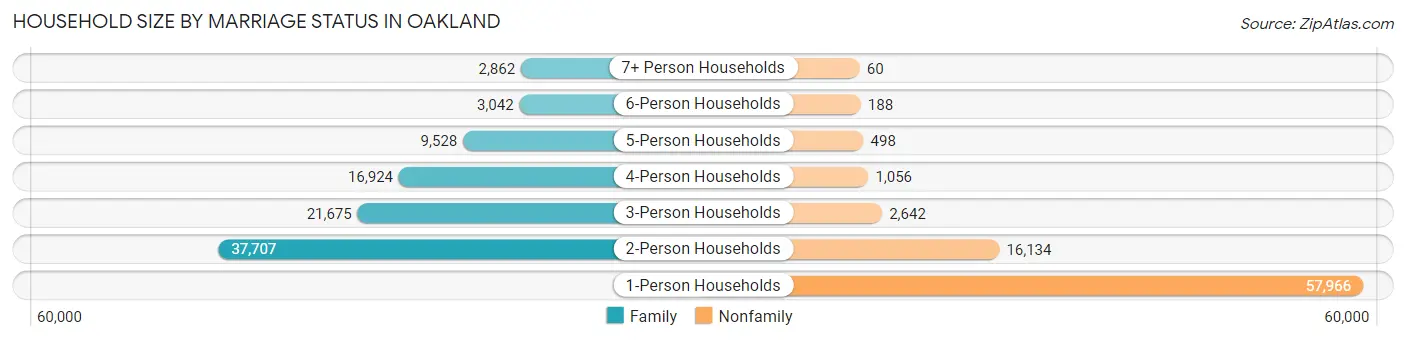
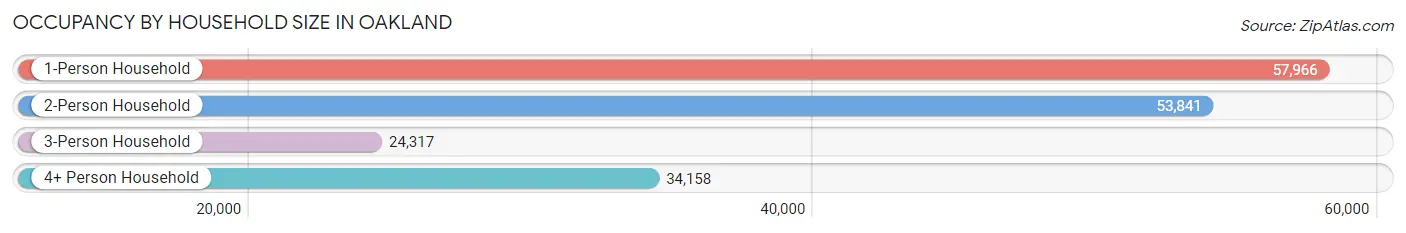
Out of a total of 170,282 households in Oakland, 91,738 (53.9%) are family households, while 78,544 (46.1%) are nonfamily households. The most numerous type of family households are 2-person households, comprising 37,707, and the most common type of nonfamily households are 1-person households, comprising 57,966.
| Household Size | Family Households | Nonfamily Households |
| 1-Person Households | - | 57,966 (34.0%) |
| 2-Person Households | 37,707 (22.1%) | 16,134 (9.5%) |
| 3-Person Households | 21,675 (12.7%) | 2,642 (1.5%) |
| 4-Person Households | 16,924 (9.9%) | 1,056 (0.6%) |
| 5-Person Households | 9,528 (5.6%) | 498 (0.3%) |
| 6-Person Households | 3,042 (1.8%) | 188 (0.1%) |
| 7+ Person Households | 2,862 (1.7%) | 60 (0.0%) |
| Total | 91,738 (53.9%) | 78,544 (46.1%) |
Female Fertility in Oakland
Fertility by Age in Oakland
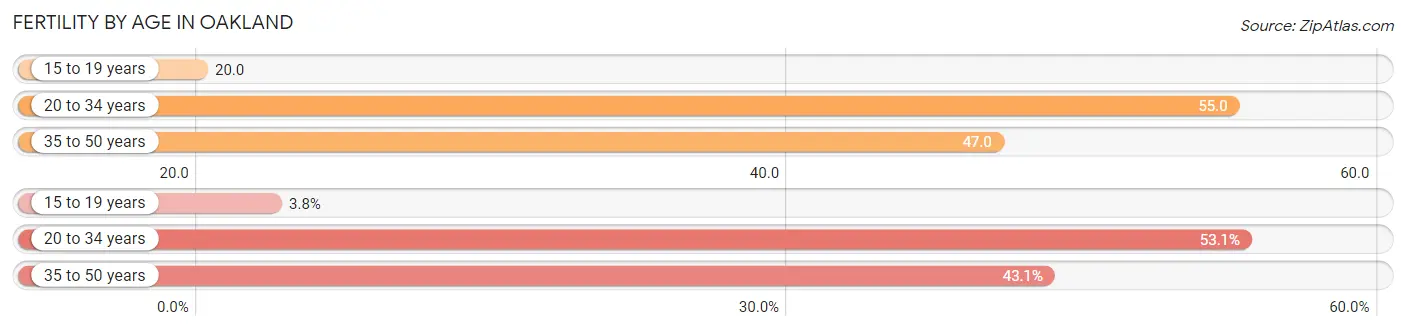
Average fertility rate in Oakland is 48.0 births per 1,000 women. Women in the age bracket of 20 to 34 years have the highest fertility rate with 55.0 births per 1,000 women. Women in the age bracket of 20 to 34 years acount for 53.1% of all women with births.
| Age Bracket | Women with Births | Births / 1,000 Women |
| 15 to 19 years | 215 (3.8%) | 20.0 |
| 20 to 34 years | 3,029 (53.1%) | 55.0 |
| 35 to 50 years | 2,457 (43.1%) | 47.0 |
| Total | 5,701 (100.0%) | 48.0 |
Fertility by Age by Marriage Status in Oakland
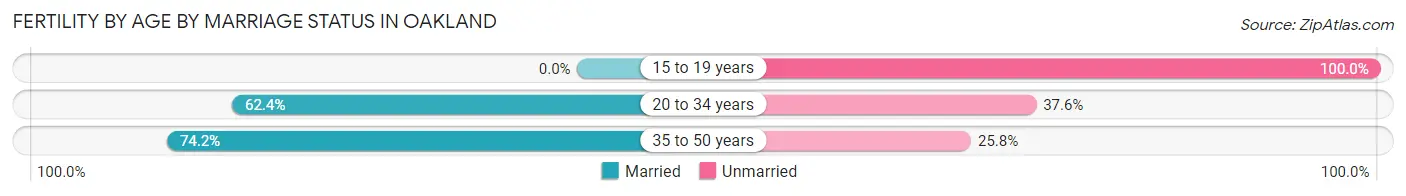
65.1% of women with births (5,701) in Oakland are married. The highest percentage of unmarried women with births falls into 15 to 19 years age bracket with 100.0% of them unmarried at the time of birth, while the lowest percentage of unmarried women with births belong to 35 to 50 years age bracket with 25.8% of them unmarried.
| Age Bracket | Married | Unmarried |
| 15 to 19 years | 0 (0.0%) | 215 (100.0%) |
| 20 to 34 years | 1,890 (62.4%) | 1,139 (37.6%) |
| 35 to 50 years | 1,823 (74.2%) | 634 (25.8%) |
| Total | 3,711 (65.1%) | 1,990 (34.9%) |
Fertility by Education in Oakland
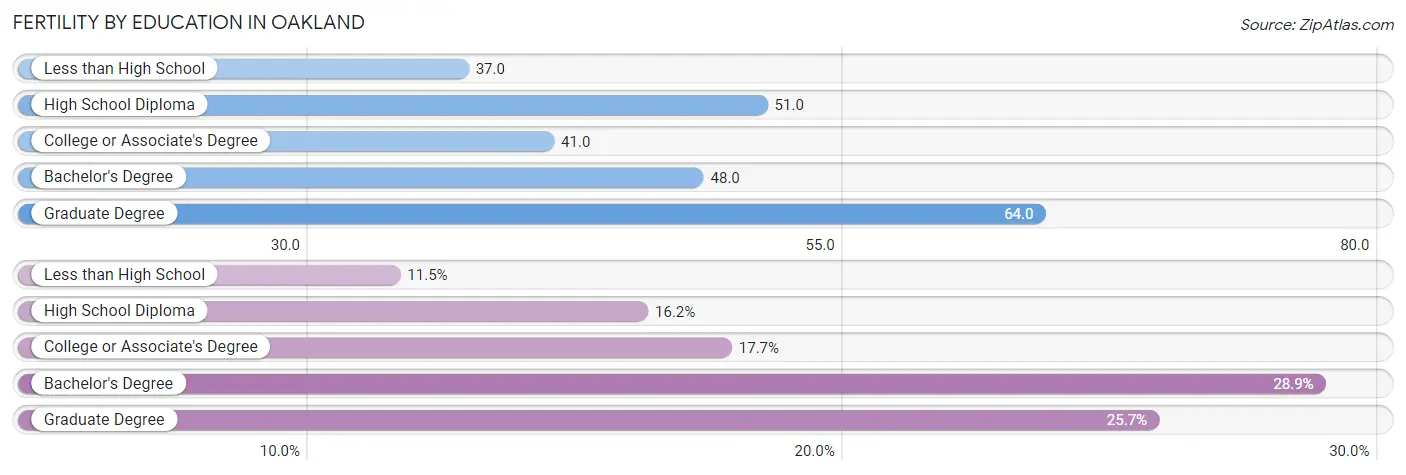
Average fertility rate in Oakland is 48.0 births per 1,000 women. Women with the education attainment of graduate degree have the highest fertility rate of 64.0 births per 1,000 women, while women with the education attainment of less than high school have the lowest fertility at 37.0 births per 1,000 women. Women with the education attainment of bachelor's degree represent 28.8% of all women with births.
| Educational Attainment | Women with Births | Births / 1,000 Women |
| Less than High School | 657 (11.5%) | 37.0 |
| High School Diploma | 921 (16.2%) | 51.0 |
| College or Associate's Degree | 1,011 (17.7%) | 41.0 |
| Bachelor's Degree | 1,645 (28.8%) | 48.0 |
| Graduate Degree | 1,467 (25.7%) | 64.0 |
| Total | 5,701 (100.0%) | 48.0 |
Fertility by Education by Marriage Status in Oakland
34.9% of women with births in Oakland are unmarried. Women with the educational attainment of graduate degree are most likely to be married with 88.2% of them married at childbirth, while women with the educational attainment of high school diploma are least likely to be married with 57.6% of them unmarried at childbirth.
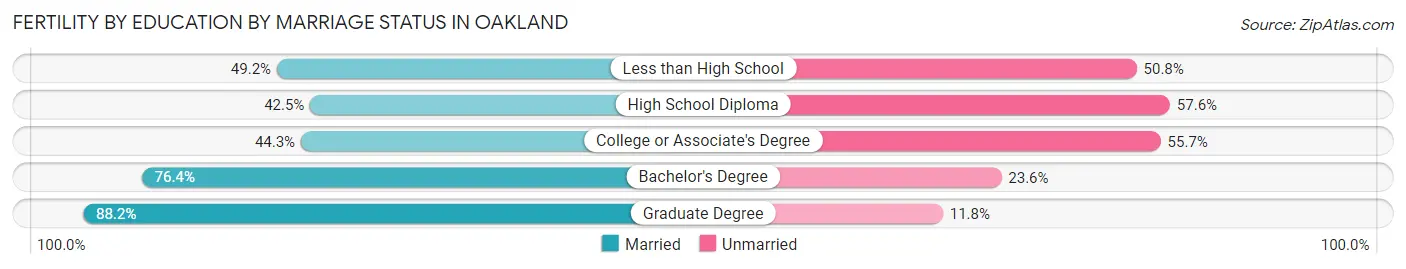
| Educational Attainment | Married | Unmarried |
| Less than High School | 323 (49.2%) | 334 (50.8%) |
| High School Diploma | 391 (42.4%) | 530 (57.6%) |
| College or Associate's Degree | 448 (44.3%) | 563 (55.7%) |
| Bachelor's Degree | 1,257 (76.4%) | 388 (23.6%) |
| Graduate Degree | 1,294 (88.2%) | 173 (11.8%) |
| Total | 3,711 (65.1%) | 1,990 (34.9%) |
Employment Characteristics in Oakland
Employment by Class of Employer in Oakland
Among the 229,022 employed individuals in Oakland, private company employees (143,997 | 62.9%), not-for-profit organizations (26,229 | 11.5%), and self-employed (not incorporated) (19,015 | 8.3%) make up the most common classes of employment.
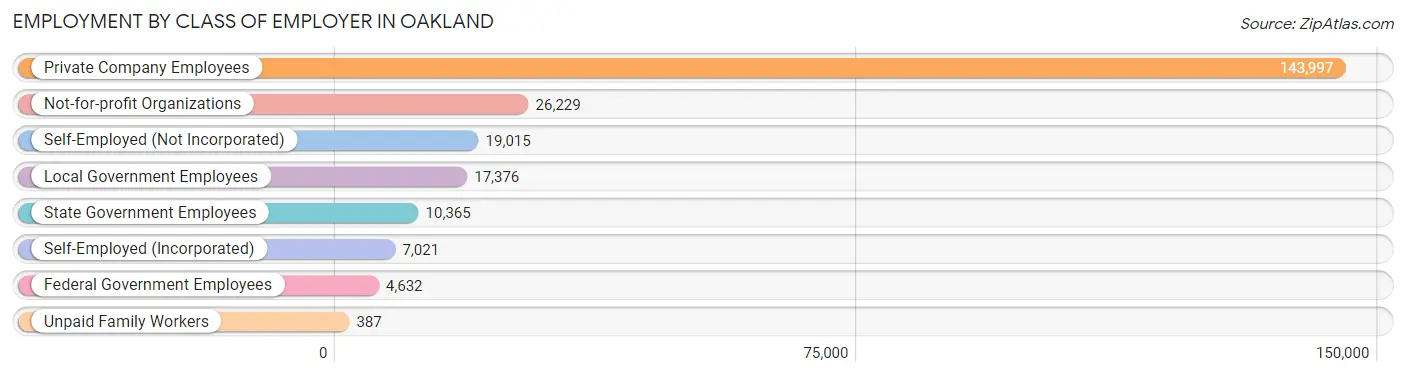
| Employer Class | # Employees | % Employees |
| Private Company Employees | 143,997 | 62.9% |
| Self-Employed (Incorporated) | 7,021 | 3.1% |
| Self-Employed (Not Incorporated) | 19,015 | 8.3% |
| Not-for-profit Organizations | 26,229 | 11.5% |
| Local Government Employees | 17,376 | 7.6% |
| State Government Employees | 10,365 | 4.5% |
| Federal Government Employees | 4,632 | 2.0% |
| Unpaid Family Workers | 387 | 0.2% |
| Total | 229,022 | 100.0% |
Employment Status by Age in Oakland
According to the labor force statistics for Oakland, out of the total population over 16 years of age (362,881), 68.4% or 248,211 individuals are in the labor force, with 5.8% or 14,396 of them unemployed. The age group with the highest labor force participation rate is 30 to 34 years, with 86.9% or 39,951 individuals in the labor force. Within the labor force, the 16 to 19 years age range has the highest percentage of unemployed individuals, with 18.3% or 855 of them being unemployed.
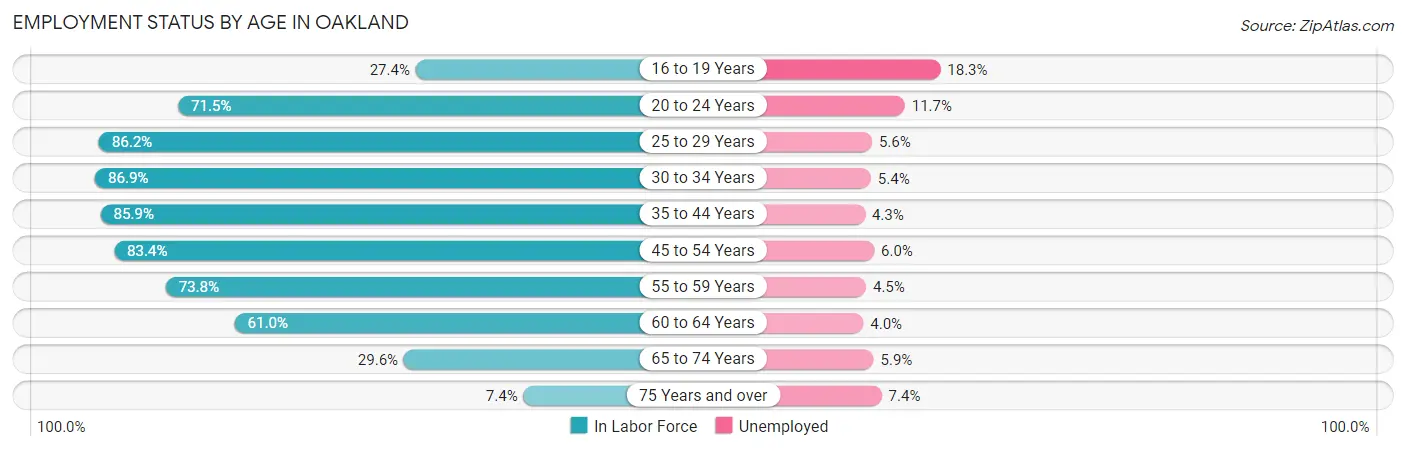
| Age Bracket | In Labor Force | Unemployed |
| 16 to 19 Years | 4,671 (27.4%) | 855 (18.3%) |
| 20 to 24 Years | 16,385 (71.5%) | 1,917 (11.7%) |
| 25 to 29 Years | 33,068 (86.2%) | 1,852 (5.6%) |
| 30 to 34 Years | 39,951 (86.9%) | 2,157 (5.4%) |
| 35 to 44 Years | 61,133 (85.9%) | 2,629 (4.3%) |
| 45 to 54 Years | 46,651 (83.4%) | 2,799 (6.0%) |
| 55 to 59 Years | 18,857 (73.8%) | 849 (4.5%) |
| 60 to 64 Years | 14,836 (61.0%) | 593 (4.0%) |
| 65 to 74 Years | 10,736 (29.6%) | 633 (5.9%) |
| 75 Years and over | 1,875 (7.4%) | 139 (7.4%) |
| Total | 248,211 (68.4%) | 14,396 (5.8%) |
Employment Status by Educational Attainment in Oakland
According to labor force statistics for Oakland, 82.1% of individuals (214,537) out of the total population between 25 and 64 years of age (261,312) are in the labor force, with 5.1% or 10,941 of them being unemployed. The group with the highest labor force participation rate are those with the educational attainment of bachelor's degree or higher, with 91.3% or 119,877 individuals in the labor force. Within the labor force, individuals with less than high school education have the highest percentage of unemployment, with 7.5% or 1,640 of them being unemployed.
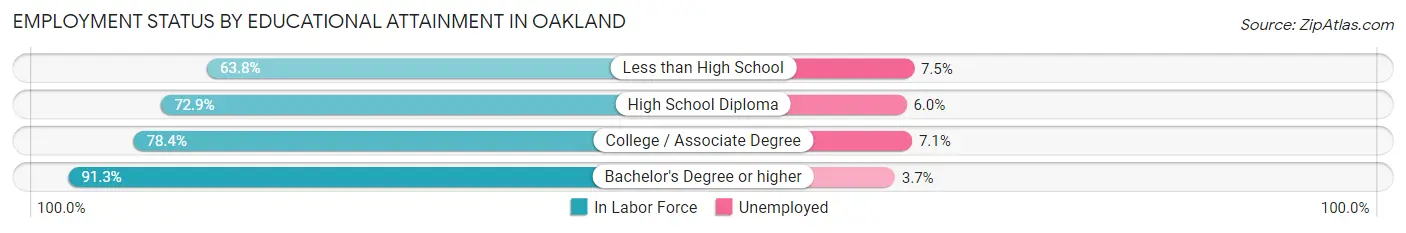
| Educational Attainment | In Labor Force | Unemployed |
| Less than High School | 21,870 (63.8%) | 2,571 (7.5%) |
| High School Diploma | 30,907 (72.9%) | 2,544 (6.0%) |
| College / Associate Degree | 41,816 (78.4%) | 3,787 (7.1%) |
| Bachelor's Degree or higher | 119,877 (91.3%) | 4,858 (3.7%) |
| Total | 214,537 (82.1%) | 13,327 (5.1%) |
Employment Occupations by Sex in Oakland
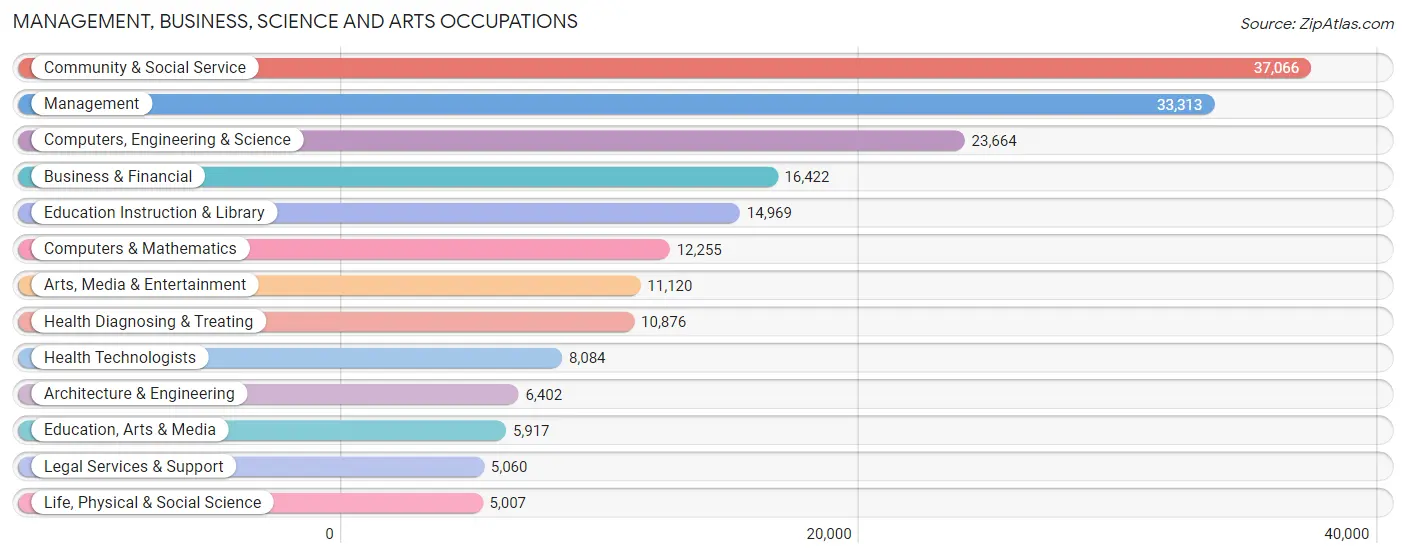
Management, Business, Science and Arts Occupations
The most common Management, Business, Science and Arts occupations in Oakland are Community & Social Service (37,066 | 15.9%), Management (33,313 | 14.3%), Computers, Engineering & Science (23,664 | 10.1%), Business & Financial (16,422 | 7.0%), and Education Instruction & Library (14,969 | 6.4%).
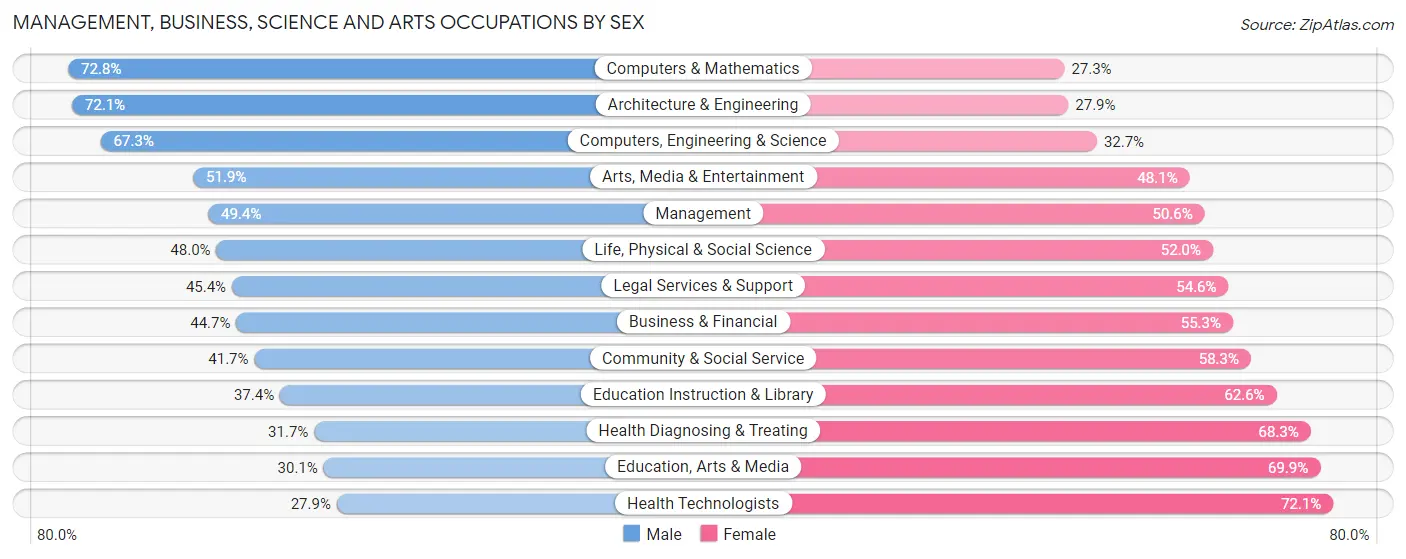
Management, Business, Science and Arts Occupations by Sex
Within the Management, Business, Science and Arts occupations in Oakland, the most male-oriented occupations are Computers & Mathematics (72.8%), Architecture & Engineering (72.1%), and Computers, Engineering & Science (67.3%), while the most female-oriented occupations are Health Technologists (72.1%), Education, Arts & Media (69.9%), and Health Diagnosing & Treating (68.3%).
| Occupation | Male | Female |
| Management | 16,451 (49.4%) | 16,862 (50.6%) |
| Business & Financial | 7,335 (44.7%) | 9,087 (55.3%) |
| Computers, Engineering & Science | 15,934 (67.3%) | 7,730 (32.7%) |
| Computers & Mathematics | 8,915 (72.8%) | 3,340 (27.3%) |
| Architecture & Engineering | 4,616 (72.1%) | 1,786 (27.9%) |
| Life, Physical & Social Science | 2,403 (48.0%) | 2,604 (52.0%) |
| Community & Social Service | 15,443 (41.7%) | 21,623 (58.3%) |
| Education, Arts & Media | 1,781 (30.1%) | 4,136 (69.9%) |
| Legal Services & Support | 2,297 (45.4%) | 2,763 (54.6%) |
| Education Instruction & Library | 5,595 (37.4%) | 9,374 (62.6%) |
| Arts, Media & Entertainment | 5,770 (51.9%) | 5,350 (48.1%) |
| Health Diagnosing & Treating | 3,445 (31.7%) | 7,431 (68.3%) |
| Health Technologists | 2,256 (27.9%) | 5,828 (72.1%) |
| Total (Category) | 58,608 (48.3%) | 62,733 (51.7%) |
| Total (Overall) | 122,045 (52.3%) | 111,351 (47.7%) |
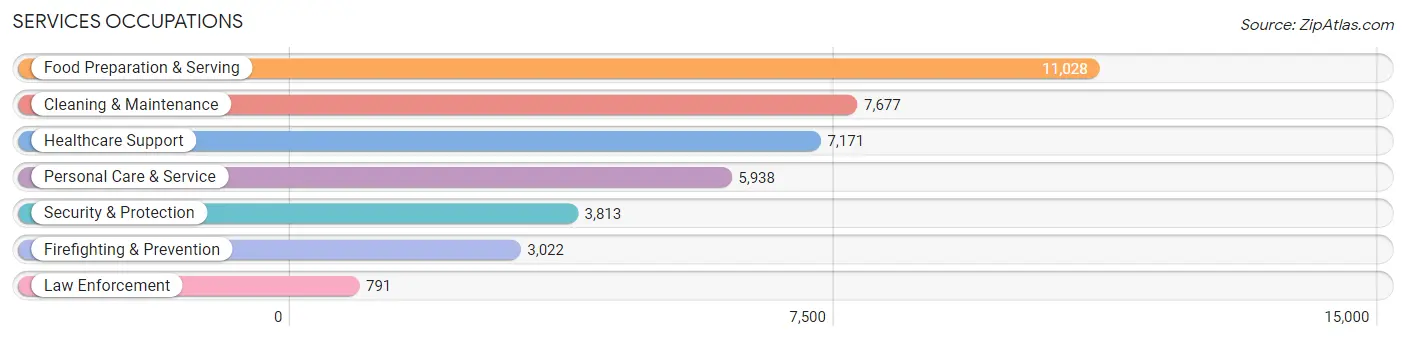
Services Occupations
The most common Services occupations in Oakland are Food Preparation & Serving (11,028 | 4.7%), Cleaning & Maintenance (7,677 | 3.3%), Healthcare Support (7,171 | 3.1%), Personal Care & Service (5,938 | 2.5%), and Security & Protection (3,813 | 1.6%).
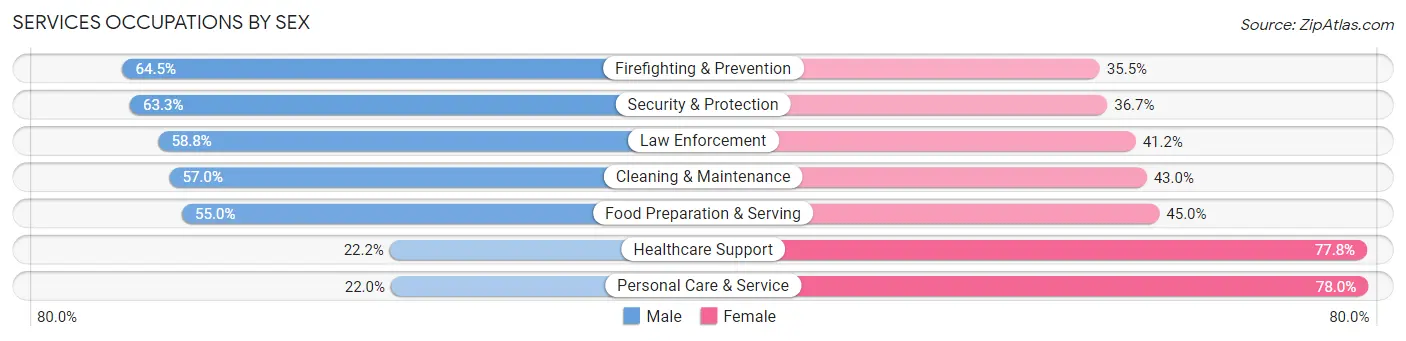
Services Occupations by Sex
Within the Services occupations in Oakland, the most male-oriented occupations are Firefighting & Prevention (64.5%), Security & Protection (63.3%), and Law Enforcement (58.8%), while the most female-oriented occupations are Personal Care & Service (78.0%), Healthcare Support (77.8%), and Food Preparation & Serving (45.0%).
| Occupation | Male | Female |
| Healthcare Support | 1,589 (22.2%) | 5,582 (77.8%) |
| Security & Protection | 2,413 (63.3%) | 1,400 (36.7%) |
| Firefighting & Prevention | 1,948 (64.5%) | 1,074 (35.5%) |
| Law Enforcement | 465 (58.8%) | 326 (41.2%) |
| Food Preparation & Serving | 6,070 (55.0%) | 4,958 (45.0%) |
| Cleaning & Maintenance | 4,379 (57.0%) | 3,298 (43.0%) |
| Personal Care & Service | 1,306 (22.0%) | 4,632 (78.0%) |
| Total (Category) | 15,757 (44.2%) | 19,870 (55.8%) |
| Total (Overall) | 122,045 (52.3%) | 111,351 (47.7%) |
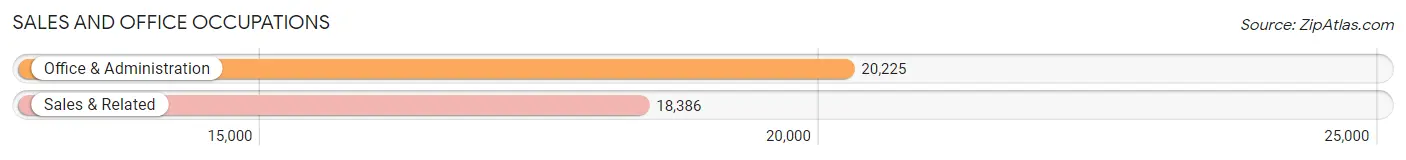
Sales and Office Occupations
The most common Sales and Office occupations in Oakland are Office & Administration (20,225 | 8.7%), and Sales & Related (18,386 | 7.9%).
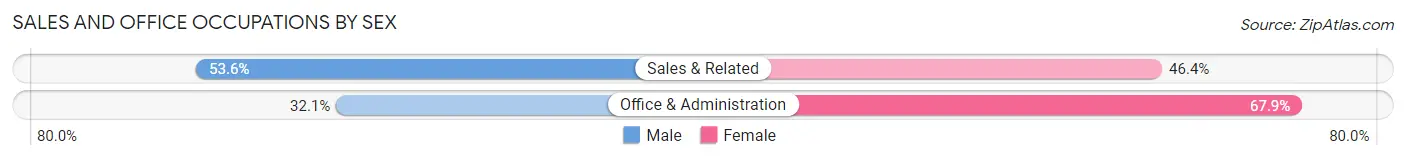
Sales and Office Occupations by Sex
| Occupation | Male | Female |
| Sales & Related | 9,854 (53.6%) | 8,532 (46.4%) |
| Office & Administration | 6,486 (32.1%) | 13,739 (67.9%) |
| Total (Category) | 16,340 (42.3%) | 22,271 (57.7%) |
| Total (Overall) | 122,045 (52.3%) | 111,351 (47.7%) |
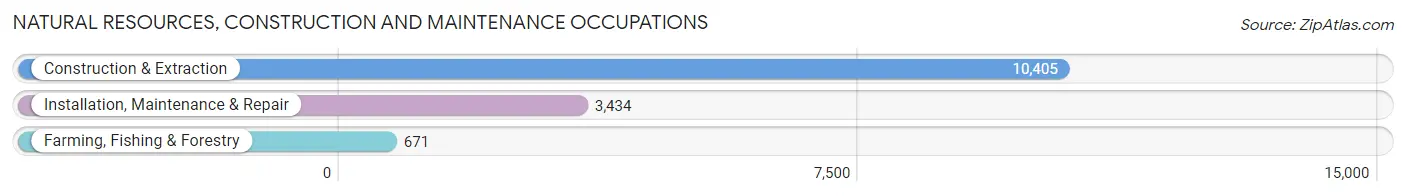
Natural Resources, Construction and Maintenance Occupations
The most common Natural Resources, Construction and Maintenance occupations in Oakland are Construction & Extraction (10,405 | 4.5%), Installation, Maintenance & Repair (3,434 | 1.5%), and Farming, Fishing & Forestry (671 | 0.3%).
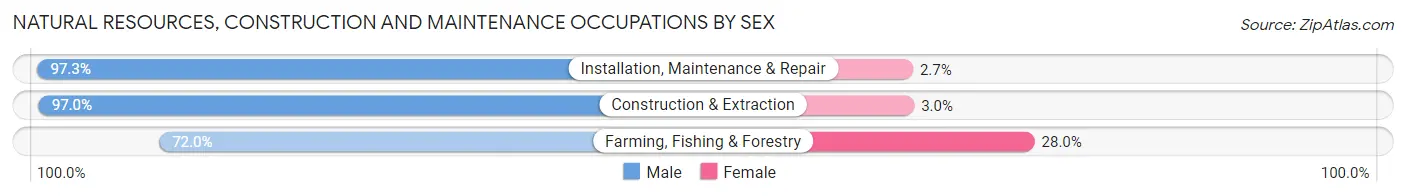
Natural Resources, Construction and Maintenance Occupations by Sex
| Occupation | Male | Female |
| Farming, Fishing & Forestry | 483 (72.0%) | 188 (28.0%) |
| Construction & Extraction | 10,096 (97.0%) | 309 (3.0%) |
| Installation, Maintenance & Repair | 3,341 (97.3%) | 93 (2.7%) |
| Total (Category) | 13,920 (95.9%) | 590 (4.1%) |
| Total (Overall) | 122,045 (52.3%) | 111,351 (47.7%) |
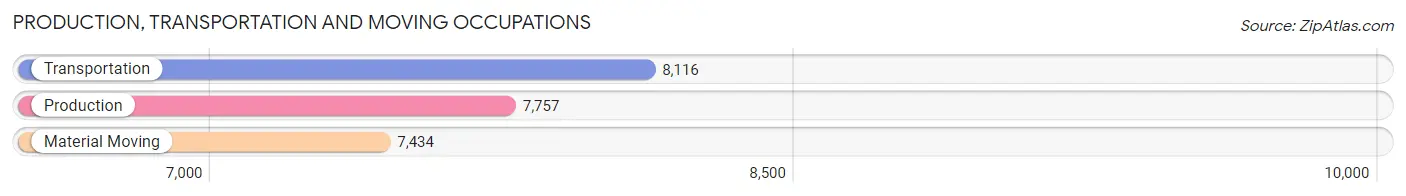
Production, Transportation and Moving Occupations
The most common Production, Transportation and Moving occupations in Oakland are Transportation (8,116 | 3.5%), Production (7,757 | 3.3%), and Material Moving (7,434 | 3.2%).
Production, Transportation and Moving Occupations by Sex
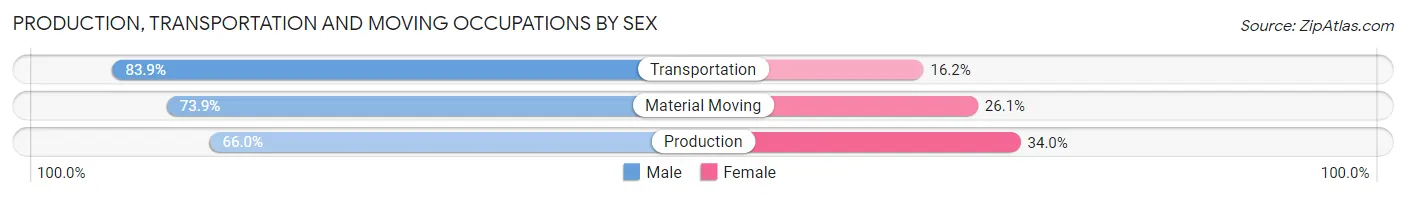
| Occupation | Male | Female |
| Production | 5,123 (66.0%) | 2,634 (34.0%) |
| Transportation | 6,805 (83.9%) | 1,311 (16.2%) |
| Material Moving | 5,492 (73.9%) | 1,942 (26.1%) |
| Total (Category) | 17,420 (74.7%) | 5,887 (25.3%) |
| Total (Overall) | 122,045 (52.3%) | 111,351 (47.7%) |
Employment Industries by Sex in Oakland
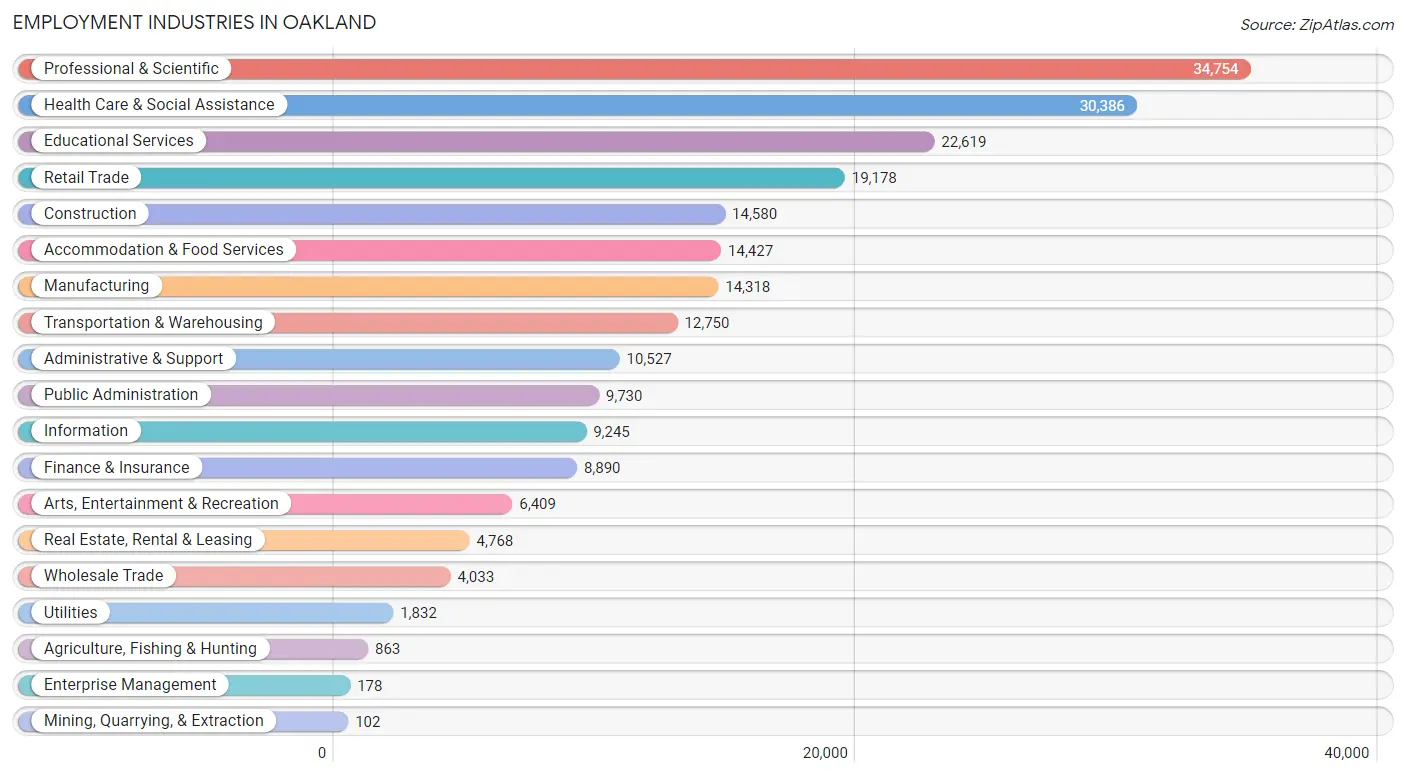
Employment Industries in Oakland
The major employment industries in Oakland include Professional & Scientific (34,754 | 14.9%), Health Care & Social Assistance (30,386 | 13.0%), Educational Services (22,619 | 9.7%), Retail Trade (19,178 | 8.2%), and Construction (14,580 | 6.2%).
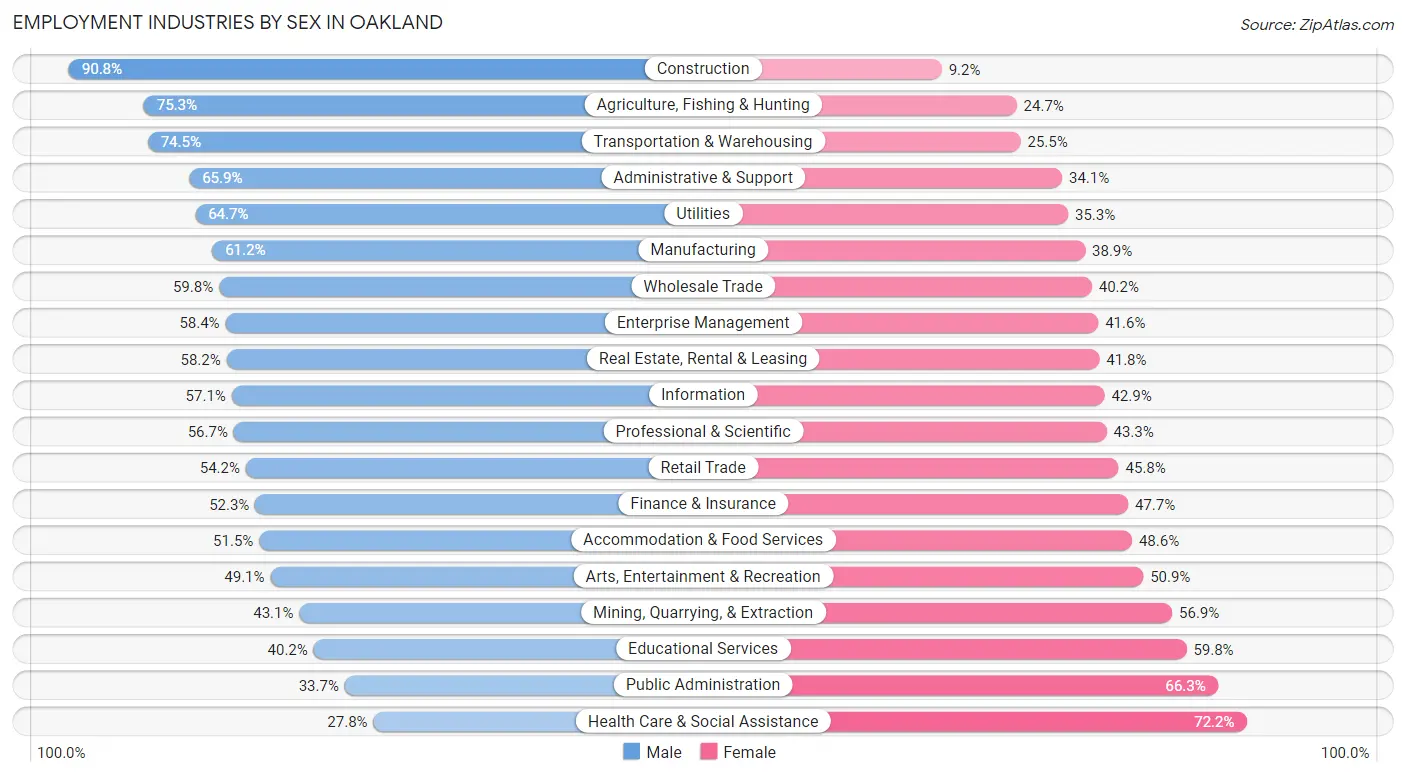
Employment Industries by Sex in Oakland
The Oakland industries that see more men than women are Construction (90.8%), Agriculture, Fishing & Hunting (75.3%), and Transportation & Warehousing (74.5%), whereas the industries that tend to have a higher number of women are Health Care & Social Assistance (72.2%), Public Administration (66.3%), and Educational Services (59.8%).
| Industry | Male | Female |
| Agriculture, Fishing & Hunting | 650 (75.3%) | 213 (24.7%) |
| Mining, Quarrying, & Extraction | 44 (43.1%) | 58 (56.9%) |
| Construction | 13,243 (90.8%) | 1,337 (9.2%) |
| Manufacturing | 8,756 (61.2%) | 5,562 (38.9%) |
| Wholesale Trade | 2,410 (59.8%) | 1,623 (40.2%) |
| Retail Trade | 10,399 (54.2%) | 8,779 (45.8%) |
| Transportation & Warehousing | 9,500 (74.5%) | 3,250 (25.5%) |
| Utilities | 1,185 (64.7%) | 647 (35.3%) |
| Information | 5,283 (57.1%) | 3,962 (42.9%) |
| Finance & Insurance | 4,647 (52.3%) | 4,243 (47.7%) |
| Real Estate, Rental & Leasing | 2,775 (58.2%) | 1,993 (41.8%) |
| Professional & Scientific | 19,708 (56.7%) | 15,046 (43.3%) |
| Enterprise Management | 104 (58.4%) | 74 (41.6%) |
| Administrative & Support | 6,939 (65.9%) | 3,588 (34.1%) |
| Educational Services | 9,089 (40.2%) | 13,530 (59.8%) |
| Health Care & Social Assistance | 8,446 (27.8%) | 21,940 (72.2%) |
| Arts, Entertainment & Recreation | 3,149 (49.1%) | 3,260 (50.9%) |
| Accommodation & Food Services | 7,423 (51.4%) | 7,004 (48.5%) |
| Public Administration | 3,283 (33.7%) | 6,447 (66.3%) |
| Total | 122,045 (52.3%) | 111,351 (47.7%) |
Education in Oakland
School Enrollment in Oakland
The most common levels of schooling among the 94,803 students in Oakland are college / undergraduate (20,964 | 22.1%), high school (18,669 | 19.7%), and middle school (17,339 | 18.3%).
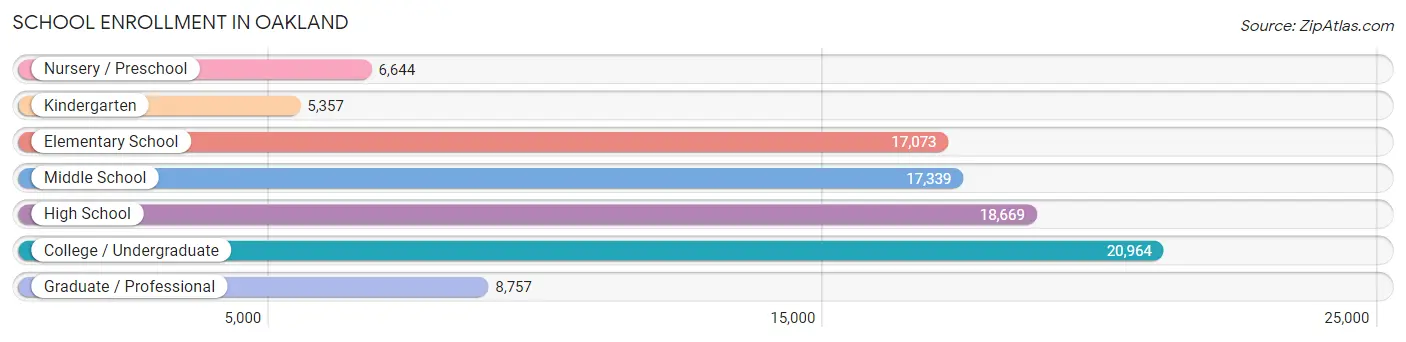
| School Level | # Students | % Students |
| Nursery / Preschool | 6,644 | 7.0% |
| Kindergarten | 5,357 | 5.7% |
| Elementary School | 17,073 | 18.0% |
| Middle School | 17,339 | 18.3% |
| High School | 18,669 | 19.7% |
| College / Undergraduate | 20,964 | 22.1% |
| Graduate / Professional | 8,757 | 9.2% |
| Total | 94,803 | 100.0% |
School Enrollment by Age by Funding Source in Oakland
Out of a total of 94,803 students who are enrolled in schools in Oakland, 18,866 (19.9%) attend a private institution, while the remaining 75,937 (80.1%) are enrolled in public schools. The age group of 3 to 4 year olds has the highest likelihood of being enrolled in private schools, with 2,840 (49.5% in the age bracket) enrolled. Conversely, the age group of 18 to 19 year olds has the lowest likelihood of being enrolled in a private school, with 5,446 (88.2% in the age bracket) attending a public institution.
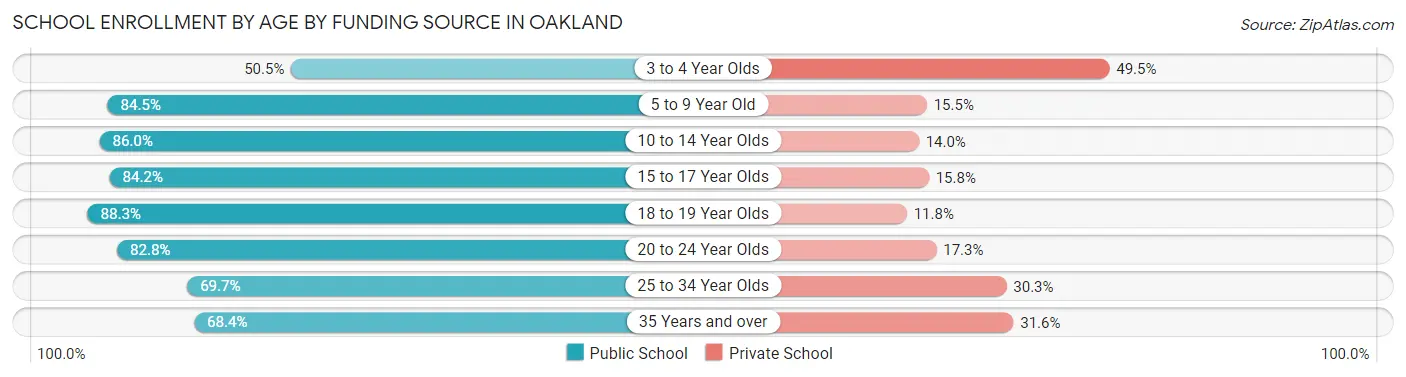
| Age Bracket | Public School | Private School |
| 3 to 4 Year Olds | 2,900 (50.5%) | 2,840 (49.5%) |
| 5 to 9 Year Old | 17,824 (84.5%) | 3,262 (15.5%) |
| 10 to 14 Year Olds | 19,529 (86.0%) | 3,171 (14.0%) |
| 15 to 17 Year Olds | 10,723 (84.2%) | 2,018 (15.8%) |
| 18 to 19 Year Olds | 5,446 (88.2%) | 725 (11.7%) |
| 20 to 24 Year Olds | 7,478 (82.8%) | 1,559 (17.2%) |
| 25 to 34 Year Olds | 7,386 (69.7%) | 3,211 (30.3%) |
| 35 Years and over | 4,605 (68.4%) | 2,126 (31.6%) |
| Total | 75,937 (80.1%) | 18,866 (19.9%) |
Educational Attainment by Field of Study in Oakland
Social sciences (27,652 | 16.1%), business (17,731 | 10.3%), visual & performing arts (15,114 | 8.8%), literature & languages (14,349 | 8.4%), and bio, nature & agricultural (12,930 | 7.5%) are the most common fields of study among 171,355 individuals in Oakland who have obtained a bachelor's degree or higher.
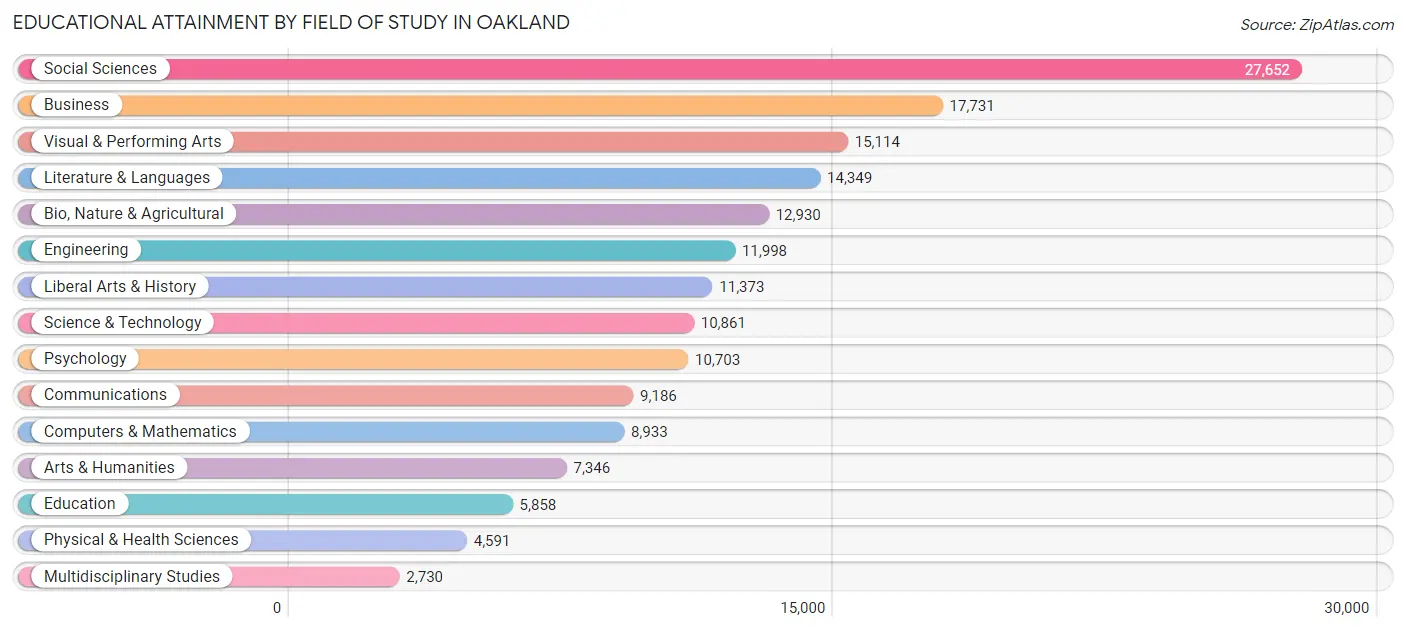
| Field of Study | # Graduates | % Graduates |
| Computers & Mathematics | 8,933 | 5.2% |
| Bio, Nature & Agricultural | 12,930 | 7.5% |
| Physical & Health Sciences | 4,591 | 2.7% |
| Psychology | 10,703 | 6.2% |
| Social Sciences | 27,652 | 16.1% |
| Engineering | 11,998 | 7.0% |
| Multidisciplinary Studies | 2,730 | 1.6% |
| Science & Technology | 10,861 | 6.3% |
| Business | 17,731 | 10.3% |
| Education | 5,858 | 3.4% |
| Literature & Languages | 14,349 | 8.4% |
| Liberal Arts & History | 11,373 | 6.6% |
| Visual & Performing Arts | 15,114 | 8.8% |
| Communications | 9,186 | 5.4% |
| Arts & Humanities | 7,346 | 4.3% |
| Total | 171,355 | 100.0% |
Transportation & Commute in Oakland
Vehicle Availability by Sex in Oakland
The most prevalent vehicle ownership categories in Oakland are males with 2 vehicles (44,485, accounting for 37.2%) and females with 2 vehicles (37,703, making up 41.1%).
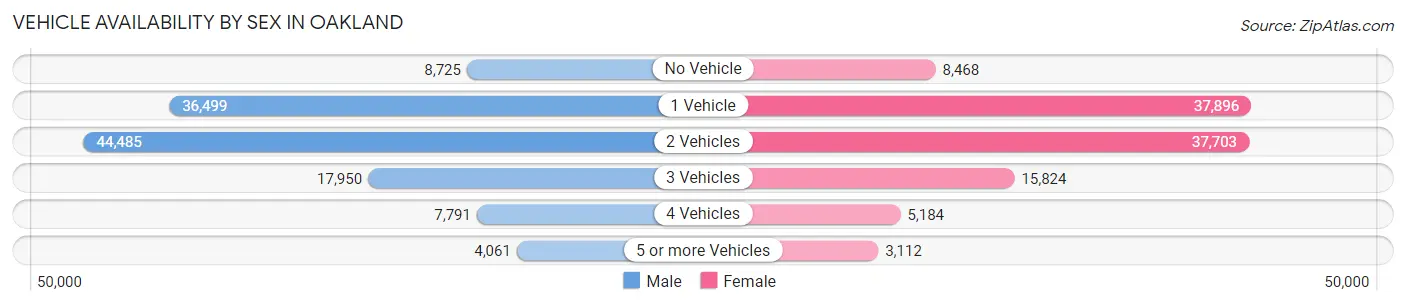
| Vehicles Available | Male | Female |
| No Vehicle | 8,725 (7.3%) | 8,468 (7.8%) |
| 1 Vehicle | 36,499 (30.5%) | 37,896 (35.0%) |
| 2 Vehicles | 44,485 (37.2%) | 37,703 (34.8%) |
| 3 Vehicles | 17,950 (15.0%) | 15,824 (14.6%) |
| 4 Vehicles | 7,791 (6.5%) | 5,184 (4.8%) |
| 5 or more Vehicles | 4,061 (3.4%) | 3,112 (2.9%) |
| Total | 119,511 (100.0%) | 108,187 (100.0%) |
Commute Time in Oakland
The most frequently occuring commute durations in Oakland are 30 to 34 minutes (28,219 commuters, 15.5%), 15 to 19 minutes (27,243 commuters, 14.9%), and 20 to 24 minutes (24,696 commuters, 13.5%).
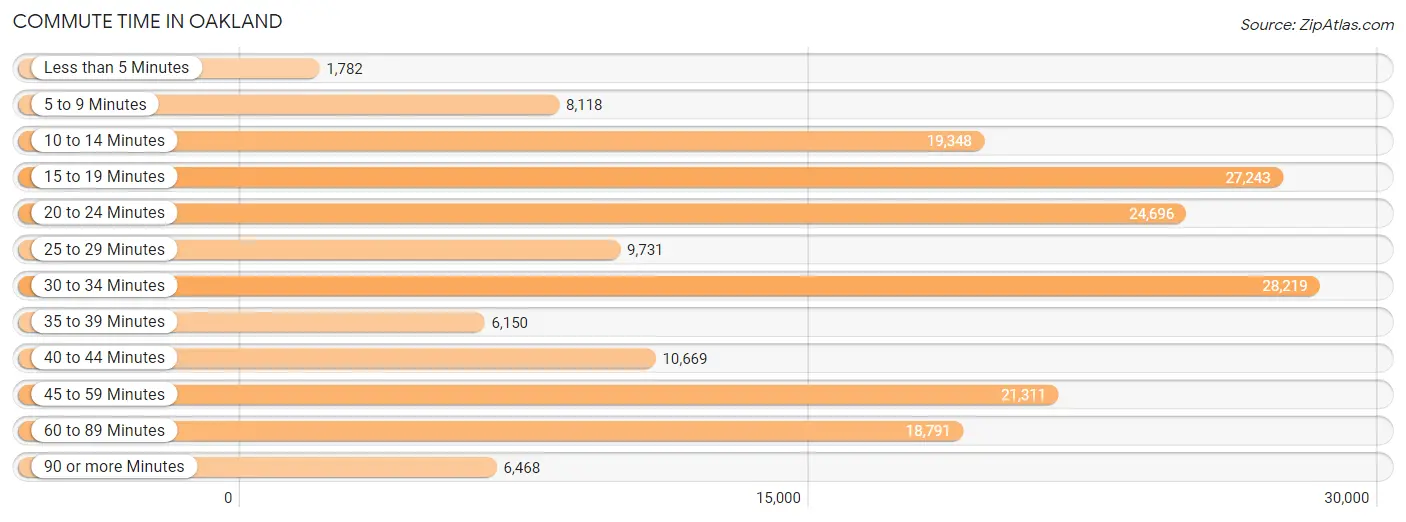
| Commute Time | # Commuters | % Commuters |
| Less than 5 Minutes | 1,782 | 1.0% |
| 5 to 9 Minutes | 8,118 | 4.4% |
| 10 to 14 Minutes | 19,348 | 10.6% |
| 15 to 19 Minutes | 27,243 | 14.9% |
| 20 to 24 Minutes | 24,696 | 13.5% |
| 25 to 29 Minutes | 9,731 | 5.3% |
| 30 to 34 Minutes | 28,219 | 15.5% |
| 35 to 39 Minutes | 6,150 | 3.4% |
| 40 to 44 Minutes | 10,669 | 5.9% |
| 45 to 59 Minutes | 21,311 | 11.7% |
| 60 to 89 Minutes | 18,791 | 10.3% |
| 90 or more Minutes | 6,468 | 3.5% |
Commute Time by Sex in Oakland
The most common commute times in Oakland are 30 to 34 minutes (15,429 commuters, 15.8%) for males and 15 to 19 minutes (13,613 commuters, 16.1%) for females.
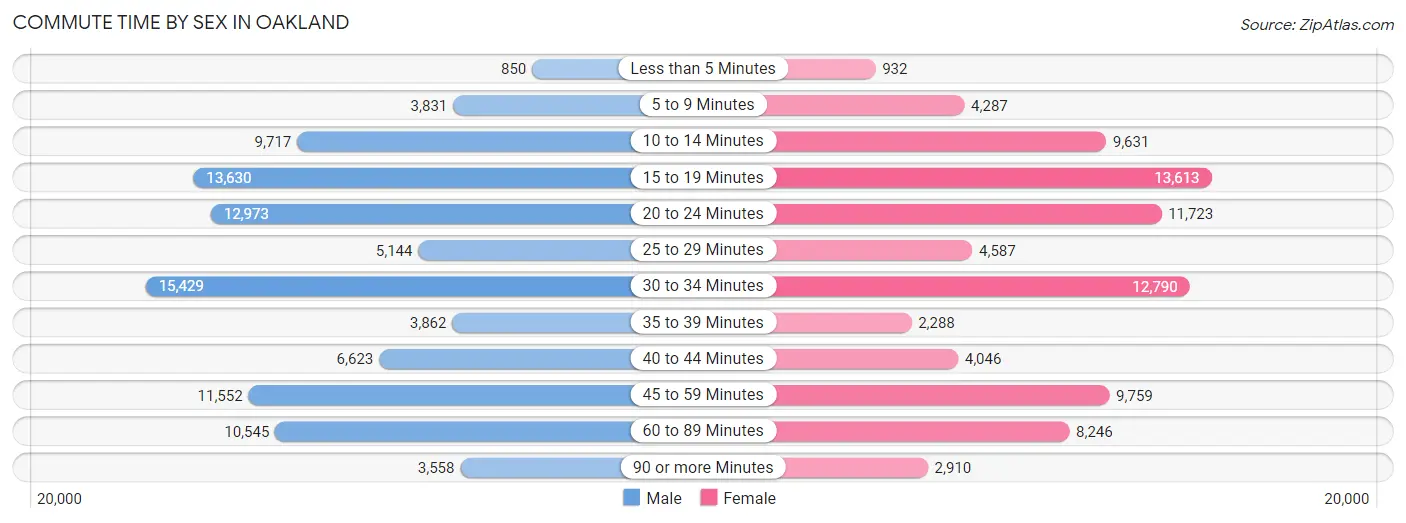
| Commute Time | Male | Female |
| Less than 5 Minutes | 850 (0.9%) | 932 (1.1%) |
| 5 to 9 Minutes | 3,831 (3.9%) | 4,287 (5.1%) |
| 10 to 14 Minutes | 9,717 (9.9%) | 9,631 (11.4%) |
| 15 to 19 Minutes | 13,630 (14.0%) | 13,613 (16.1%) |
| 20 to 24 Minutes | 12,973 (13.3%) | 11,723 (13.8%) |
| 25 to 29 Minutes | 5,144 (5.3%) | 4,587 (5.4%) |
| 30 to 34 Minutes | 15,429 (15.8%) | 12,790 (15.1%) |
| 35 to 39 Minutes | 3,862 (4.0%) | 2,288 (2.7%) |
| 40 to 44 Minutes | 6,623 (6.8%) | 4,046 (4.8%) |
| 45 to 59 Minutes | 11,552 (11.8%) | 9,759 (11.5%) |
| 60 to 89 Minutes | 10,545 (10.8%) | 8,246 (9.7%) |
| 90 or more Minutes | 3,558 (3.6%) | 2,910 (3.4%) |
Time of Departure to Work by Sex in Oakland
The most frequent times of departure to work in Oakland are 8:00 AM to 8:29 AM (14,410, 14.7%) for males and 8:00 AM to 8:29 AM (14,838, 17.5%) for females.
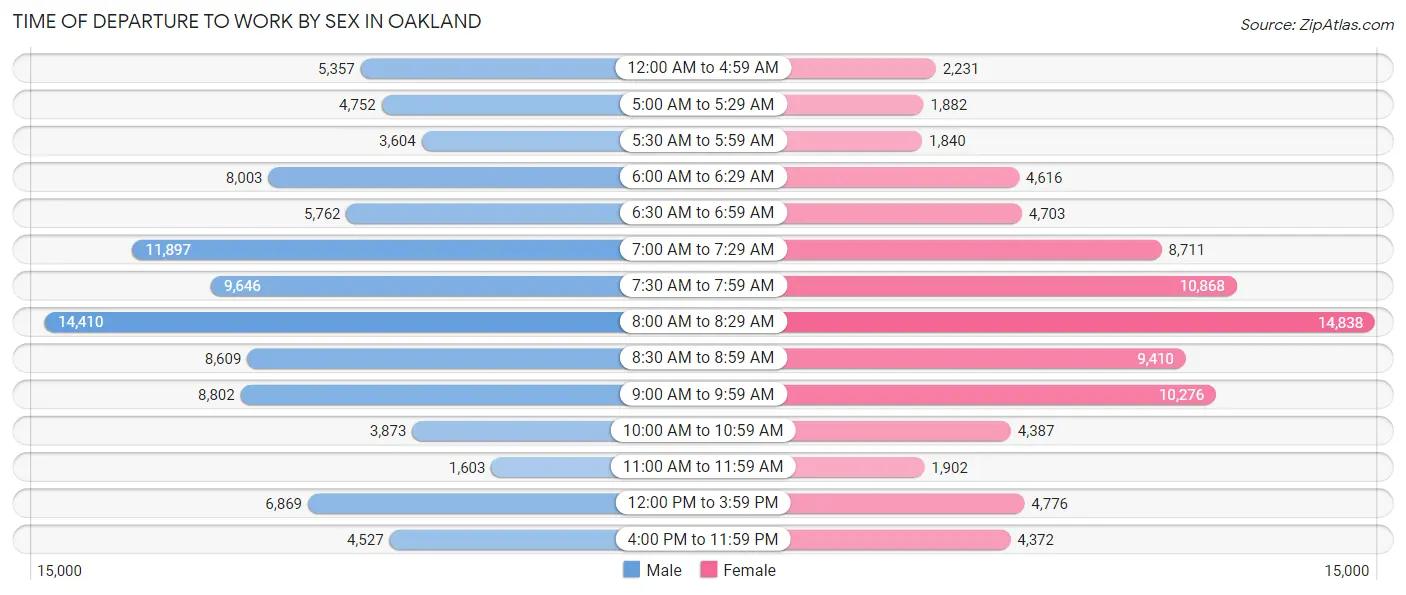
| Time of Departure | Male | Female |
| 12:00 AM to 4:59 AM | 5,357 (5.5%) | 2,231 (2.6%) |
| 5:00 AM to 5:29 AM | 4,752 (4.9%) | 1,882 (2.2%) |
| 5:30 AM to 5:59 AM | 3,604 (3.7%) | 1,840 (2.2%) |
| 6:00 AM to 6:29 AM | 8,003 (8.2%) | 4,616 (5.4%) |
| 6:30 AM to 6:59 AM | 5,762 (5.9%) | 4,703 (5.6%) |
| 7:00 AM to 7:29 AM | 11,897 (12.2%) | 8,711 (10.3%) |
| 7:30 AM to 7:59 AM | 9,646 (9.9%) | 10,868 (12.8%) |
| 8:00 AM to 8:29 AM | 14,410 (14.7%) | 14,838 (17.5%) |
| 8:30 AM to 8:59 AM | 8,609 (8.8%) | 9,410 (11.1%) |
| 9:00 AM to 9:59 AM | 8,802 (9.0%) | 10,276 (12.1%) |
| 10:00 AM to 10:59 AM | 3,873 (4.0%) | 4,387 (5.2%) |
| 11:00 AM to 11:59 AM | 1,603 (1.6%) | 1,902 (2.2%) |
| 12:00 PM to 3:59 PM | 6,869 (7.0%) | 4,776 (5.6%) |
| 4:00 PM to 11:59 PM | 4,527 (4.6%) | 4,372 (5.1%) |
| Total | 97,714 (100.0%) | 84,812 (100.0%) |
Housing Occupancy in Oakland
Occupancy by Ownership in Oakland
Of the total 170,282 dwellings in Oakland, owner-occupied units account for 71,633 (42.1%), while renter-occupied units make up 98,649 (57.9%).
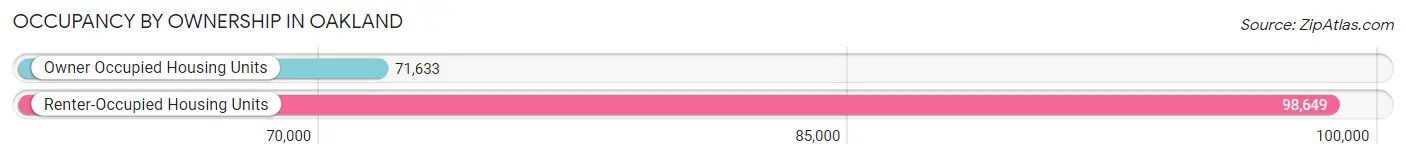
| Occupancy | # Housing Units | % Housing Units |
| Owner Occupied Housing Units | 71,633 | 42.1% |
| Renter-Occupied Housing Units | 98,649 | 57.9% |
| Total Occupied Housing Units | 170,282 | 100.0% |
Occupancy by Household Size in Oakland
| Household Size | # Housing Units | % Housing Units |
| 1-Person Household | 57,966 | 34.0% |
| 2-Person Household | 53,841 | 31.6% |
| 3-Person Household | 24,317 | 14.3% |
| 4+ Person Household | 34,158 | 20.1% |
| Total Housing Units | 170,282 | 100.0% |
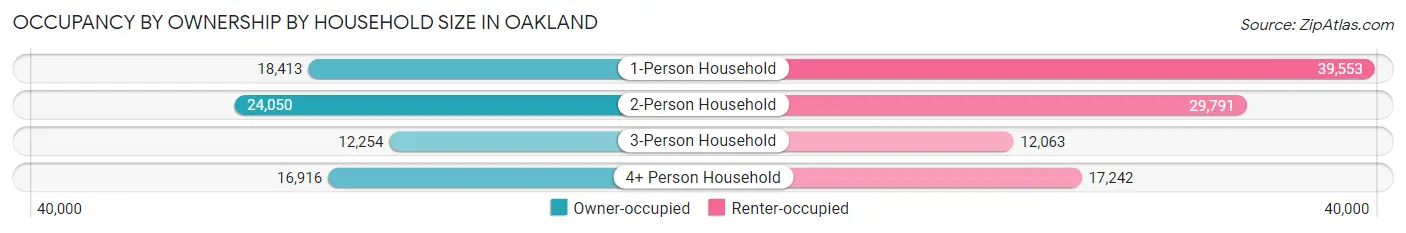
Occupancy by Ownership by Household Size in Oakland
| Household Size | Owner-occupied | Renter-occupied |
| 1-Person Household | 18,413 (31.8%) | 39,553 (68.2%) |
| 2-Person Household | 24,050 (44.7%) | 29,791 (55.3%) |
| 3-Person Household | 12,254 (50.4%) | 12,063 (49.6%) |
| 4+ Person Household | 16,916 (49.5%) | 17,242 (50.5%) |
| Total Housing Units | 71,633 (42.1%) | 98,649 (57.9%) |
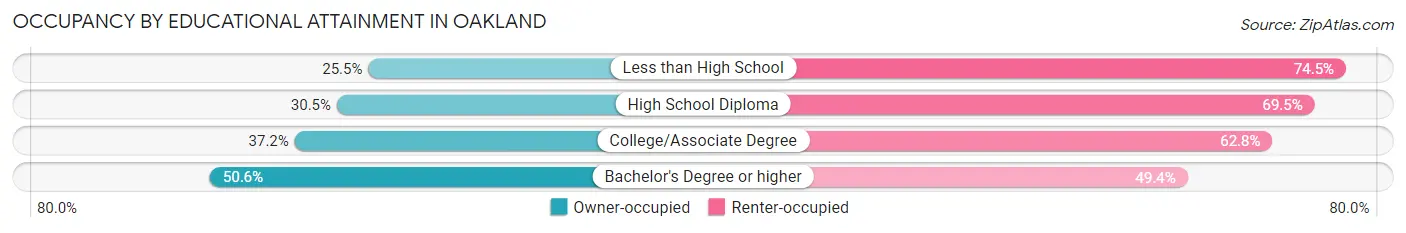
Occupancy by Educational Attainment in Oakland
| Household Size | Owner-occupied | Renter-occupied |
| Less than High School | 4,810 (25.5%) | 14,057 (74.5%) |
| High School Diploma | 7,208 (30.5%) | 16,447 (69.5%) |
| College/Associate Degree | 13,951 (37.2%) | 23,582 (62.8%) |
| Bachelor's Degree or higher | 45,664 (50.6%) | 44,563 (49.4%) |
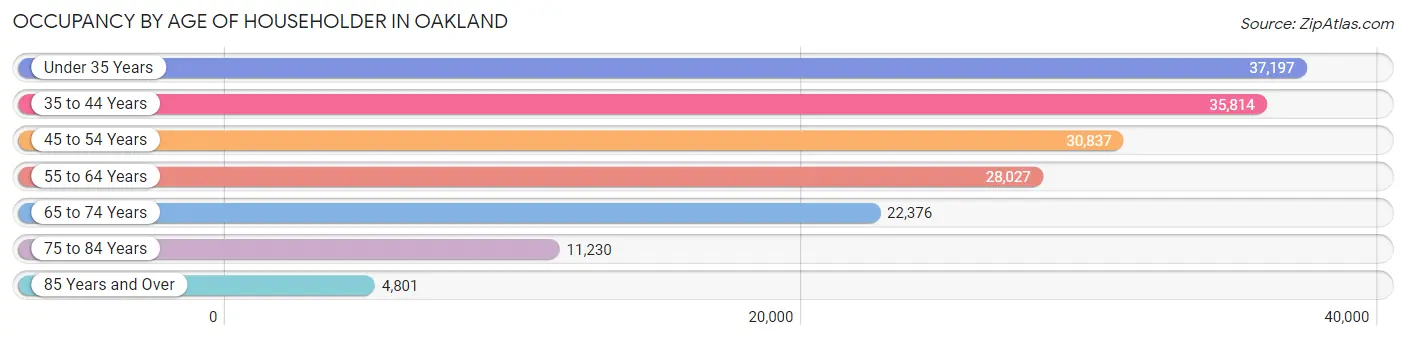
Occupancy by Age of Householder in Oakland
| Age Bracket | # Households | % Households |
| Under 35 Years | 37,197 | 21.8% |
| 35 to 44 Years | 35,814 | 21.0% |
| 45 to 54 Years | 30,837 | 18.1% |
| 55 to 64 Years | 28,027 | 16.5% |
| 65 to 74 Years | 22,376 | 13.1% |
| 75 to 84 Years | 11,230 | 6.6% |
| 85 Years and Over | 4,801 | 2.8% |
| Total | 170,282 | 100.0% |
Housing Finances in Oakland
Median Income by Occupancy in Oakland
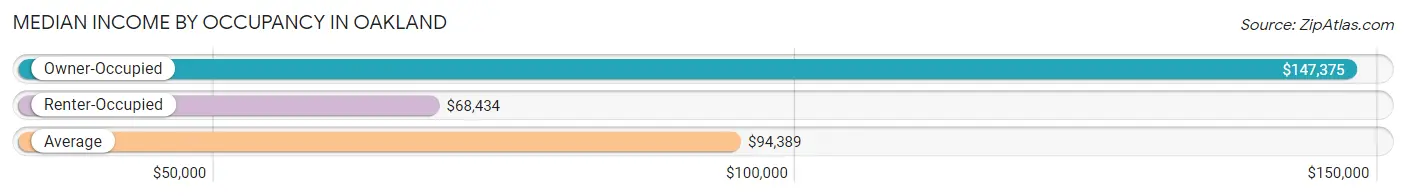
| Occupancy Type | # Households | Median Income |
| Owner-Occupied | 71,633 (42.1%) | $147,375 |
| Renter-Occupied | 98,649 (57.9%) | $68,434 |
| Average | 170,282 (100.0%) | $94,389 |
Occupancy by Householder Income Bracket in Oakland
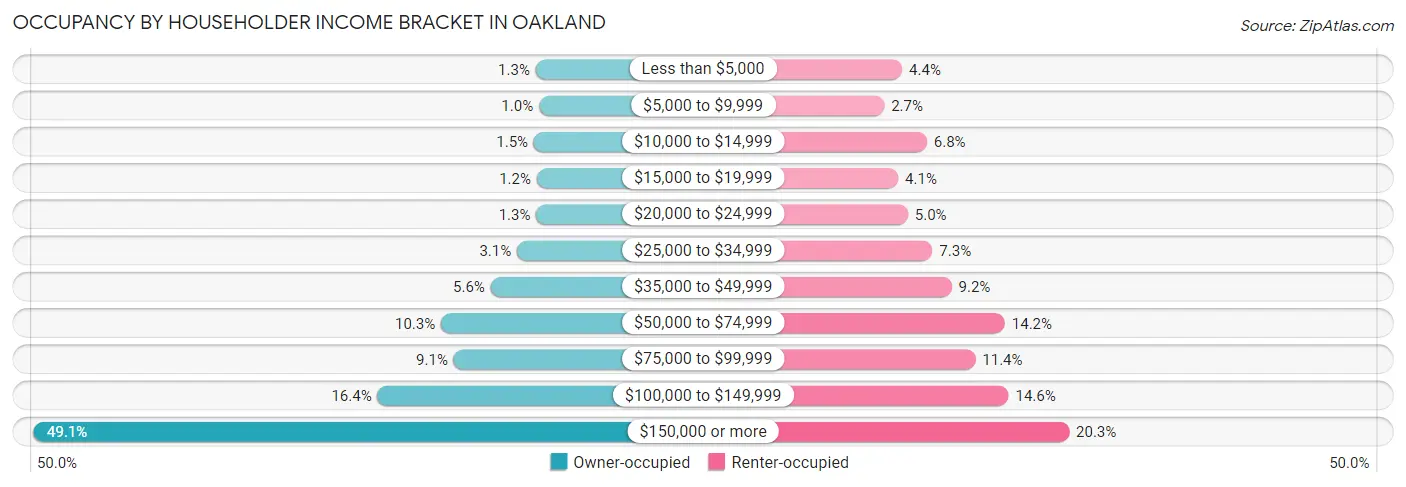
| Income Bracket | Owner-occupied | Renter-occupied |
| Less than $5,000 | 946 (1.3%) | 4,377 (4.4%) |
| $5,000 to $9,999 | 726 (1.0%) | 2,692 (2.7%) |
| $10,000 to $14,999 | 1,068 (1.5%) | 6,696 (6.8%) |
| $15,000 to $19,999 | 872 (1.2%) | 4,002 (4.1%) |
| $20,000 to $24,999 | 911 (1.3%) | 4,912 (5.0%) |
| $25,000 to $34,999 | 2,219 (3.1%) | 7,222 (7.3%) |
| $35,000 to $49,999 | 4,019 (5.6%) | 9,024 (9.1%) |
| $50,000 to $74,999 | 7,410 (10.3%) | 14,031 (14.2%) |
| $75,000 to $99,999 | 6,539 (9.1%) | 11,258 (11.4%) |
| $100,000 to $149,999 | 11,743 (16.4%) | 14,372 (14.6%) |
| $150,000 or more | 35,180 (49.1%) | 20,063 (20.3%) |
| Total | 71,633 (100.0%) | 98,649 (100.0%) |
Monthly Housing Cost Tiers in Oakland
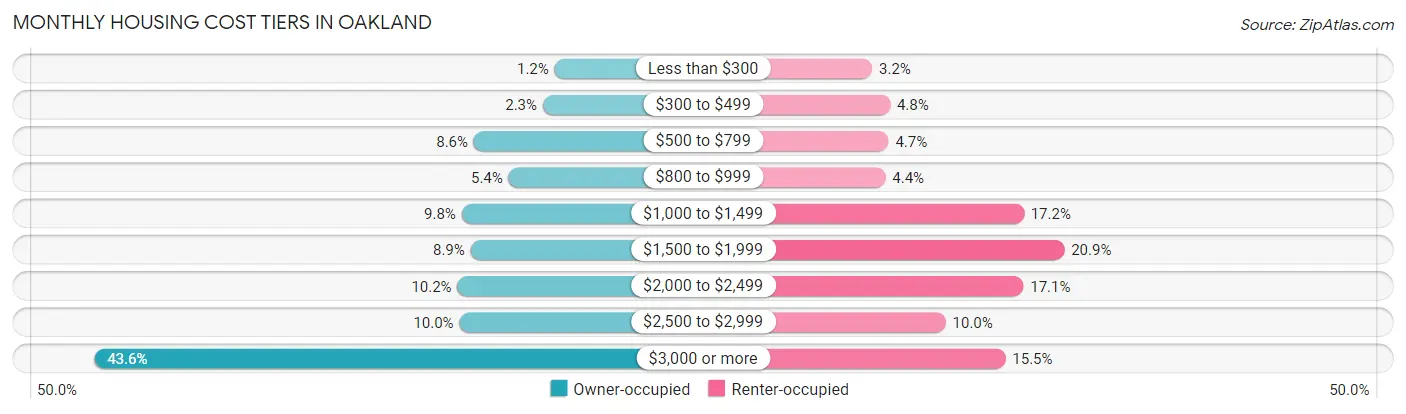
| Monthly Cost | Owner-occupied | Renter-occupied |
| Less than $300 | 864 (1.2%) | 3,151 (3.2%) |
| $300 to $499 | 1,638 (2.3%) | 4,770 (4.8%) |
| $500 to $799 | 6,191 (8.6%) | 4,640 (4.7%) |
| $800 to $999 | 3,900 (5.4%) | 4,354 (4.4%) |
| $1,000 to $1,499 | 6,993 (9.8%) | 16,919 (17.2%) |
| $1,500 to $1,999 | 6,404 (8.9%) | 20,594 (20.9%) |
| $2,000 to $2,499 | 7,274 (10.2%) | 16,877 (17.1%) |
| $2,500 to $2,999 | 7,145 (10.0%) | 9,824 (10.0%) |
| $3,000 or more | 31,224 (43.6%) | 15,254 (15.5%) |
| Total | 71,633 (100.0%) | 98,649 (100.0%) |
Physical Housing Characteristics in Oakland
Housing Structures in Oakland
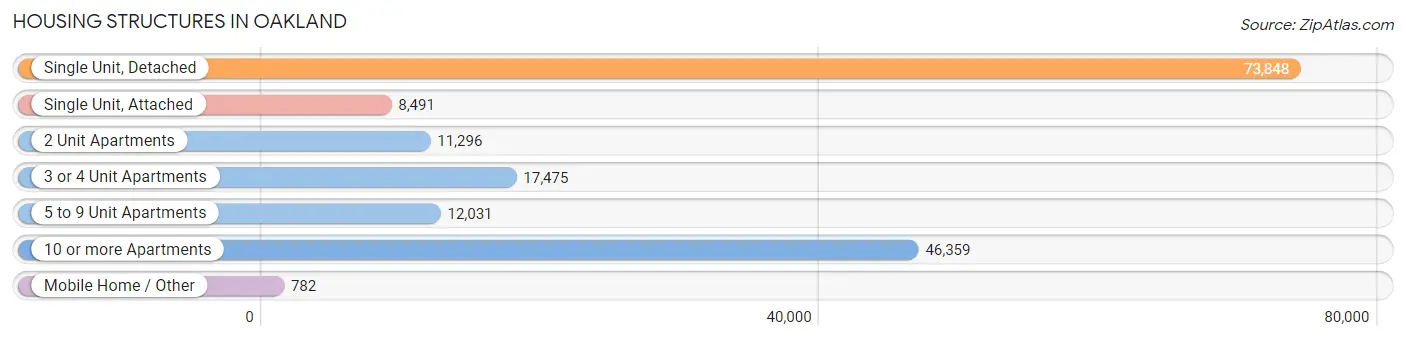
| Structure Type | # Housing Units | % Housing Units |
| Single Unit, Detached | 73,848 | 43.4% |
| Single Unit, Attached | 8,491 | 5.0% |
| 2 Unit Apartments | 11,296 | 6.6% |
| 3 or 4 Unit Apartments | 17,475 | 10.3% |
| 5 to 9 Unit Apartments | 12,031 | 7.1% |
| 10 or more Apartments | 46,359 | 27.2% |
| Mobile Home / Other | 782 | 0.5% |
| Total | 170,282 | 100.0% |
Housing Structures by Occupancy in Oakland
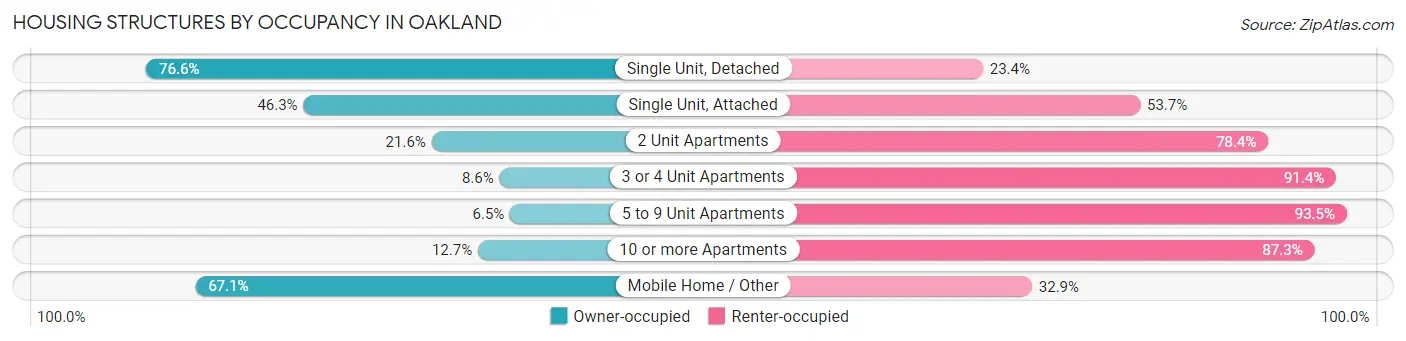
| Structure Type | Owner-occupied | Renter-occupied |
| Single Unit, Detached | 56,560 (76.6%) | 17,288 (23.4%) |
| Single Unit, Attached | 3,932 (46.3%) | 4,559 (53.7%) |
| 2 Unit Apartments | 2,443 (21.6%) | 8,853 (78.4%) |
| 3 or 4 Unit Apartments | 1,496 (8.6%) | 15,979 (91.4%) |
| 5 to 9 Unit Apartments | 783 (6.5%) | 11,248 (93.5%) |
| 10 or more Apartments | 5,894 (12.7%) | 40,465 (87.3%) |
| Mobile Home / Other | 525 (67.1%) | 257 (32.9%) |
| Total | 71,633 (42.1%) | 98,649 (57.9%) |
Housing Structures by Number of Rooms in Oakland
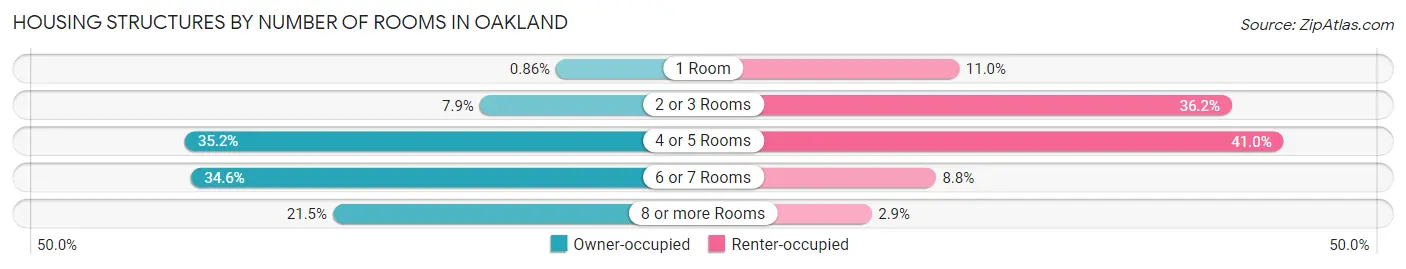
| Number of Rooms | Owner-occupied | Renter-occupied |
| 1 Room | 619 (0.9%) | 10,854 (11.0%) |
| 2 or 3 Rooms | 5,666 (7.9%) | 35,750 (36.2%) |
| 4 or 5 Rooms | 25,193 (35.2%) | 40,462 (41.0%) |
| 6 or 7 Rooms | 24,762 (34.6%) | 8,725 (8.8%) |
| 8 or more Rooms | 15,393 (21.5%) | 2,858 (2.9%) |
| Total | 71,633 (100.0%) | 98,649 (100.0%) |
Housing Structure by Heating Type in Oakland
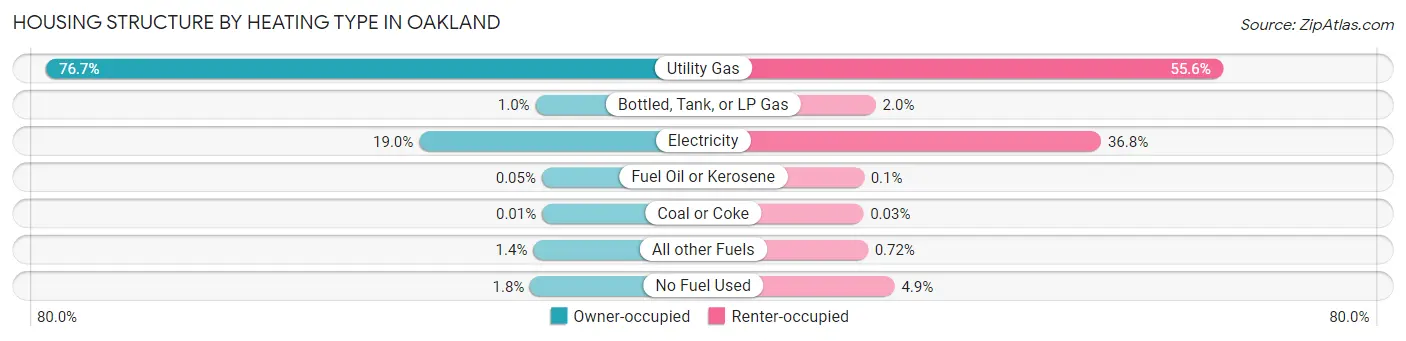
| Heating Type | Owner-occupied | Renter-occupied |
| Utility Gas | 54,927 (76.7%) | 54,822 (55.6%) |
| Bottled, Tank, or LP Gas | 741 (1.0%) | 1,920 (1.9%) |
| Electricity | 13,619 (19.0%) | 36,281 (36.8%) |
| Fuel Oil or Kerosene | 36 (0.1%) | 98 (0.1%) |
| Coal or Coke | 5 (0.0%) | 27 (0.0%) |
| All other Fuels | 984 (1.4%) | 711 (0.7%) |
| No Fuel Used | 1,321 (1.8%) | 4,790 (4.9%) |
| Total | 71,633 (100.0%) | 98,649 (100.0%) |
Household Vehicle Usage in Oakland
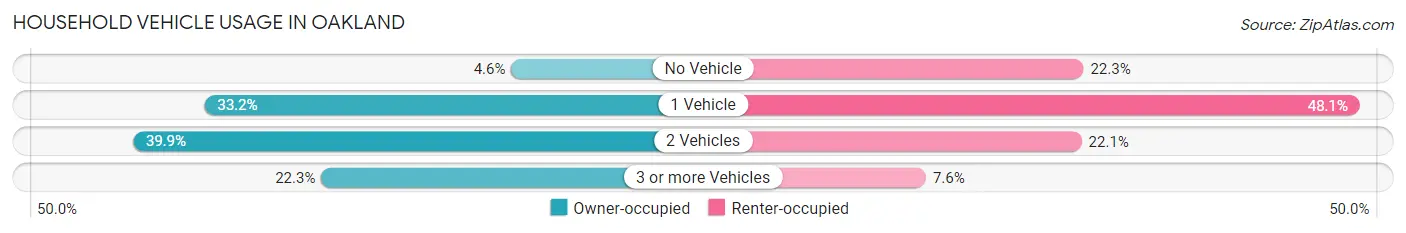
| Vehicles per Household | Owner-occupied | Renter-occupied |
| No Vehicle | 3,276 (4.6%) | 21,973 (22.3%) |
| 1 Vehicle | 23,794 (33.2%) | 47,406 (48.1%) |
| 2 Vehicles | 28,579 (39.9%) | 21,805 (22.1%) |
| 3 or more Vehicles | 15,984 (22.3%) | 7,465 (7.6%) |
| Total | 71,633 (100.0%) | 98,649 (100.0%) |
Real Estate & Mortgages in Oakland
Real Estate and Mortgage Overview in Oakland
| Characteristic | Without Mortgage | With Mortgage |
| Housing Units | 19,844 | 51,789 |
| Median Property Value | $837,500 | $901,300 |
| Median Household Income | $91,796 | $28,814 |
| Monthly Housing Costs | $898 | $30,714 |
| Real Estate Taxes | $4,966 | $604 |
Property Value by Mortgage Status in Oakland
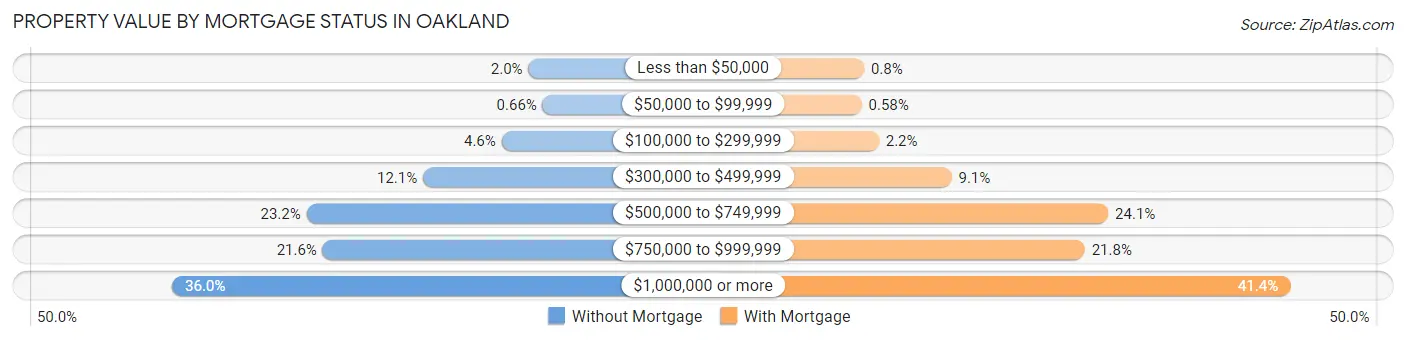
| Property Value | Without Mortgage | With Mortgage |
| Less than $50,000 | 400 (2.0%) | 413 (0.8%) |
| $50,000 to $99,999 | 130 (0.7%) | 298 (0.6%) |
| $100,000 to $299,999 | 906 (4.6%) | 1,145 (2.2%) |
| $300,000 to $499,999 | 2,392 (12.0%) | 4,735 (9.1%) |
| $500,000 to $749,999 | 4,593 (23.2%) | 12,459 (24.1%) |
| $750,000 to $999,999 | 4,289 (21.6%) | 11,307 (21.8%) |
| $1,000,000 or more | 7,134 (35.9%) | 21,432 (41.4%) |
| Total | 19,844 (100.0%) | 51,789 (100.0%) |
Household Income by Mortgage Status in Oakland
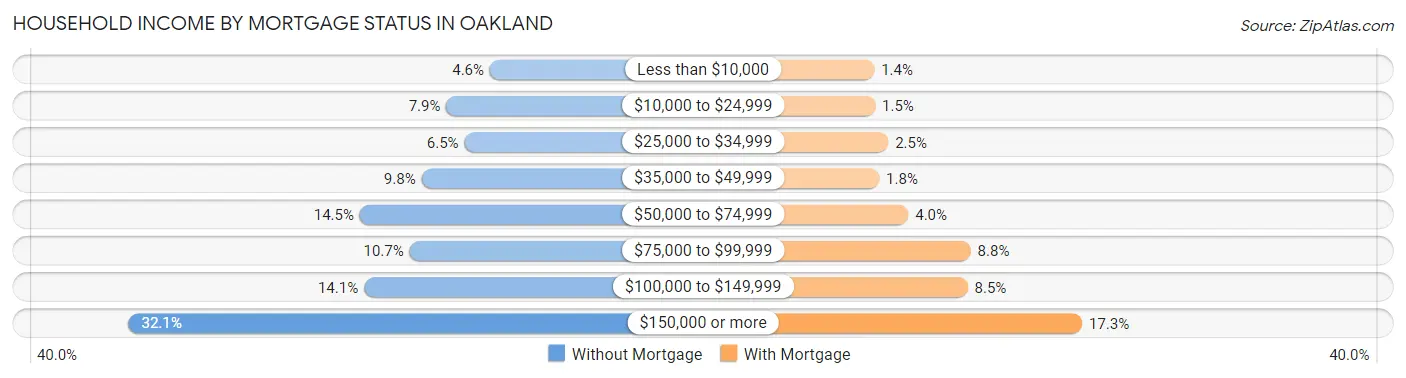
| Household Income | Without Mortgage | With Mortgage |
| Less than $10,000 | 902 (4.5%) | 735 (1.4%) |
| $10,000 to $24,999 | 1,562 (7.9%) | 770 (1.5%) |
| $25,000 to $34,999 | 1,287 (6.5%) | 1,289 (2.5%) |
| $35,000 to $49,999 | 1,936 (9.8%) | 932 (1.8%) |
| $50,000 to $74,999 | 2,869 (14.5%) | 2,083 (4.0%) |
| $75,000 to $99,999 | 2,117 (10.7%) | 4,541 (8.8%) |
| $100,000 to $149,999 | 2,805 (14.1%) | 4,422 (8.5%) |
| $150,000 or more | 6,366 (32.1%) | 8,938 (17.3%) |
| Total | 19,844 (100.0%) | 51,789 (100.0%) |
Property Value to Household Income Ratio in Oakland
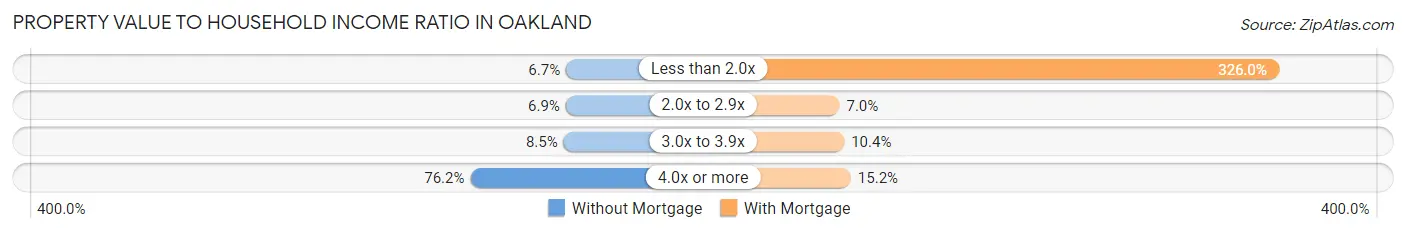
| Value-to-Income Ratio | Without Mortgage | With Mortgage |
| Less than 2.0x | 1,330 (6.7%) | 168,853 (326.0%) |
| 2.0x to 2.9x | 1,375 (6.9%) | 3,608 (7.0%) |
| 3.0x to 3.9x | 1,679 (8.5%) | 5,393 (10.4%) |
| 4.0x or more | 15,121 (76.2%) | 7,892 (15.2%) |
| Total | 19,844 (100.0%) | 51,789 (100.0%) |
Real Estate Taxes by Mortgage Status in Oakland
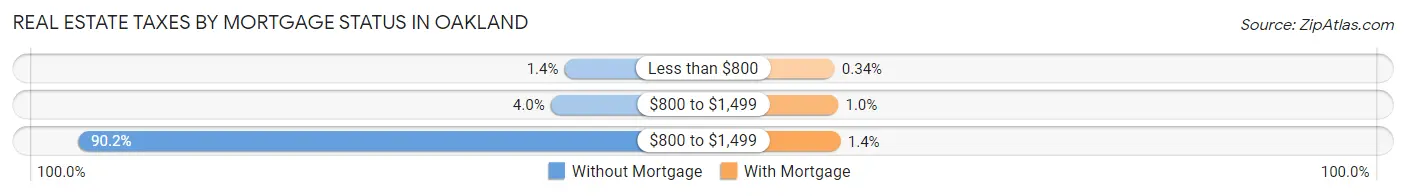
| Property Taxes | Without Mortgage | With Mortgage |
| Less than $800 | 281 (1.4%) | 178 (0.3%) |
| $800 to $1,499 | 783 (4.0%) | 518 (1.0%) |
| $800 to $1,499 | 17,901 (90.2%) | 737 (1.4%) |
| Total | 19,844 (100.0%) | 51,789 (100.0%) |
Health & Disability in Oakland
Health Insurance Coverage by Age in Oakland
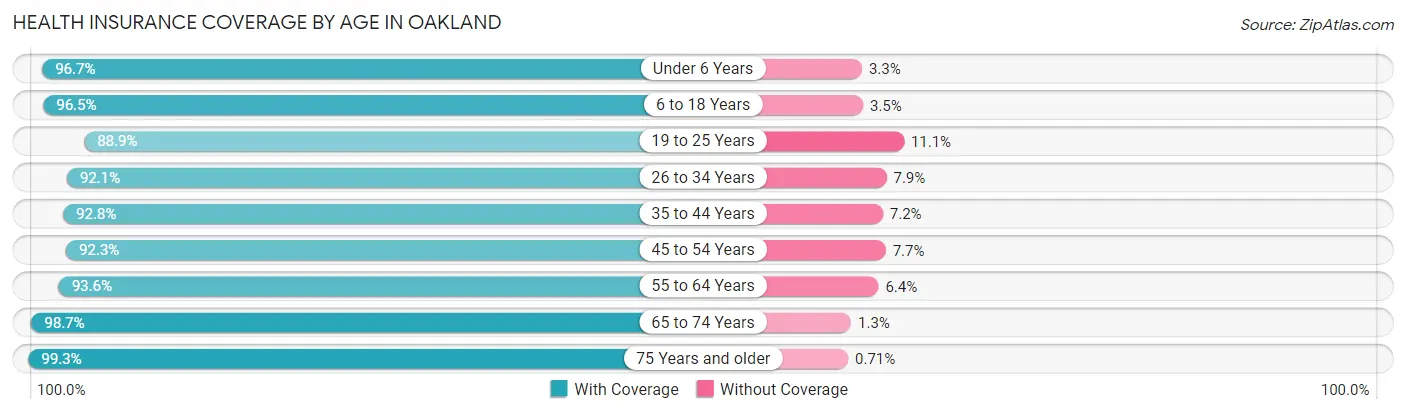
| Age Bracket | With Coverage | Without Coverage |
| Under 6 Years | 28,720 (96.7%) | 976 (3.3%) |
| 6 to 18 Years | 56,446 (96.5%) | 2,039 (3.5%) |
| 19 to 25 Years | 30,042 (88.9%) | 3,758 (11.1%) |
| 26 to 34 Years | 70,723 (92.1%) | 6,048 (7.9%) |
| 35 to 44 Years | 65,904 (92.8%) | 5,105 (7.2%) |
| 45 to 54 Years | 51,532 (92.3%) | 4,313 (7.7%) |
| 55 to 64 Years | 46,442 (93.6%) | 3,159 (6.4%) |
| 65 to 74 Years | 35,412 (98.7%) | 454 (1.3%) |
| 75 Years and older | 24,441 (99.3%) | 175 (0.7%) |
| Total | 409,662 (94.0%) | 26,027 (6.0%) |
Health Insurance Coverage by Citizenship Status in Oakland
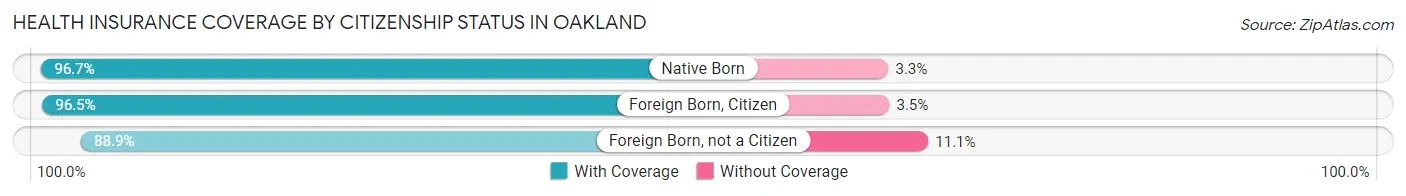
| Citizenship Status | With Coverage | Without Coverage |
| Native Born | 28,720 (96.7%) | 976 (3.3%) |
| Foreign Born, Citizen | 56,446 (96.5%) | 2,039 (3.5%) |
| Foreign Born, not a Citizen | 30,042 (88.9%) | 3,758 (11.1%) |
Health Insurance Coverage by Household Income in Oakland
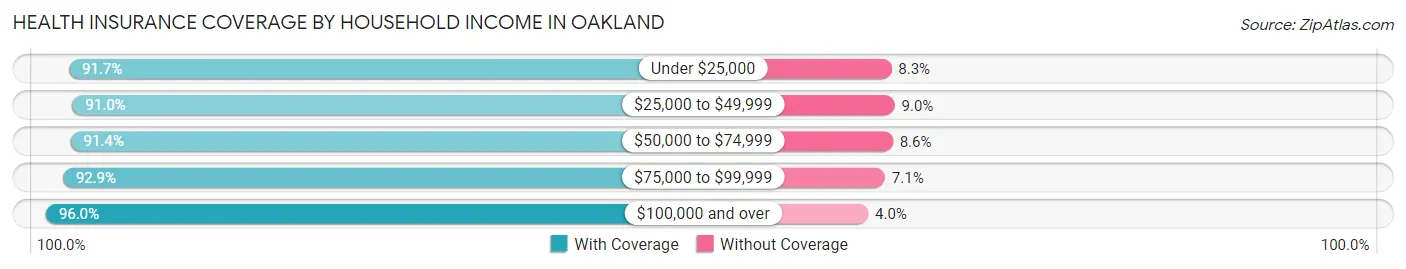
| Household Income | With Coverage | Without Coverage |
| Under $25,000 | 42,272 (91.7%) | 3,844 (8.3%) |
| $25,000 to $49,999 | 47,839 (91.0%) | 4,709 (9.0%) |
| $50,000 to $74,999 | 48,270 (91.4%) | 4,549 (8.6%) |
| $75,000 to $99,999 | 41,947 (92.9%) | 3,223 (7.1%) |
| $100,000 and over | 224,434 (96.0%) | 9,330 (4.0%) |
Public vs Private Health Insurance Coverage by Age in Oakland
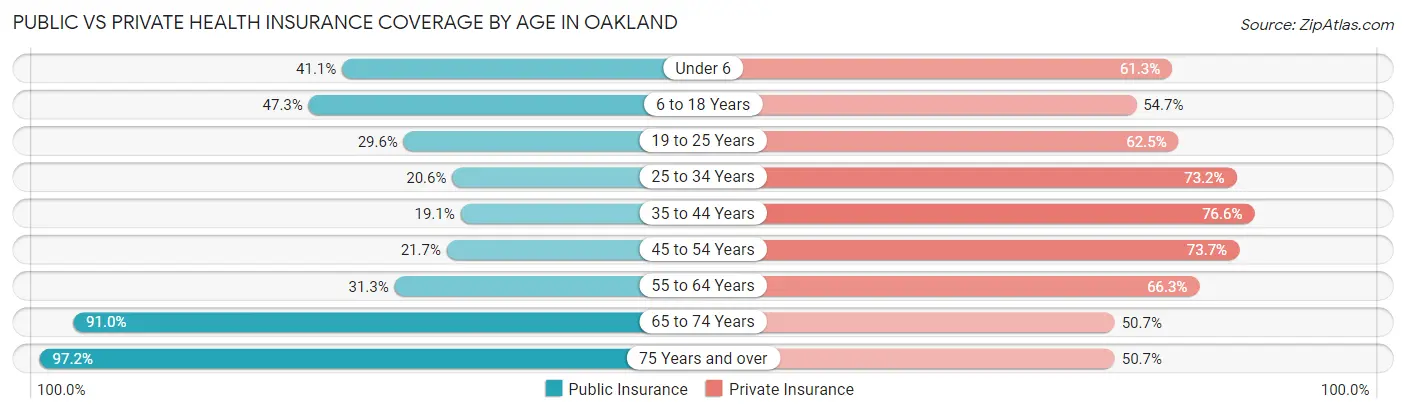
| Age Bracket | Public Insurance | Private Insurance |
| Under 6 | 12,195 (41.1%) | 18,197 (61.3%) |
| 6 to 18 Years | 27,652 (47.3%) | 31,963 (54.6%) |
| 19 to 25 Years | 10,014 (29.6%) | 21,121 (62.5%) |
| 25 to 34 Years | 15,834 (20.6%) | 56,223 (73.2%) |
| 35 to 44 Years | 13,548 (19.1%) | 54,355 (76.5%) |
| 45 to 54 Years | 12,091 (21.6%) | 41,156 (73.7%) |
| 55 to 64 Years | 15,539 (31.3%) | 32,898 (66.3%) |
| 65 to 74 Years | 32,631 (91.0%) | 18,169 (50.7%) |
| 75 Years and over | 23,926 (97.2%) | 12,474 (50.7%) |
| Total | 163,430 (37.5%) | 286,556 (65.8%) |
Disability Status by Sex by Age in Oakland
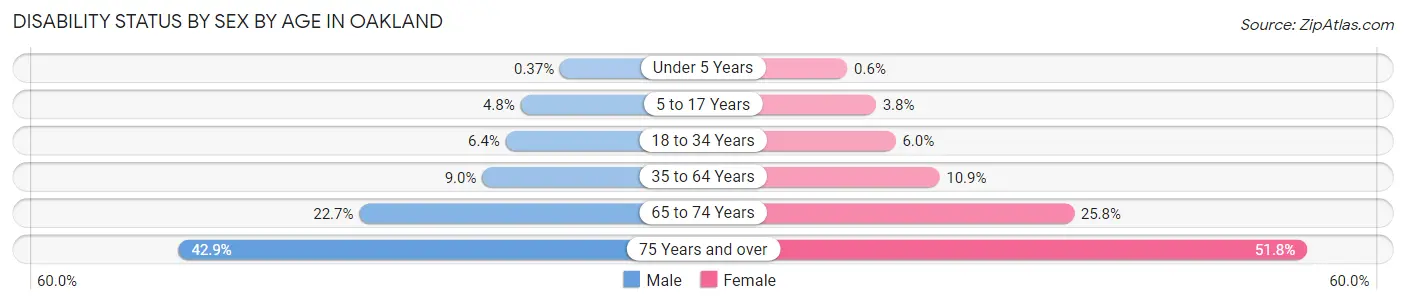
| Age Bracket | Male | Female |
| Under 5 Years | 43 (0.4%) | 79 (0.6%) |
| 5 to 17 Years | 1,469 (4.8%) | 1,060 (3.8%) |
| 18 to 34 Years | 3,602 (6.4%) | 3,529 (6.0%) |
| 35 to 64 Years | 8,062 (9.0%) | 9,461 (10.9%) |
| 65 to 74 Years | 3,694 (22.7%) | 5,068 (25.8%) |
| 75 Years and over | 4,208 (42.9%) | 7,668 (51.8%) |
Disability Class by Sex by Age in Oakland
Disability Class: Hearing Difficulty
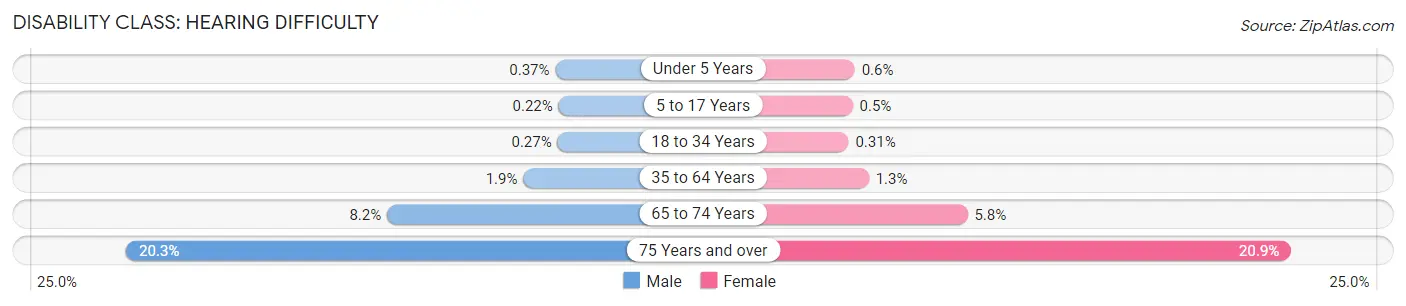
| Age Bracket | Male | Female |
| Under 5 Years | 43 (0.4%) | 79 (0.6%) |
| 5 to 17 Years | 68 (0.2%) | 139 (0.5%) |
| 18 to 34 Years | 152 (0.3%) | 183 (0.3%) |
| 35 to 64 Years | 1,662 (1.9%) | 1,085 (1.3%) |
| 65 to 74 Years | 1,329 (8.2%) | 1,143 (5.8%) |
| 75 Years and over | 1,992 (20.3%) | 3,085 (20.8%) |
Disability Class: Vision Difficulty
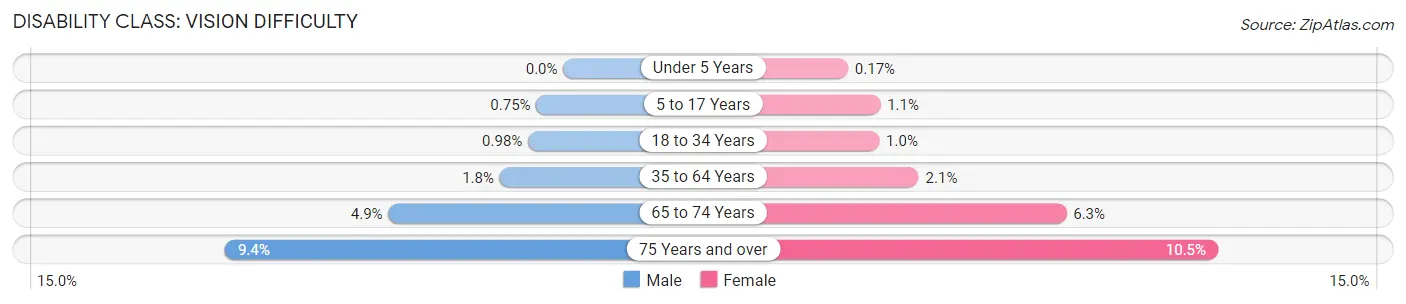
| Age Bracket | Male | Female |
| Under 5 Years | 0 (0.0%) | 22 (0.2%) |
| 5 to 17 Years | 231 (0.7%) | 299 (1.1%) |
| 18 to 34 Years | 552 (1.0%) | 613 (1.0%) |
| 35 to 64 Years | 1,577 (1.8%) | 1,862 (2.1%) |
| 65 to 74 Years | 791 (4.9%) | 1,226 (6.2%) |
| 75 Years and over | 925 (9.4%) | 1,549 (10.5%) |
Disability Class: Cognitive Difficulty
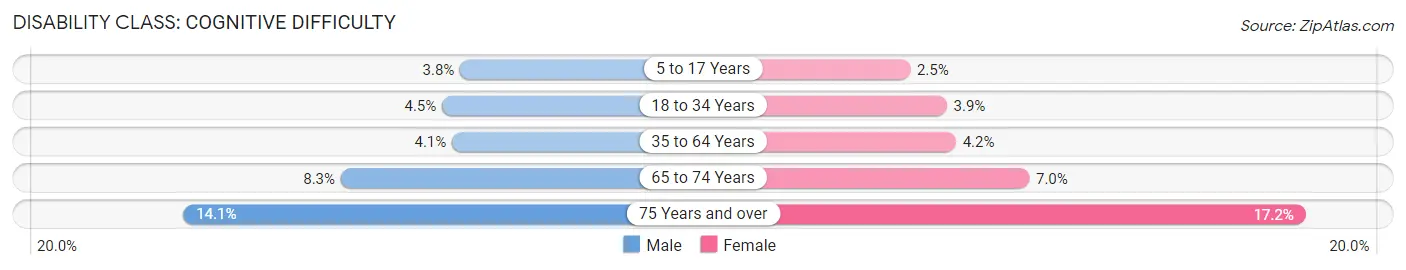
| Age Bracket | Male | Female |
| 5 to 17 Years | 1,180 (3.8%) | 711 (2.5%) |
| 18 to 34 Years | 2,523 (4.5%) | 2,295 (3.9%) |
| 35 to 64 Years | 3,693 (4.1%) | 3,689 (4.2%) |
| 65 to 74 Years | 1,343 (8.3%) | 1,364 (7.0%) |
| 75 Years and over | 1,385 (14.1%) | 2,548 (17.2%) |
Disability Class: Ambulatory Difficulty
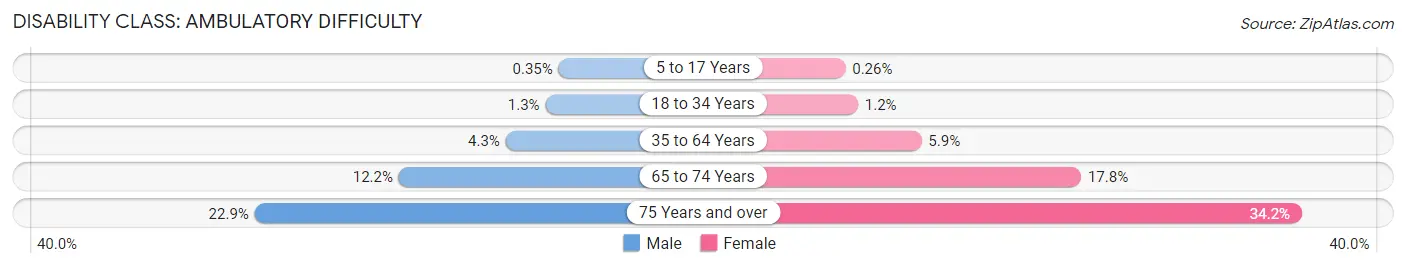
| Age Bracket | Male | Female |
| 5 to 17 Years | 107 (0.4%) | 74 (0.3%) |
| 18 to 34 Years | 744 (1.3%) | 704 (1.2%) |
| 35 to 64 Years | 3,825 (4.3%) | 5,153 (5.9%) |
| 65 to 74 Years | 1,987 (12.2%) | 3,483 (17.8%) |
| 75 Years and over | 2,250 (22.9%) | 5,055 (34.2%) |
Disability Class: Self-Care Difficulty
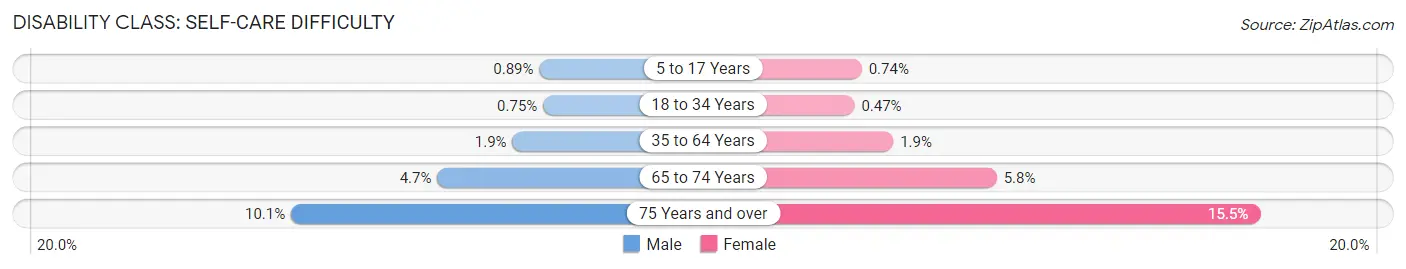
| Age Bracket | Male | Female |
| 5 to 17 Years | 273 (0.9%) | 208 (0.7%) |
| 18 to 34 Years | 418 (0.7%) | 279 (0.5%) |
| 35 to 64 Years | 1,688 (1.9%) | 1,661 (1.9%) |
| 65 to 74 Years | 760 (4.7%) | 1,127 (5.8%) |
| 75 Years and over | 993 (10.1%) | 2,298 (15.5%) |
Technology Access in Oakland
Computing Device Access in Oakland
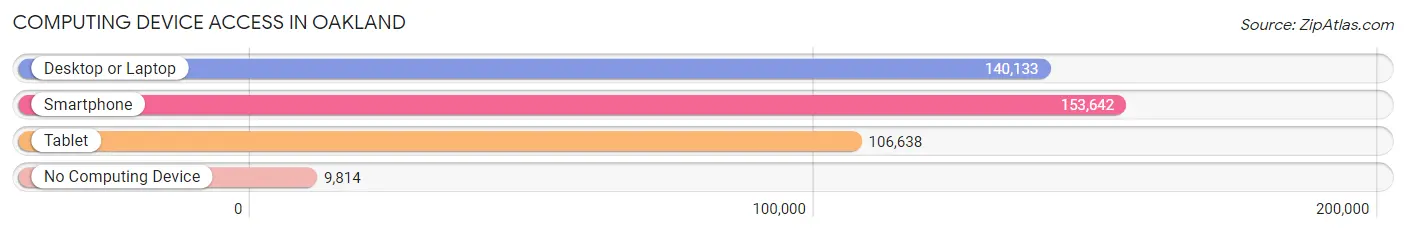
| Device Type | # Households | % Households |
| Desktop or Laptop | 140,133 | 82.3% |
| Smartphone | 153,642 | 90.2% |
| Tablet | 106,638 | 62.6% |
| No Computing Device | 9,814 | 5.8% |
| Total | 170,282 | 100.0% |
Internet Access in Oakland
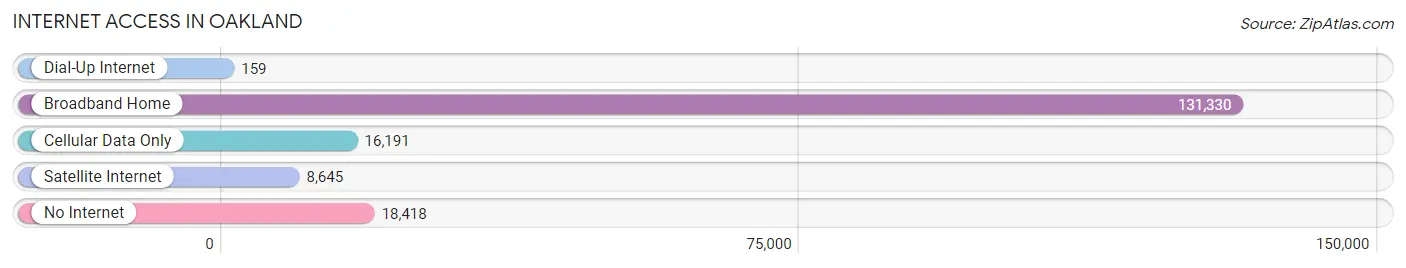
| Internet Type | # Households | % Households |
| Dial-Up Internet | 159 | 0.1% |
| Broadband Home | 131,330 | 77.1% |
| Cellular Data Only | 16,191 | 9.5% |
| Satellite Internet | 8,645 | 5.1% |
| No Internet | 18,418 | 10.8% |
| Total | 170,282 | 100.0% |
Oakland Summary
Oakland, California is a major city located in the San Francisco Bay Area. It is the largest city in Alameda County and the eighth-largest city in the state of California. Oakland is a vibrant and diverse city with a rich history, unique geography, and a thriving economy.
History
The history of Oakland dates back to the mid-1800s when it was founded by Horace Carpentier and Andrew Moon. The city was originally called “Encinal”, which means “oak grove” in Spanish. The city was incorporated in 1852 and was named after the many oak trees that grew in the area.
In the late 1800s, Oakland became a major port city and a hub for the railroad industry. The city was also a major center for shipbuilding during World War II. After the war, Oakland experienced a period of rapid growth and development. The city was home to a large number of African American residents who moved to the area during the Great Migration.
In the 1960s, Oakland became a major center for the civil rights movement. The city was home to the Black Panther Party and other organizations that fought for civil rights and social justice. In the 1970s, Oakland experienced a period of economic decline due to the closure of many of its major industries.
Geography
Oakland is located in the San Francisco Bay Area, on the east side of the San Francisco Bay. The city is bordered by Berkeley to the north, Emeryville to the south, and San Leandro to the east. Oakland is situated on a flat plain, with the Oakland Hills rising to the east. The city has a total area of 78.8 square miles, with a population of over 420,000 people.
Oakland has a Mediterranean climate, with mild, wet winters and dry, warm summers. The city is known for its foggy summers and mild winters.
Economy
Oakland is a major economic center in the Bay Area. The city is home to a number of major corporations, including Clorox, Kaiser Permanente, and Pandora Media. Oakland is also a major center for the technology industry, with many tech companies located in the city.
Oakland is a major port city, with the Port of Oakland serving as a major hub for international trade. The city is also home to a number of major universities, including the University of California, Berkeley, Mills College, and California College of the Arts.
Demographics
Oakland is a diverse city, with a population of over 420,000 people. The city is home to a large number of African American residents, as well as a significant Hispanic population. The city also has a large Asian population, with over 20% of the population identifying as Asian.
Oakland is a major center for the arts, with a number of museums, galleries, and theaters located in the city. The city is also home to a number of professional sports teams, including the Oakland Athletics, Oakland Raiders, and Golden State Warriors.
Oakland is a vibrant and diverse city with a rich history, unique geography, and a thriving economy. The city is home to a number of major corporations, universities, and cultural institutions, making it a major center for business, education, and the arts.
Common Questions
What is Per Capita Income in Oakland?
Per Capita income in Oakland is $56,628.
What is the Median Family Income in Oakland?
Median Family Income in Oakland is $109,997.
What is the Median Household income in Oakland?
Median Household Income in Oakland is $94,389.
What is Income or Wage Gap in Oakland?
Income or Wage Gap in Oakland is 9.7%.
Women in Oakland earn 90.3 cents for every dollar earned by a man.
What is Family Income Deficit in Oakland?
Family Income Deficit in Oakland is $10,733.
Families that are below poverty line in Oakland earn $10,733 less on average than the poverty threshold level.
What is Inequality or Gini Index in Oakland?
Inequality or Gini Index in Oakland is 0.51.
What is the Total Population of Oakland?
Total Population of Oakland is 437,825.
What is the Total Male Population of Oakland?
Total Male Population of Oakland is 215,257.
What is the Total Female Population of Oakland?
Total Female Population of Oakland is 222,568.
What is the Ratio of Males per 100 Females in Oakland?
There are 96.72 Males per 100 Females in Oakland.
What is the Ratio of Females per 100 Males in Oakland?
There are 103.40 Females per 100 Males in Oakland.
What is the Median Population Age in Oakland?
Median Population Age in Oakland is 37.5 Years.
What is the Average Family Size in Oakland
Average Family Size in Oakland is 3.3 People.
What is the Average Household Size in Oakland
Average Household Size in Oakland is 2.5 People.
How Large is the Labor Force in Oakland?
There are 248,211 People in the Labor Forcein in Oakland.
What is the Percentage of People in the Labor Force in Oakland?
68.4% of People are in the Labor Force in Oakland.
What is the Unemployment Rate in Oakland?
Unemployment Rate in Oakland is 5.8%.