Cities with the Highest Percentage of Households Without a Vehicle in South Carolina
RELATED REPORTS & OPTIONS
Households without a Cars
South Carolina
Compare Cities
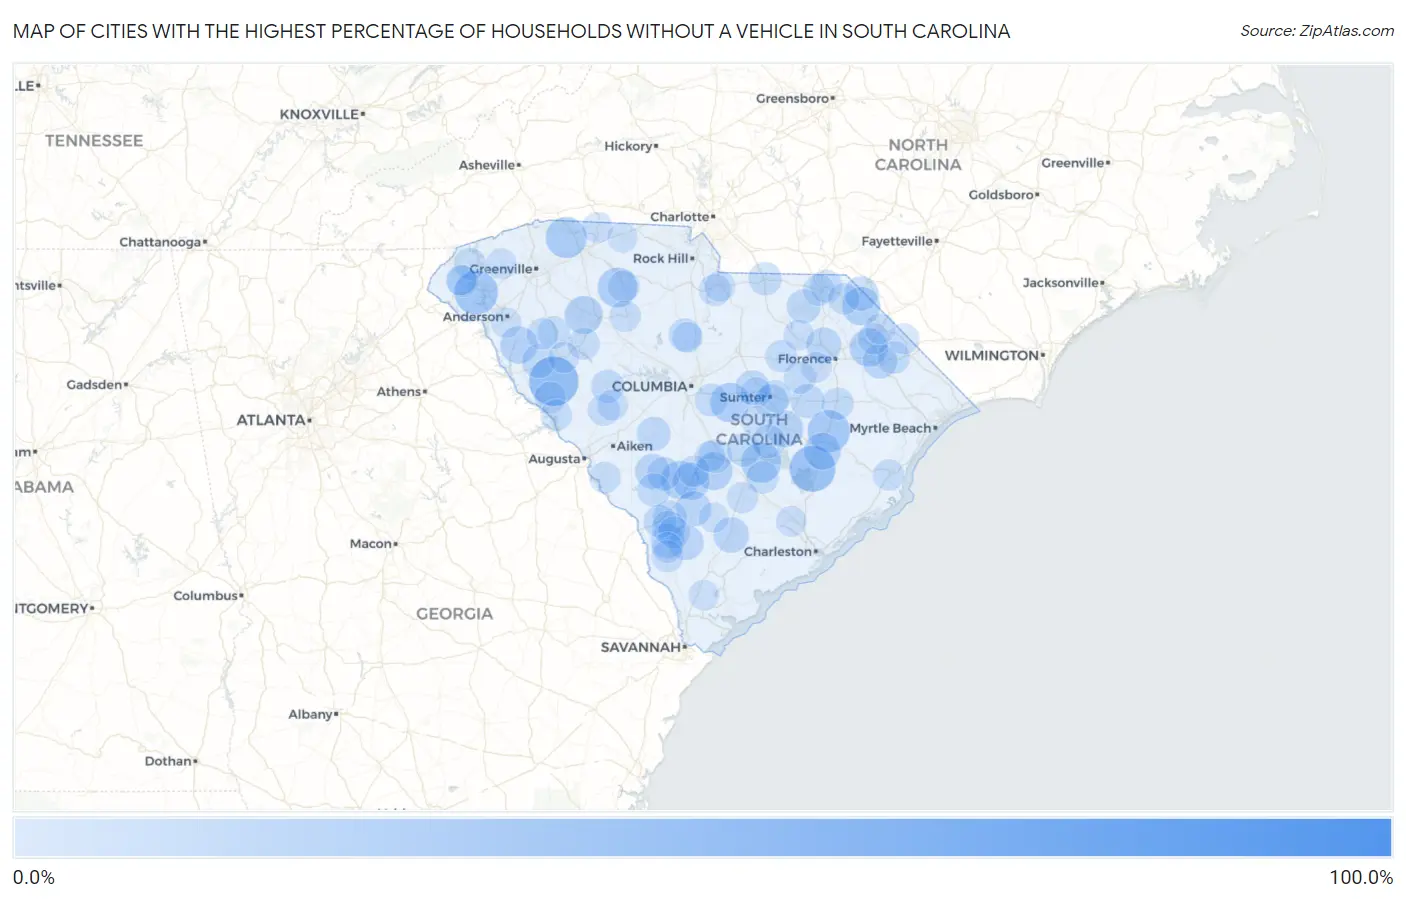
Map of Cities with the Highest Percentage of Households Without a Vehicle in South Carolina
0.0%
100.0%
Cities with the Highest Percentage of Households Without a Vehicle in South Carolina
| City | Housholds Without a Car | vs State | vs National | |
| 1. | Live Oak | 100.0% | 5.7%(+94.3)#1 | 8.3%(+91.7)#58 |
| 2. | Ketchuptown | 100.0% | 5.7%(+94.3)#2 | 8.3%(+91.7)#66 |
| 3. | Bradley | 50.0% | 5.7%(+44.3)#3 | 8.3%(+41.7)#233 |
| 4. | Russellville | 43.2% | 5.7%(+37.5)#4 | 8.3%(+34.9)#301 |
| 5. | Utica | 39.0% | 5.7%(+33.3)#5 | 8.3%(+30.7)#356 |
| 6. | Kingstree | 36.3% | 5.7%(+30.6)#6 | 8.3%(+28.0)#401 |
| 7. | Gramling | 34.0% | 5.7%(+28.3)#7 | 8.3%(+25.7)#461 |
| 8. | Vance | 32.4% | 5.7%(+26.7)#8 | 8.3%(+24.1)#514 |
| 9. | Buffalo | 31.2% | 5.7%(+25.5)#9 | 8.3%(+22.9)#539 |
| 10. | Eastover | 30.9% | 5.7%(+25.2)#10 | 8.3%(+22.6)#548 |
| 11. | Adams Run | 29.7% | 5.7%(+24.0)#11 | 8.3%(+21.4)#605 |
| 12. | Clio | 28.8% | 5.7%(+23.1)#12 | 8.3%(+20.5)#644 |
| 13. | Sellers | 28.8% | 5.7%(+23.1)#13 | 8.3%(+20.5)#646 |
| 14. | Denmark | 28.4% | 5.7%(+22.7)#14 | 8.3%(+20.1)#660 |
| 15. | Watts Mills | 28.2% | 5.7%(+22.5)#15 | 8.3%(+19.9)#673 |
| 16. | Rowesville | 27.2% | 5.7%(+21.5)#16 | 8.3%(+18.9)#716 |
| 17. | Antreville | 27.1% | 5.7%(+21.4)#17 | 8.3%(+18.8)#721 |
| 18. | Bamberg | 26.4% | 5.7%(+20.7)#18 | 8.3%(+18.1)#759 |
| 19. | Manning | 26.0% | 5.7%(+20.3)#19 | 8.3%(+17.7)#789 |
| 20. | Lane | 25.9% | 5.7%(+20.2)#20 | 8.3%(+17.6)#794 |
| 21. | Daviston | 25.8% | 5.7%(+20.1)#21 | 8.3%(+17.5)#801 |
| 22. | Newtown | 25.6% | 5.7%(+19.9)#22 | 8.3%(+17.3)#813 |
| 23. | Walterboro | 23.5% | 5.7%(+17.8)#23 | 8.3%(+15.2)#964 |
| 24. | Elliott | 23.5% | 5.7%(+17.8)#24 | 8.3%(+15.2)#969 |
| 25. | Ehrhardt | 23.0% | 5.7%(+17.3)#25 | 8.3%(+14.7)#1,015 |
| 26. | Darlington | 22.4% | 5.7%(+16.7)#26 | 8.3%(+14.1)#1,056 |
| 27. | Elko | 22.4% | 5.7%(+16.7)#27 | 8.3%(+14.1)#1,071 |
| 28. | Varnville | 22.3% | 5.7%(+16.6)#28 | 8.3%(+14.0)#1,085 |
| 29. | Drayton | 21.9% | 5.7%(+16.2)#29 | 8.3%(+13.6)#1,135 |
| 30. | Marion | 21.8% | 5.7%(+16.1)#30 | 8.3%(+13.5)#1,146 |
| 31. | Mccoll | 21.4% | 5.7%(+15.7)#31 | 8.3%(+13.1)#1,193 |
| 32. | Gifford | 21.3% | 5.7%(+15.6)#32 | 8.3%(+13.0)#1,221 |
| 33. | Oakland | 21.1% | 5.7%(+15.4)#33 | 8.3%(+12.8)#1,242 |
| 34. | Sycamore | 20.8% | 5.7%(+15.1)#34 | 8.3%(+12.5)#1,292 |
| 35. | Turbeville | 20.7% | 5.7%(+15.0)#35 | 8.3%(+12.4)#1,307 |
| 36. | Patrick | 20.7% | 5.7%(+15.0)#36 | 8.3%(+12.4)#1,309 |
| 37. | Wagener | 20.3% | 5.7%(+14.6)#37 | 8.3%(+12.0)#1,361 |
| 38. | Centenary | 20.3% | 5.7%(+14.6)#38 | 8.3%(+12.0)#1,363 |
| 39. | South Sumter | 20.0% | 5.7%(+14.3)#39 | 8.3%(+11.7)#1,399 |
| 40. | Blackville | 19.9% | 5.7%(+14.2)#40 | 8.3%(+11.6)#1,425 |
| 41. | Abbeville | 19.8% | 5.7%(+14.1)#41 | 8.3%(+11.5)#1,441 |
| 42. | Wilkinson Heights | 19.8% | 5.7%(+14.1)#42 | 8.3%(+11.5)#1,443 |
| 43. | Barnwell | 19.6% | 5.7%(+13.9)#43 | 8.3%(+11.3)#1,473 |
| 44. | Elloree | 19.6% | 5.7%(+13.9)#44 | 8.3%(+11.3)#1,484 |
| 45. | Sandy Springs | 19.6% | 5.7%(+13.9)#45 | 8.3%(+11.3)#1,485 |
| 46. | Summerton | 19.5% | 5.7%(+13.8)#46 | 8.3%(+11.2)#1,504 |
| 47. | Fairfax | 19.3% | 5.7%(+13.6)#47 | 8.3%(+11.0)#1,535 |
| 48. | Little Rock | 19.3% | 5.7%(+13.6)#48 | 8.3%(+11.0)#1,543 |
| 49. | Pageland | 19.2% | 5.7%(+13.5)#49 | 8.3%(+10.9)#1,550 |
| 50. | Winnsboro | 19.0% | 5.7%(+13.3)#50 | 8.3%(+10.7)#1,574 |
| 51. | Allendale | 18.9% | 5.7%(+13.2)#51 | 8.3%(+10.6)#1,593 |
| 52. | Saluda | 18.8% | 5.7%(+13.1)#52 | 8.3%(+10.5)#1,616 |
| 53. | Hopkins | 18.5% | 5.7%(+12.8)#53 | 8.3%(+10.2)#1,677 |
| 54. | Wallace | 18.2% | 5.7%(+12.5)#54 | 8.3%(+9.90)#1,734 |
| 55. | Mullins | 18.0% | 5.7%(+12.3)#55 | 8.3%(+9.70)#1,771 |
| 56. | Lynchburg | 17.9% | 5.7%(+12.2)#56 | 8.3%(+9.60)#1,807 |
| 57. | Ware Shoals | 17.6% | 5.7%(+11.9)#57 | 8.3%(+9.30)#1,872 |
| 58. | Lake City | 17.5% | 5.7%(+11.8)#58 | 8.3%(+9.20)#1,892 |
| 59. | Holly Hill | 17.4% | 5.7%(+11.7)#59 | 8.3%(+9.10)#1,933 |
| 60. | East Sumter | 17.3% | 5.7%(+11.6)#60 | 8.3%(+9.00)#1,959 |
| 61. | Bishopville | 17.2% | 5.7%(+11.5)#61 | 8.3%(+8.90)#1,973 |
| 62. | Irwin | 17.0% | 5.7%(+11.3)#62 | 8.3%(+8.70)#2,022 |
| 63. | Salem | 17.0% | 5.7%(+11.3)#63 | 8.3%(+8.70)#2,036 |
| 64. | Johnston | 16.9% | 5.7%(+11.2)#64 | 8.3%(+8.60)#2,046 |
| 65. | Brunson | 16.9% | 5.7%(+11.2)#65 | 8.3%(+8.60)#2,060 |
| 66. | Cross Hill | 16.7% | 5.7%(+11.0)#66 | 8.3%(+8.40)#2,108 |
| 67. | Estill | 16.5% | 5.7%(+10.8)#67 | 8.3%(+8.20)#2,165 |
| 68. | Cheraw | 16.4% | 5.7%(+10.7)#68 | 8.3%(+8.10)#2,192 |
| 69. | Union | 16.3% | 5.7%(+10.6)#69 | 8.3%(+8.00)#2,221 |
| 70. | Mccormick | 16.2% | 5.7%(+10.5)#70 | 8.3%(+7.90)#2,257 |
| 71. | Bennettsville | 15.9% | 5.7%(+10.2)#71 | 8.3%(+7.60)#2,339 |
| 72. | Jackson | 15.9% | 5.7%(+10.2)#72 | 8.3%(+7.60)#2,348 |
| 73. | West Union | 15.8% | 5.7%(+10.1)#73 | 8.3%(+7.50)#2,406 |
| 74. | Donalds | 15.8% | 5.7%(+10.1)#74 | 8.3%(+7.50)#2,407 |
| 75. | Parksville | 15.8% | 5.7%(+10.1)#75 | 8.3%(+7.50)#2,412 |
| 76. | Cope | 15.8% | 5.7%(+10.1)#76 | 8.3%(+7.50)#2,417 |
| 77. | St George | 15.7% | 5.7%(+10.00)#77 | 8.3%(+7.40)#2,433 |
| 78. | Latta | 15.7% | 5.7%(+10.00)#78 | 8.3%(+7.40)#2,435 |
| 79. | Whitmire | 15.7% | 5.7%(+10.00)#79 | 8.3%(+7.40)#2,436 |
| 80. | Georgetown | 15.6% | 5.7%(+9.90)#80 | 8.3%(+7.30)#2,458 |
| 81. | Ward | 15.0% | 5.7%(+9.30)#81 | 8.3%(+6.70)#2,703 |
| 82. | Greenwood | 14.9% | 5.7%(+9.20)#82 | 8.3%(+6.60)#2,709 |
| 83. | Lake View | 14.9% | 5.7%(+9.20)#83 | 8.3%(+6.60)#2,734 |
| 84. | Chesnee | 14.9% | 5.7%(+9.20)#84 | 8.3%(+6.60)#2,737 |
| 85. | Timmonsville | 14.8% | 5.7%(+9.10)#85 | 8.3%(+6.50)#2,759 |
| 86. | Pickens | 14.7% | 5.7%(+9.00)#86 | 8.3%(+6.40)#2,794 |
| 87. | Cherryvale | 14.7% | 5.7%(+9.00)#87 | 8.3%(+6.40)#2,796 |
| 88. | Orangeburg | 14.5% | 5.7%(+8.80)#88 | 8.3%(+6.20)#2,867 |
| 89. | Luray | 14.5% | 5.7%(+8.80)#89 | 8.3%(+6.20)#2,906 |
| 90. | Lancaster | 14.4% | 5.7%(+8.70)#90 | 8.3%(+6.10)#2,920 |
| 91. | Hartsville | 14.4% | 5.7%(+8.70)#91 | 8.3%(+6.10)#2,921 |
| 92. | Dillon | 14.4% | 5.7%(+8.70)#92 | 8.3%(+6.10)#2,923 |
| 93. | Winnsboro Mills | 14.4% | 5.7%(+8.70)#93 | 8.3%(+6.10)#2,934 |
| 94. | Lincolnville | 14.4% | 5.7%(+8.70)#94 | 8.3%(+6.10)#2,948 |
| 95. | Homeland Park | 14.0% | 5.7%(+8.30)#95 | 8.3%(+5.70)#3,099 |
| 96. | Walhalla | 13.9% | 5.7%(+8.20)#96 | 8.3%(+5.60)#3,146 |
| 97. | Ridgeland | 13.8% | 5.7%(+8.10)#97 | 8.3%(+5.50)#3,187 |
| 98. | Gaffney | 13.7% | 5.7%(+8.00)#98 | 8.3%(+5.40)#3,227 |
| 99. | Pinewood | 13.7% | 5.7%(+8.00)#99 | 8.3%(+5.40)#3,253 |
| 100. | Williams | 13.4% | 5.7%(+7.70)#100 | 8.3%(+5.10)#3,393 |
Common Questions
What are the Top 10 Cities with the Highest Percentage of Households Without a Vehicle in South Carolina?
Top 10 Cities with the Highest Percentage of Households Without a Vehicle in South Carolina are:
What city has the Highest Percentage of Households Without a Vehicle in South Carolina?
Bradley has the Highest Percentage of Households Without a Vehicle in South Carolina with 50.0%.
What is the Percentage of Households Without a Vehicle in the State of South Carolina?
Percentage of Households Without a Vehicle in South Carolina is 5.7%.
What is the Percentage of Households Without a Vehicle in the United States?
Percentage of Households Without a Vehicle in the United States is 8.3%.