Cities with the Highest Percentage of Households Without a Vehicle in Utah
RELATED REPORTS & OPTIONS
Households without a Cars
Utah
Compare Cities
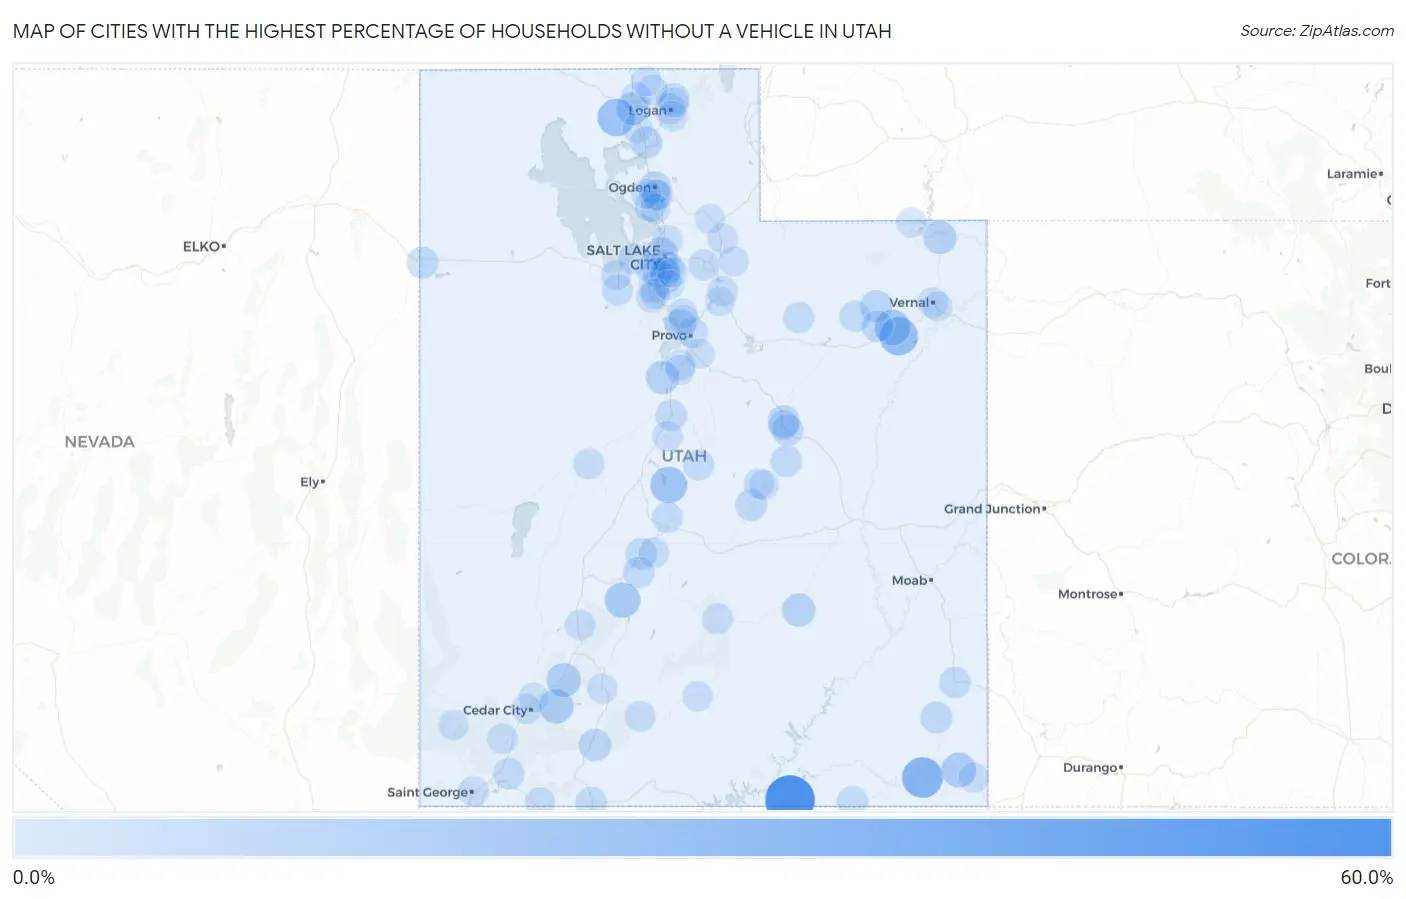
Map of Cities with the Highest Percentage of Households Without a Vehicle in Utah
0.0%
60.0%
Cities with the Highest Percentage of Households Without a Vehicle in Utah
| City | Housholds Without a Car | vs State | vs National | |
| 1. | Navajo Mountain | 53.8% | 3.9%(+49.9)#1 | 8.3%(+45.5)#218 |
| 2. | Tselakai Dezza | 30.0% | 3.9%(+26.1)#2 | 8.3%(+21.7)#584 |
| 3. | Randlett | 23.5% | 3.9%(+19.6)#3 | 8.3%(+15.2)#976 |
| 4. | Thatcher | 21.8% | 3.9%(+17.9)#4 | 8.3%(+13.5)#1,152 |
| 5. | Fayette | 19.1% | 3.9%(+15.2)#5 | 8.3%(+10.8)#1,570 |
| 6. | Fort Duchesne | 17.2% | 3.9%(+13.3)#6 | 8.3%(+8.90)#1,982 |
| 7. | Marysvale | 15.9% | 3.9%(+12.0)#7 | 8.3%(+7.60)#2,364 |
| 8. | Montezuma Creek | 14.7% | 3.9%(+10.8)#8 | 8.3%(+6.40)#2,816 |
| 9. | Brian Head | 13.9% | 3.9%(+10.00)#9 | 8.3%(+5.60)#3,170 |
| 10. | Paragonah | 13.0% | 3.9%(+9.10)#10 | 8.3%(+4.70)#3,564 |
| 11. | Goshen | 10.9% | 3.9%(+7.00)#11 | 8.3%(+2.60)#4,928 |
| 12. | Hanksville | 10.9% | 3.9%(+7.00)#12 | 8.3%(+2.60)#4,955 |
| 13. | Flaming Gorge | 10.7% | 3.9%(+6.80)#13 | 8.3%(+2.40)#5,104 |
| 14. | Salt Lake City | 10.1% | 3.9%(+6.20)#14 | 8.3%(+1.80)#5,556 |
| 15. | Garland | 9.9% | 3.9%(+6.00)#15 | 8.3%(+1.60)#5,760 |
| 16. | Alton | 8.5% | 3.9%(+4.60)#16 | 8.3%(+0.200)#7,315 |
| 17. | Ogden | 8.4% | 3.9%(+4.50)#17 | 8.3%(+0.100)#7,339 |
| 18. | Spring Glen | 8.4% | 3.9%(+4.50)#18 | 8.3%(+0.100)#7,413 |
| 19. | Brigham City | 7.7% | 3.9%(+3.80)#19 | 8.3%(-0.600)#8,246 |
| 20. | Neola | 7.7% | 3.9%(+3.80)#20 | 8.3%(-0.600)#8,342 |
| 21. | Blanding | 7.5% | 3.9%(+3.60)#21 | 8.3%(-0.800)#8,562 |
| 22. | Ferron | 7.5% | 3.9%(+3.60)#22 | 8.3%(-0.800)#8,589 |
| 23. | Wendover | 7.3% | 3.9%(+3.40)#23 | 8.3%(-1.00)#8,913 |
| 24. | Roosevelt | 6.9% | 3.9%(+3.00)#24 | 8.3%(-1.40)#9,459 |
| 25. | Price | 6.8% | 3.9%(+2.90)#25 | 8.3%(-1.50)#9,609 |
| 26. | Washington Terrace | 6.5% | 3.9%(+2.60)#26 | 8.3%(-1.80)#10,092 |
| 27. | Richfield | 6.5% | 3.9%(+2.60)#27 | 8.3%(-1.80)#10,096 |
| 28. | Kanab | 6.5% | 3.9%(+2.60)#28 | 8.3%(-1.80)#10,112 |
| 29. | Vineyard | 6.4% | 3.9%(+2.50)#29 | 8.3%(-1.90)#10,259 |
| 30. | Nephi | 6.3% | 3.9%(+2.40)#30 | 8.3%(-2.00)#10,439 |
| 31. | Monticello | 6.3% | 3.9%(+2.40)#31 | 8.3%(-2.00)#10,470 |
| 32. | Midvale | 6.2% | 3.9%(+2.30)#32 | 8.3%(-2.10)#10,589 |
| 33. | Clearfield | 6.2% | 3.9%(+2.30)#33 | 8.3%(-2.10)#10,593 |
| 34. | La Verkin | 6.2% | 3.9%(+2.30)#34 | 8.3%(-2.10)#10,647 |
| 35. | Monroe | 6.2% | 3.9%(+2.30)#35 | 8.3%(-2.10)#10,665 |
| 36. | Bluebell | 6.1% | 3.9%(+2.20)#36 | 8.3%(-2.20)#10,923 |
| 37. | Hyde Park | 6.0% | 3.9%(+2.10)#37 | 8.3%(-2.30)#10,993 |
| 38. | Elmo | 6.0% | 3.9%(+2.10)#38 | 8.3%(-2.30)#11,082 |
| 39. | South Salt Lake | 5.5% | 3.9%(+1.60)#39 | 8.3%(-2.80)#11,954 |
| 40. | Snyderville | 5.4% | 3.9%(+1.50)#40 | 8.3%(-2.90)#12,165 |
| 41. | Tabiona | 5.4% | 3.9%(+1.50)#41 | 8.3%(-2.90)#12,301 |
| 42. | Millcreek | 5.3% | 3.9%(+1.40)#42 | 8.3%(-3.00)#12,317 |
| 43. | Redmond | 5.3% | 3.9%(+1.40)#43 | 8.3%(-3.00)#12,448 |
| 44. | Tooele | 5.1% | 3.9%(+1.20)#44 | 8.3%(-3.20)#12,716 |
| 45. | Ephraim | 5.1% | 3.9%(+1.20)#45 | 8.3%(-3.20)#12,755 |
| 46. | Oljato Monument Valley | 5.1% | 3.9%(+1.20)#46 | 8.3%(-3.20)#12,835 |
| 47. | South Jordan | 5.0% | 3.9%(+1.10)#47 | 8.3%(-3.30)#12,890 |
| 48. | Logan | 5.0% | 3.9%(+1.10)#48 | 8.3%(-3.30)#12,895 |
| 49. | Magna | 5.0% | 3.9%(+1.10)#49 | 8.3%(-3.30)#12,904 |
| 50. | Delta | 5.0% | 3.9%(+1.10)#50 | 8.3%(-3.30)#12,970 |
| 51. | West Valley City | 4.7% | 3.9%(+0.800)#51 | 8.3%(-3.60)#13,537 |
| 52. | Murray | 4.7% | 3.9%(+0.800)#52 | 8.3%(-3.60)#13,547 |
| 53. | Torrey | 4.6% | 3.9%(+0.700)#53 | 8.3%(-3.70)#13,918 |
| 54. | Provo | 4.4% | 3.9%(+0.500)#54 | 8.3%(-3.90)#14,161 |
| 55. | South Ogden | 4.3% | 3.9%(+0.400)#55 | 8.3%(-4.00)#14,380 |
| 56. | Beaver | 4.3% | 3.9%(+0.400)#56 | 8.3%(-4.00)#14,435 |
| 57. | Tropic | 4.3% | 3.9%(+0.400)#57 | 8.3%(-4.00)#14,528 |
| 58. | Taylorsville | 4.2% | 3.9%(+0.300)#58 | 8.3%(-4.10)#14,600 |
| 59. | Stansbury Park | 4.1% | 3.9%(+0.200)#59 | 8.3%(-4.20)#14,861 |
| 60. | Aneth | 4.1% | 3.9%(+0.200)#60 | 8.3%(-4.20)#15,006 |
| 61. | Heber | 4.0% | 3.9%(+0.100)#61 | 8.3%(-4.30)#15,056 |
| 62. | Carbonville | 4.0% | 3.9%(+0.100)#62 | 8.3%(-4.30)#15,159 |
| 63. | Hildale | 4.0% | 3.9%(+0.100)#63 | 8.3%(-4.30)#15,178 |
| 64. | Orangeville | 3.9% | 3.9%(=0.000)#64 | 8.3%(-4.40)#15,413 |
| 65. | Levan | 3.9% | 3.9%(=0.000)#65 | 8.3%(-4.40)#15,446 |
| 66. | St George | 3.8% | 3.9%(-0.100)#66 | 8.3%(-4.50)#15,499 |
| 67. | Vernal | 3.8% | 3.9%(-0.100)#67 | 8.3%(-4.50)#15,556 |
| 68. | Panguitch | 3.8% | 3.9%(-0.100)#68 | 8.3%(-4.50)#15,636 |
| 69. | Newton | 3.8% | 3.9%(-0.100)#69 | 8.3%(-4.50)#15,675 |
| 70. | Escalante | 3.8% | 3.9%(-0.100)#70 | 8.3%(-4.50)#15,699 |
| 71. | Glenwood | 3.8% | 3.9%(-0.100)#71 | 8.3%(-4.50)#15,702 |
| 72. | Bountiful | 3.7% | 3.9%(-0.200)#72 | 8.3%(-4.60)#15,781 |
| 73. | Hoytsville | 3.7% | 3.9%(-0.200)#73 | 8.3%(-4.60)#15,950 |
| 74. | Cedar City | 3.6% | 3.9%(-0.300)#74 | 8.3%(-4.70)#16,039 |
| 75. | Riverside | 3.6% | 3.9%(-0.300)#75 | 8.3%(-4.70)#16,158 |
| 76. | New Harmony | 3.6% | 3.9%(-0.300)#76 | 8.3%(-4.70)#16,225 |
| 77. | Naples | 3.5% | 3.9%(-0.400)#77 | 8.3%(-4.80)#16,369 |
| 78. | Millville | 3.5% | 3.9%(-0.400)#78 | 8.3%(-4.80)#16,390 |
| 79. | Oakley | 3.5% | 3.9%(-0.400)#79 | 8.3%(-4.80)#16,392 |
| 80. | Enterprise | 3.5% | 3.9%(-0.400)#80 | 8.3%(-4.80)#16,401 |
| 81. | Herriman | 3.4% | 3.9%(-0.500)#81 | 8.3%(-4.90)#16,523 |
| 82. | Pleasant Grove | 3.4% | 3.9%(-0.500)#82 | 8.3%(-4.90)#16,530 |
| 83. | Payson | 3.4% | 3.9%(-0.500)#83 | 8.3%(-4.90)#16,545 |
| 84. | Castle Dale | 3.4% | 3.9%(-0.500)#84 | 8.3%(-4.90)#16,652 |
| 85. | Manila | 3.4% | 3.9%(-0.500)#85 | 8.3%(-4.90)#16,715 |
| 86. | Lindon | 3.3% | 3.9%(-0.600)#86 | 8.3%(-5.00)#16,788 |
| 87. | Daniel | 3.3% | 3.9%(-0.600)#87 | 8.3%(-5.00)#16,908 |
| 88. | Henefer | 3.3% | 3.9%(-0.600)#88 | 8.3%(-5.00)#16,923 |
| 89. | Clarkston | 3.3% | 3.9%(-0.600)#89 | 8.3%(-5.00)#16,927 |
| 90. | Riverton | 3.2% | 3.9%(-0.700)#90 | 8.3%(-5.10)#17,000 |
| 91. | North Logan | 3.2% | 3.9%(-0.700)#91 | 8.3%(-5.10)#17,017 |
| 92. | White | 3.2% | 3.9%(-0.700)#92 | 8.3%(-5.10)#17,039 |
| 93. | Sandy | 3.1% | 3.9%(-0.800)#93 | 8.3%(-5.20)#17,224 |
| 94. | Enoch | 3.1% | 3.9%(-0.800)#94 | 8.3%(-5.20)#17,282 |
| 95. | Layton | 3.0% | 3.9%(-0.900)#95 | 8.3%(-5.30)#17,494 |
| 96. | Roy | 3.0% | 3.9%(-0.900)#96 | 8.3%(-5.30)#17,504 |
| 97. | Holladay | 3.0% | 3.9%(-0.900)#97 | 8.3%(-5.30)#17,507 |
| 98. | Bear River City | 3.0% | 3.9%(-0.900)#98 | 8.3%(-5.30)#17,644 |
| 99. | Spring Lake | 3.0% | 3.9%(-0.900)#99 | 8.3%(-5.30)#17,672 |
| 100. | Mapleton | 2.9% | 3.9%(-1.00)#100 | 8.3%(-5.40)#17,759 |
Common Questions
What are the Top 10 Cities with the Highest Percentage of Households Without a Vehicle in Utah?
Top 10 Cities with the Highest Percentage of Households Without a Vehicle in Utah are:
#1
53.8%
#2
30.0%
#3
23.5%
#4
21.8%
#5
19.1%
#6
17.2%
#7
15.9%
#8
14.7%
#9
13.9%
#10
13.0%
What city has the Highest Percentage of Households Without a Vehicle in Utah?
Navajo Mountain has the Highest Percentage of Households Without a Vehicle in Utah with 53.8%.
What is the Percentage of Households Without a Vehicle in the State of Utah?
Percentage of Households Without a Vehicle in Utah is 3.9%.
What is the Percentage of Households Without a Vehicle in the United States?
Percentage of Households Without a Vehicle in the United States is 8.3%.