Cities with the Highest Percentage of Households Without a Vehicle in North Carolina
RELATED REPORTS & OPTIONS
Households without a Cars
North Carolina
Compare Cities
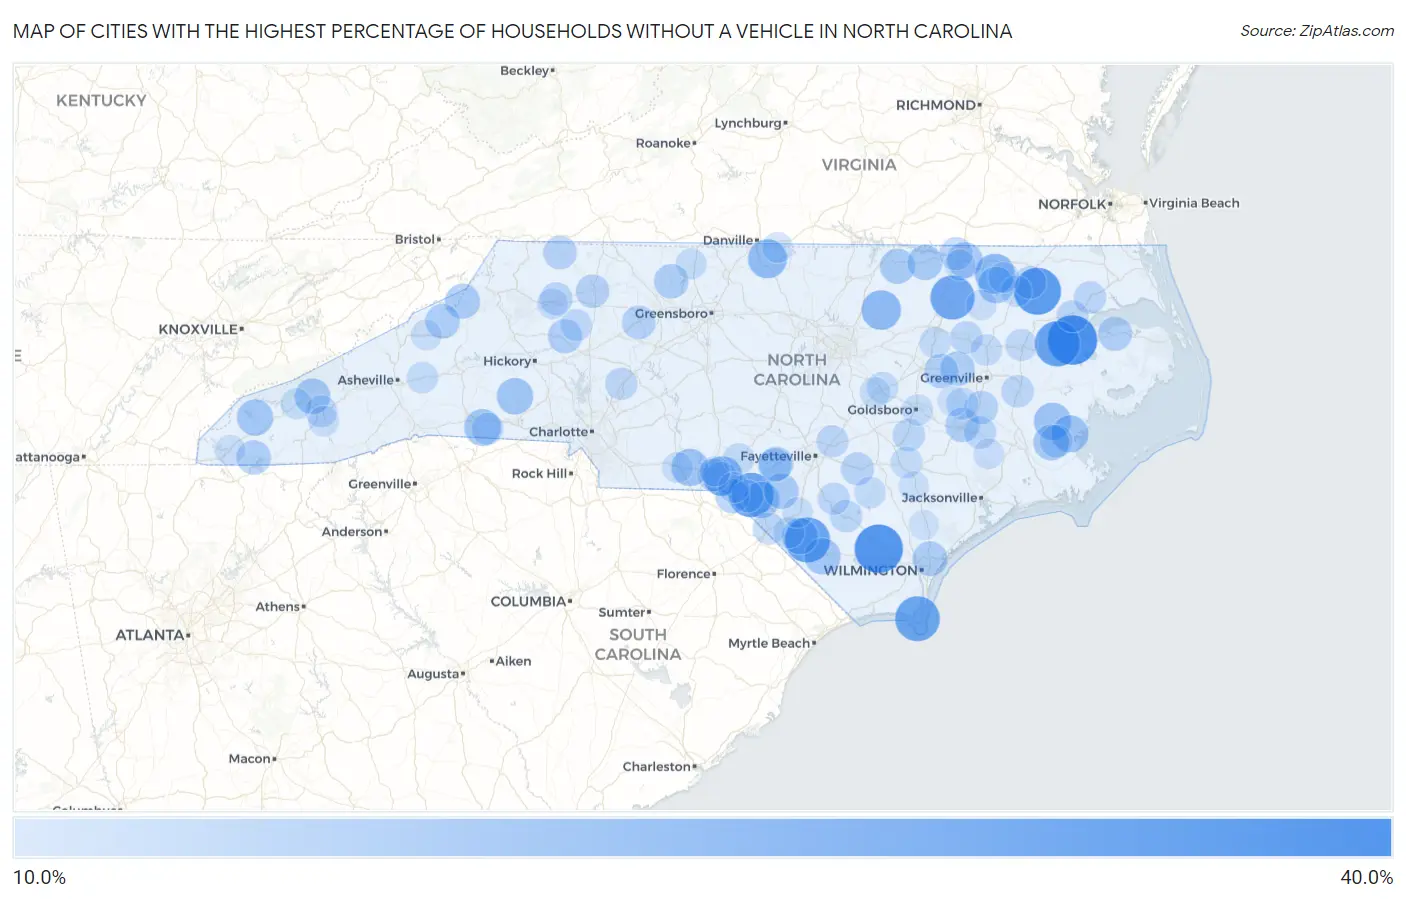
Map of Cities with the Highest Percentage of Households Without a Vehicle in North Carolina
0.0%
40.0%
Cities with the Highest Percentage of Households Without a Vehicle in North Carolina
| City | Housholds Without a Car | vs State | vs National | |
| 1. | Roper | 36.1% | 5.4%(+30.7)#1 | 8.3%(+27.8)#404 |
| 2. | East Arcadia | 34.7% | 5.4%(+29.3)#2 | 8.3%(+26.4)#441 |
| 3. | Carolina Meadows | 34.3% | 5.4%(+28.9)#3 | 8.3%(+26.0)#453 |
| 4. | Powellsville | 33.0% | 5.4%(+27.6)#4 | 8.3%(+24.7)#496 |
| 5. | Plymouth | 31.0% | 5.4%(+25.6)#5 | 8.3%(+22.7)#544 |
| 6. | Boardman | 30.8% | 5.4%(+25.4)#6 | 8.3%(+22.5)#554 |
| 7. | Bald Head Island | 30.3% | 5.4%(+24.9)#7 | 8.3%(+22.0)#571 |
| 8. | East Laurinburg | 30.2% | 5.4%(+24.8)#8 | 8.3%(+21.9)#576 |
| 9. | Enfield | 29.6% | 5.4%(+24.2)#9 | 8.3%(+21.3)#609 |
| 10. | Chowan Beach | 26.0% | 5.4%(+20.6)#10 | 8.3%(+17.7)#792 |
| 11. | Lasker | 24.5% | 5.4%(+19.1)#11 | 8.3%(+16.2)#890 |
| 12. | Dobbins Heights | 24.3% | 5.4%(+18.9)#12 | 8.3%(+16.0)#902 |
| 13. | Louisburg | 23.9% | 5.4%(+18.5)#13 | 8.3%(+15.6)#928 |
| 14. | Yanceyville | 23.5% | 5.4%(+18.1)#14 | 8.3%(+15.2)#965 |
| 15. | Lilesville | 21.4% | 5.4%(+16.0)#15 | 8.3%(+13.1)#1,198 |
| 16. | Aurora | 21.2% | 5.4%(+15.8)#16 | 8.3%(+12.9)#1,230 |
| 17. | Mesic | 21.1% | 5.4%(+15.7)#17 | 8.3%(+12.8)#1,248 |
| 18. | Henrietta | 20.7% | 5.4%(+15.3)#18 | 8.3%(+12.4)#1,311 |
| 19. | Maxton | 20.5% | 5.4%(+15.1)#19 | 8.3%(+12.2)#1,334 |
| 20. | Rich Square | 20.5% | 5.4%(+15.1)#20 | 8.3%(+12.2)#1,337 |
| 21. | Belwood | 20.4% | 5.4%(+15.0)#21 | 8.3%(+12.1)#1,345 |
| 22. | Chadbourn | 20.2% | 5.4%(+14.8)#22 | 8.3%(+11.9)#1,371 |
| 23. | Robbinsville | 20.2% | 5.4%(+14.8)#23 | 8.3%(+11.9)#1,375 |
| 24. | Orrum | 20.0% | 5.4%(+14.6)#24 | 8.3%(+11.7)#1,415 |
| 25. | Alliance | 19.7% | 5.4%(+14.3)#25 | 8.3%(+11.4)#1,457 |
| 26. | Cherokee | 19.5% | 5.4%(+14.1)#26 | 8.3%(+11.2)#1,501 |
| 27. | Garysburg | 19.4% | 5.4%(+14.0)#27 | 8.3%(+11.1)#1,519 |
| 28. | Red Springs | 18.9% | 5.4%(+13.5)#28 | 8.3%(+10.6)#1,592 |
| 29. | Warrenton | 18.9% | 5.4%(+13.5)#29 | 8.3%(+10.6)#1,600 |
| 30. | Littleton | 18.9% | 5.4%(+13.5)#30 | 8.3%(+10.6)#1,604 |
| 31. | Elk Park | 18.8% | 5.4%(+13.4)#31 | 8.3%(+10.5)#1,624 |
| 32. | Northchase | 18.6% | 5.4%(+13.2)#32 | 8.3%(+10.3)#1,651 |
| 33. | Fountain | 18.2% | 5.4%(+12.8)#33 | 8.3%(+9.90)#1,740 |
| 34. | Walnut Cove | 18.1% | 5.4%(+12.7)#34 | 8.3%(+9.80)#1,753 |
| 35. | Bakersville | 18.1% | 5.4%(+12.7)#35 | 8.3%(+9.80)#1,757 |
| 36. | Gibson | 18.0% | 5.4%(+12.6)#36 | 8.3%(+9.70)#1,778 |
| 37. | Hayesville | 18.0% | 5.4%(+12.6)#37 | 8.3%(+9.70)#1,781 |
| 38. | Kinston | 17.9% | 5.4%(+12.5)#38 | 8.3%(+9.60)#1,788 |
| 39. | Silver City | 17.9% | 5.4%(+12.5)#39 | 8.3%(+9.60)#1,804 |
| 40. | Hiddenite | 17.9% | 5.4%(+12.5)#40 | 8.3%(+9.60)#1,805 |
| 41. | Saratoga | 17.8% | 5.4%(+12.4)#41 | 8.3%(+9.50)#1,839 |
| 42. | Columbia | 17.7% | 5.4%(+12.3)#42 | 8.3%(+9.40)#1,854 |
| 43. | Hamlet | 17.5% | 5.4%(+12.1)#43 | 8.3%(+9.20)#1,893 |
| 44. | Raeford | 17.3% | 5.4%(+11.9)#44 | 8.3%(+9.00)#1,951 |
| 45. | Sparta | 17.2% | 5.4%(+11.8)#45 | 8.3%(+8.90)#1,976 |
| 46. | Bermuda Run | 17.1% | 5.4%(+11.7)#46 | 8.3%(+8.80)#1,999 |
| 47. | Jonesville | 17.0% | 5.4%(+11.6)#47 | 8.3%(+8.70)#2,021 |
| 48. | Grifton | 16.9% | 5.4%(+11.5)#48 | 8.3%(+8.60)#2,044 |
| 49. | Roseboro | 16.5% | 5.4%(+11.1)#49 | 8.3%(+8.20)#2,168 |
| 50. | Bayboro | 16.4% | 5.4%(+11.0)#50 | 8.3%(+8.10)#2,202 |
| 51. | Gaston | 16.4% | 5.4%(+11.0)#51 | 8.3%(+8.10)#2,205 |
| 52. | North Wilkesboro | 16.3% | 5.4%(+10.9)#52 | 8.3%(+8.00)#2,225 |
| 53. | East Rockingham | 16.3% | 5.4%(+10.9)#53 | 8.3%(+8.00)#2,227 |
| 54. | Ahoskie | 16.2% | 5.4%(+10.8)#54 | 8.3%(+7.90)#2,253 |
| 55. | Tarboro | 16.0% | 5.4%(+10.6)#55 | 8.3%(+7.70)#2,304 |
| 56. | Mount Olive | 16.0% | 5.4%(+10.6)#56 | 8.3%(+7.70)#2,311 |
| 57. | Chocowinity | 16.0% | 5.4%(+10.6)#57 | 8.3%(+7.70)#2,325 |
| 58. | Hertford | 15.8% | 5.4%(+10.4)#58 | 8.3%(+7.50)#2,389 |
| 59. | Elizabethtown | 15.7% | 5.4%(+10.3)#59 | 8.3%(+7.40)#2,427 |
| 60. | Dover | 15.7% | 5.4%(+10.3)#60 | 8.3%(+7.40)#2,444 |
| 61. | Laurinburg | 15.6% | 5.4%(+10.2)#61 | 8.3%(+7.30)#2,455 |
| 62. | China Grove | 15.6% | 5.4%(+10.2)#62 | 8.3%(+7.30)#2,459 |
| 63. | Edenton | 15.4% | 5.4%(+10.00)#63 | 8.3%(+7.10)#2,536 |
| 64. | Rowland | 15.4% | 5.4%(+10.00)#64 | 8.3%(+7.10)#2,543 |
| 65. | Wade | 15.4% | 5.4%(+10.00)#65 | 8.3%(+7.10)#2,547 |
| 66. | White Oak | 15.4% | 5.4%(+10.00)#66 | 8.3%(+7.10)#2,549 |
| 67. | Sylva | 15.3% | 5.4%(+9.90)#67 | 8.3%(+7.00)#2,584 |
| 68. | Cliffside | 15.3% | 5.4%(+9.90)#68 | 8.3%(+7.00)#2,598 |
| 69. | Williamston | 15.2% | 5.4%(+9.80)#69 | 8.3%(+6.90)#2,611 |
| 70. | Hookerton | 15.2% | 5.4%(+9.80)#70 | 8.3%(+6.90)#2,628 |
| 71. | Love Valley | 15.2% | 5.4%(+9.80)#71 | 8.3%(+6.90)#2,635 |
| 72. | Warsaw | 14.9% | 5.4%(+9.50)#72 | 8.3%(+6.60)#2,720 |
| 73. | Garland | 14.9% | 5.4%(+9.50)#73 | 8.3%(+6.60)#2,731 |
| 74. | Black Mountain | 14.7% | 5.4%(+9.30)#74 | 8.3%(+6.40)#2,789 |
| 75. | Bethel | 14.7% | 5.4%(+9.30)#75 | 8.3%(+6.40)#2,801 |
| 76. | Selma | 14.6% | 5.4%(+9.20)#76 | 8.3%(+6.30)#2,828 |
| 77. | Sharpsburg | 14.6% | 5.4%(+9.20)#77 | 8.3%(+6.30)#2,845 |
| 78. | Aulander | 14.5% | 5.4%(+9.10)#78 | 8.3%(+6.20)#2,897 |
| 79. | Goldsboro | 14.4% | 5.4%(+9.00)#79 | 8.3%(+6.10)#2,913 |
| 80. | Fairmont | 14.4% | 5.4%(+9.00)#80 | 8.3%(+6.10)#2,930 |
| 81. | Hoffman | 14.4% | 5.4%(+9.00)#81 | 8.3%(+6.10)#2,943 |
| 82. | Mayodan | 14.2% | 5.4%(+8.80)#82 | 8.3%(+5.90)#3,026 |
| 83. | Bryson City | 14.2% | 5.4%(+8.80)#83 | 8.3%(+5.90)#3,029 |
| 84. | South Weldon | 14.2% | 5.4%(+8.80)#84 | 8.3%(+5.90)#3,037 |
| 85. | Wadesboro | 14.1% | 5.4%(+8.70)#85 | 8.3%(+5.80)#3,055 |
| 86. | Old Hundred | 14.1% | 5.4%(+8.70)#86 | 8.3%(+5.80)#3,085 |
| 87. | Wilkesboro | 14.0% | 5.4%(+8.60)#87 | 8.3%(+5.70)#3,105 |
| 88. | Woodland | 14.0% | 5.4%(+8.60)#88 | 8.3%(+5.70)#3,116 |
| 89. | Smithfield | 13.9% | 5.4%(+8.50)#89 | 8.3%(+5.60)#3,132 |
| 90. | Milton | 13.9% | 5.4%(+8.50)#90 | 8.3%(+5.60)#3,168 |
| 91. | Lumberton | 13.8% | 5.4%(+8.40)#91 | 8.3%(+5.50)#3,173 |
| 92. | Burnsville | 13.8% | 5.4%(+8.40)#92 | 8.3%(+5.50)#3,191 |
| 93. | Murphy | 13.7% | 5.4%(+8.30)#93 | 8.3%(+5.40)#3,243 |
| 94. | Forest Hills | 13.7% | 5.4%(+8.30)#94 | 8.3%(+5.40)#3,263 |
| 95. | Trenton | 13.7% | 5.4%(+8.30)#95 | 8.3%(+5.40)#3,268 |
| 96. | Scotland Neck | 13.6% | 5.4%(+8.20)#96 | 8.3%(+5.30)#3,286 |
| 97. | Rockingham | 13.5% | 5.4%(+8.10)#97 | 8.3%(+5.20)#3,315 |
| 98. | Rose Hill | 13.3% | 5.4%(+7.90)#98 | 8.3%(+5.00)#3,414 |
| 99. | Burgaw | 13.2% | 5.4%(+7.80)#99 | 8.3%(+4.90)#3,456 |
| 100. | Snow Hill | 13.2% | 5.4%(+7.80)#100 | 8.3%(+4.90)#3,462 |
Common Questions
What are the Top 10 Cities with the Highest Percentage of Households Without a Vehicle in North Carolina?
Top 10 Cities with the Highest Percentage of Households Without a Vehicle in North Carolina are:
#1
36.1%
#2
34.7%
#3
33.0%
#4
31.0%
#5
30.8%
#6
30.3%
#7
30.2%
#8
29.6%
#9
24.5%
#10
24.3%
What city has the Highest Percentage of Households Without a Vehicle in North Carolina?
Roper has the Highest Percentage of Households Without a Vehicle in North Carolina with 36.1%.
What is the Percentage of Households Without a Vehicle in the State of North Carolina?
Percentage of Households Without a Vehicle in North Carolina is 5.4%.
What is the Percentage of Households Without a Vehicle in the United States?
Percentage of Households Without a Vehicle in the United States is 8.3%.