Zip Codes with the Highest Percentage of Households Without a Vehicle in Los Angeles, CA
RELATED REPORTS & OPTIONS
Households without a Cars
Los Angeles
Compare Zip Codes
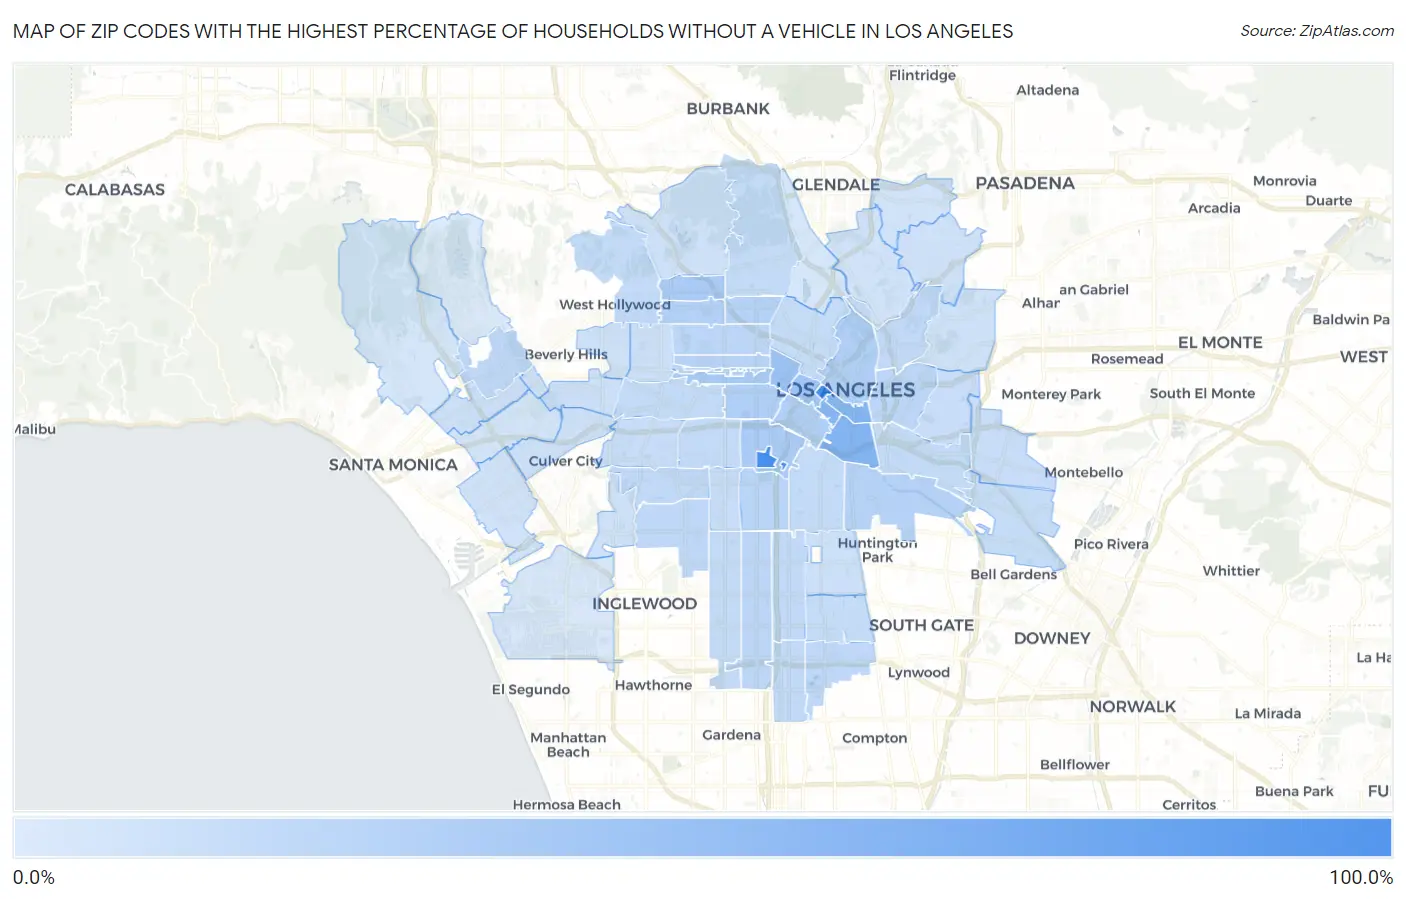
Map of Zip Codes with the Highest Percentage of Households Without a Vehicle in Los Angeles
1.2%
100.0%
Zip Codes with the Highest Percentage of Households Without a Vehicle in Los Angeles, CA
| Zip Code | Housholds Without a Car | vs State | vs National | |
| 1. | 90089 | 100.0% | 6.9%(+93.1)#2 | 8.3%(+91.7)#6 |
| 2. | 90071 | 100.0% | 6.9%(+93.1)#3 | 8.3%(+91.7)#20 |
| 3. | 90021 | 52.9% | 6.9%(+46.0)#11 | 8.3%(+44.6)#321 |
| 4. | 90014 | 50.2% | 6.9%(+43.3)#12 | 8.3%(+41.9)#341 |
| 5. | 90013 | 50.1% | 6.9%(+43.2)#13 | 8.3%(+41.8)#343 |
| 6. | 90057 | 35.7% | 6.9%(+28.8)#24 | 8.3%(+27.4)#621 |
| 7. | 90017 | 33.0% | 6.9%(+26.1)#26 | 8.3%(+24.7)#696 |
| 8. | 90005 | 28.5% | 6.9%(+21.6)#35 | 8.3%(+20.2)#870 |
| 9. | 90007 | 27.7% | 6.9%(+20.8)#36 | 8.3%(+19.4)#903 |
| 10. | 90028 | 27.4% | 6.9%(+20.5)#37 | 8.3%(+19.1)#916 |
| 11. | 90012 | 24.1% | 6.9%(+17.2)#46 | 8.3%(+15.8)#1,126 |
| 12. | 90015 | 23.9% | 6.9%(+17.0)#47 | 8.3%(+15.6)#1,144 |
| 13. | 90006 | 23.6% | 6.9%(+16.7)#49 | 8.3%(+15.3)#1,166 |
| 14. | 90038 | 22.4% | 6.9%(+15.5)#54 | 8.3%(+14.1)#1,264 |
| 15. | 90058 | 21.1% | 6.9%(+14.2)#59 | 8.3%(+12.8)#1,387 |
| 16. | 90029 | 20.5% | 6.9%(+13.6)#61 | 8.3%(+12.2)#1,438 |
| 17. | 90020 | 19.5% | 6.9%(+12.6)#70 | 8.3%(+11.2)#1,564 |
| 18. | 90037 | 18.5% | 6.9%(+11.6)#77 | 8.3%(+10.2)#1,706 |
| 19. | 90010 | 18.5% | 6.9%(+11.6)#78 | 8.3%(+10.2)#1,711 |
| 20. | 90004 | 16.9% | 6.9%(+10.00)#87 | 8.3%(+8.60)#1,974 |
| 21. | 90033 | 16.9% | 6.9%(+10.00)#88 | 8.3%(+8.60)#1,975 |
| 22. | 90044 | 16.6% | 6.9%(+9.70)#90 | 8.3%(+8.30)#2,034 |
| 23. | 90024 | 16.2% | 6.9%(+9.30)#92 | 8.3%(+7.90)#2,101 |
| 24. | 90043 | 15.5% | 6.9%(+8.60)#99 | 8.3%(+7.20)#2,248 |
| 25. | 90059 | 15.5% | 6.9%(+8.60)#101 | 8.3%(+7.20)#2,251 |
| 26. | 90031 | 15.1% | 6.9%(+8.20)#108 | 8.3%(+6.80)#2,354 |
| 27. | 90061 | 14.9% | 6.9%(+8.00)#114 | 8.3%(+6.60)#2,407 |
| 28. | 90003 | 14.8% | 6.9%(+7.90)#116 | 8.3%(+6.50)#2,436 |
| 29. | 90008 | 14.8% | 6.9%(+7.90)#117 | 8.3%(+6.50)#2,440 |
| 30. | 90046 | 13.7% | 6.9%(+6.80)#136 | 8.3%(+5.40)#2,800 |
| 31. | 90027 | 13.7% | 6.9%(+6.80)#137 | 8.3%(+5.40)#2,801 |
| 32. | 90018 | 13.5% | 6.9%(+6.60)#140 | 8.3%(+5.20)#2,872 |
| 33. | 90023 | 13.5% | 6.9%(+6.60)#141 | 8.3%(+5.20)#2,873 |
| 34. | 90011 | 13.2% | 6.9%(+6.30)#146 | 8.3%(+4.90)#2,999 |
| 35. | 90019 | 13.2% | 6.9%(+6.30)#147 | 8.3%(+4.90)#3,000 |
| 36. | 90047 | 13.1% | 6.9%(+6.20)#149 | 8.3%(+4.80)#3,042 |
| 37. | 90002 | 12.7% | 6.9%(+5.80)#158 | 8.3%(+4.40)#3,218 |
| 38. | 90026 | 12.4% | 6.9%(+5.50)#164 | 8.3%(+4.10)#3,356 |
| 39. | 90040 | 11.9% | 6.9%(+5.00)#171 | 8.3%(+3.60)#3,619 |
| 40. | 90063 | 11.5% | 6.9%(+4.60)#180 | 8.3%(+3.20)#3,816 |
| 41. | 90016 | 11.4% | 6.9%(+4.50)#181 | 8.3%(+3.10)#3,876 |
| 42. | 90062 | 11.2% | 6.9%(+4.30)#184 | 8.3%(+2.90)#4,010 |
| 43. | 90022 | 10.7% | 6.9%(+3.80)#198 | 8.3%(+2.40)#4,296 |
| 44. | 90025 | 9.4% | 6.9%(+2.50)#254 | 8.3%(+1.10)#5,339 |
| 45. | 90067 | 9.4% | 6.9%(+2.50)#258 | 8.3%(+1.10)#5,387 |
| 46. | 90001 | 9.3% | 6.9%(+2.40)#260 | 8.3%(+1.00)#5,414 |
| 47. | 90035 | 8.9% | 6.9%(+2.00)#284 | 8.3%(+0.600)#5,843 |
| 48. | 90036 | 8.4% | 6.9%(+1.50)#323 | 8.3%(+0.100)#6,422 |
| 49. | 90068 | 8.2% | 6.9%(+1.30)#344 | 8.3%(-0.100)#6,666 |
| 50. | 90048 | 7.9% | 6.9%(+1.000)#371 | 8.3%(-0.400)#7,110 |
| 51. | 90032 | 7.8% | 6.9%(+0.900)#378 | 8.3%(-0.500)#7,210 |
| 52. | 90034 | 7.5% | 6.9%(+0.600)#401 | 8.3%(-0.800)#7,675 |
| 53. | 90056 | 7.5% | 6.9%(+0.600)#405 | 8.3%(-0.800)#7,752 |
| 54. | 90042 | 7.4% | 6.9%(+0.500)#410 | 8.3%(-0.900)#7,839 |
| 55. | 90041 | 6.8% | 6.9%(-0.100)#487 | 8.3%(-1.50)#8,869 |
| 56. | 90065 | 6.7% | 6.9%(-0.200)#493 | 8.3%(-1.60)#9,007 |
| 57. | 90066 | 6.1% | 6.9%(-0.800)#580 | 8.3%(-2.20)#10,171 |
| 58. | 90064 | 5.8% | 6.9%(-1.10)#643 | 8.3%(-2.50)#10,915 |
| 59. | 90049 | 4.3% | 6.9%(-2.60)#857 | 8.3%(-4.00)#14,786 |
| 60. | 90039 | 4.3% | 6.9%(-2.60)#860 | 8.3%(-4.00)#14,804 |
| 61. | 90045 | 3.7% | 6.9%(-3.20)#987 | 8.3%(-4.60)#16,646 |
| 62. | 90077 | 1.2% | 6.9%(-5.70)#1,415 | 8.3%(-7.10)#25,101 |
1
Common Questions
What are the Top 10 Zip Codes with the Highest Percentage of Households Without a Vehicle in Los Angeles, CA?
Top 10 Zip Codes with the Highest Percentage of Households Without a Vehicle in Los Angeles, CA are:
What zip code has the Highest Percentage of Households Without a Vehicle in Los Angeles, CA?
90089 has the Highest Percentage of Households Without a Vehicle in Los Angeles, CA with 100.0%.
What is the Percentage of Households Without a Vehicle in Los Angeles, CA?
Percentage of Households Without a Vehicle in Los Angeles is 11.7%.
What is the Percentage of Households Without a Vehicle in California?
Percentage of Households Without a Vehicle in California is 6.9%.
What is the Percentage of Households Without a Vehicle in the United States?
Percentage of Households Without a Vehicle in the United States is 8.3%.