Cities with the Highest Percentage of Households Without a Vehicle in Montana
RELATED REPORTS & OPTIONS
Households without a Cars
Montana
Compare Cities
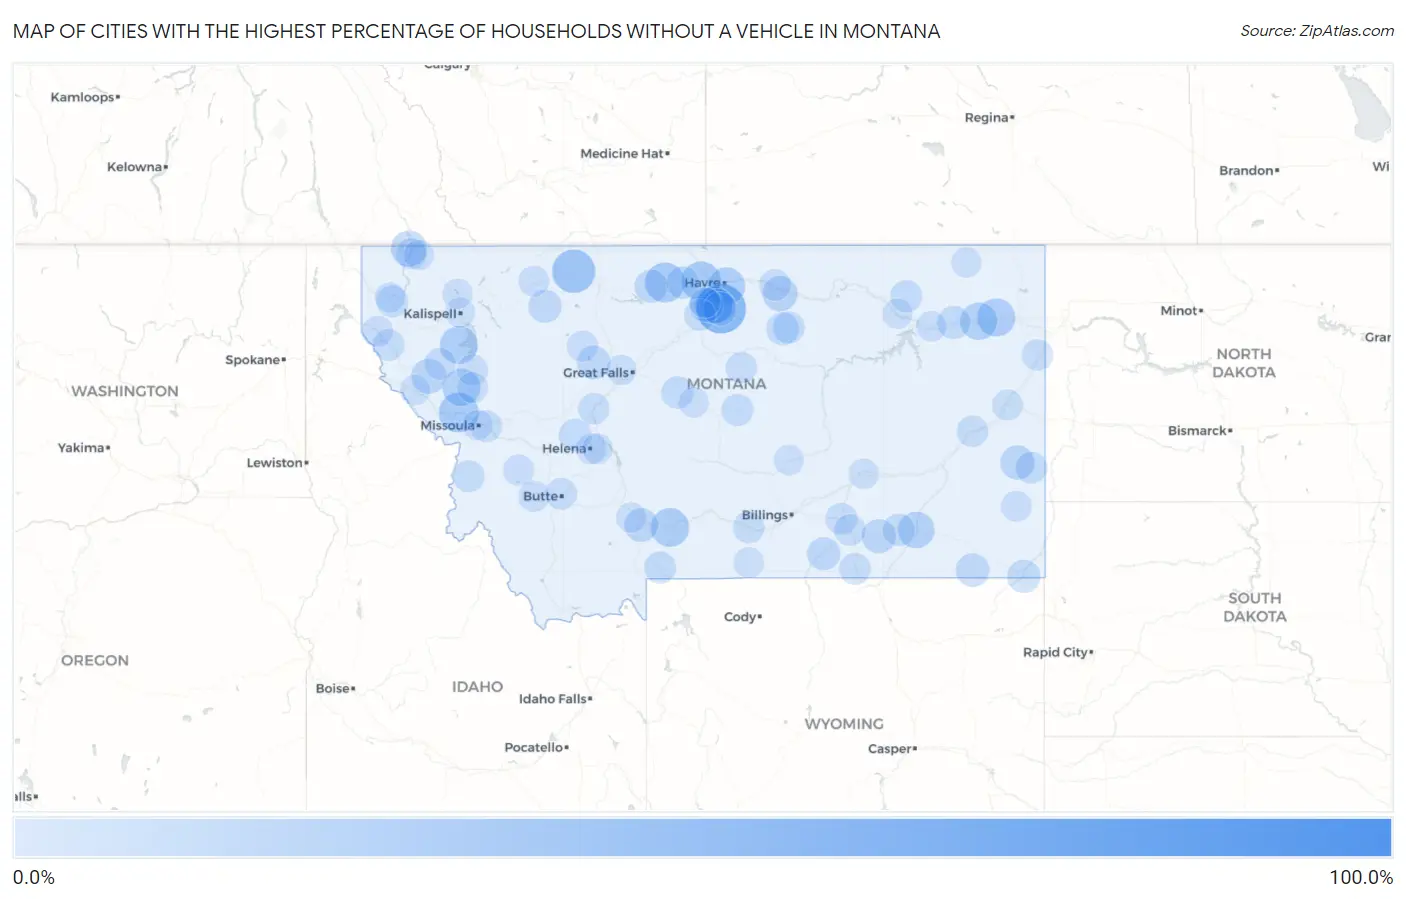
Map of Cities with the Highest Percentage of Households Without a Vehicle in Montana
0.0%
100.0%
Cities with the Highest Percentage of Households Without a Vehicle in Montana
| City | Housholds Without a Car | vs State | vs National | |
| 1. | Hillside Colony | 100.0% | 4.6%(+95.4)#1 | 8.3%(+91.7)#10 |
| 2. | St. Mary | 100.0% | 4.6%(+95.4)#2 | 8.3%(+91.7)#11 |
| 3. | Eagle Creek Colony | 100.0% | 4.6%(+95.4)#3 | 8.3%(+91.7)#25 |
| 4. | Pleasant Valley Colony | 100.0% | 4.6%(+95.4)#4 | 8.3%(+91.7)#29 |
| 5. | Pondera Colony | 100.0% | 4.6%(+95.4)#5 | 8.3%(+91.7)#31 |
| 6. | Gildford Colony | 100.0% | 4.6%(+95.4)#6 | 8.3%(+91.7)#39 |
| 7. | Duncan Ranch Colony | 100.0% | 4.6%(+95.4)#7 | 8.3%(+91.7)#59 |
| 8. | Rimrock Colony | 87.5% | 4.6%(+82.9)#8 | 8.3%(+79.2)#103 |
| 9. | Riverview Colony | 70.3% | 4.6%(+65.7)#9 | 8.3%(+62.0)#155 |
| 10. | Big Stone Colony | 61.5% | 4.6%(+56.9)#10 | 8.3%(+53.2)#179 |
| 11. | New Miami Colony | 55.8% | 4.6%(+51.2)#11 | 8.3%(+47.5)#205 |
| 12. | North Harlem Colony | 55.6% | 4.6%(+51.0)#12 | 8.3%(+47.3)#206 |
| 13. | Parker School | 54.2% | 4.6%(+49.6)#13 | 8.3%(+45.9)#216 |
| 14. | Birch Creek Colony | 45.5% | 4.6%(+40.9)#14 | 8.3%(+37.2)#274 |
| 15. | Turner Colony | 42.9% | 4.6%(+38.3)#15 | 8.3%(+34.6)#307 |
| 16. | Santa Rita | 38.9% | 4.6%(+34.3)#16 | 8.3%(+30.6)#357 |
| 17. | Huson | 30.9% | 4.6%(+26.3)#17 | 8.3%(+22.6)#551 |
| 18. | Inverness | 30.8% | 4.6%(+26.2)#18 | 8.3%(+22.5)#557 |
| 19. | Kremlin | 30.0% | 4.6%(+25.4)#19 | 8.3%(+21.7)#588 |
| 20. | Wineglass | 27.4% | 4.6%(+22.8)#20 | 8.3%(+19.1)#707 |
| 21. | Brockton | 26.0% | 4.6%(+21.4)#21 | 8.3%(+17.7)#791 |
| 22. | Elmo | 25.7% | 4.6%(+21.1)#22 | 8.3%(+17.4)#808 |
| 23. | Saddle Butte | 25.4% | 4.6%(+20.8)#23 | 8.3%(+17.1)#826 |
| 24. | Old Agency | 25.0% | 4.6%(+20.4)#24 | 8.3%(+16.7)#855 |
| 25. | Poplar | 24.5% | 4.6%(+19.9)#25 | 8.3%(+16.2)#884 |
| 26. | Boneau | 23.9% | 4.6%(+19.3)#26 | 8.3%(+15.6)#937 |
| 27. | Ashland | 22.4% | 4.6%(+17.8)#27 | 8.3%(+14.1)#1,068 |
| 28. | West Kootenai | 20.9% | 4.6%(+16.3)#28 | 8.3%(+12.6)#1,278 |
| 29. | Silver Star | 20.0% | 4.6%(+15.4)#29 | 8.3%(+11.7)#1,413 |
| 30. | Fort Belknap Agency | 19.3% | 4.6%(+14.7)#30 | 8.3%(+11.0)#1,538 |
| 31. | Plains | 18.7% | 4.6%(+14.1)#31 | 8.3%(+10.4)#1,641 |
| 32. | Sangrey | 17.8% | 4.6%(+13.2)#32 | 8.3%(+9.50)#1,835 |
| 33. | Plevna | 17.1% | 4.6%(+12.5)#33 | 8.3%(+8.80)#2,008 |
| 34. | Busby | 16.3% | 4.6%(+11.7)#34 | 8.3%(+8.00)#2,242 |
| 35. | King Arthur Park | 16.1% | 4.6%(+11.5)#35 | 8.3%(+7.80)#2,289 |
| 36. | Rocky Boy West | 15.8% | 4.6%(+11.2)#36 | 8.3%(+7.50)#2,400 |
| 37. | Fairfield | 15.6% | 4.6%(+11.0)#37 | 8.3%(+7.30)#2,473 |
| 38. | Pine Creek | 15.4% | 4.6%(+10.8)#38 | 8.3%(+7.10)#2,554 |
| 39. | Biddle | 15.4% | 4.6%(+10.8)#39 | 8.3%(+7.10)#2,562 |
| 40. | Rocky Boy S Agency | 15.2% | 4.6%(+10.6)#40 | 8.3%(+6.90)#2,634 |
| 41. | Chester | 14.8% | 4.6%(+10.2)#41 | 8.3%(+6.50)#2,769 |
| 42. | Fort Smith | 14.7% | 4.6%(+10.1)#42 | 8.3%(+6.40)#2,819 |
| 43. | Heart Butte | 14.4% | 4.6%(+9.80)#43 | 8.3%(+6.10)#2,952 |
| 44. | Alzada | 14.3% | 4.6%(+9.70)#44 | 8.3%(+6.00)#3,003 |
| 45. | Wolf Point | 14.0% | 4.6%(+9.40)#45 | 8.3%(+5.70)#3,108 |
| 46. | Hays | 13.2% | 4.6%(+8.60)#46 | 8.3%(+4.90)#3,472 |
| 47. | Hingham | 13.0% | 4.6%(+8.40)#47 | 8.3%(+4.70)#3,574 |
| 48. | Geyser | 12.5% | 4.6%(+7.90)#48 | 8.3%(+4.20)#3,853 |
| 49. | Marysville | 12.5% | 4.6%(+7.90)#49 | 8.3%(+4.20)#3,855 |
| 50. | Lame Deer | 12.4% | 4.6%(+7.80)#50 | 8.3%(+4.10)#3,894 |
| 51. | Lodge Pole | 11.8% | 4.6%(+7.20)#51 | 8.3%(+3.50)#4,300 |
| 52. | Lewistown | 11.7% | 4.6%(+7.10)#52 | 8.3%(+3.40)#4,328 |
| 53. | White Haven | 11.7% | 4.6%(+7.10)#53 | 8.3%(+3.40)#4,355 |
| 54. | Corwin Springs | 11.7% | 4.6%(+7.10)#54 | 8.3%(+3.40)#4,373 |
| 55. | St Marie | 11.5% | 4.6%(+6.90)#55 | 8.3%(+3.20)#4,500 |
| 56. | Baker | 11.3% | 4.6%(+6.70)#56 | 8.3%(+3.00)#4,604 |
| 57. | Hamilton | 11.1% | 4.6%(+6.50)#57 | 8.3%(+2.80)#4,722 |
| 58. | Big Sandy | 11.1% | 4.6%(+6.50)#58 | 8.3%(+2.80)#4,748 |
| 59. | Walkerville | 11.1% | 4.6%(+6.50)#59 | 8.3%(+2.80)#4,750 |
| 60. | Piltzville | 11.1% | 4.6%(+6.50)#60 | 8.3%(+2.80)#4,751 |
| 61. | Trout Creek | 11.1% | 4.6%(+6.50)#61 | 8.3%(+2.80)#4,764 |
| 62. | Hardin | 11.0% | 4.6%(+6.40)#62 | 8.3%(+2.70)#4,817 |
| 63. | Wyola | 11.0% | 4.6%(+6.40)#63 | 8.3%(+2.70)#4,865 |
| 64. | Hot Springs | 10.9% | 4.6%(+6.30)#64 | 8.3%(+2.60)#4,936 |
| 65. | Harlem | 10.8% | 4.6%(+6.20)#65 | 8.3%(+2.50)#5,010 |
| 66. | Crow Agency | 10.6% | 4.6%(+6.00)#66 | 8.3%(+2.30)#5,150 |
| 67. | Columbus | 10.6% | 4.6%(+6.00)#67 | 8.3%(+2.30)#5,151 |
| 68. | Craig | 10.5% | 4.6%(+5.90)#68 | 8.3%(+2.20)#5,292 |
| 69. | Terry | 10.3% | 4.6%(+5.70)#69 | 8.3%(+2.00)#5,433 |
| 70. | Sidney | 9.9% | 4.6%(+5.30)#70 | 8.3%(+1.60)#5,739 |
| 71. | Winifred | 9.9% | 4.6%(+5.30)#71 | 8.3%(+1.60)#5,810 |
| 72. | Ronan | 9.6% | 4.6%(+5.00)#72 | 8.3%(+1.30)#6,048 |
| 73. | Choteau | 9.6% | 4.6%(+5.00)#73 | 8.3%(+1.30)#6,050 |
| 74. | Rexford | 9.6% | 4.6%(+5.00)#74 | 8.3%(+1.30)#6,093 |
| 75. | Philipsburg | 9.4% | 4.6%(+4.80)#75 | 8.3%(+1.10)#6,266 |
| 76. | Noxon | 9.4% | 4.6%(+4.80)#76 | 8.3%(+1.10)#6,297 |
| 77. | Anaconda Deer Lodge County | 9.3% | 4.6%(+4.70)#77 | 8.3%(+1.00)#6,326 |
| 78. | St Ignatius | 9.1% | 4.6%(+4.50)#78 | 8.3%(+0.800)#6,582 |
| 79. | Glendive | 9.0% | 4.6%(+4.40)#79 | 8.3%(+0.700)#6,675 |
| 80. | Ekalaka | 8.8% | 4.6%(+4.20)#80 | 8.3%(+0.500)#6,968 |
| 81. | Box Elder | 8.6% | 4.6%(+4.00)#81 | 8.3%(+0.300)#7,209 |
| 82. | Helena | 8.5% | 4.6%(+3.90)#82 | 8.3%(+0.200)#7,224 |
| 83. | North Browning | 8.5% | 4.6%(+3.90)#83 | 8.3%(+0.200)#7,262 |
| 84. | Frazer | 8.2% | 4.6%(+3.60)#84 | 8.3%(-0.100)#7,684 |
| 85. | Red Lodge | 8.1% | 4.6%(+3.50)#85 | 8.3%(-0.200)#7,760 |
| 86. | East Helena | 8.1% | 4.6%(+3.50)#86 | 8.3%(-0.200)#7,766 |
| 87. | Roundup | 8.1% | 4.6%(+3.50)#87 | 8.3%(-0.200)#7,767 |
| 88. | Stanford | 7.9% | 4.6%(+3.30)#88 | 8.3%(-0.400)#8,082 |
| 89. | Missoula | 7.8% | 4.6%(+3.20)#89 | 8.3%(-0.500)#8,096 |
| 90. | Libby | 7.7% | 4.6%(+3.10)#90 | 8.3%(-0.600)#8,290 |
| 91. | Eureka | 7.7% | 4.6%(+3.10)#91 | 8.3%(-0.600)#8,308 |
| 92. | Churchill | 7.7% | 4.6%(+3.10)#92 | 8.3%(-0.600)#8,323 |
| 93. | Hysham | 7.7% | 4.6%(+3.10)#93 | 8.3%(-0.600)#8,352 |
| 94. | Luther | 7.7% | 4.6%(+3.10)#94 | 8.3%(-0.600)#8,371 |
| 95. | Sun Prairie | 7.6% | 4.6%(+3.00)#95 | 8.3%(-0.700)#8,469 |
| 96. | St Regis | 7.6% | 4.6%(+3.00)#96 | 8.3%(-0.700)#8,499 |
| 97. | Kalispell | 7.5% | 4.6%(+2.90)#97 | 8.3%(-0.800)#8,521 |
| 98. | Scobey | 7.5% | 4.6%(+2.90)#98 | 8.3%(-0.800)#8,608 |
| 99. | Whitefish | 7.4% | 4.6%(+2.80)#99 | 8.3%(-0.900)#8,688 |
| 100. | Glasgow | 7.4% | 4.6%(+2.80)#100 | 8.3%(-0.900)#8,714 |
Common Questions
What are the Top 10 Cities with the Highest Percentage of Households Without a Vehicle in Montana?
Top 10 Cities with the Highest Percentage of Households Without a Vehicle in Montana are:
#1
54.2%
#2
38.9%
#3
30.9%
#4
30.8%
#5
30.0%
#6
27.4%
#7
26.0%
#8
25.7%
#9
25.4%
#10
25.0%
What city has the Highest Percentage of Households Without a Vehicle in Montana?
Parker School has the Highest Percentage of Households Without a Vehicle in Montana with 54.2%.
What is the Percentage of Households Without a Vehicle in the State of Montana?
Percentage of Households Without a Vehicle in Montana is 4.6%.
What is the Percentage of Households Without a Vehicle in the United States?
Percentage of Households Without a Vehicle in the United States is 8.3%.