Midway City, CA Map & Demographics
Midway City Map
Midway City Overview
$28,277
PER CAPITA INCOME
$78,807
AVG FAMILY INCOME
$62,176
AVG HOUSEHOLD INCOME
24.6%
WAGE / INCOME GAP [ % ]
75.4¢/ $1
WAGE / INCOME GAP [ $ ]
$14,007
FAMILY INCOME DEFICIT
0.53
INEQUALITY / GINI INDEX
8,032
TOTAL POPULATION
4,110
MALE POPULATION
3,922
FEMALE POPULATION
104.79
MALES / 100 FEMALES
95.43
FEMALES / 100 MALES
40.5
MEDIAN AGE
3.6
AVG FAMILY SIZE
3.2
AVG HOUSEHOLD SIZE
3,718
LABOR FORCE [ PEOPLE ]
56.7%
PERCENT IN LABOR FORCE
8.9%
UNEMPLOYMENT RATE
Midway City Zip Codes
Midway City Area Codes
Income in Midway City
Income Overview in Midway City
Per Capita Income in Midway City is $28,277, while median incomes of families and households are $78,807 and $62,176 respectively.
| Characteristic | Number | Measure |
| Per Capita Income | 8,032 | $28,277 |
| Median Family Income | 1,778 | $78,807 |
| Mean Family Income | 1,778 | $100,806 |
| Median Household Income | 2,502 | $62,176 |
| Mean Household Income | 2,502 | $90,043 |
| Income Deficit | 1,778 | $14,007 |
| Wage / Income Gap (%) | 8,032 | 24.60% |
| Wage / Income Gap ($) | 8,032 | 75.40¢ per $1 |
| Gini / Inequality Index | 8,032 | 0.53 |
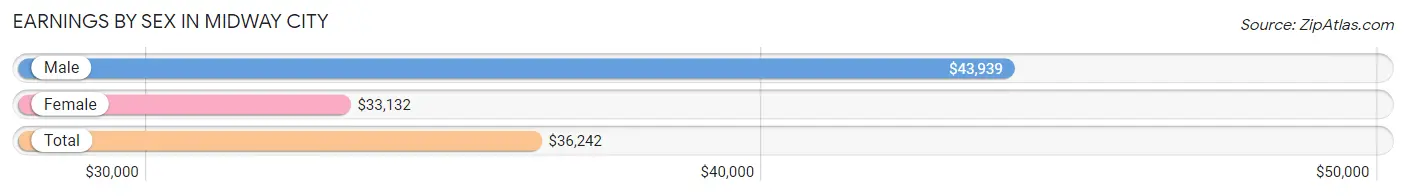
Earnings by Sex in Midway City
Average Earnings in Midway City are $36,242, $43,939 for men and $33,132 for women, a difference of 24.6%.
| Sex | Number | Average Earnings |
| Male | 1,980 (55.2%) | $43,939 |
| Female | 1,609 (44.8%) | $33,132 |
| Total | 3,589 (100.0%) | $36,242 |
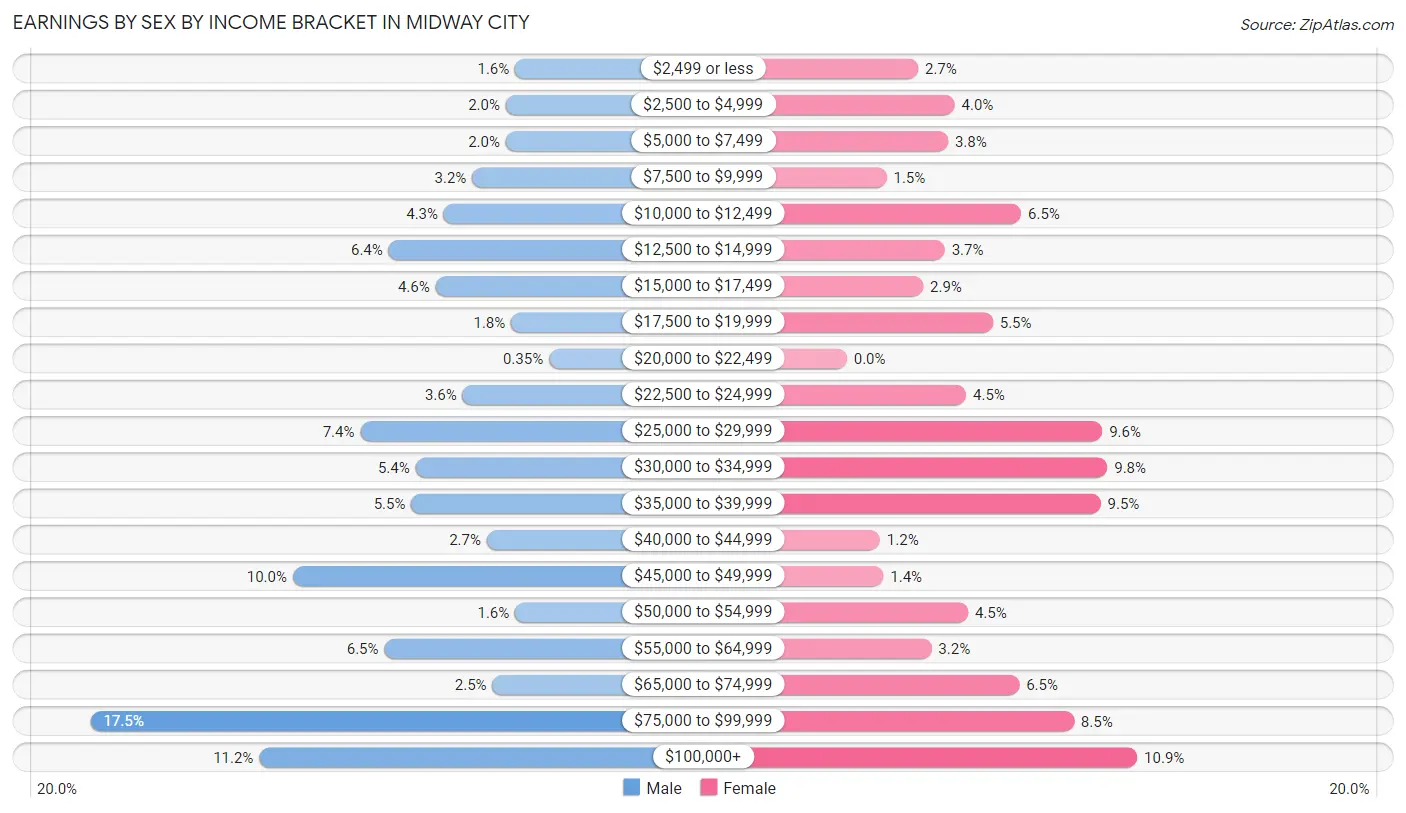
Earnings by Sex by Income Bracket in Midway City
The most common earnings brackets in Midway City are $75,000 to $99,999 for men (347 | 17.5%) and $100,000+ for women (175 | 10.9%).
| Income | Male | Female |
| $2,499 or less | 32 (1.6%) | 43 (2.7%) |
| $2,500 to $4,999 | 39 (2.0%) | 65 (4.0%) |
| $5,000 to $7,499 | 39 (2.0%) | 61 (3.8%) |
| $7,500 to $9,999 | 64 (3.2%) | 24 (1.5%) |
| $10,000 to $12,499 | 85 (4.3%) | 105 (6.5%) |
| $12,500 to $14,999 | 126 (6.4%) | 59 (3.7%) |
| $15,000 to $17,499 | 91 (4.6%) | 46 (2.9%) |
| $17,500 to $19,999 | 35 (1.8%) | 88 (5.5%) |
| $20,000 to $22,499 | 7 (0.4%) | 0 (0.0%) |
| $22,500 to $24,999 | 71 (3.6%) | 72 (4.5%) |
| $25,000 to $29,999 | 147 (7.4%) | 154 (9.6%) |
| $30,000 to $34,999 | 106 (5.3%) | 157 (9.8%) |
| $35,000 to $39,999 | 109 (5.5%) | 153 (9.5%) |
| $40,000 to $44,999 | 53 (2.7%) | 20 (1.2%) |
| $45,000 to $49,999 | 197 (10.0%) | 22 (1.4%) |
| $50,000 to $54,999 | 32 (1.6%) | 73 (4.5%) |
| $55,000 to $64,999 | 129 (6.5%) | 51 (3.2%) |
| $65,000 to $74,999 | 49 (2.5%) | 104 (6.5%) |
| $75,000 to $99,999 | 347 (17.5%) | 137 (8.5%) |
| $100,000+ | 222 (11.2%) | 175 (10.9%) |
| Total | 1,980 (100.0%) | 1,609 (100.0%) |
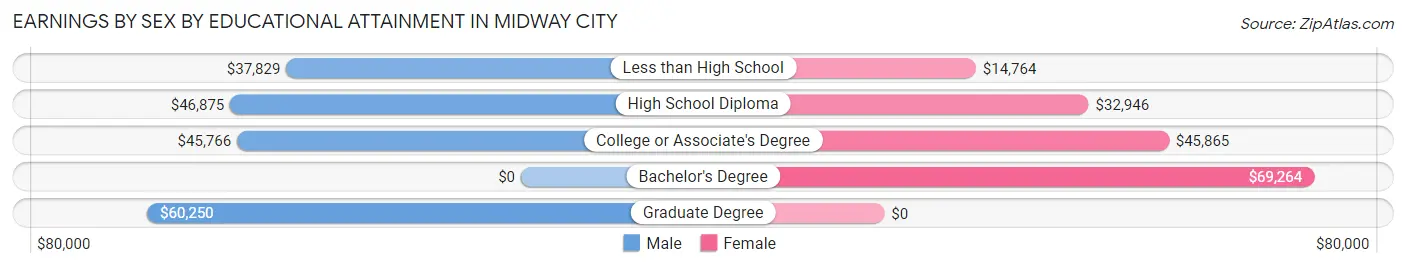
Earnings by Sex by Educational Attainment in Midway City
Average earnings in Midway City are $45,541 for men and $34,785 for women, a difference of 23.6%. Men with an educational attainment of graduate degree enjoy the highest average annual earnings of $60,250, while those with less than high school education earn the least with $37,829. Women with an educational attainment of bachelor's degree earn the most with the average annual earnings of $69,264, while those with less than high school education have the smallest earnings of $14,764.
| Educational Attainment | Male Income | Female Income |
| Less than High School | $37,829 | $14,764 |
| High School Diploma | $46,875 | $32,946 |
| College or Associate's Degree | $45,766 | $45,865 |
| Bachelor's Degree | - | - |
| Graduate Degree | $60,250 | $0 |
| Total | $45,541 | $34,785 |
Family Income in Midway City
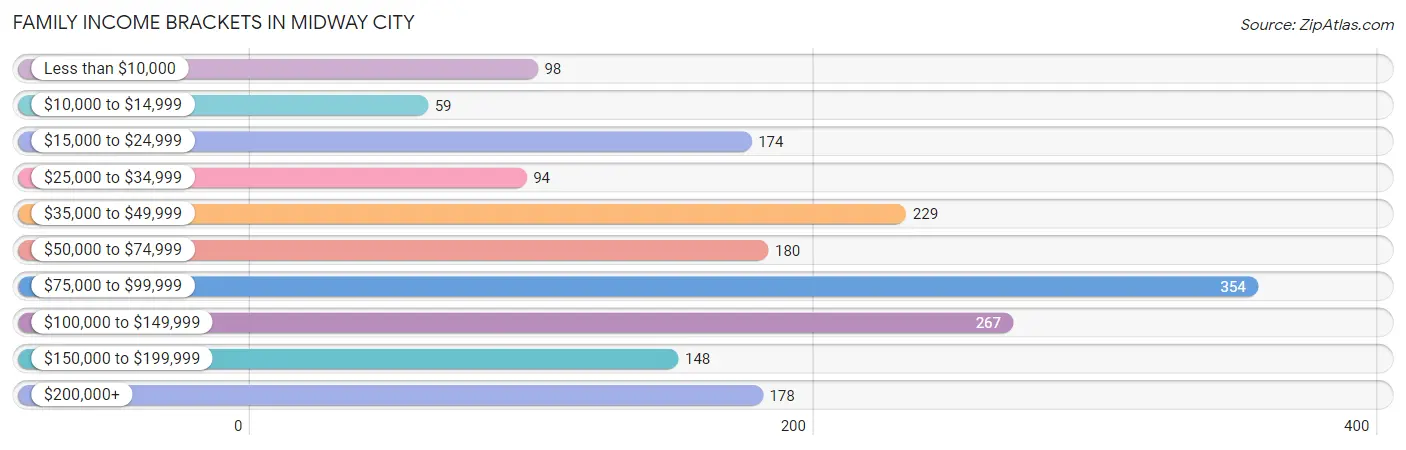
Family Income Brackets in Midway City
According to the Midway City family income data, there are 354 families falling into the $75,000 to $99,999 income range, which is the most common income bracket and makes up 19.9% of all families. Conversely, the $10,000 to $14,999 income bracket is the least frequent group with only 59 families (3.3%) belonging to this category.
| Income Bracket | # Families | % Families |
| Less than $10,000 | 98 | 5.5% |
| $10,000 to $14,999 | 59 | 3.3% |
| $15,000 to $24,999 | 174 | 9.8% |
| $25,000 to $34,999 | 94 | 5.3% |
| $35,000 to $49,999 | 229 | 12.9% |
| $50,000 to $74,999 | 180 | 10.1% |
| $75,000 to $99,999 | 354 | 19.9% |
| $100,000 to $149,999 | 267 | 15.0% |
| $150,000 to $199,999 | 148 | 8.3% |
| $200,000+ | 178 | 10.0% |
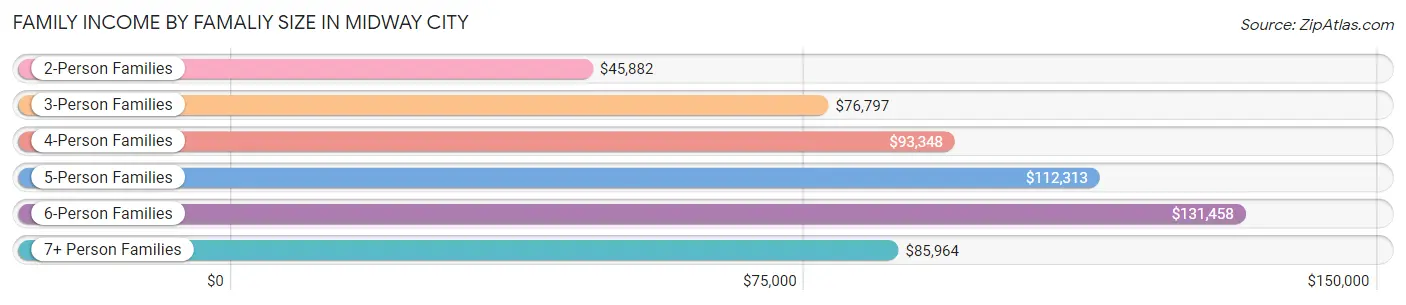
Family Income by Famaliy Size in Midway City
6-person families (42 | 2.4%) account for the highest median family income in Midway City with $131,458 per family, while 3-person families (440 | 24.7%) have the highest median income of $25,599 per family member.
| Income Bracket | # Families | Median Income |
| 2-Person Families | 620 (34.9%) | $45,882 |
| 3-Person Families | 440 (24.7%) | $76,797 |
| 4-Person Families | 318 (17.9%) | $93,348 |
| 5-Person Families | 261 (14.7%) | $112,313 |
| 6-Person Families | 42 (2.4%) | $131,458 |
| 7+ Person Families | 97 (5.5%) | $85,964 |
| Total | 1,778 (100.0%) | $78,807 |
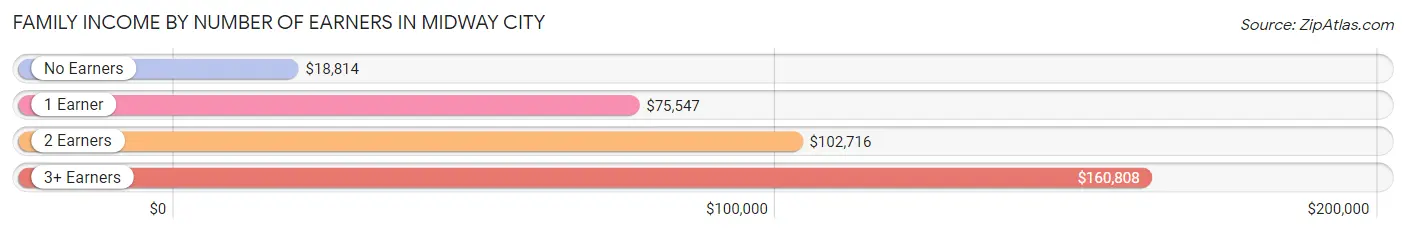
Family Income by Number of Earners in Midway City
The median family income in Midway City is $78,807, with families comprising 3+ earners (267) having the highest median family income of $160,808, while families with no earners (308) have the lowest median family income of $18,814, accounting for 15.0% and 17.3% of families, respectively.
| Number of Earners | # Families | Median Income |
| No Earners | 308 (17.3%) | $18,814 |
| 1 Earner | 552 (31.0%) | $75,547 |
| 2 Earners | 651 (36.6%) | $102,716 |
| 3+ Earners | 267 (15.0%) | $160,808 |
| Total | 1,778 (100.0%) | $78,807 |
Household Income in Midway City
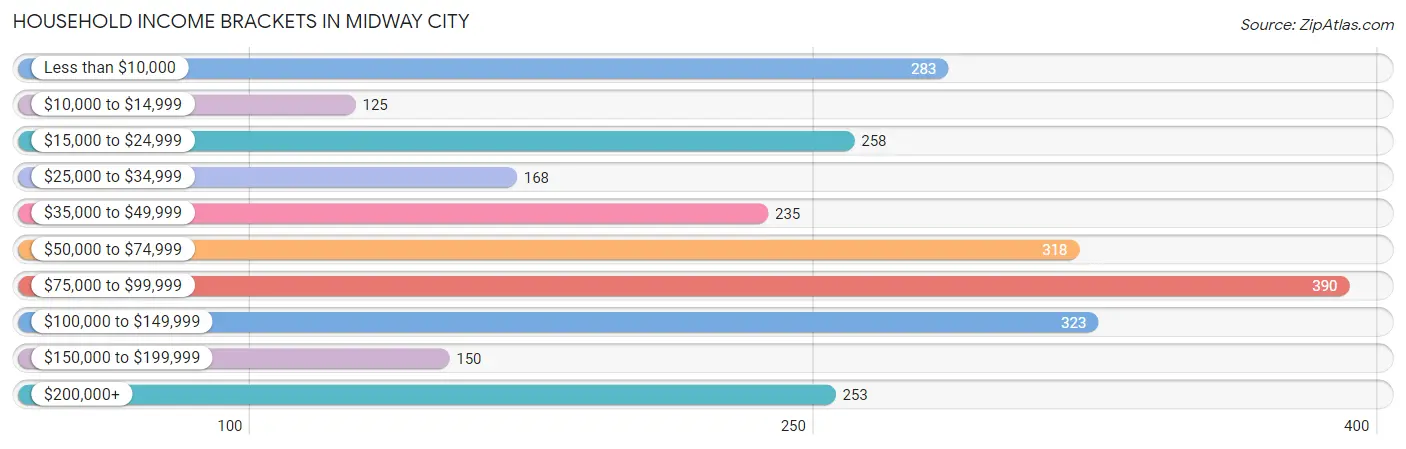
Household Income Brackets in Midway City
With 390 households falling in the category, the $75,000 to $99,999 income range is the most frequent in Midway City, accounting for 15.6% of all households. In contrast, only 125 households (5.0%) fall into the $10,000 to $14,999 income bracket, making it the least populous group.
| Income Bracket | # Households | % Households |
| Less than $10,000 | 283 | 11.3% |
| $10,000 to $14,999 | 125 | 5.0% |
| $15,000 to $24,999 | 258 | 10.3% |
| $25,000 to $34,999 | 168 | 6.7% |
| $35,000 to $49,999 | 235 | 9.4% |
| $50,000 to $74,999 | 318 | 12.7% |
| $75,000 to $99,999 | 390 | 15.6% |
| $100,000 to $149,999 | 323 | 12.9% |
| $150,000 to $199,999 | 150 | 6.0% |
| $200,000+ | 253 | 10.1% |
Household Income by Householder Age in Midway City
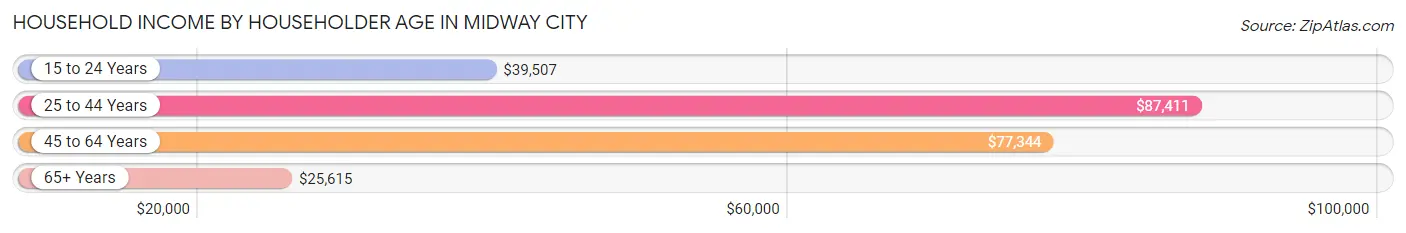
The median household income in Midway City is $62,176, with the highest median household income of $87,411 found in the 25 to 44 years age bracket for the primary householder. A total of 663 households (26.5%) fall into this category. Meanwhile, the 65+ years age bracket for the primary householder has the lowest median household income of $25,615, with 638 households (25.5%) in this group.
| Income Bracket | # Households | Median Income |
| 15 to 24 Years | 103 (4.1%) | $39,507 |
| 25 to 44 Years | 663 (26.5%) | $87,411 |
| 45 to 64 Years | 1,098 (43.9%) | $77,344 |
| 65+ Years | 638 (25.5%) | $25,615 |
| Total | 2,502 (100.0%) | $62,176 |
Poverty in Midway City
Income Below Poverty by Sex and Age in Midway City
With 18.0% poverty level for males and 17.9% for females among the residents of Midway City, 12 to 14 year old males and 15 year old females are the most vulnerable to poverty, with 92 males (54.8%) and 10 females (40.0%) in their respective age groups living below the poverty level.
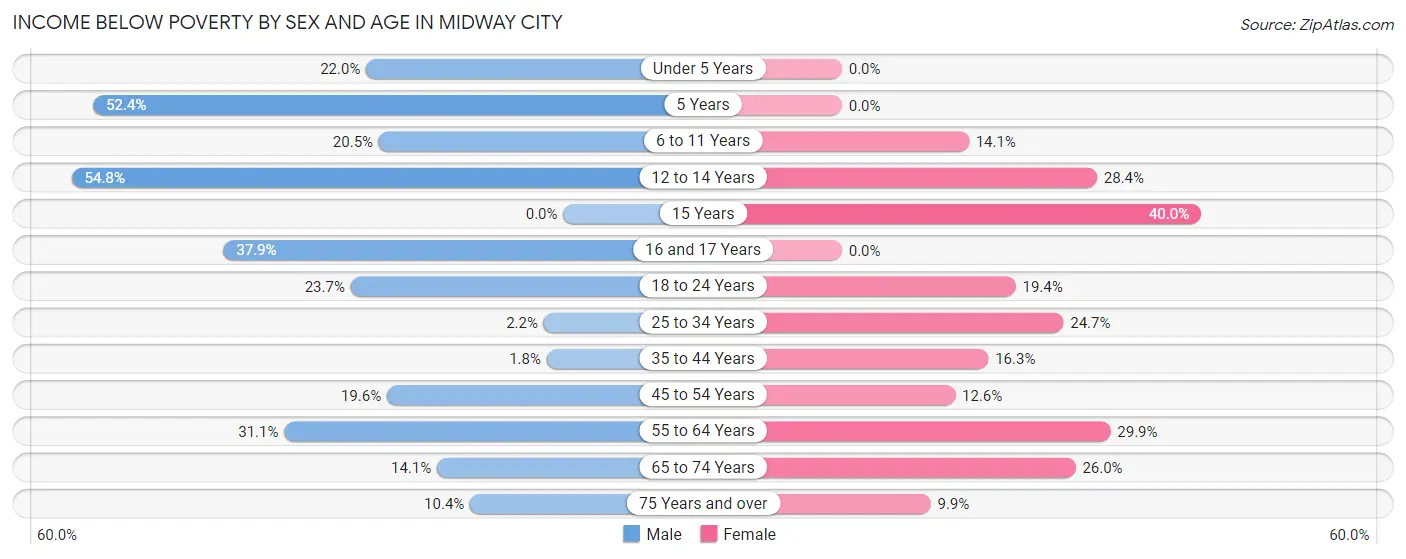
| Age Bracket | Male | Female |
| Under 5 Years | 54 (22.0%) | 0 (0.0%) |
| 5 Years | 11 (52.4%) | 0 (0.0%) |
| 6 to 11 Years | 69 (20.5%) | 39 (14.1%) |
| 12 to 14 Years | 92 (54.8%) | 48 (28.4%) |
| 15 Years | 0 (0.0%) | 10 (40.0%) |
| 16 and 17 Years | 39 (37.9%) | 0 (0.0%) |
| 18 to 24 Years | 63 (23.7%) | 77 (19.4%) |
| 25 to 34 Years | 13 (2.2%) | 113 (24.7%) |
| 35 to 44 Years | 9 (1.8%) | 69 (16.3%) |
| 45 to 54 Years | 131 (19.6%) | 95 (12.6%) |
| 55 to 64 Years | 193 (31.1%) | 128 (29.9%) |
| 65 to 74 Years | 28 (14.1%) | 89 (26.0%) |
| 75 Years and over | 30 (10.4%) | 33 (9.9%) |
| Total | 732 (18.0%) | 701 (17.9%) |
Income Above Poverty by Sex and Age in Midway City
According to the poverty statistics in Midway City, males aged 15 years and females aged under 5 years are the age groups that are most secure financially, with 100.0% of males and 100.0% of females in these age groups living above the poverty line.
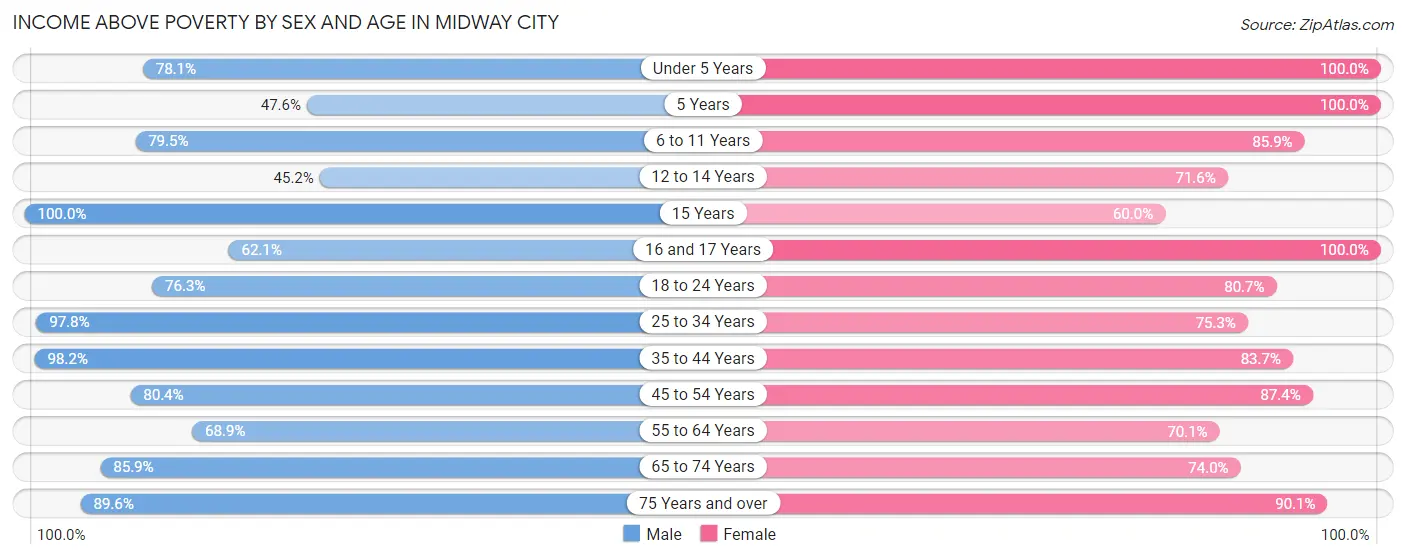
| Age Bracket | Male | Female |
| Under 5 Years | 192 (78.0%) | 72 (100.0%) |
| 5 Years | 10 (47.6%) | 93 (100.0%) |
| 6 to 11 Years | 267 (79.5%) | 237 (85.9%) |
| 12 to 14 Years | 76 (45.2%) | 121 (71.6%) |
| 15 Years | 69 (100.0%) | 15 (60.0%) |
| 16 and 17 Years | 64 (62.1%) | 140 (100.0%) |
| 18 to 24 Years | 203 (76.3%) | 321 (80.6%) |
| 25 to 34 Years | 584 (97.8%) | 345 (75.3%) |
| 35 to 44 Years | 479 (98.2%) | 354 (83.7%) |
| 45 to 54 Years | 536 (80.4%) | 658 (87.4%) |
| 55 to 64 Years | 428 (68.9%) | 300 (70.1%) |
| 65 to 74 Years | 171 (85.9%) | 253 (74.0%) |
| 75 Years and over | 259 (89.6%) | 301 (90.1%) |
| Total | 3,338 (82.0%) | 3,210 (82.1%) |
Income Below Poverty Among Married-Couple Families in Midway City
The poverty statistics for married-couple families in Midway City show that 10.1% or 109 of the total 1,080 families live below the poverty line. Families with 3 or 4 children have the highest poverty rate of 20.2%, comprising of 24 families. On the other hand, families with 5 or more children have the lowest poverty rate of 0.0%, which includes 0 families.
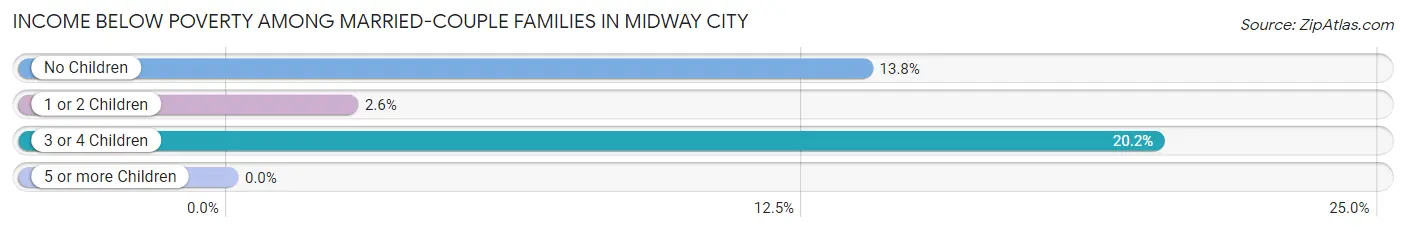
| Children | Above Poverty | Below Poverty |
| No Children | 468 (86.2%) | 75 (13.8%) |
| 1 or 2 Children | 373 (97.4%) | 10 (2.6%) |
| 3 or 4 Children | 95 (79.8%) | 24 (20.2%) |
| 5 or more Children | 35 (100.0%) | 0 (0.0%) |
| Total | 971 (89.9%) | 109 (10.1%) |
Income Below Poverty Among Single-Parent Households in Midway City
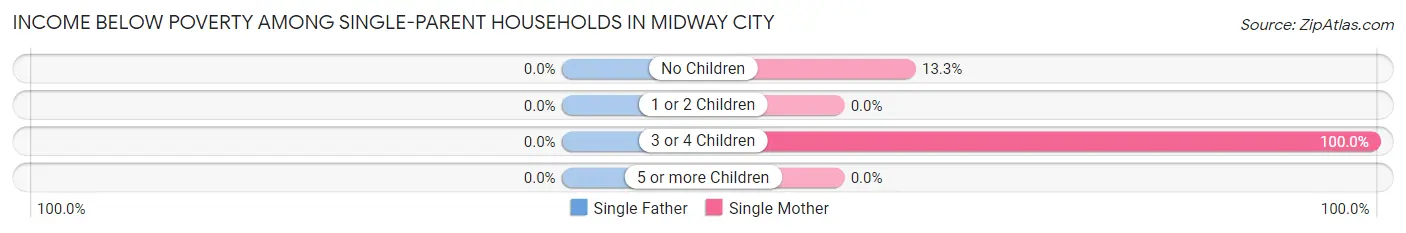
| Children | Single Father | Single Mother |
| No Children | 0 (0.0%) | 31 (13.3%) |
| 1 or 2 Children | 0 (0.0%) | 0 (0.0%) |
| 3 or 4 Children | 0 (0.0%) | 80 (100.0%) |
| 5 or more Children | 0 (0.0%) | 0 (0.0%) |
| Total | 0 (0.0%) | 111 (27.8%) |
Income Below Poverty Among Married-Couple vs Single-Parent Households in Midway City
The poverty data for Midway City shows that 109 of the married-couple family households (10.1%) and 111 of the single-parent households (15.9%) are living below the poverty level. Within the married-couple family households, those with 3 or 4 children have the highest poverty rate, with 24 households (20.2%) falling below the poverty line. Among the single-parent households, those with 3 or 4 children have the highest poverty rate, with 80 household (69.6%) living below poverty.
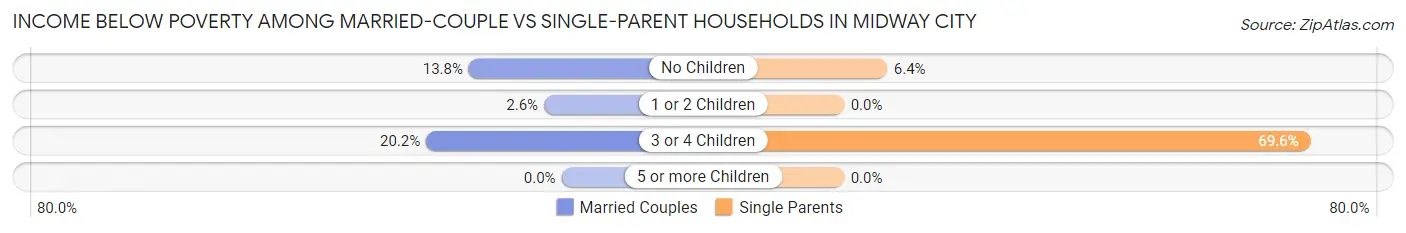
| Children | Married-Couple Families | Single-Parent Households |
| No Children | 75 (13.8%) | 31 (6.4%) |
| 1 or 2 Children | 10 (2.6%) | 0 (0.0%) |
| 3 or 4 Children | 24 (20.2%) | 80 (69.6%) |
| 5 or more Children | 0 (0.0%) | 0 (0.0%) |
| Total | 109 (10.1%) | 111 (15.9%) |
Race in Midway City
The most populous races in Midway City are Asian (3,518 | 43.8%), Hispanic or Latino (2,832 | 35.3%), and White / Caucasian (2,123 | 26.4%).
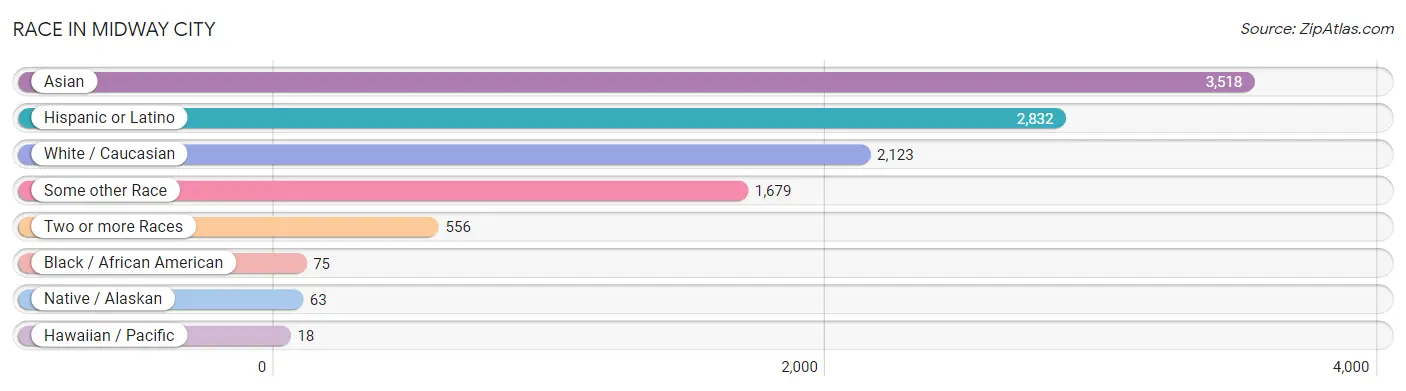
| Race | # Population | % Population |
| Asian | 3,518 | 43.8% |
| Black / African American | 75 | 0.9% |
| Hawaiian / Pacific | 18 | 0.2% |
| Hispanic or Latino | 2,832 | 35.3% |
| Native / Alaskan | 63 | 0.8% |
| White / Caucasian | 2,123 | 26.4% |
| Two or more Races | 556 | 6.9% |
| Some other Race | 1,679 | 20.9% |
| Total | 8,032 | 100.0% |
Ancestry in Midway City
The most populous ancestries reported in Midway City are Sri Lankan (3,216 | 40.0%), Mexican (2,800 | 34.9%), English (210 | 2.6%), German (201 | 2.5%), and Indian (Asian) (197 | 2.5%), together accounting for 82.5% of all Midway City residents.
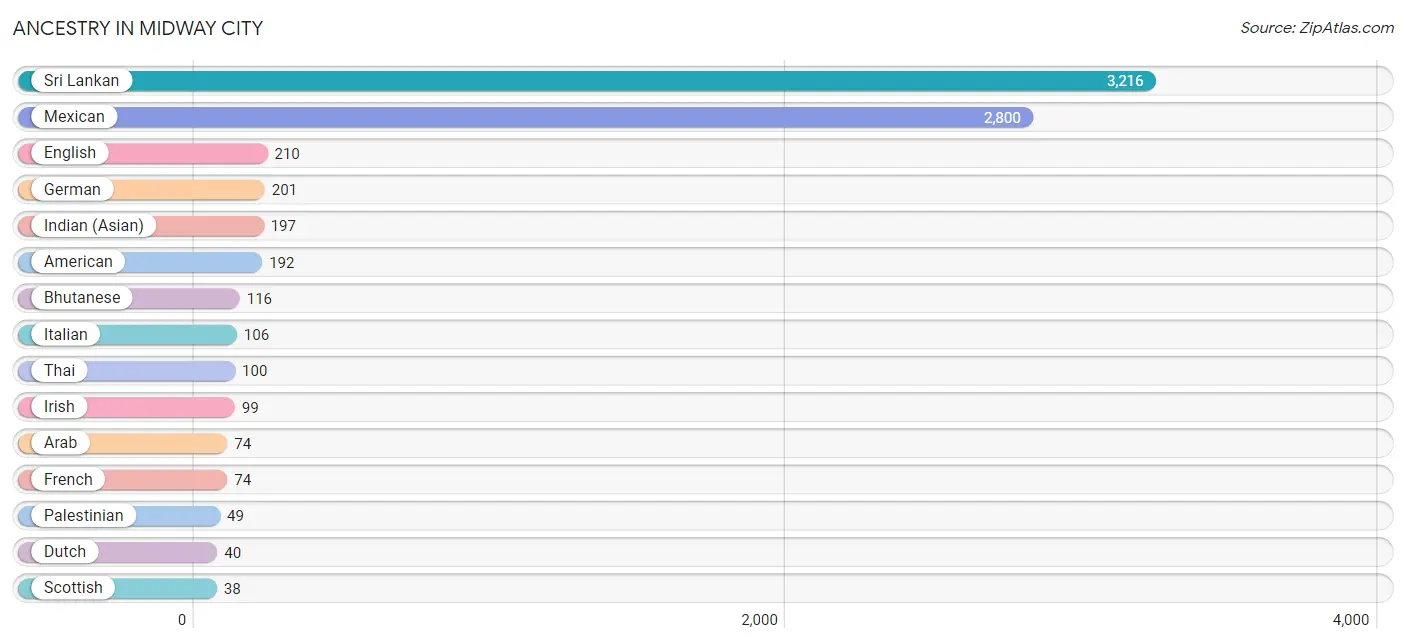
| Ancestry | # Population | % Population |
| American | 192 | 2.4% |
| Arab | 74 | 0.9% |
| Bhutanese | 116 | 1.4% |
| Brazilian | 26 | 0.3% |
| Burmese | 37 | 0.5% |
| Canadian | 13 | 0.2% |
| Central American | 7 | 0.1% |
| Dutch | 40 | 0.5% |
| English | 210 | 2.6% |
| European | 21 | 0.3% |
| French | 74 | 0.9% |
| French Canadian | 18 | 0.2% |
| German | 201 | 2.5% |
| Indian (Asian) | 197 | 2.5% |
| Iranian | 6 | 0.1% |
| Irish | 99 | 1.2% |
| Italian | 106 | 1.3% |
| Jordanian | 9 | 0.1% |
| Korean | 26 | 0.3% |
| Lebanese | 10 | 0.1% |
| Mexican | 2,800 | 34.9% |
| Palestinian | 49 | 0.6% |
| Portuguese | 26 | 0.3% |
| Puerto Rican | 3 | 0.0% |
| Salvadoran | 7 | 0.1% |
| Samoan | 18 | 0.2% |
| Scotch-Irish | 31 | 0.4% |
| Scottish | 38 | 0.5% |
| Spanish | 11 | 0.1% |
| Sri Lankan | 3,216 | 40.0% |
| Swiss | 6 | 0.1% |
| Thai | 100 | 1.3% | View All 32 Rows |
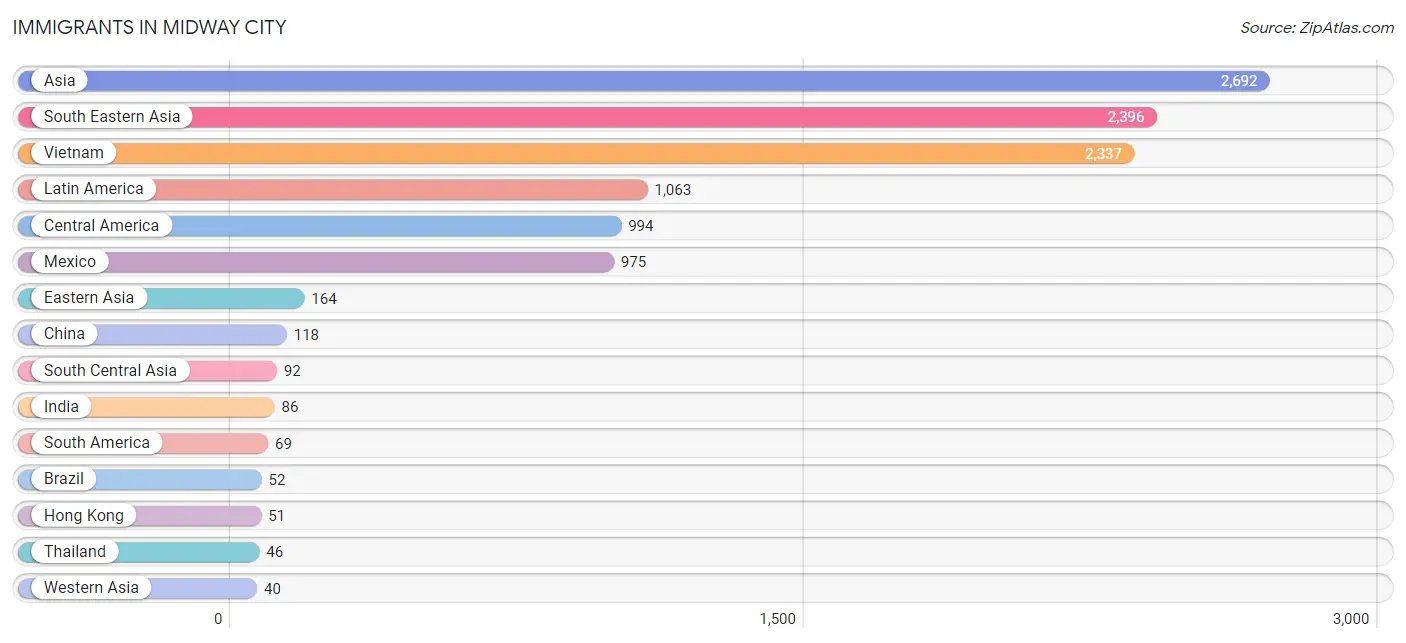
Immigrants in Midway City
The most numerous immigrant groups reported in Midway City came from Asia (2,692 | 33.5%), South Eastern Asia (2,396 | 29.8%), Vietnam (2,337 | 29.1%), Latin America (1,063 | 13.2%), and Central America (994 | 12.4%), together accounting for 118.1% of all Midway City residents.
| Immigration Origin | # Population | % Population |
| Asia | 2,692 | 33.5% |
| Australia | 25 | 0.3% |
| Brazil | 52 | 0.6% |
| Cambodia | 13 | 0.2% |
| Canada | 20 | 0.3% |
| Central America | 994 | 12.4% |
| China | 118 | 1.5% |
| Colombia | 17 | 0.2% |
| Eastern Asia | 164 | 2.0% |
| El Salvador | 7 | 0.1% |
| Europe | 32 | 0.4% |
| Germany | 16 | 0.2% |
| Hong Kong | 51 | 0.6% |
| India | 86 | 1.1% |
| Iran | 6 | 0.1% |
| Israel | 12 | 0.2% |
| Japan | 9 | 0.1% |
| Jordan | 28 | 0.4% |
| Korea | 37 | 0.5% |
| Latin America | 1,063 | 13.2% |
| Mexico | 975 | 12.1% |
| Netherlands | 16 | 0.2% |
| Oceania | 25 | 0.3% |
| Panama | 12 | 0.2% |
| South America | 69 | 0.9% |
| South Central Asia | 92 | 1.1% |
| South Eastern Asia | 2,396 | 29.8% |
| Thailand | 46 | 0.6% |
| Vietnam | 2,337 | 29.1% |
| Western Asia | 40 | 0.5% |
| Western Europe | 32 | 0.4% | View All 31 Rows |
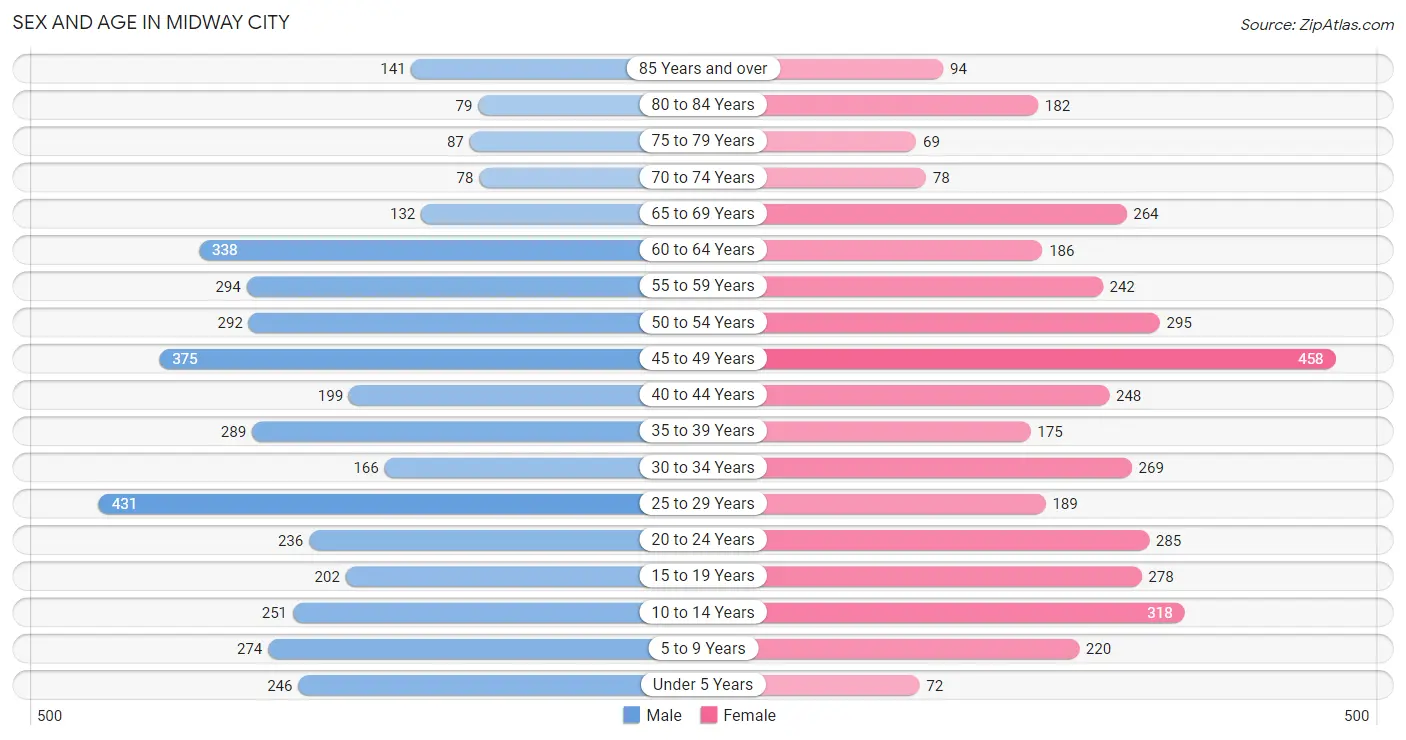
Sex and Age in Midway City
Sex and Age in Midway City
The most populous age groups in Midway City are 25 to 29 Years (431 | 10.5%) for men and 45 to 49 Years (458 | 11.7%) for women.
| Age Bracket | Male | Female |
| Under 5 Years | 246 (6.0%) | 72 (1.8%) |
| 5 to 9 Years | 274 (6.7%) | 220 (5.6%) |
| 10 to 14 Years | 251 (6.1%) | 318 (8.1%) |
| 15 to 19 Years | 202 (4.9%) | 278 (7.1%) |
| 20 to 24 Years | 236 (5.7%) | 285 (7.3%) |
| 25 to 29 Years | 431 (10.5%) | 189 (4.8%) |
| 30 to 34 Years | 166 (4.0%) | 269 (6.9%) |
| 35 to 39 Years | 289 (7.0%) | 175 (4.5%) |
| 40 to 44 Years | 199 (4.8%) | 248 (6.3%) |
| 45 to 49 Years | 375 (9.1%) | 458 (11.7%) |
| 50 to 54 Years | 292 (7.1%) | 295 (7.5%) |
| 55 to 59 Years | 294 (7.1%) | 242 (6.2%) |
| 60 to 64 Years | 338 (8.2%) | 186 (4.7%) |
| 65 to 69 Years | 132 (3.2%) | 264 (6.7%) |
| 70 to 74 Years | 78 (1.9%) | 78 (2.0%) |
| 75 to 79 Years | 87 (2.1%) | 69 (1.8%) |
| 80 to 84 Years | 79 (1.9%) | 182 (4.6%) |
| 85 Years and over | 141 (3.4%) | 94 (2.4%) |
| Total | 4,110 (100.0%) | 3,922 (100.0%) |
Families and Households in Midway City
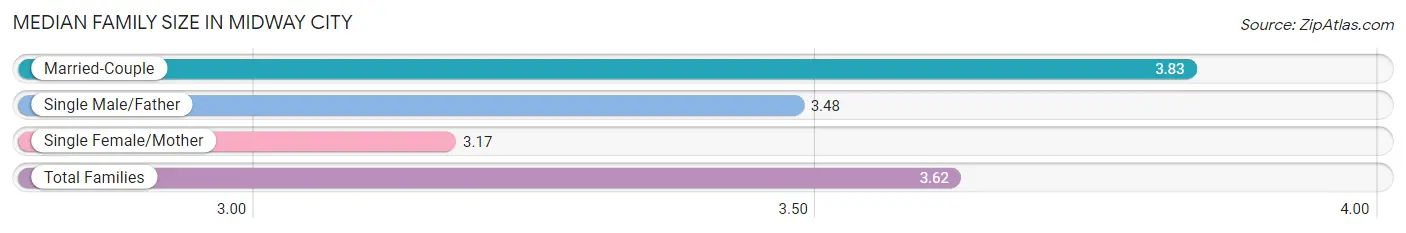
Median Family Size in Midway City
The median family size in Midway City is 3.62 persons per family, with married-couple families (1,080 | 60.7%) accounting for the largest median family size of 3.83 persons per family. On the other hand, single female/mother families (400 | 22.5%) represent the smallest median family size with 3.17 persons per family.
| Family Type | # Families | Family Size |
| Married-Couple | 1,080 (60.7%) | 3.83 |
| Single Male/Father | 298 (16.8%) | 3.48 |
| Single Female/Mother | 400 (22.5%) | 3.17 |
| Total Families | 1,778 (100.0%) | 3.62 |
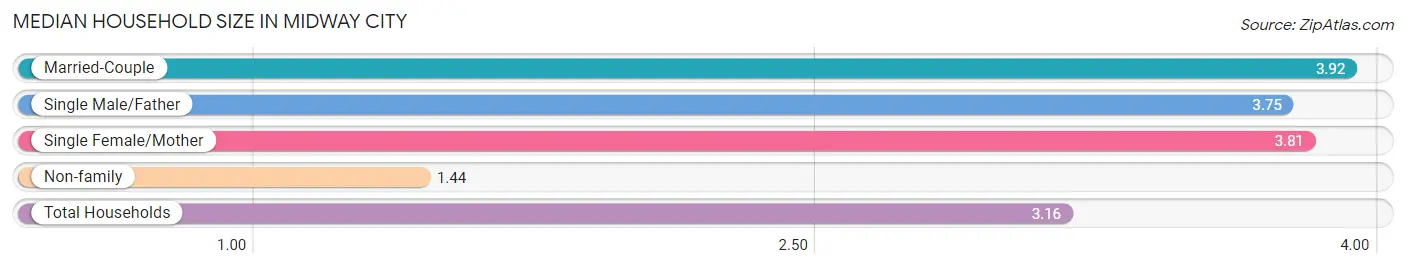
Median Household Size in Midway City
The median household size in Midway City is 3.16 persons per household, with married-couple households (1,080 | 43.2%) accounting for the largest median household size of 3.92 persons per household. non-family households (724 | 28.9%) represent the smallest median household size with 1.44 persons per household.
| Household Type | # Households | Household Size |
| Married-Couple | 1,080 (43.2%) | 3.92 |
| Single Male/Father | 298 (11.9%) | 3.75 |
| Single Female/Mother | 400 (16.0%) | 3.81 |
| Non-family | 724 (28.9%) | 1.44 |
| Total Households | 2,502 (100.0%) | 3.16 |
Household Size by Marriage Status in Midway City
Out of a total of 2,502 households in Midway City, 1,778 (71.1%) are family households, while 724 (28.9%) are nonfamily households. The most numerous type of family households are 2-person households, comprising 507, and the most common type of nonfamily households are 1-person households, comprising 635.
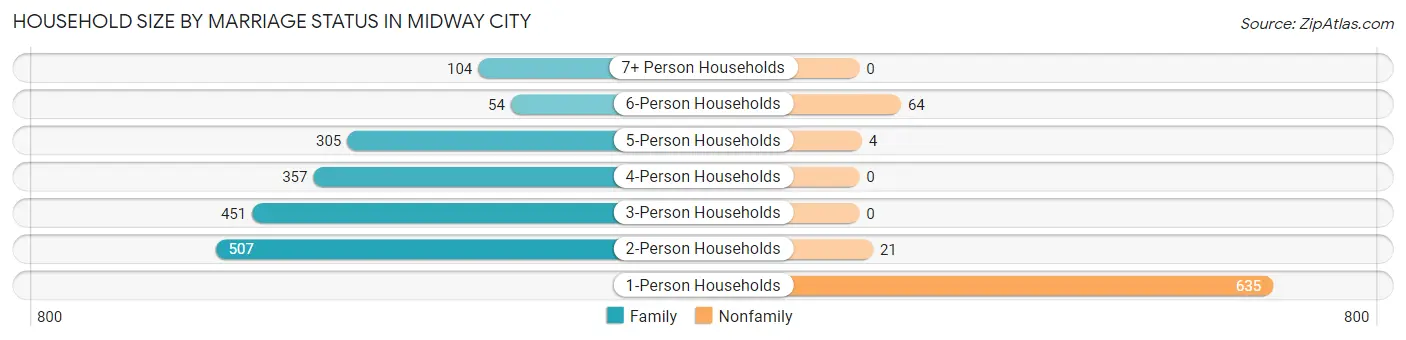
| Household Size | Family Households | Nonfamily Households |
| 1-Person Households | - | 635 (25.4%) |
| 2-Person Households | 507 (20.3%) | 21 (0.8%) |
| 3-Person Households | 451 (18.0%) | 0 (0.0%) |
| 4-Person Households | 357 (14.3%) | 0 (0.0%) |
| 5-Person Households | 305 (12.2%) | 4 (0.2%) |
| 6-Person Households | 54 (2.2%) | 64 (2.6%) |
| 7+ Person Households | 104 (4.2%) | 0 (0.0%) |
| Total | 1,778 (71.1%) | 724 (28.9%) |
Female Fertility in Midway City
Fertility by Age in Midway City
Average fertility rate in Midway City is 26.0 births per 1,000 women. Women in the age bracket of 20 to 34 years have the highest fertility rate with 36.0 births per 1,000 women. Women in the age bracket of 20 to 34 years acount for 54.0% of all women with births.
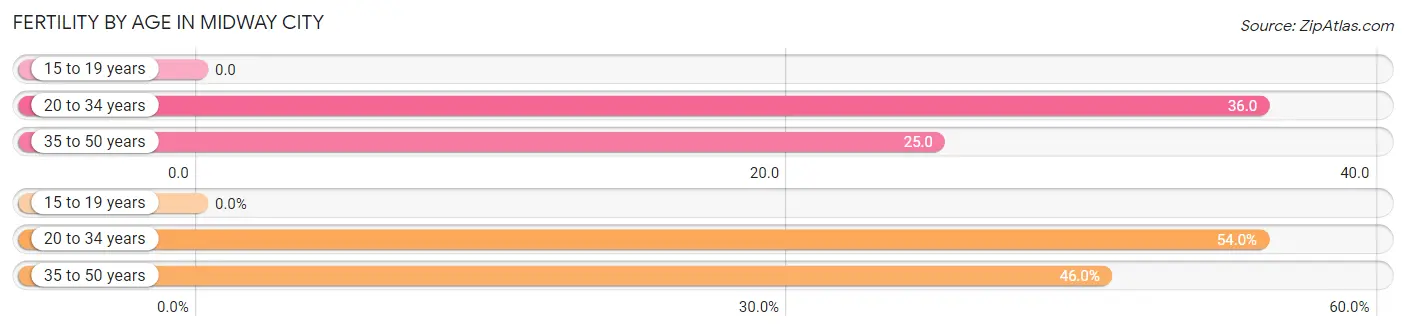
| Age Bracket | Women with Births | Births / 1,000 Women |
| 15 to 19 years | 0 (0.0%) | 0.0 |
| 20 to 34 years | 27 (54.0%) | 36.0 |
| 35 to 50 years | 23 (46.0%) | 25.0 |
| Total | 50 (100.0%) | 26.0 |
Fertility by Age by Marriage Status in Midway City
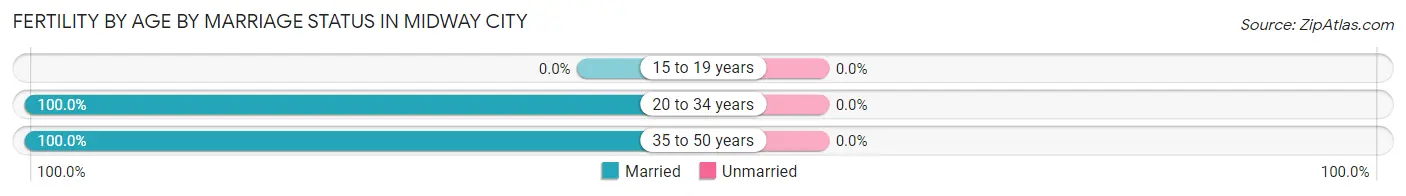
| Age Bracket | Married | Unmarried |
| 15 to 19 years | 0 (0.0%) | 0 (0.0%) |
| 20 to 34 years | 27 (100.0%) | 0 (0.0%) |
| 35 to 50 years | 23 (100.0%) | 0 (0.0%) |
| Total | 50 (100.0%) | 0 (0.0%) |
Fertility by Education in Midway City
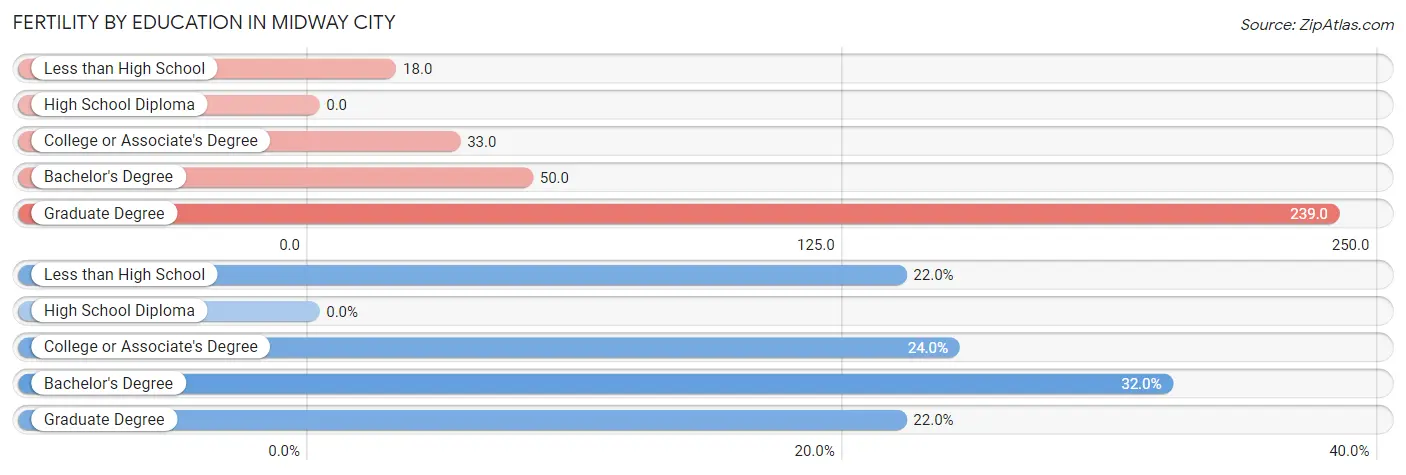
| Educational Attainment | Women with Births | Births / 1,000 Women |
| Less than High School | 11 (22.0%) | 18.0 |
| High School Diploma | 0 (0.0%) | 0.0 |
| College or Associate's Degree | 12 (24.0%) | 33.0 |
| Bachelor's Degree | 16 (32.0%) | 50.0 |
| Graduate Degree | 11 (22.0%) | 239.0 |
| Total | 50 (100.0%) | 26.0 |
Fertility by Education by Marriage Status in Midway City
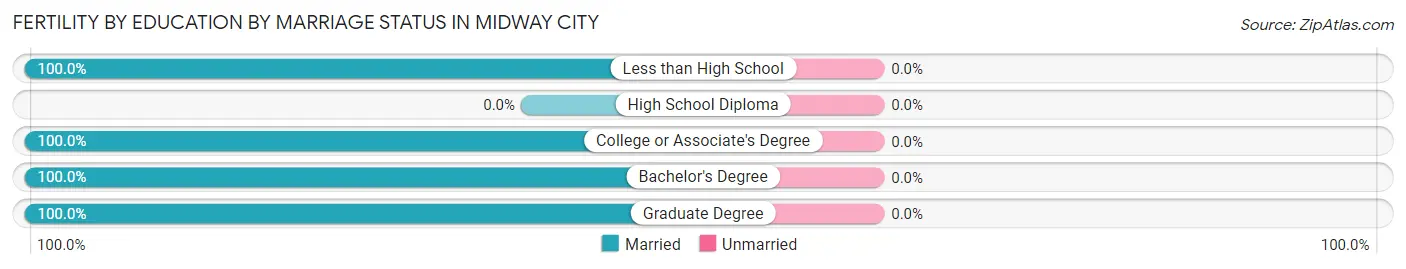
| Educational Attainment | Married | Unmarried |
| Less than High School | 11 (100.0%) | 0 (0.0%) |
| High School Diploma | 0 (0.0%) | 0 (0.0%) |
| College or Associate's Degree | 12 (100.0%) | 0 (0.0%) |
| Bachelor's Degree | 16 (100.0%) | 0 (0.0%) |
| Graduate Degree | 11 (100.0%) | 0 (0.0%) |
| Total | 50 (100.0%) | 0 (0.0%) |
Employment Characteristics in Midway City
Employment by Class of Employer in Midway City
Among the 3,290 employed individuals in Midway City, private company employees (2,409 | 73.2%), self-employed (not incorporated) (235 | 7.1%), and local government employees (197 | 6.0%) make up the most common classes of employment.
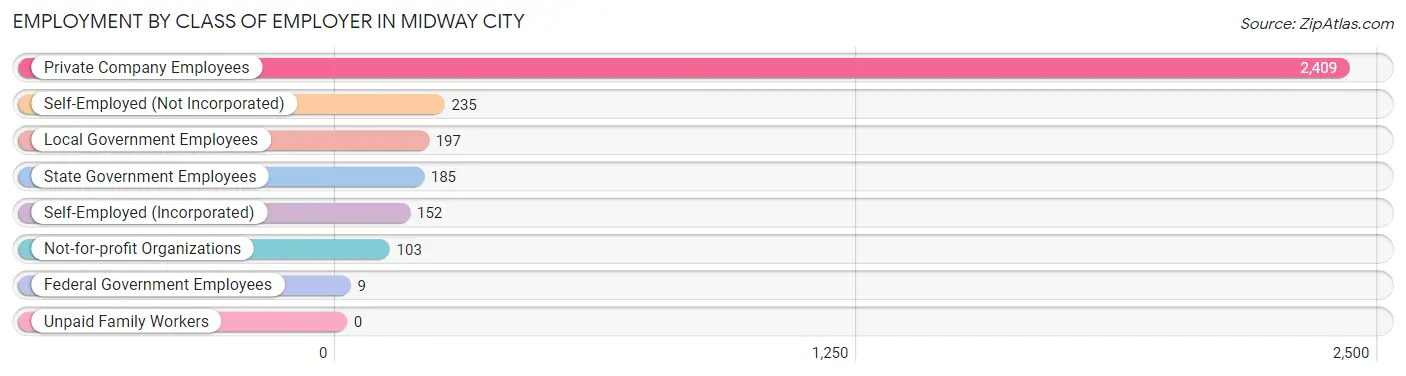
| Employer Class | # Employees | % Employees |
| Private Company Employees | 2,409 | 73.2% |
| Self-Employed (Incorporated) | 152 | 4.6% |
| Self-Employed (Not Incorporated) | 235 | 7.1% |
| Not-for-profit Organizations | 103 | 3.1% |
| Local Government Employees | 197 | 6.0% |
| State Government Employees | 185 | 5.6% |
| Federal Government Employees | 9 | 0.3% |
| Unpaid Family Workers | 0 | 0.0% |
| Total | 3,290 | 100.0% |
Employment Status by Age in Midway City
According to the labor force statistics for Midway City, out of the total population over 16 years of age (6,557), 56.7% or 3,718 individuals are in the labor force, with 8.9% or 331 of them unemployed. The age group with the highest labor force participation rate is 25 to 29 years, with 89.4% or 554 individuals in the labor force. Within the labor force, the 16 to 19 years age range has the highest percentage of unemployed individuals, with 49.3% or 35 of them being unemployed.
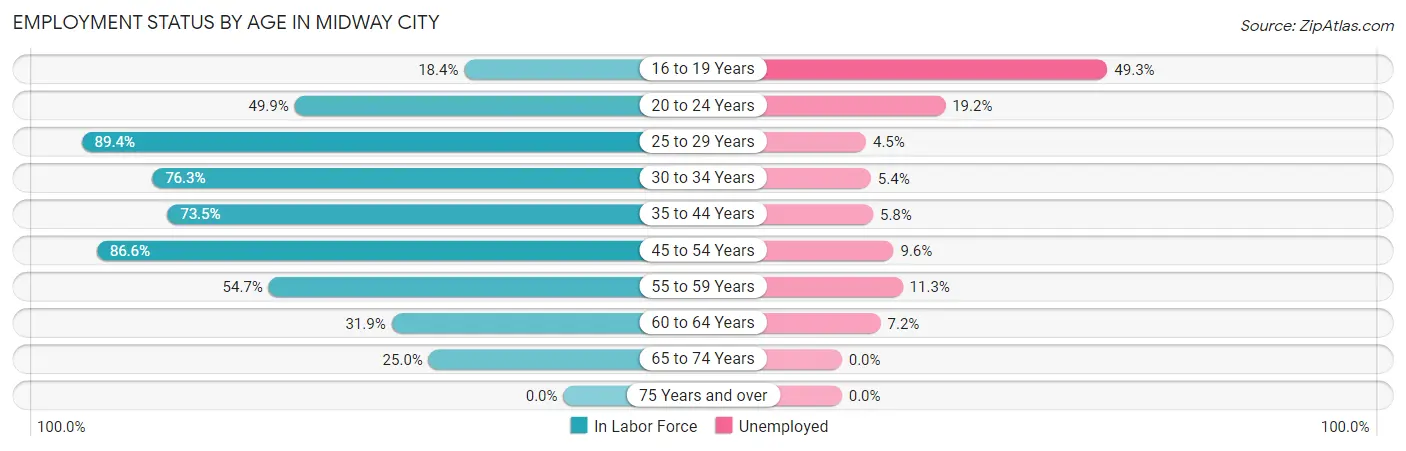
| Age Bracket | In Labor Force | Unemployed |
| 16 to 19 Years | 71 (18.4%) | 35 (49.3%) |
| 20 to 24 Years | 260 (49.9%) | 50 (19.2%) |
| 25 to 29 Years | 554 (89.4%) | 25 (4.5%) |
| 30 to 34 Years | 332 (76.3%) | 18 (5.4%) |
| 35 to 44 Years | 670 (73.5%) | 39 (5.8%) |
| 45 to 54 Years | 1,230 (86.6%) | 118 (9.6%) |
| 55 to 59 Years | 293 (54.7%) | 33 (11.3%) |
| 60 to 64 Years | 167 (31.9%) | 12 (7.2%) |
| 65 to 74 Years | 138 (25.0%) | 0 (0.0%) |
| 75 Years and over | 0 (0.0%) | 0 (0.0%) |
| Total | 3,718 (56.7%) | 331 (8.9%) |
Employment Status by Educational Attainment in Midway City
According to labor force statistics for Midway City, 73.0% of individuals (3,246) out of the total population between 25 and 64 years of age (4,446) are in the labor force, with 7.5% or 243 of them being unemployed. The group with the highest labor force participation rate are those with the educational attainment of college / associate degree, with 84.7% or 948 individuals in the labor force. Within the labor force, individuals with college / associate degree education have the highest percentage of unemployment, with 10.9% or 103 of them being unemployed.
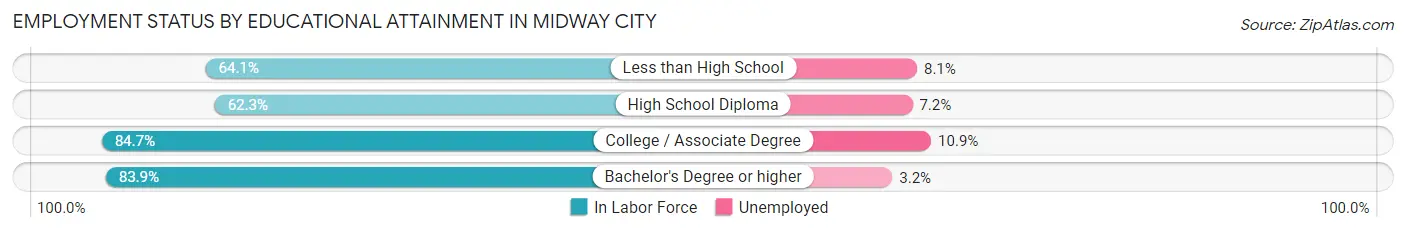
| Educational Attainment | In Labor Force | Unemployed |
| Less than High School | 837 (64.1%) | 106 (8.1%) |
| High School Diploma | 676 (62.3%) | 78 (7.2%) |
| College / Associate Degree | 948 (84.7%) | 122 (10.9%) |
| Bachelor's Degree or higher | 786 (83.9%) | 30 (3.2%) |
| Total | 3,246 (73.0%) | 333 (7.5%) |
Employment Occupations by Sex in Midway City
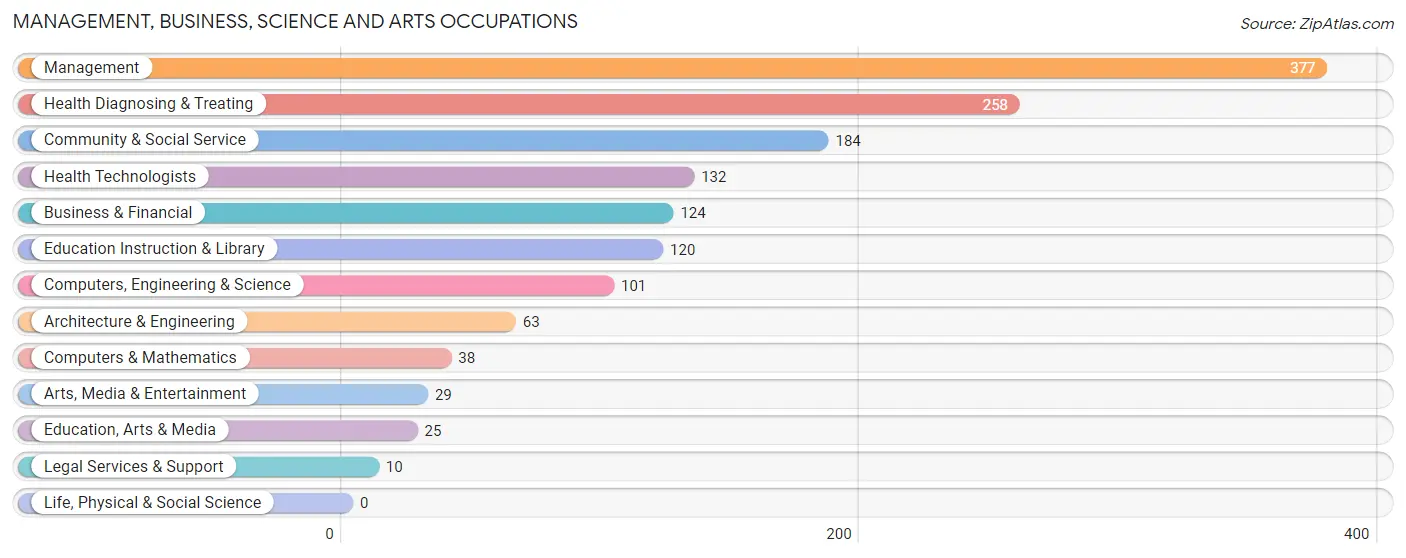
Management, Business, Science and Arts Occupations
The most common Management, Business, Science and Arts occupations in Midway City are Management (377 | 11.1%), Health Diagnosing & Treating (258 | 7.6%), Community & Social Service (184 | 5.4%), Health Technologists (132 | 3.9%), and Business & Financial (124 | 3.7%).
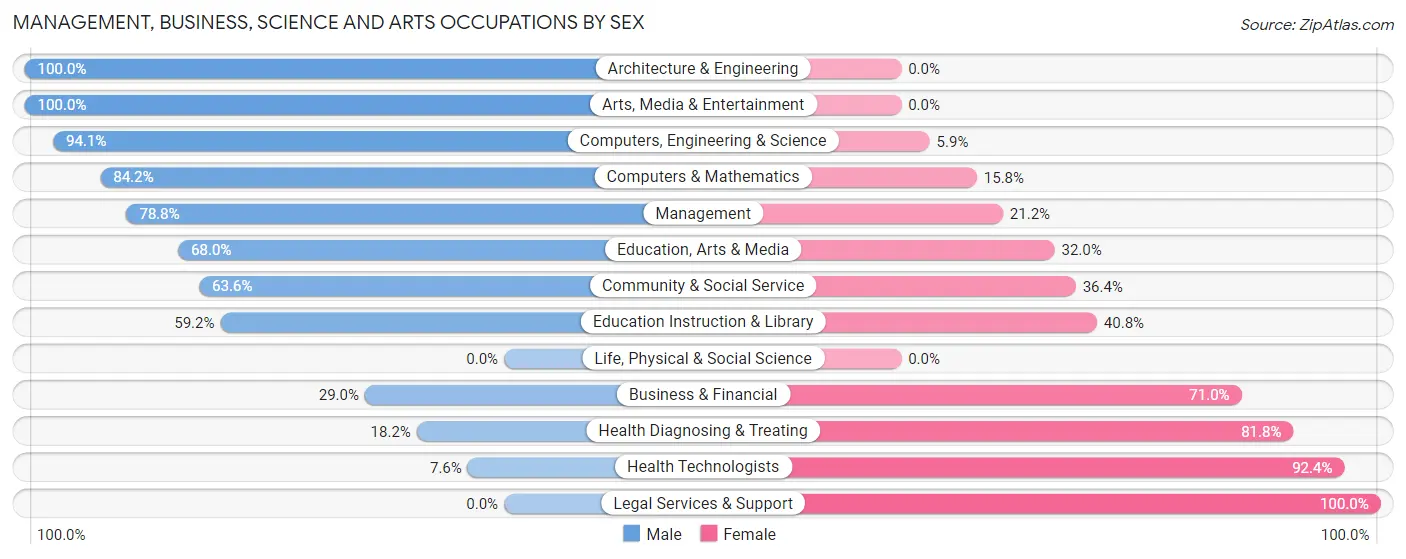
Management, Business, Science and Arts Occupations by Sex
Within the Management, Business, Science and Arts occupations in Midway City, the most male-oriented occupations are Architecture & Engineering (100.0%), Arts, Media & Entertainment (100.0%), and Computers, Engineering & Science (94.1%), while the most female-oriented occupations are Legal Services & Support (100.0%), Health Technologists (92.4%), and Health Diagnosing & Treating (81.8%).
| Occupation | Male | Female |
| Management | 297 (78.8%) | 80 (21.2%) |
| Business & Financial | 36 (29.0%) | 88 (71.0%) |
| Computers, Engineering & Science | 95 (94.1%) | 6 (5.9%) |
| Computers & Mathematics | 32 (84.2%) | 6 (15.8%) |
| Architecture & Engineering | 63 (100.0%) | 0 (0.0%) |
| Life, Physical & Social Science | 0 (0.0%) | 0 (0.0%) |
| Community & Social Service | 117 (63.6%) | 67 (36.4%) |
| Education, Arts & Media | 17 (68.0%) | 8 (32.0%) |
| Legal Services & Support | 0 (0.0%) | 10 (100.0%) |
| Education Instruction & Library | 71 (59.2%) | 49 (40.8%) |
| Arts, Media & Entertainment | 29 (100.0%) | 0 (0.0%) |
| Health Diagnosing & Treating | 47 (18.2%) | 211 (81.8%) |
| Health Technologists | 10 (7.6%) | 122 (92.4%) |
| Total (Category) | 592 (56.7%) | 452 (43.3%) |
| Total (Overall) | 1,890 (55.8%) | 1,495 (44.2%) |
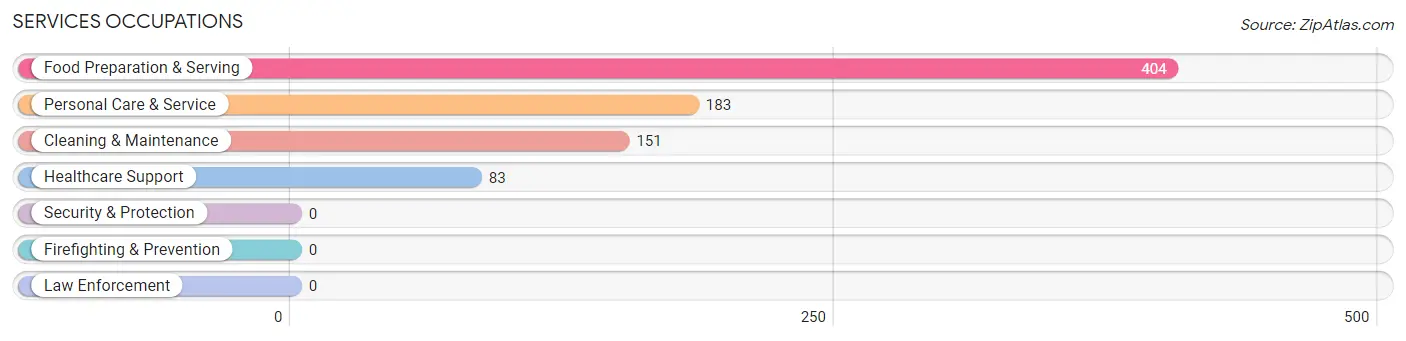
Services Occupations
The most common Services occupations in Midway City are Food Preparation & Serving (404 | 11.9%), Personal Care & Service (183 | 5.4%), Cleaning & Maintenance (151 | 4.5%), and Healthcare Support (83 | 2.5%).
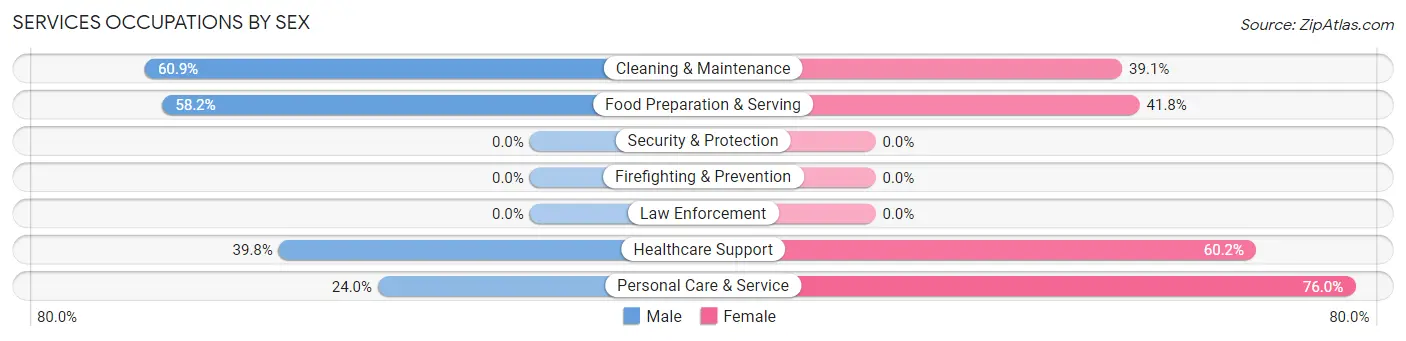
Services Occupations by Sex
Within the Services occupations in Midway City, the most male-oriented occupations are Cleaning & Maintenance (60.9%), Food Preparation & Serving (58.2%), and Healthcare Support (39.8%), while the most female-oriented occupations are Personal Care & Service (76.0%), Healthcare Support (60.2%), and Food Preparation & Serving (41.8%).
| Occupation | Male | Female |
| Healthcare Support | 33 (39.8%) | 50 (60.2%) |
| Security & Protection | 0 (0.0%) | 0 (0.0%) |
| Firefighting & Prevention | 0 (0.0%) | 0 (0.0%) |
| Law Enforcement | 0 (0.0%) | 0 (0.0%) |
| Food Preparation & Serving | 235 (58.2%) | 169 (41.8%) |
| Cleaning & Maintenance | 92 (60.9%) | 59 (39.1%) |
| Personal Care & Service | 44 (24.0%) | 139 (76.0%) |
| Total (Category) | 404 (49.2%) | 417 (50.8%) |
| Total (Overall) | 1,890 (55.8%) | 1,495 (44.2%) |
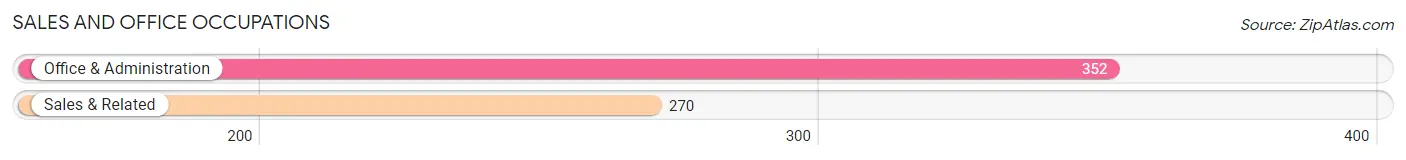
Sales and Office Occupations
The most common Sales and Office occupations in Midway City are Office & Administration (352 | 10.4%), and Sales & Related (270 | 8.0%).
Sales and Office Occupations by Sex
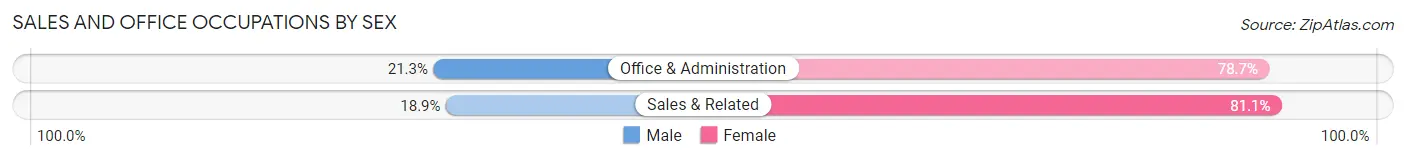
| Occupation | Male | Female |
| Sales & Related | 51 (18.9%) | 219 (81.1%) |
| Office & Administration | 75 (21.3%) | 277 (78.7%) |
| Total (Category) | 126 (20.3%) | 496 (79.7%) |
| Total (Overall) | 1,890 (55.8%) | 1,495 (44.2%) |
Natural Resources, Construction and Maintenance Occupations
The most common Natural Resources, Construction and Maintenance occupations in Midway City are Construction & Extraction (254 | 7.5%), Installation, Maintenance & Repair (99 | 2.9%), and Farming, Fishing & Forestry (12 | 0.4%).

Natural Resources, Construction and Maintenance Occupations by Sex

| Occupation | Male | Female |
| Farming, Fishing & Forestry | 12 (100.0%) | 0 (0.0%) |
| Construction & Extraction | 254 (100.0%) | 0 (0.0%) |
| Installation, Maintenance & Repair | 90 (90.9%) | 9 (9.1%) |
| Total (Category) | 356 (97.5%) | 9 (2.5%) |
| Total (Overall) | 1,890 (55.8%) | 1,495 (44.2%) |
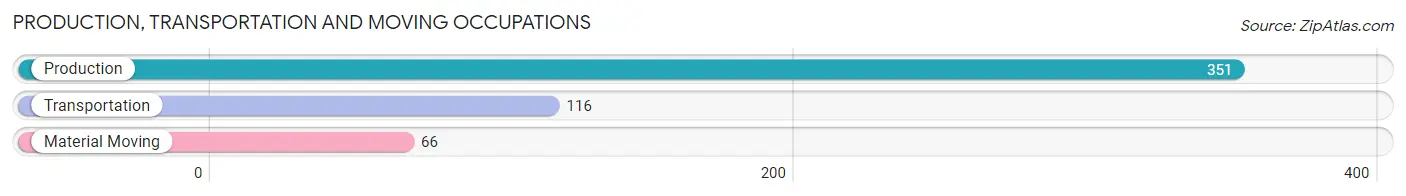
Production, Transportation and Moving Occupations
The most common Production, Transportation and Moving occupations in Midway City are Production (351 | 10.4%), Transportation (116 | 3.4%), and Material Moving (66 | 1.9%).
Production, Transportation and Moving Occupations by Sex
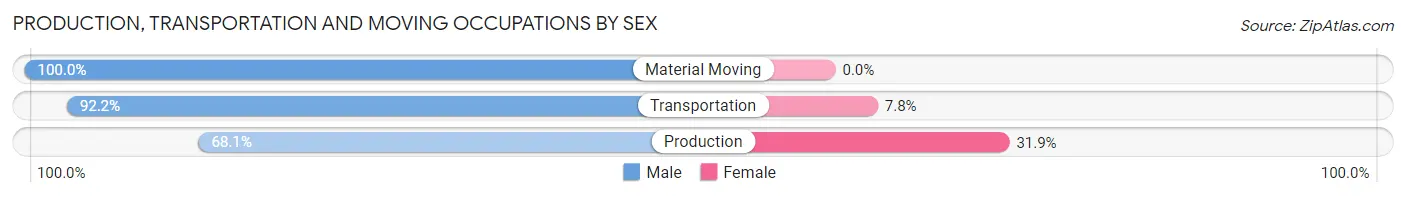
| Occupation | Male | Female |
| Production | 239 (68.1%) | 112 (31.9%) |
| Transportation | 107 (92.2%) | 9 (7.8%) |
| Material Moving | 66 (100.0%) | 0 (0.0%) |
| Total (Category) | 412 (77.3%) | 121 (22.7%) |
| Total (Overall) | 1,890 (55.8%) | 1,495 (44.2%) |
Employment Industries by Sex in Midway City
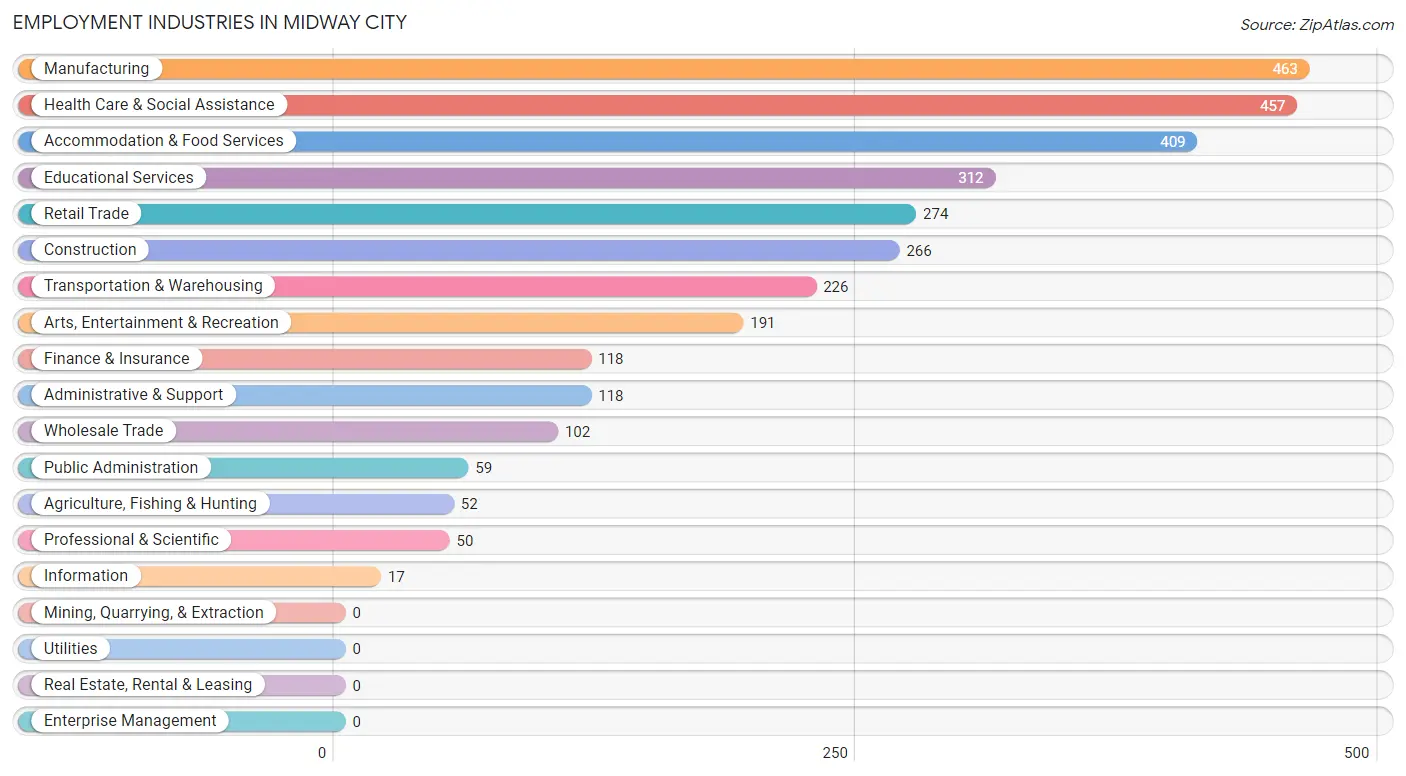
Employment Industries in Midway City
The major employment industries in Midway City include Manufacturing (463 | 13.7%), Health Care & Social Assistance (457 | 13.5%), Accommodation & Food Services (409 | 12.1%), Educational Services (312 | 9.2%), and Retail Trade (274 | 8.1%).
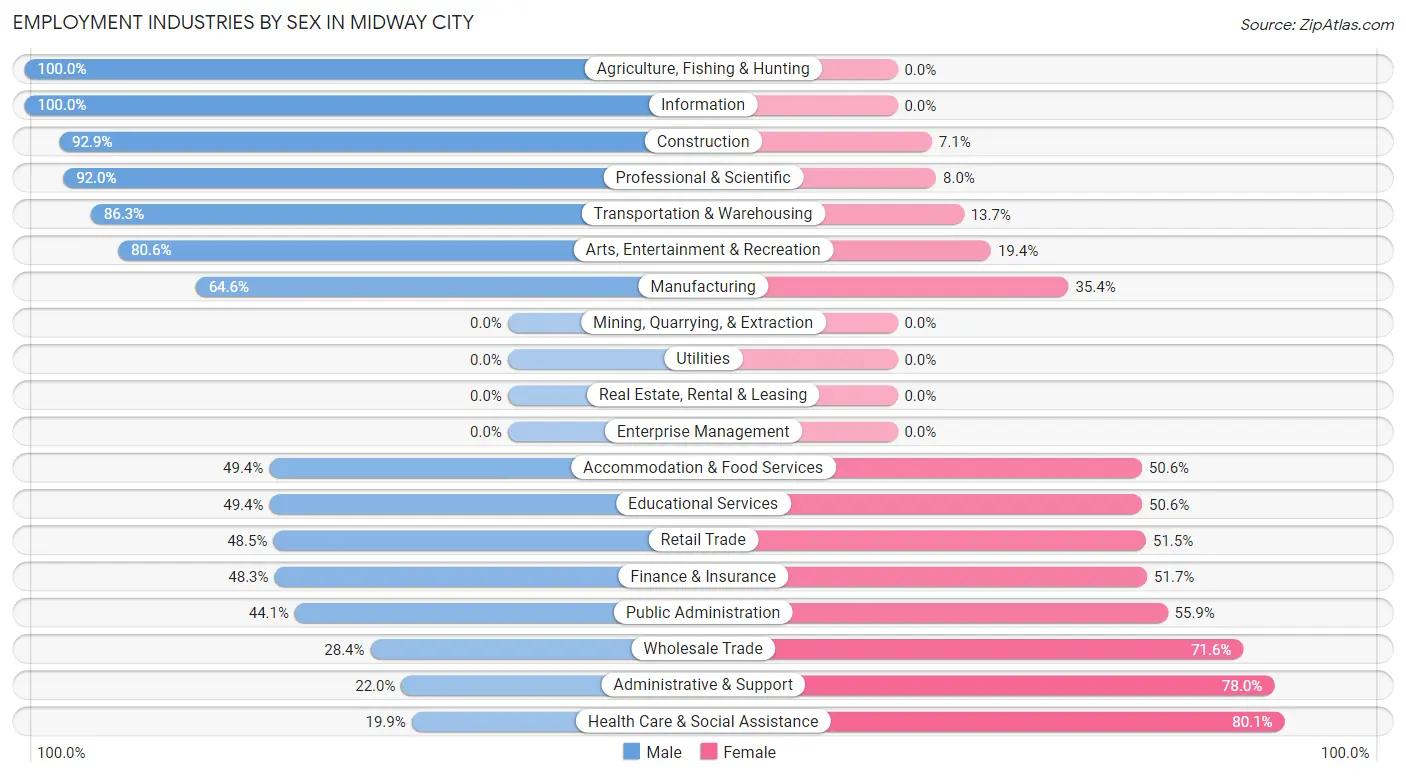
Employment Industries by Sex in Midway City
The Midway City industries that see more men than women are Agriculture, Fishing & Hunting (100.0%), Information (100.0%), and Construction (92.9%), whereas the industries that tend to have a higher number of women are Health Care & Social Assistance (80.1%), Administrative & Support (78.0%), and Wholesale Trade (71.6%).
| Industry | Male | Female |
| Agriculture, Fishing & Hunting | 52 (100.0%) | 0 (0.0%) |
| Mining, Quarrying, & Extraction | 0 (0.0%) | 0 (0.0%) |
| Construction | 247 (92.9%) | 19 (7.1%) |
| Manufacturing | 299 (64.6%) | 164 (35.4%) |
| Wholesale Trade | 29 (28.4%) | 73 (71.6%) |
| Retail Trade | 133 (48.5%) | 141 (51.5%) |
| Transportation & Warehousing | 195 (86.3%) | 31 (13.7%) |
| Utilities | 0 (0.0%) | 0 (0.0%) |
| Information | 17 (100.0%) | 0 (0.0%) |
| Finance & Insurance | 57 (48.3%) | 61 (51.7%) |
| Real Estate, Rental & Leasing | 0 (0.0%) | 0 (0.0%) |
| Professional & Scientific | 46 (92.0%) | 4 (8.0%) |
| Enterprise Management | 0 (0.0%) | 0 (0.0%) |
| Administrative & Support | 26 (22.0%) | 92 (78.0%) |
| Educational Services | 154 (49.4%) | 158 (50.6%) |
| Health Care & Social Assistance | 91 (19.9%) | 366 (80.1%) |
| Arts, Entertainment & Recreation | 154 (80.6%) | 37 (19.4%) |
| Accommodation & Food Services | 202 (49.4%) | 207 (50.6%) |
| Public Administration | 26 (44.1%) | 33 (55.9%) |
| Total | 1,890 (55.8%) | 1,495 (44.2%) |
Education in Midway City
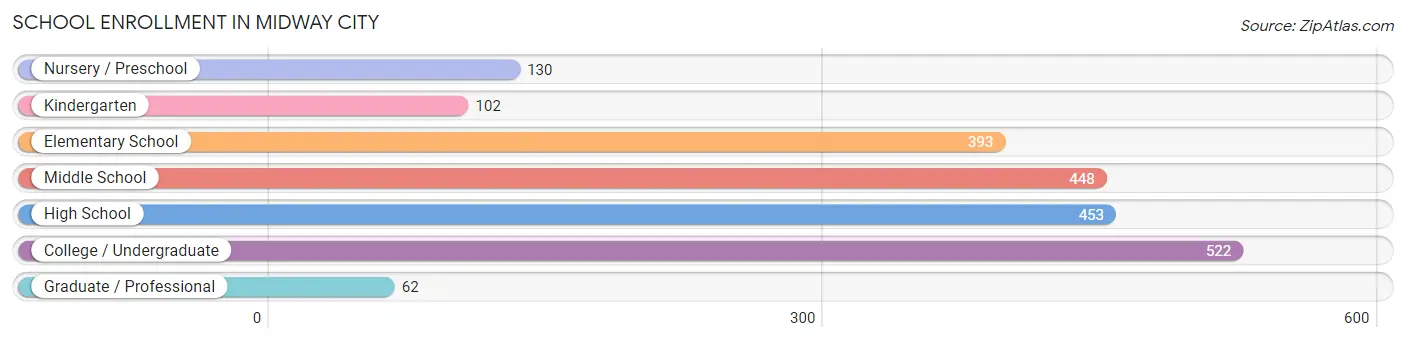
School Enrollment in Midway City
The most common levels of schooling among the 2,110 students in Midway City are college / undergraduate (522 | 24.7%), high school (453 | 21.5%), and middle school (448 | 21.2%).
| School Level | # Students | % Students |
| Nursery / Preschool | 130 | 6.2% |
| Kindergarten | 102 | 4.8% |
| Elementary School | 393 | 18.6% |
| Middle School | 448 | 21.2% |
| High School | 453 | 21.5% |
| College / Undergraduate | 522 | 24.7% |
| Graduate / Professional | 62 | 2.9% |
| Total | 2,110 | 100.0% |
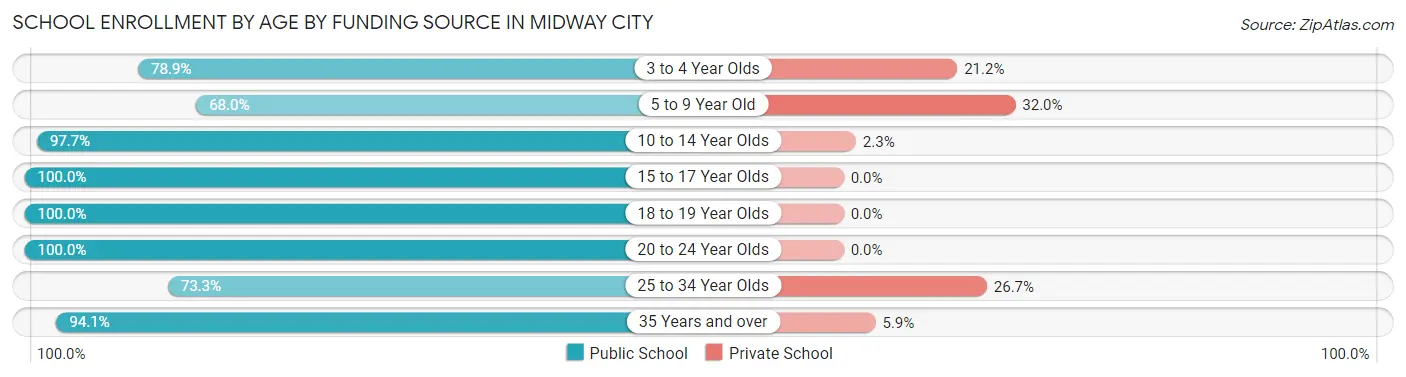
School Enrollment by Age by Funding Source in Midway City
Out of a total of 2,110 students who are enrolled in schools in Midway City, 217 (10.3%) attend a private institution, while the remaining 1,893 (89.7%) are enrolled in public schools. The age group of 5 to 9 year old has the highest likelihood of being enrolled in private schools, with 158 (32.0% in the age bracket) enrolled. Conversely, the age group of 15 to 17 year olds has the lowest likelihood of being enrolled in a private school, with 337 (100.0% in the age bracket) attending a public institution.
| Age Bracket | Public School | Private School |
| 3 to 4 Year Olds | 41 (78.8%) | 11 (21.1%) |
| 5 to 9 Year Old | 336 (68.0%) | 158 (32.0%) |
| 10 to 14 Year Olds | 556 (97.7%) | 13 (2.3%) |
| 15 to 17 Year Olds | 337 (100.0%) | 0 (0.0%) |
| 18 to 19 Year Olds | 118 (100.0%) | 0 (0.0%) |
| 20 to 24 Year Olds | 300 (100.0%) | 0 (0.0%) |
| 25 to 34 Year Olds | 77 (73.3%) | 28 (26.7%) |
| 35 Years and over | 127 (94.1%) | 8 (5.9%) |
| Total | 1,893 (89.7%) | 217 (10.3%) |
Educational Attainment by Field of Study in Midway City
Arts & humanities (187 | 15.1%), engineering (183 | 14.8%), business (153 | 12.4%), social sciences (132 | 10.7%), and bio, nature & agricultural (97 | 7.8%) are the most common fields of study among 1,237 individuals in Midway City who have obtained a bachelor's degree or higher.
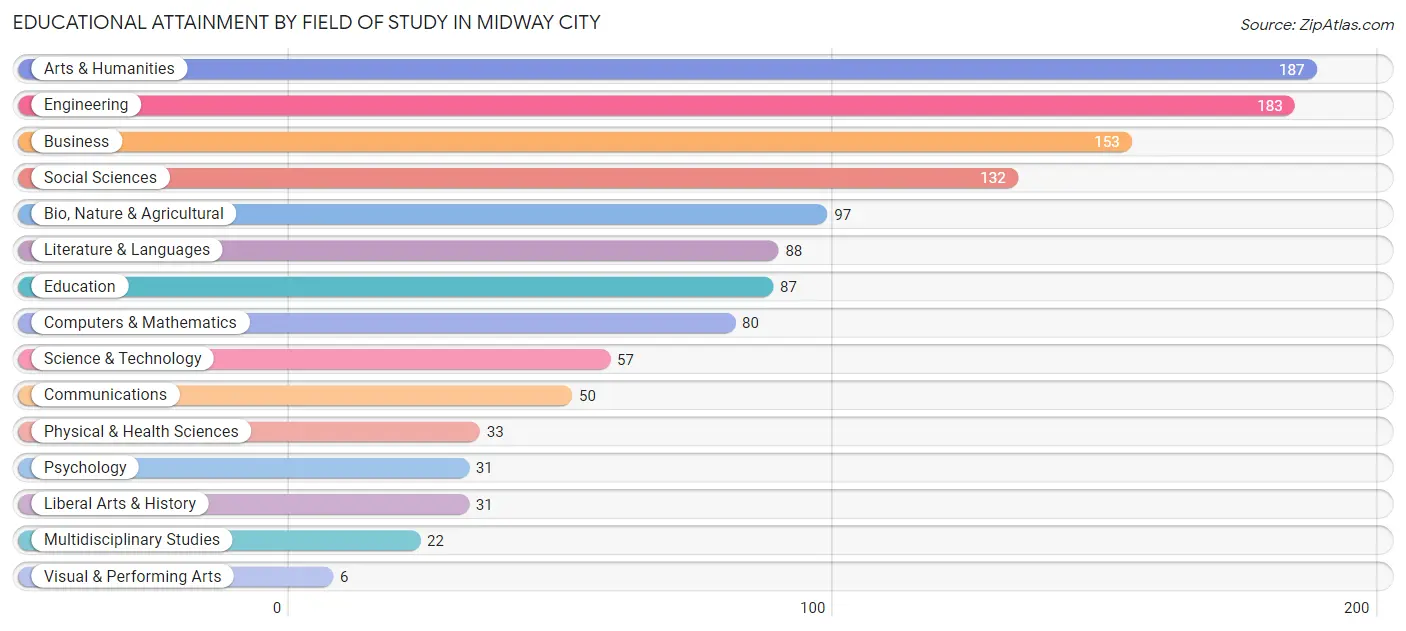
| Field of Study | # Graduates | % Graduates |
| Computers & Mathematics | 80 | 6.5% |
| Bio, Nature & Agricultural | 97 | 7.8% |
| Physical & Health Sciences | 33 | 2.7% |
| Psychology | 31 | 2.5% |
| Social Sciences | 132 | 10.7% |
| Engineering | 183 | 14.8% |
| Multidisciplinary Studies | 22 | 1.8% |
| Science & Technology | 57 | 4.6% |
| Business | 153 | 12.4% |
| Education | 87 | 7.0% |
| Literature & Languages | 88 | 7.1% |
| Liberal Arts & History | 31 | 2.5% |
| Visual & Performing Arts | 6 | 0.5% |
| Communications | 50 | 4.0% |
| Arts & Humanities | 187 | 15.1% |
| Total | 1,237 | 100.0% |
Transportation & Commute in Midway City
Vehicle Availability by Sex in Midway City
The most prevalent vehicle ownership categories in Midway City are males with 2 vehicles (600, accounting for 33.4%) and females with 2 vehicles (502, making up 40.1%).
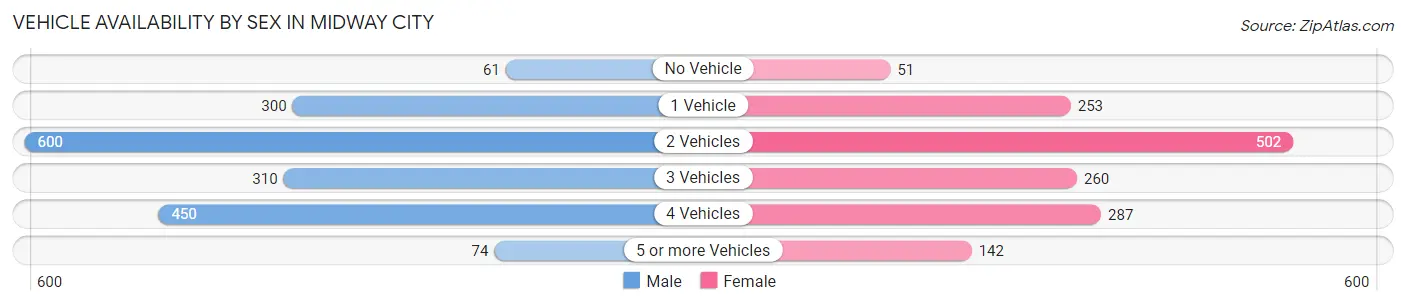
| Vehicles Available | Male | Female |
| No Vehicle | 61 (3.4%) | 51 (3.4%) |
| 1 Vehicle | 300 (16.7%) | 253 (16.9%) |
| 2 Vehicles | 600 (33.4%) | 502 (33.6%) |
| 3 Vehicles | 310 (17.3%) | 260 (17.4%) |
| 4 Vehicles | 450 (25.1%) | 287 (19.2%) |
| 5 or more Vehicles | 74 (4.1%) | 142 (9.5%) |
| Total | 1,795 (100.0%) | 1,495 (100.0%) |
Commute Time in Midway City
The most frequently occuring commute durations in Midway City are 15 to 19 minutes (592 commuters, 19.9%), 20 to 24 minutes (590 commuters, 19.8%), and 40 to 44 minutes (360 commuters, 12.1%).
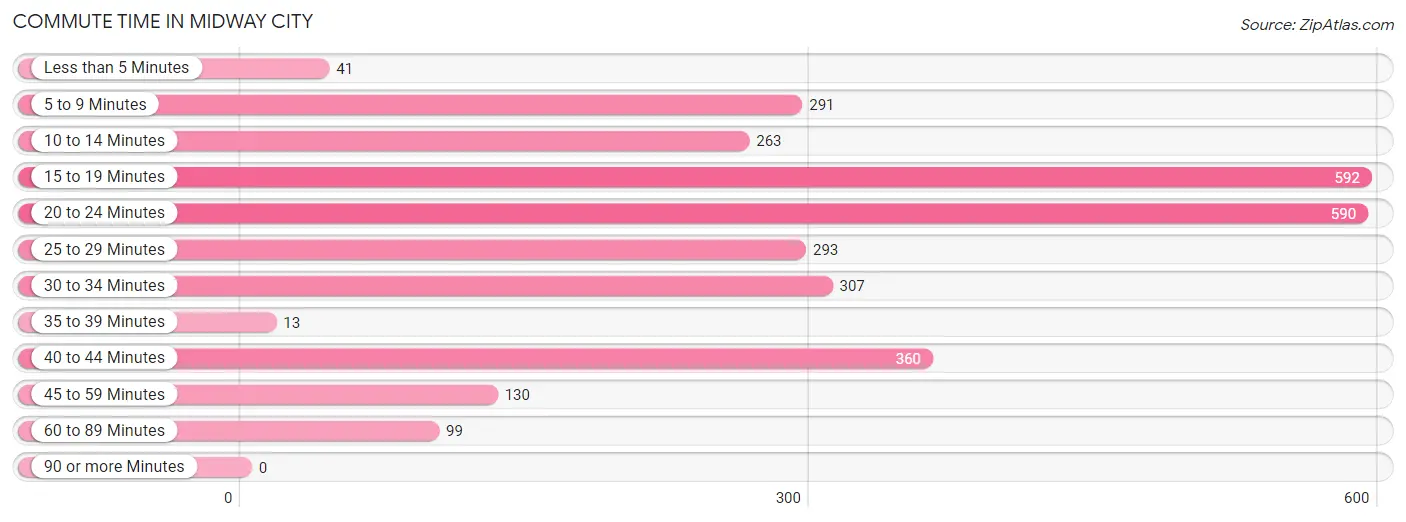
| Commute Time | # Commuters | % Commuters |
| Less than 5 Minutes | 41 | 1.4% |
| 5 to 9 Minutes | 291 | 9.8% |
| 10 to 14 Minutes | 263 | 8.8% |
| 15 to 19 Minutes | 592 | 19.9% |
| 20 to 24 Minutes | 590 | 19.8% |
| 25 to 29 Minutes | 293 | 9.8% |
| 30 to 34 Minutes | 307 | 10.3% |
| 35 to 39 Minutes | 13 | 0.4% |
| 40 to 44 Minutes | 360 | 12.1% |
| 45 to 59 Minutes | 130 | 4.4% |
| 60 to 89 Minutes | 99 | 3.3% |
| 90 or more Minutes | 0 | 0.0% |
Commute Time by Sex in Midway City
The most common commute times in Midway City are 20 to 24 minutes (311 commuters, 20.0%) for males and 15 to 19 minutes (363 commuters, 25.4%) for females.
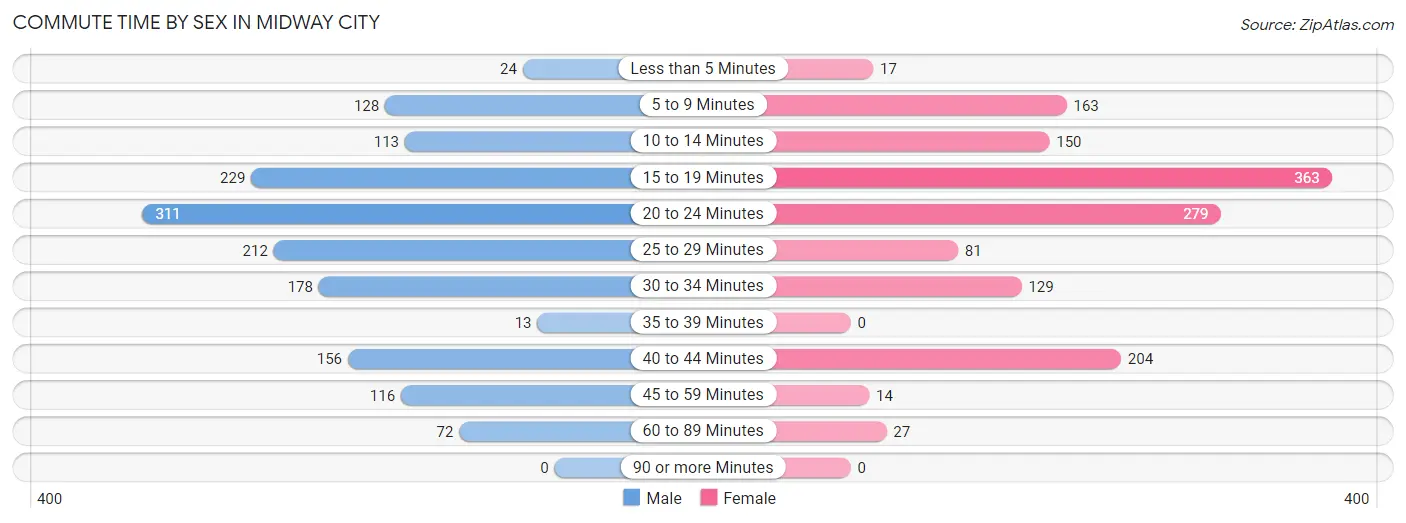
| Commute Time | Male | Female |
| Less than 5 Minutes | 24 (1.5%) | 17 (1.2%) |
| 5 to 9 Minutes | 128 (8.3%) | 163 (11.4%) |
| 10 to 14 Minutes | 113 (7.3%) | 150 (10.5%) |
| 15 to 19 Minutes | 229 (14.8%) | 363 (25.4%) |
| 20 to 24 Minutes | 311 (20.0%) | 279 (19.6%) |
| 25 to 29 Minutes | 212 (13.7%) | 81 (5.7%) |
| 30 to 34 Minutes | 178 (11.5%) | 129 (9.0%) |
| 35 to 39 Minutes | 13 (0.8%) | 0 (0.0%) |
| 40 to 44 Minutes | 156 (10.1%) | 204 (14.3%) |
| 45 to 59 Minutes | 116 (7.5%) | 14 (1.0%) |
| 60 to 89 Minutes | 72 (4.6%) | 27 (1.9%) |
| 90 or more Minutes | 0 (0.0%) | 0 (0.0%) |
Time of Departure to Work by Sex in Midway City
The most frequent times of departure to work in Midway City are 8:00 AM to 8:29 AM (258, 16.6%) for males and 9:00 AM to 9:59 AM (307, 21.5%) for females.
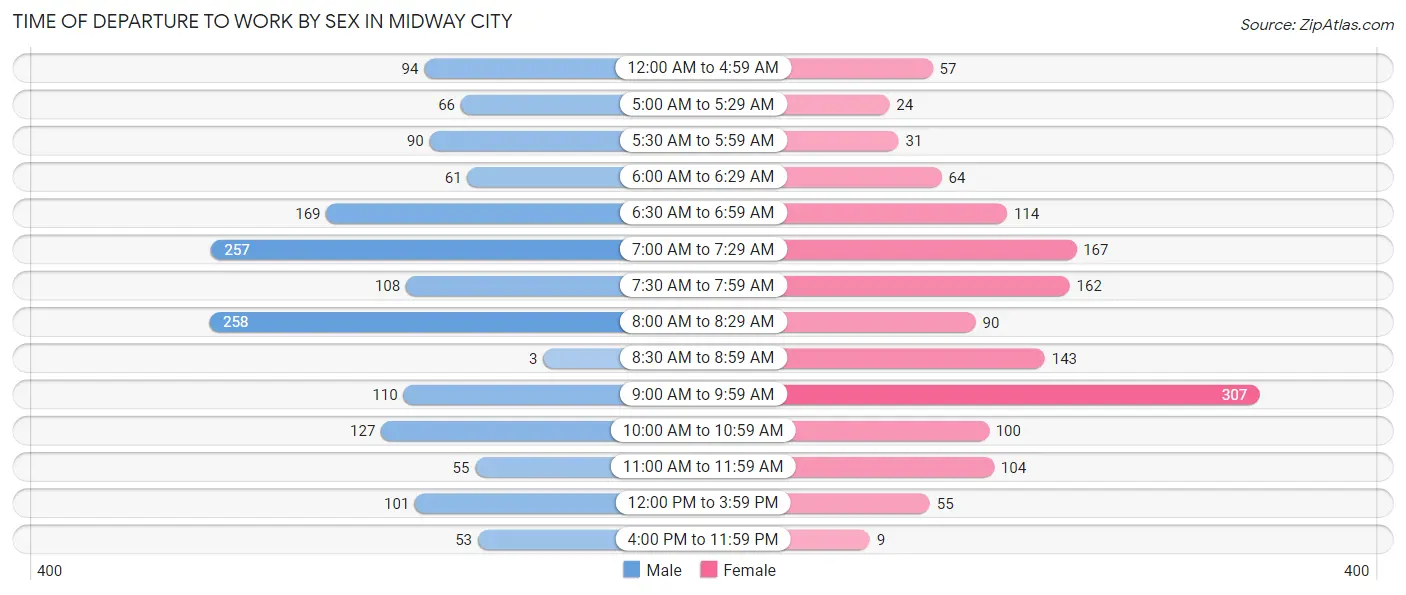
| Time of Departure | Male | Female |
| 12:00 AM to 4:59 AM | 94 (6.1%) | 57 (4.0%) |
| 5:00 AM to 5:29 AM | 66 (4.3%) | 24 (1.7%) |
| 5:30 AM to 5:59 AM | 90 (5.8%) | 31 (2.2%) |
| 6:00 AM to 6:29 AM | 61 (3.9%) | 64 (4.5%) |
| 6:30 AM to 6:59 AM | 169 (10.9%) | 114 (8.0%) |
| 7:00 AM to 7:29 AM | 257 (16.6%) | 167 (11.7%) |
| 7:30 AM to 7:59 AM | 108 (7.0%) | 162 (11.4%) |
| 8:00 AM to 8:29 AM | 258 (16.6%) | 90 (6.3%) |
| 8:30 AM to 8:59 AM | 3 (0.2%) | 143 (10.0%) |
| 9:00 AM to 9:59 AM | 110 (7.1%) | 307 (21.5%) |
| 10:00 AM to 10:59 AM | 127 (8.2%) | 100 (7.0%) |
| 11:00 AM to 11:59 AM | 55 (3.5%) | 104 (7.3%) |
| 12:00 PM to 3:59 PM | 101 (6.5%) | 55 (3.8%) |
| 4:00 PM to 11:59 PM | 53 (3.4%) | 9 (0.6%) |
| Total | 1,552 (100.0%) | 1,427 (100.0%) |
Housing Occupancy in Midway City
Occupancy by Ownership in Midway City
Of the total 2,502 dwellings in Midway City, owner-occupied units account for 755 (30.2%), while renter-occupied units make up 1,747 (69.8%).
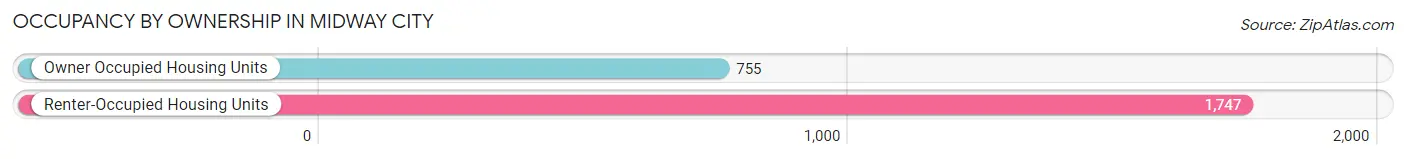
| Occupancy | # Housing Units | % Housing Units |
| Owner Occupied Housing Units | 755 | 30.2% |
| Renter-Occupied Housing Units | 1,747 | 69.8% |
| Total Occupied Housing Units | 2,502 | 100.0% |
Occupancy by Household Size in Midway City
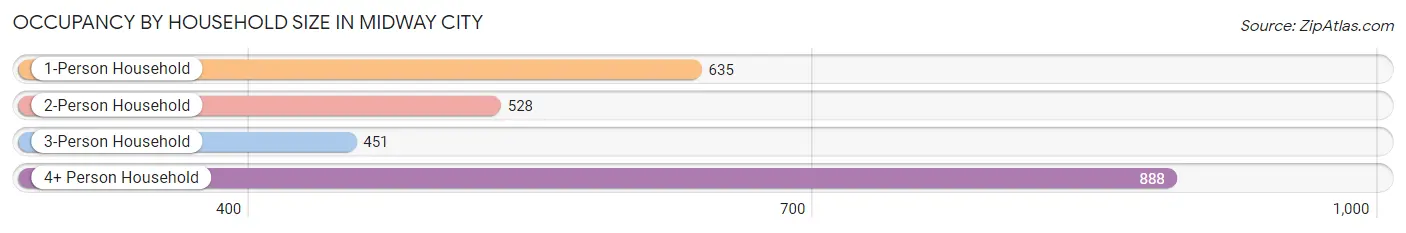
| Household Size | # Housing Units | % Housing Units |
| 1-Person Household | 635 | 25.4% |
| 2-Person Household | 528 | 21.1% |
| 3-Person Household | 451 | 18.0% |
| 4+ Person Household | 888 | 35.5% |
| Total Housing Units | 2,502 | 100.0% |
Occupancy by Ownership by Household Size in Midway City
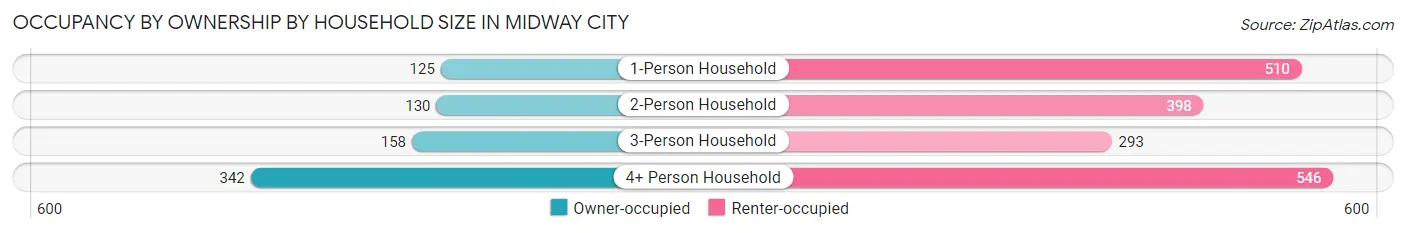
| Household Size | Owner-occupied | Renter-occupied |
| 1-Person Household | 125 (19.7%) | 510 (80.3%) |
| 2-Person Household | 130 (24.6%) | 398 (75.4%) |
| 3-Person Household | 158 (35.0%) | 293 (65.0%) |
| 4+ Person Household | 342 (38.5%) | 546 (61.5%) |
| Total Housing Units | 755 (30.2%) | 1,747 (69.8%) |
Occupancy by Educational Attainment in Midway City
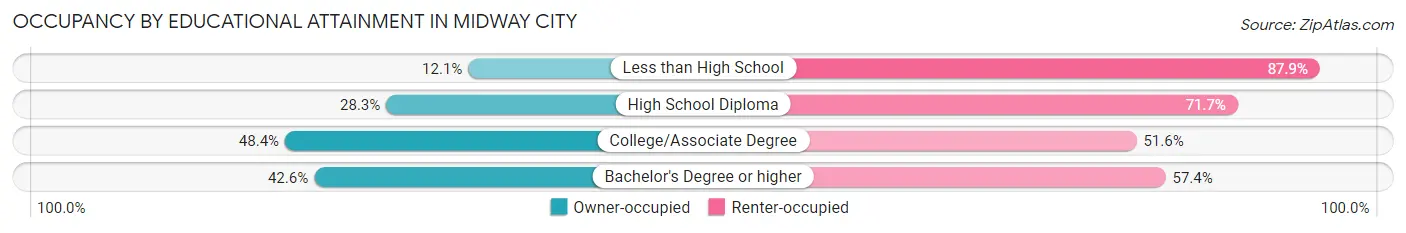
| Household Size | Owner-occupied | Renter-occupied |
| Less than High School | 104 (12.1%) | 758 (87.9%) |
| High School Diploma | 166 (28.3%) | 420 (71.7%) |
| College/Associate Degree | 300 (48.4%) | 320 (51.6%) |
| Bachelor's Degree or higher | 185 (42.6%) | 249 (57.4%) |
Occupancy by Age of Householder in Midway City
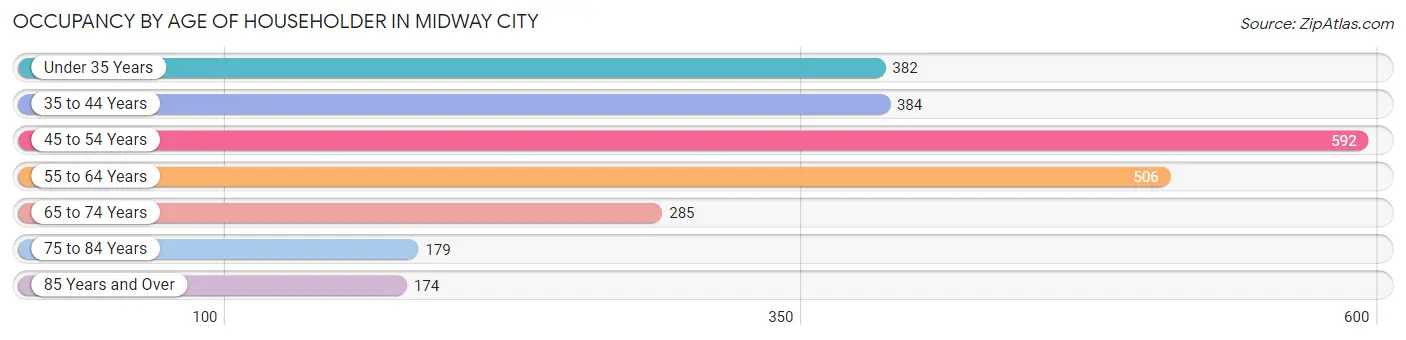
| Age Bracket | # Households | % Households |
| Under 35 Years | 382 | 15.3% |
| 35 to 44 Years | 384 | 15.3% |
| 45 to 54 Years | 592 | 23.7% |
| 55 to 64 Years | 506 | 20.2% |
| 65 to 74 Years | 285 | 11.4% |
| 75 to 84 Years | 179 | 7.1% |
| 85 Years and Over | 174 | 7.0% |
| Total | 2,502 | 100.0% |
Housing Finances in Midway City
Median Income by Occupancy in Midway City
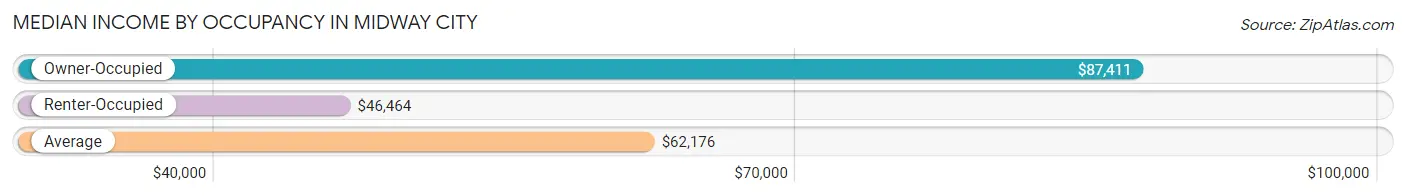
| Occupancy Type | # Households | Median Income |
| Owner-Occupied | 755 (30.2%) | $87,411 |
| Renter-Occupied | 1,747 (69.8%) | $46,464 |
| Average | 2,502 (100.0%) | $62,176 |
Occupancy by Householder Income Bracket in Midway City

| Income Bracket | Owner-occupied | Renter-occupied |
| Less than $5,000 | 0 (0.0%) | 182 (10.4%) |
| $5,000 to $9,999 | 12 (1.6%) | 89 (5.1%) |
| $10,000 to $14,999 | 31 (4.1%) | 93 (5.3%) |
| $15,000 to $19,999 | 0 (0.0%) | 203 (11.6%) |
| $20,000 to $24,999 | 7 (0.9%) | 48 (2.8%) |
| $25,000 to $34,999 | 70 (9.3%) | 98 (5.6%) |
| $35,000 to $49,999 | 25 (3.3%) | 211 (12.1%) |
| $50,000 to $74,999 | 158 (20.9%) | 159 (9.1%) |
| $75,000 to $99,999 | 181 (24.0%) | 209 (12.0%) |
| $100,000 to $149,999 | 104 (13.8%) | 220 (12.6%) |
| $150,000 or more | 167 (22.1%) | 235 (13.5%) |
| Total | 755 (100.0%) | 1,747 (100.0%) |
Monthly Housing Cost Tiers in Midway City
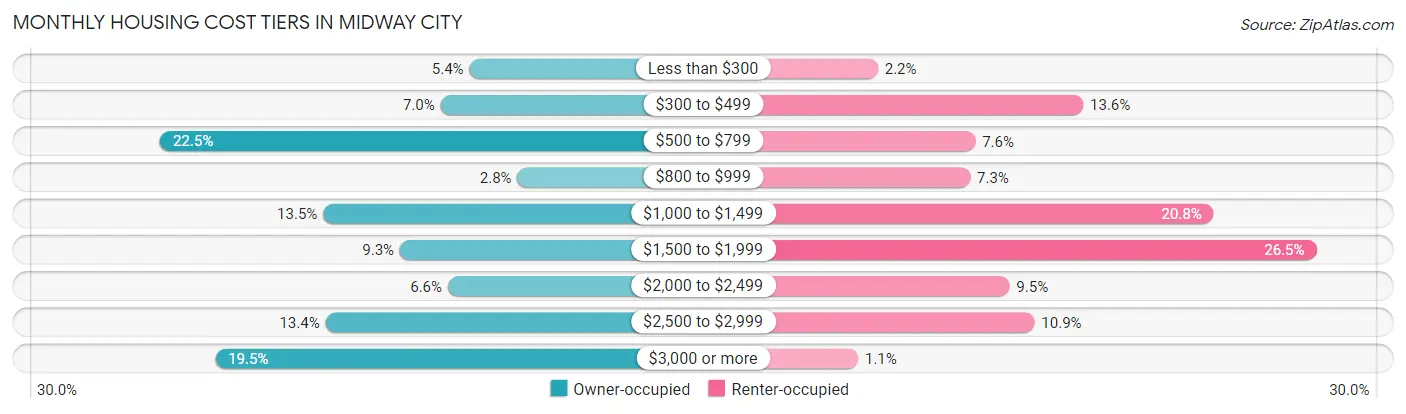
| Monthly Cost | Owner-occupied | Renter-occupied |
| Less than $300 | 41 (5.4%) | 39 (2.2%) |
| $300 to $499 | 53 (7.0%) | 237 (13.6%) |
| $500 to $799 | 170 (22.5%) | 133 (7.6%) |
| $800 to $999 | 21 (2.8%) | 128 (7.3%) |
| $1,000 to $1,499 | 102 (13.5%) | 363 (20.8%) |
| $1,500 to $1,999 | 70 (9.3%) | 462 (26.5%) |
| $2,000 to $2,499 | 50 (6.6%) | 166 (9.5%) |
| $2,500 to $2,999 | 101 (13.4%) | 190 (10.9%) |
| $3,000 or more | 147 (19.5%) | 20 (1.1%) |
| Total | 755 (100.0%) | 1,747 (100.0%) |
Physical Housing Characteristics in Midway City
Housing Structures in Midway City
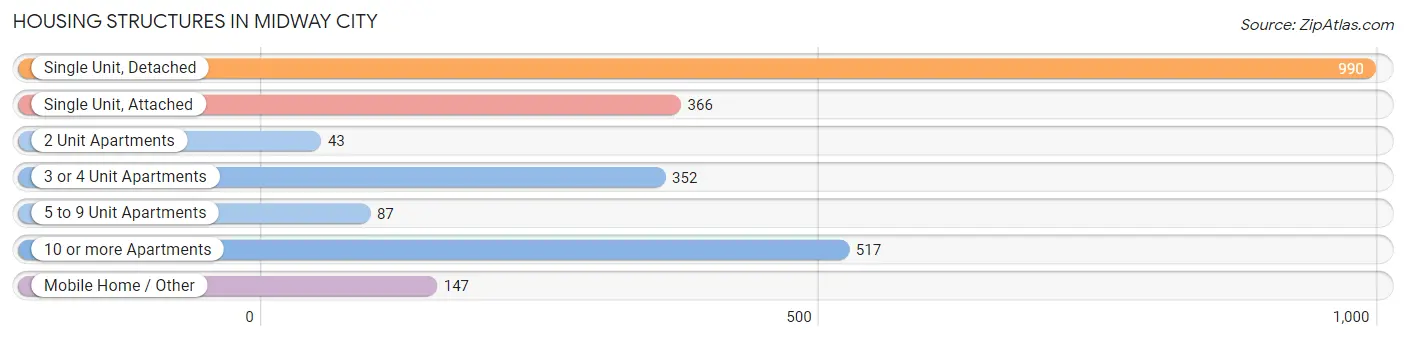
| Structure Type | # Housing Units | % Housing Units |
| Single Unit, Detached | 990 | 39.6% |
| Single Unit, Attached | 366 | 14.6% |
| 2 Unit Apartments | 43 | 1.7% |
| 3 or 4 Unit Apartments | 352 | 14.1% |
| 5 to 9 Unit Apartments | 87 | 3.5% |
| 10 or more Apartments | 517 | 20.7% |
| Mobile Home / Other | 147 | 5.9% |
| Total | 2,502 | 100.0% |
Housing Structures by Occupancy in Midway City
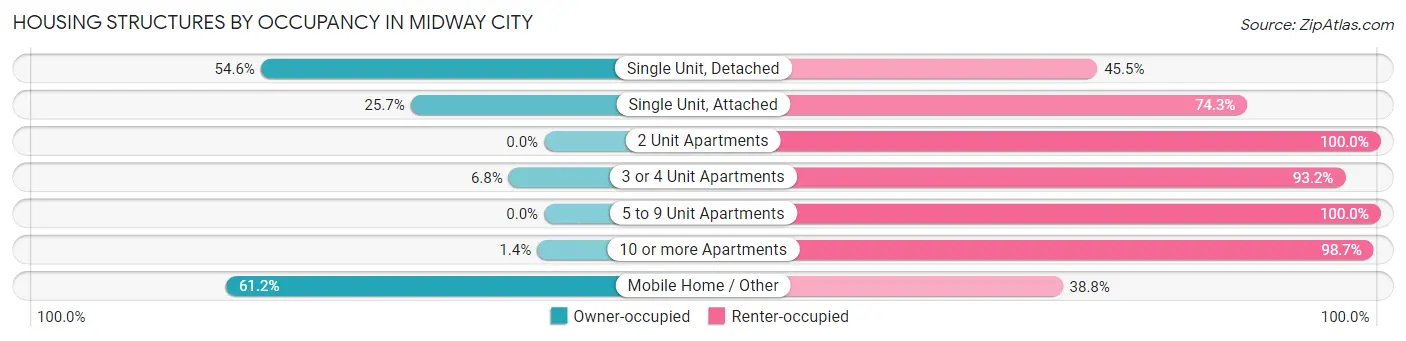
| Structure Type | Owner-occupied | Renter-occupied |
| Single Unit, Detached | 540 (54.5%) | 450 (45.5%) |
| Single Unit, Attached | 94 (25.7%) | 272 (74.3%) |
| 2 Unit Apartments | 0 (0.0%) | 43 (100.0%) |
| 3 or 4 Unit Apartments | 24 (6.8%) | 328 (93.2%) |
| 5 to 9 Unit Apartments | 0 (0.0%) | 87 (100.0%) |
| 10 or more Apartments | 7 (1.3%) | 510 (98.7%) |
| Mobile Home / Other | 90 (61.2%) | 57 (38.8%) |
| Total | 755 (30.2%) | 1,747 (69.8%) |
Housing Structures by Number of Rooms in Midway City
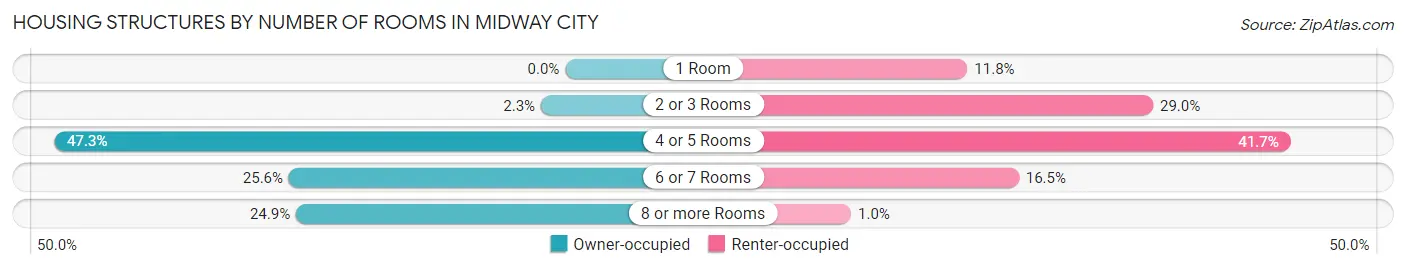
| Number of Rooms | Owner-occupied | Renter-occupied |
| 1 Room | 0 (0.0%) | 206 (11.8%) |
| 2 or 3 Rooms | 17 (2.2%) | 506 (29.0%) |
| 4 or 5 Rooms | 357 (47.3%) | 728 (41.7%) |
| 6 or 7 Rooms | 193 (25.6%) | 289 (16.5%) |
| 8 or more Rooms | 188 (24.9%) | 18 (1.0%) |
| Total | 755 (100.0%) | 1,747 (100.0%) |
Housing Structure by Heating Type in Midway City
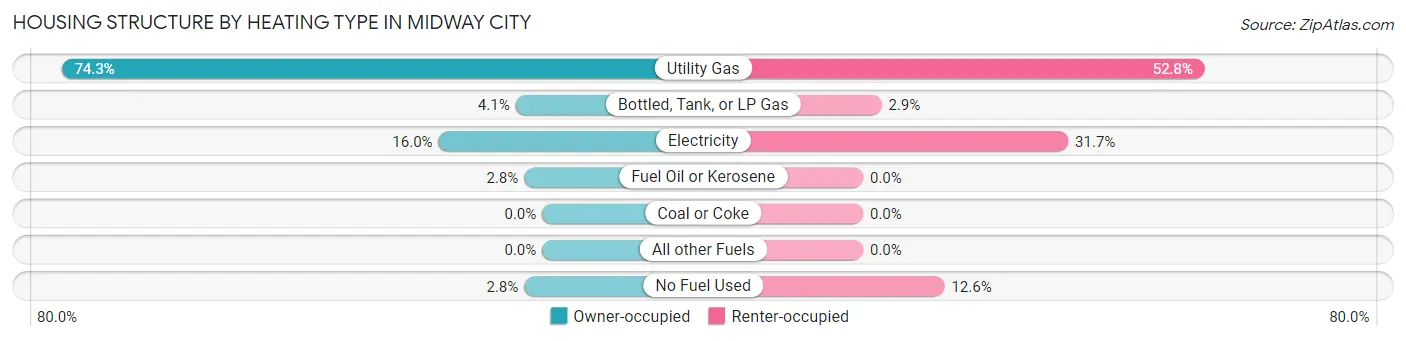
| Heating Type | Owner-occupied | Renter-occupied |
| Utility Gas | 561 (74.3%) | 923 (52.8%) |
| Bottled, Tank, or LP Gas | 31 (4.1%) | 50 (2.9%) |
| Electricity | 121 (16.0%) | 554 (31.7%) |
| Fuel Oil or Kerosene | 21 (2.8%) | 0 (0.0%) |
| Coal or Coke | 0 (0.0%) | 0 (0.0%) |
| All other Fuels | 0 (0.0%) | 0 (0.0%) |
| No Fuel Used | 21 (2.8%) | 220 (12.6%) |
| Total | 755 (100.0%) | 1,747 (100.0%) |
Household Vehicle Usage in Midway City
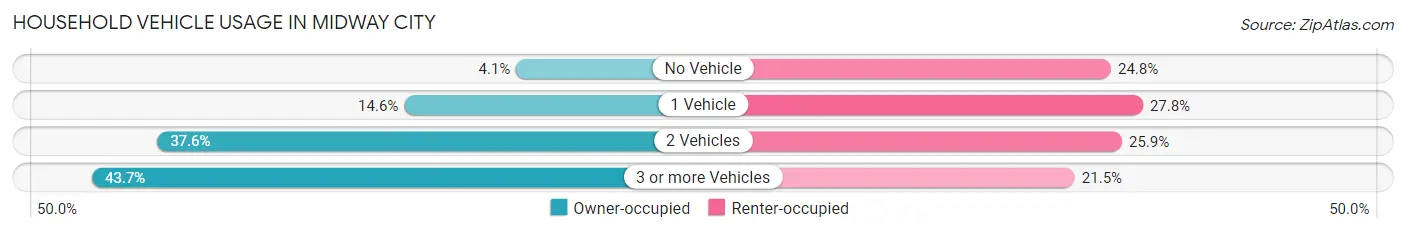
| Vehicles per Household | Owner-occupied | Renter-occupied |
| No Vehicle | 31 (4.1%) | 434 (24.8%) |
| 1 Vehicle | 110 (14.6%) | 486 (27.8%) |
| 2 Vehicles | 284 (37.6%) | 452 (25.9%) |
| 3 or more Vehicles | 330 (43.7%) | 375 (21.5%) |
| Total | 755 (100.0%) | 1,747 (100.0%) |
Real Estate & Mortgages in Midway City
Real Estate and Mortgage Overview in Midway City
| Characteristic | Without Mortgage | With Mortgage |
| Housing Units | 336 | 419 |
| Median Property Value | $592,300 | $770,200 |
| Median Household Income | $61,875 | $125 |
| Monthly Housing Costs | $641 | $147 |
| Real Estate Taxes | $4,222 | $0 |
Property Value by Mortgage Status in Midway City
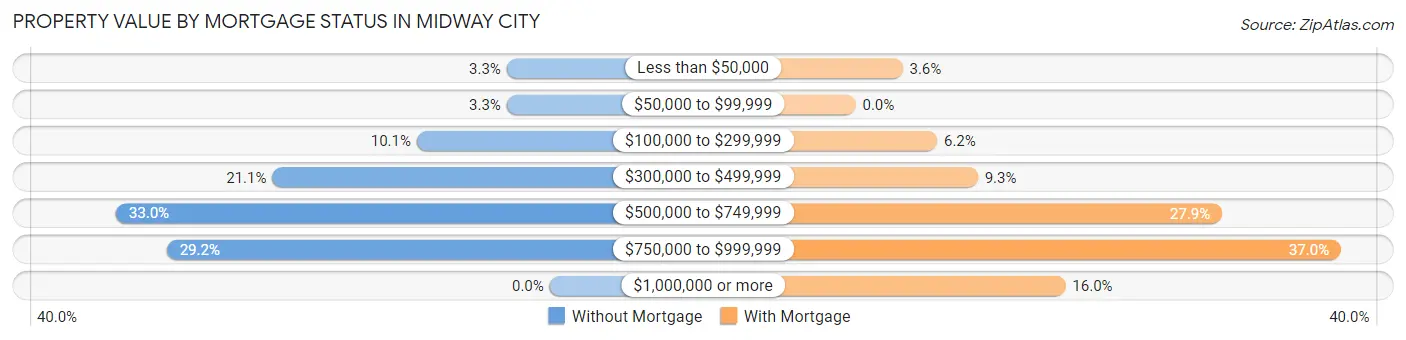
| Property Value | Without Mortgage | With Mortgage |
| Less than $50,000 | 11 (3.3%) | 15 (3.6%) |
| $50,000 to $99,999 | 11 (3.3%) | 0 (0.0%) |
| $100,000 to $299,999 | 34 (10.1%) | 26 (6.2%) |
| $300,000 to $499,999 | 71 (21.1%) | 39 (9.3%) |
| $500,000 to $749,999 | 111 (33.0%) | 117 (27.9%) |
| $750,000 to $999,999 | 98 (29.2%) | 155 (37.0%) |
| $1,000,000 or more | 0 (0.0%) | 67 (16.0%) |
| Total | 336 (100.0%) | 419 (100.0%) |
Household Income by Mortgage Status in Midway City
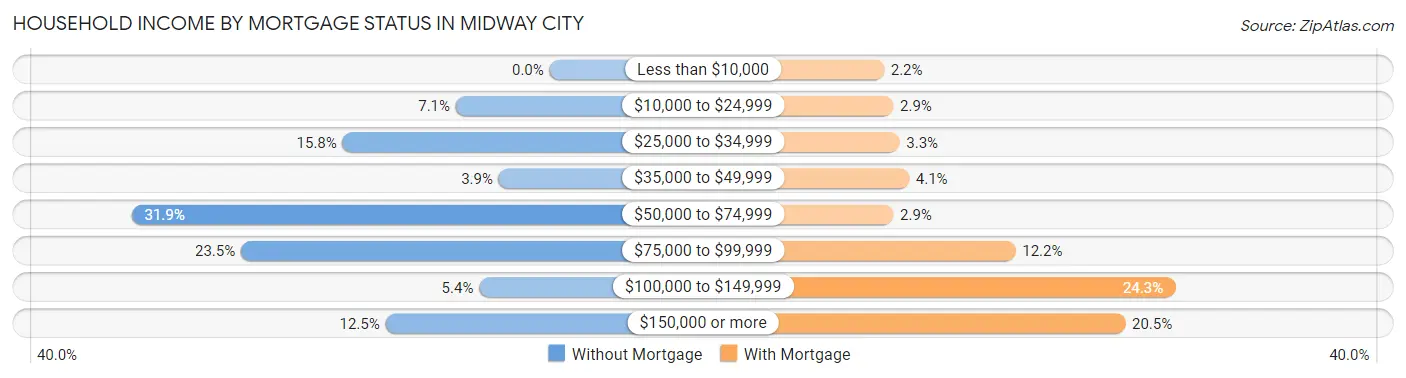
| Household Income | Without Mortgage | With Mortgage |
| Less than $10,000 | 0 (0.0%) | 9 (2.1%) |
| $10,000 to $24,999 | 24 (7.1%) | 12 (2.9%) |
| $25,000 to $34,999 | 53 (15.8%) | 14 (3.3%) |
| $35,000 to $49,999 | 13 (3.9%) | 17 (4.1%) |
| $50,000 to $74,999 | 107 (31.9%) | 12 (2.9%) |
| $75,000 to $99,999 | 79 (23.5%) | 51 (12.2%) |
| $100,000 to $149,999 | 18 (5.4%) | 102 (24.3%) |
| $150,000 or more | 42 (12.5%) | 86 (20.5%) |
| Total | 336 (100.0%) | 419 (100.0%) |
Property Value to Household Income Ratio in Midway City
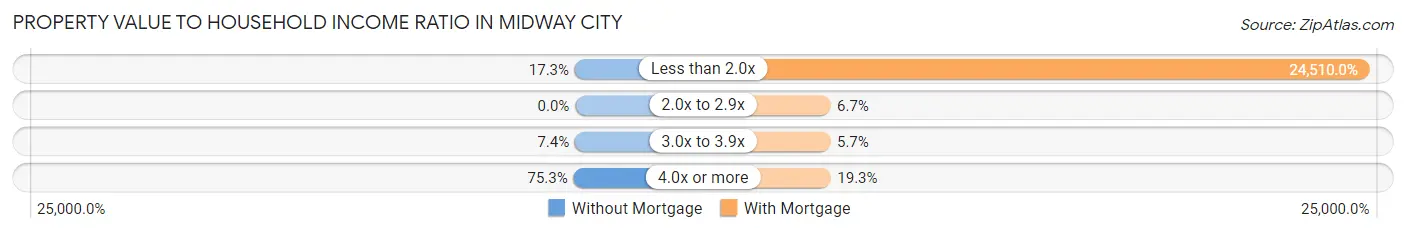
| Value-to-Income Ratio | Without Mortgage | With Mortgage |
| Less than 2.0x | 58 (17.3%) | 102,697 (24,510.0%) |
| 2.0x to 2.9x | 0 (0.0%) | 28 (6.7%) |
| 3.0x to 3.9x | 25 (7.4%) | 24 (5.7%) |
| 4.0x or more | 253 (75.3%) | 81 (19.3%) |
| Total | 336 (100.0%) | 419 (100.0%) |
Real Estate Taxes by Mortgage Status in Midway City
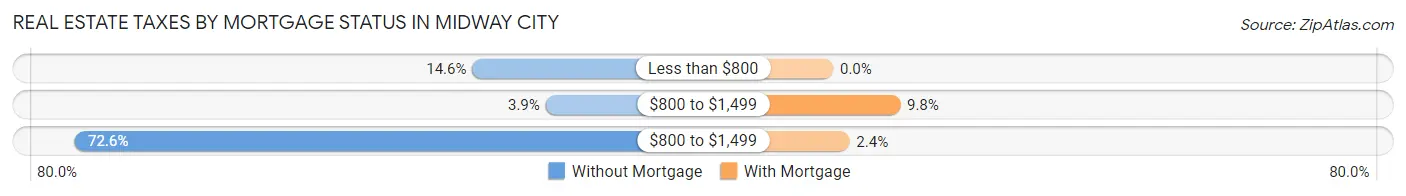
| Property Taxes | Without Mortgage | With Mortgage |
| Less than $800 | 49 (14.6%) | 0 (0.0%) |
| $800 to $1,499 | 13 (3.9%) | 41 (9.8%) |
| $800 to $1,499 | 244 (72.6%) | 10 (2.4%) |
| Total | 336 (100.0%) | 419 (100.0%) |
Health & Disability in Midway City
Health Insurance Coverage by Age in Midway City
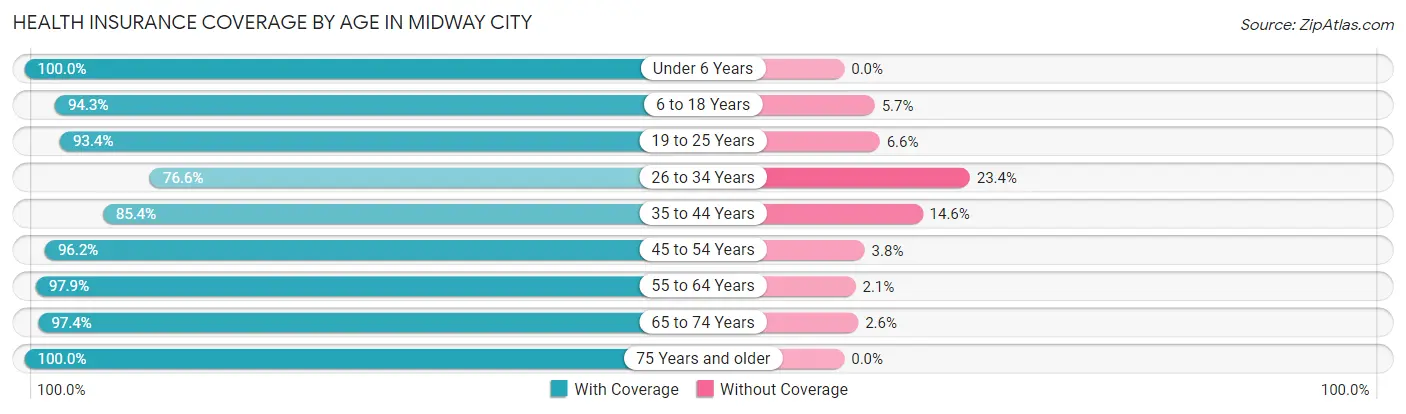
| Age Bracket | With Coverage | Without Coverage |
| Under 6 Years | 432 (100.0%) | 0 (0.0%) |
| 6 to 18 Years | 1,265 (94.3%) | 76 (5.7%) |
| 19 to 25 Years | 720 (93.4%) | 51 (6.6%) |
| 26 to 34 Years | 684 (76.6%) | 209 (23.4%) |
| 35 to 44 Years | 778 (85.4%) | 133 (14.6%) |
| 45 to 54 Years | 1,366 (96.2%) | 54 (3.8%) |
| 55 to 64 Years | 1,027 (97.9%) | 22 (2.1%) |
| 65 to 74 Years | 527 (97.4%) | 14 (2.6%) |
| 75 Years and older | 623 (100.0%) | 0 (0.0%) |
| Total | 7,422 (93.0%) | 559 (7.0%) |
Health Insurance Coverage by Citizenship Status in Midway City
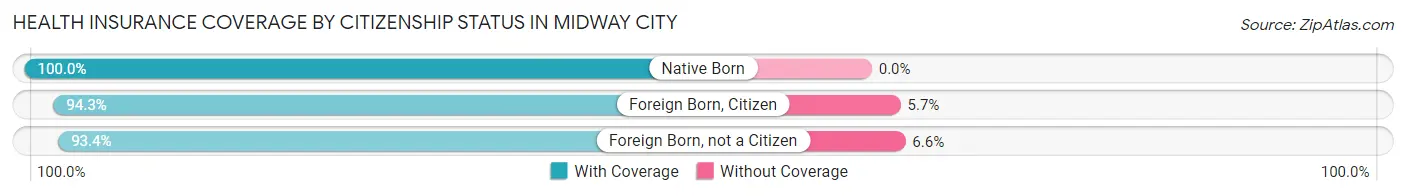
| Citizenship Status | With Coverage | Without Coverage |
| Native Born | 432 (100.0%) | 0 (0.0%) |
| Foreign Born, Citizen | 1,265 (94.3%) | 76 (5.7%) |
| Foreign Born, not a Citizen | 720 (93.4%) | 51 (6.6%) |
Health Insurance Coverage by Household Income in Midway City
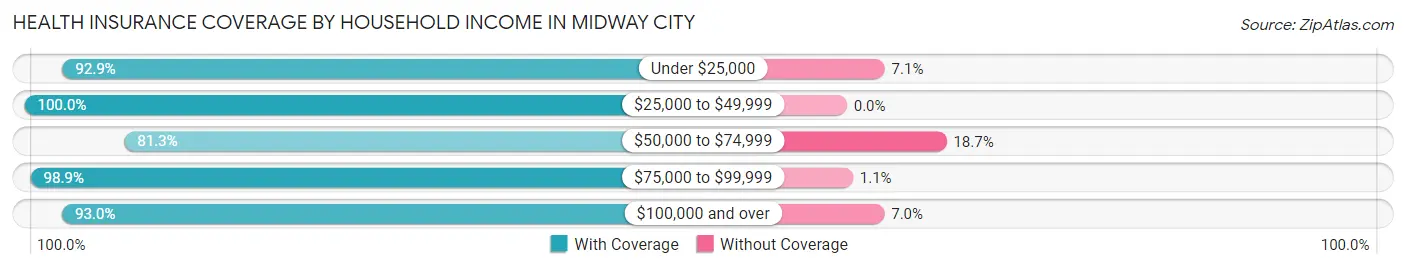
| Household Income | With Coverage | Without Coverage |
| Under $25,000 | 1,049 (92.9%) | 80 (7.1%) |
| $25,000 to $49,999 | 980 (100.0%) | 0 (0.0%) |
| $50,000 to $74,999 | 1,010 (81.3%) | 232 (18.7%) |
| $75,000 to $99,999 | 1,230 (98.9%) | 14 (1.1%) |
| $100,000 and over | 3,087 (93.0%) | 233 (7.0%) |
Public vs Private Health Insurance Coverage by Age in Midway City
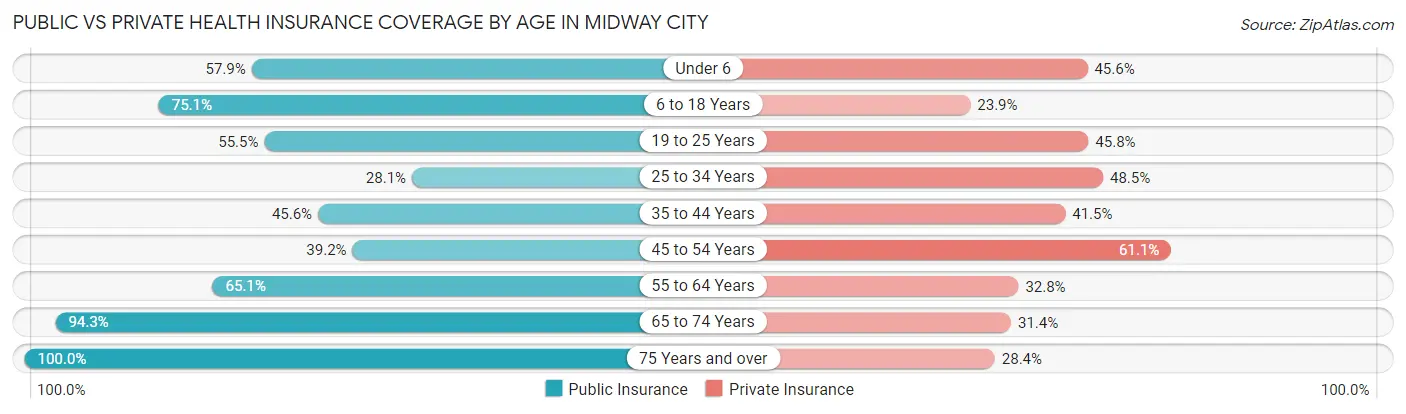
| Age Bracket | Public Insurance | Private Insurance |
| Under 6 | 250 (57.9%) | 197 (45.6%) |
| 6 to 18 Years | 1,007 (75.1%) | 320 (23.9%) |
| 19 to 25 Years | 428 (55.5%) | 353 (45.8%) |
| 25 to 34 Years | 251 (28.1%) | 433 (48.5%) |
| 35 to 44 Years | 415 (45.6%) | 378 (41.5%) |
| 45 to 54 Years | 556 (39.2%) | 868 (61.1%) |
| 55 to 64 Years | 683 (65.1%) | 344 (32.8%) |
| 65 to 74 Years | 510 (94.3%) | 170 (31.4%) |
| 75 Years and over | 623 (100.0%) | 177 (28.4%) |
| Total | 4,723 (59.2%) | 3,240 (40.6%) |
Disability Status by Sex by Age in Midway City

| Age Bracket | Male | Female |
| Under 5 Years | 0 (0.0%) | 0 (0.0%) |
| 5 to 17 Years | 56 (8.0%) | 0 (0.0%) |
| 18 to 34 Years | 30 (3.5%) | 55 (6.4%) |
| 35 to 64 Years | 376 (21.2%) | 193 (12.0%) |
| 65 to 74 Years | 54 (27.1%) | 87 (25.4%) |
| 75 Years and over | 241 (83.4%) | 217 (65.0%) |
Disability Class by Sex by Age in Midway City
Disability Class: Hearing Difficulty
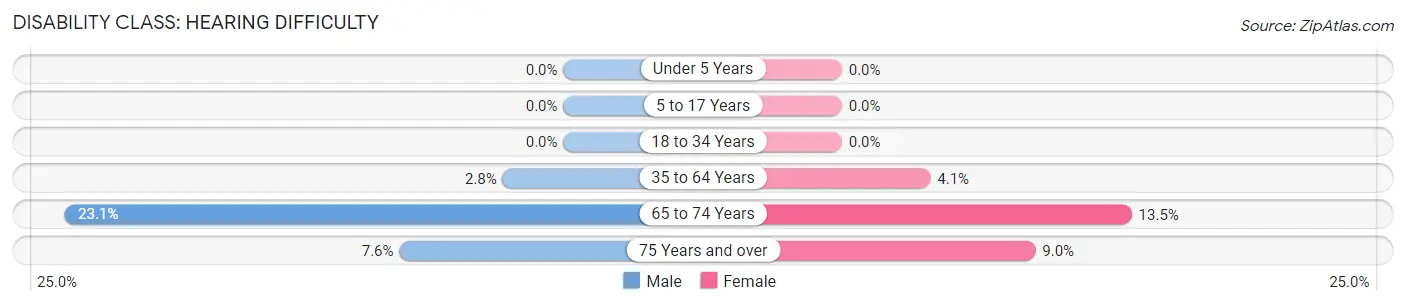
| Age Bracket | Male | Female |
| Under 5 Years | 0 (0.0%) | 0 (0.0%) |
| 5 to 17 Years | 0 (0.0%) | 0 (0.0%) |
| 18 to 34 Years | 0 (0.0%) | 0 (0.0%) |
| 35 to 64 Years | 50 (2.8%) | 66 (4.1%) |
| 65 to 74 Years | 46 (23.1%) | 46 (13.5%) |
| 75 Years and over | 22 (7.6%) | 30 (9.0%) |
Disability Class: Vision Difficulty
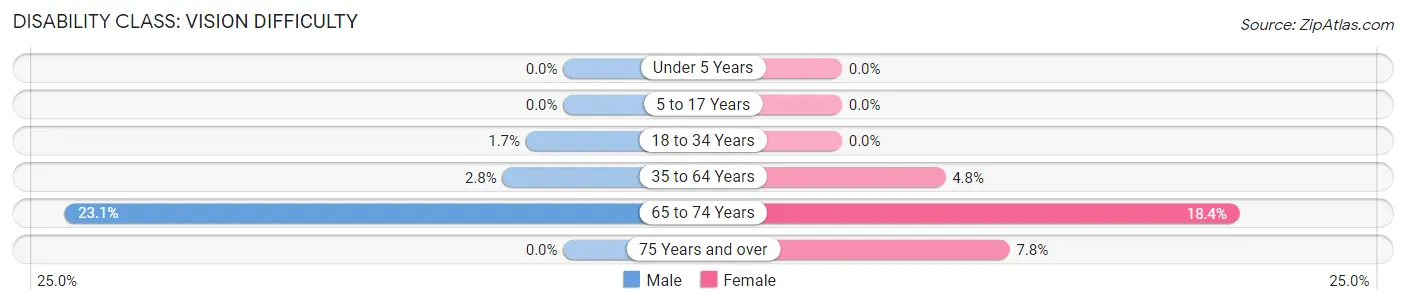
| Age Bracket | Male | Female |
| Under 5 Years | 0 (0.0%) | 0 (0.0%) |
| 5 to 17 Years | 0 (0.0%) | 0 (0.0%) |
| 18 to 34 Years | 15 (1.7%) | 0 (0.0%) |
| 35 to 64 Years | 50 (2.8%) | 77 (4.8%) |
| 65 to 74 Years | 46 (23.1%) | 63 (18.4%) |
| 75 Years and over | 0 (0.0%) | 26 (7.8%) |
Disability Class: Cognitive Difficulty
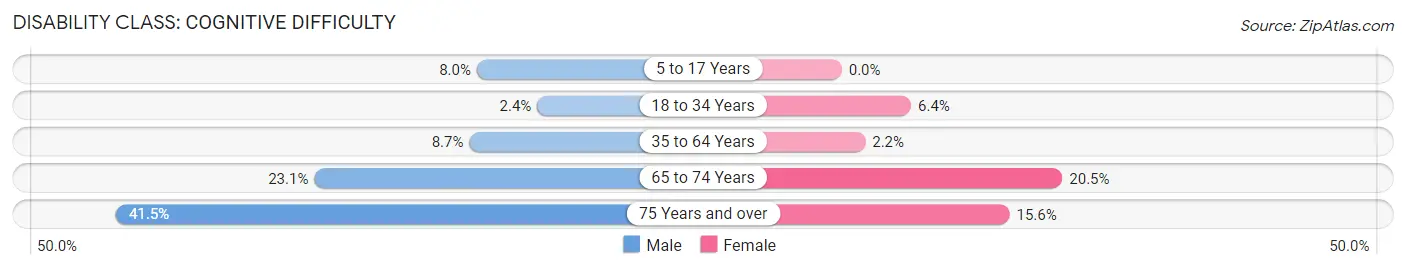
| Age Bracket | Male | Female |
| 5 to 17 Years | 56 (8.0%) | 0 (0.0%) |
| 18 to 34 Years | 21 (2.4%) | 55 (6.4%) |
| 35 to 64 Years | 155 (8.7%) | 35 (2.2%) |
| 65 to 74 Years | 46 (23.1%) | 70 (20.5%) |
| 75 Years and over | 120 (41.5%) | 52 (15.6%) |
Disability Class: Ambulatory Difficulty
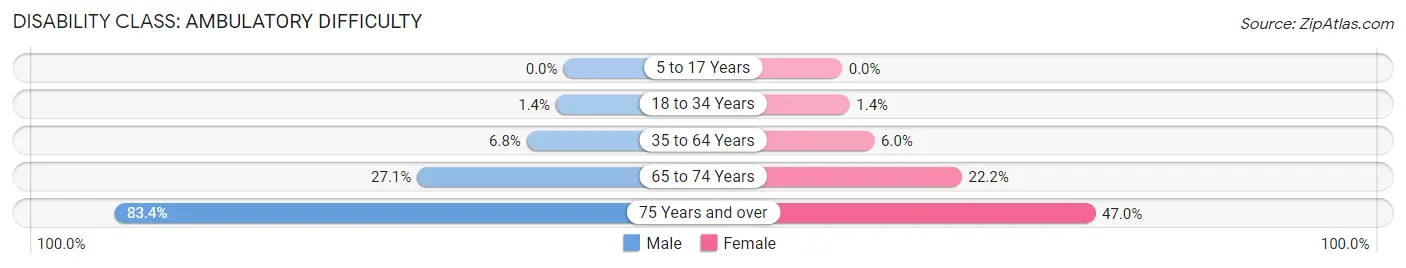
| Age Bracket | Male | Female |
| 5 to 17 Years | 0 (0.0%) | 0 (0.0%) |
| 18 to 34 Years | 12 (1.4%) | 12 (1.4%) |
| 35 to 64 Years | 121 (6.8%) | 96 (6.0%) |
| 65 to 74 Years | 54 (27.1%) | 76 (22.2%) |
| 75 Years and over | 241 (83.4%) | 157 (47.0%) |
Disability Class: Self-Care Difficulty
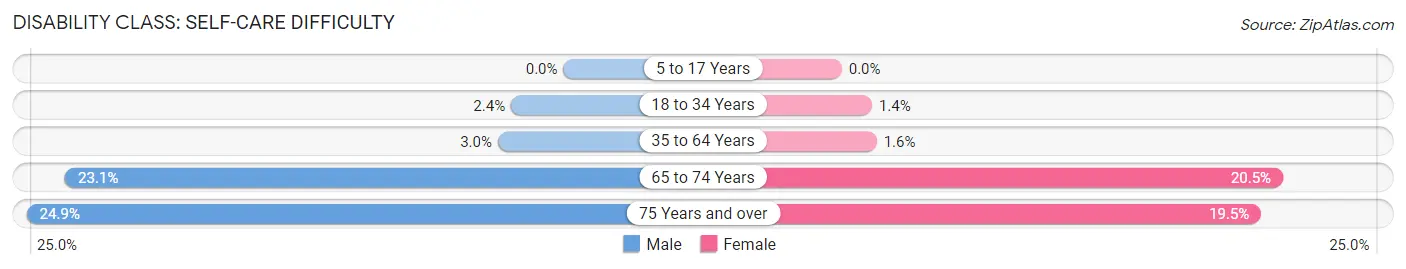
| Age Bracket | Male | Female |
| 5 to 17 Years | 0 (0.0%) | 0 (0.0%) |
| 18 to 34 Years | 21 (2.4%) | 12 (1.4%) |
| 35 to 64 Years | 54 (3.0%) | 26 (1.6%) |
| 65 to 74 Years | 46 (23.1%) | 70 (20.5%) |
| 75 Years and over | 72 (24.9%) | 65 (19.5%) |
Technology Access in Midway City
Computing Device Access in Midway City
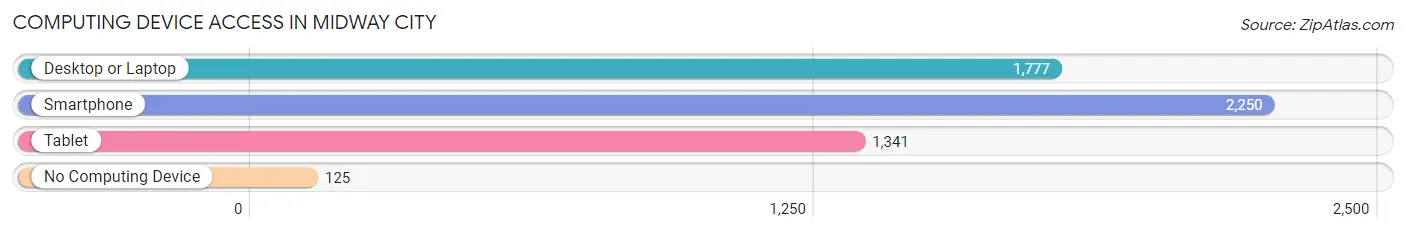
| Device Type | # Households | % Households |
| Desktop or Laptop | 1,777 | 71.0% |
| Smartphone | 2,250 | 89.9% |
| Tablet | 1,341 | 53.6% |
| No Computing Device | 125 | 5.0% |
| Total | 2,502 | 100.0% |
Internet Access in Midway City
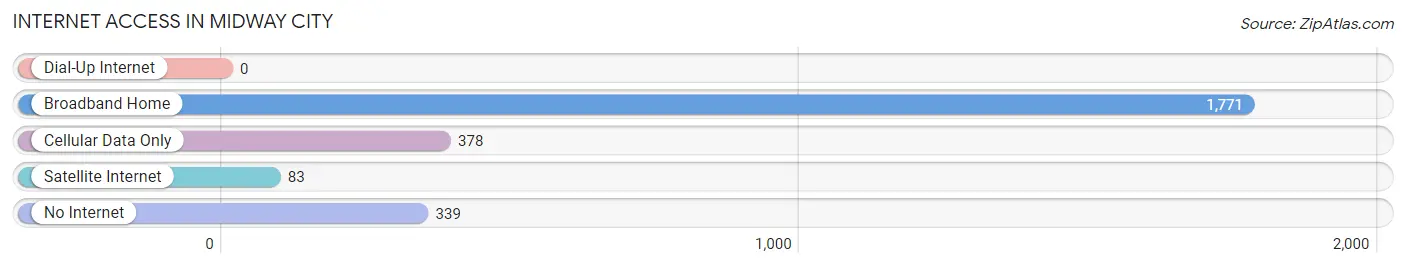
| Internet Type | # Households | % Households |
| Dial-Up Internet | 0 | 0.0% |
| Broadband Home | 1,771 | 70.8% |
| Cellular Data Only | 378 | 15.1% |
| Satellite Internet | 83 | 3.3% |
| No Internet | 339 | 13.6% |
| Total | 2,502 | 100.0% |
Midway City Summary
Midway City is a census-designated place located in Orange County, California. It is located in the northwestern corner of the county, bordered by Westminster to the north, Huntington Beach to the south, and Garden Grove to the east. The population was 8,485 at the 2010 census.
History
Midway City was originally part of the 17,000-acre (69 km2) Rancho Los Alamitos, which was granted to Juan Jose Dominguez by the Spanish Empire in 1784. The rancho was divided in 1834, and the area that is now Midway City was part of the 5,000-acre (20 km2) portion given to Manuel Nieto. The area was then acquired by the Bixby family, who developed it into a dairy farm.
In the 1920s, Midway City was known as Dairyland, and was home to the Dairyland Creamery, which was owned by the Bixby family. The Dairyland Creamery was the first creamery in Orange County, and was known for its high-quality butter and ice cream. The Dairyland Creamery closed in the 1950s, and the area was then developed into a residential community.
Geography
Midway City is located at 33°43'25" North, 118°1'48" West (33.723571, -118.030090). According to the United States Census Bureau, the CDP has a total area of 0.9 square miles (2.3 km2), all of it land.
Economy
Midway City is primarily a residential community, and does not have a major commercial or industrial base. The primary employers in the area are in the retail and service industries.
Demographics
As of the census of 2000, there were 8,485 people, 2,919 households, and 2,072 families residing in the CDP. The population density was 9,541.3 people per square mile (3,689.2/km2). There were 3,003 housing units at an average density of 3,364.3 per square mile (1,299.2/km2). The racial makeup of the CDP was 57.2% White, 2.2% African American, 0.7% Native American, 17.2% Asian, 0.3% Pacific Islander, 17.2% from other races, and 5.2% from two or more races. Hispanic or Latino of any race were 33.2% of the population.
There were 2,919 households, out of which 33.2% had children under the age of 18 living with them, 48.2% were married couples living together, 14.2% had a female householder with no husband present, and 30.7% were non-families. 22.7% of all households were made up of individuals, and 6.2% had someone living alone who was 65 years of age or older. The average household size was 2.90 and the average family size was 3.41.
In the CDP, the population was spread out, with 25.2% under the age of 18, 9.2% from 18 to 24, 33.2% from 25 to 44, 22.2% from 45 to 64, and 10.2% who were 65 years of age or older. The median age was 34 years. For every 100 females, there were 97.2 males. For every 100 females age 18 and over, there were 94.2 males.
The median income for a household in the CDP was $45,845, and the median income for a family was $50,813. Males had a median income of $35,945 versus $30,935 for females. The per capita income for the CDP was $19,945. About 8.2% of families and 10.3% of the population were below the poverty line, including 13.2% of those under age 18 and 6.2% of those age 65 or over.
Common Questions
What is Per Capita Income in Midway City?
Per Capita income in Midway City is $28,277.
What is the Median Family Income in Midway City?
Median Family Income in Midway City is $78,807.
What is the Median Household income in Midway City?
Median Household Income in Midway City is $62,176.
What is Income or Wage Gap in Midway City?
Income or Wage Gap in Midway City is 24.6%.
Women in Midway City earn 75.4 cents for every dollar earned by a man.
What is Family Income Deficit in Midway City?
Family Income Deficit in Midway City is $14,007.
Families that are below poverty line in Midway City earn $14,007 less on average than the poverty threshold level.
What is Inequality or Gini Index in Midway City?
Inequality or Gini Index in Midway City is 0.53.
What is the Total Population of Midway City?
Total Population of Midway City is 8,032.
What is the Total Male Population of Midway City?
Total Male Population of Midway City is 4,110.
What is the Total Female Population of Midway City?
Total Female Population of Midway City is 3,922.
What is the Ratio of Males per 100 Females in Midway City?
There are 104.79 Males per 100 Females in Midway City.
What is the Ratio of Females per 100 Males in Midway City?
There are 95.43 Females per 100 Males in Midway City.
What is the Median Population Age in Midway City?
Median Population Age in Midway City is 40.5 Years.
What is the Average Family Size in Midway City
Average Family Size in Midway City is 3.6 People.
What is the Average Household Size in Midway City
Average Household Size in Midway City is 3.2 People.
How Large is the Labor Force in Midway City?
There are 3,718 People in the Labor Forcein in Midway City.
What is the Percentage of People in the Labor Force in Midway City?
56.7% of People are in the Labor Force in Midway City.
What is the Unemployment Rate in Midway City?
Unemployment Rate in Midway City is 8.9%.