Zip Codes with the Highest Percentage of Households Without a Vehicle in Porterville, CA
RELATED REPORTS & OPTIONS
Households without a Cars
Porterville
Compare Zip Codes
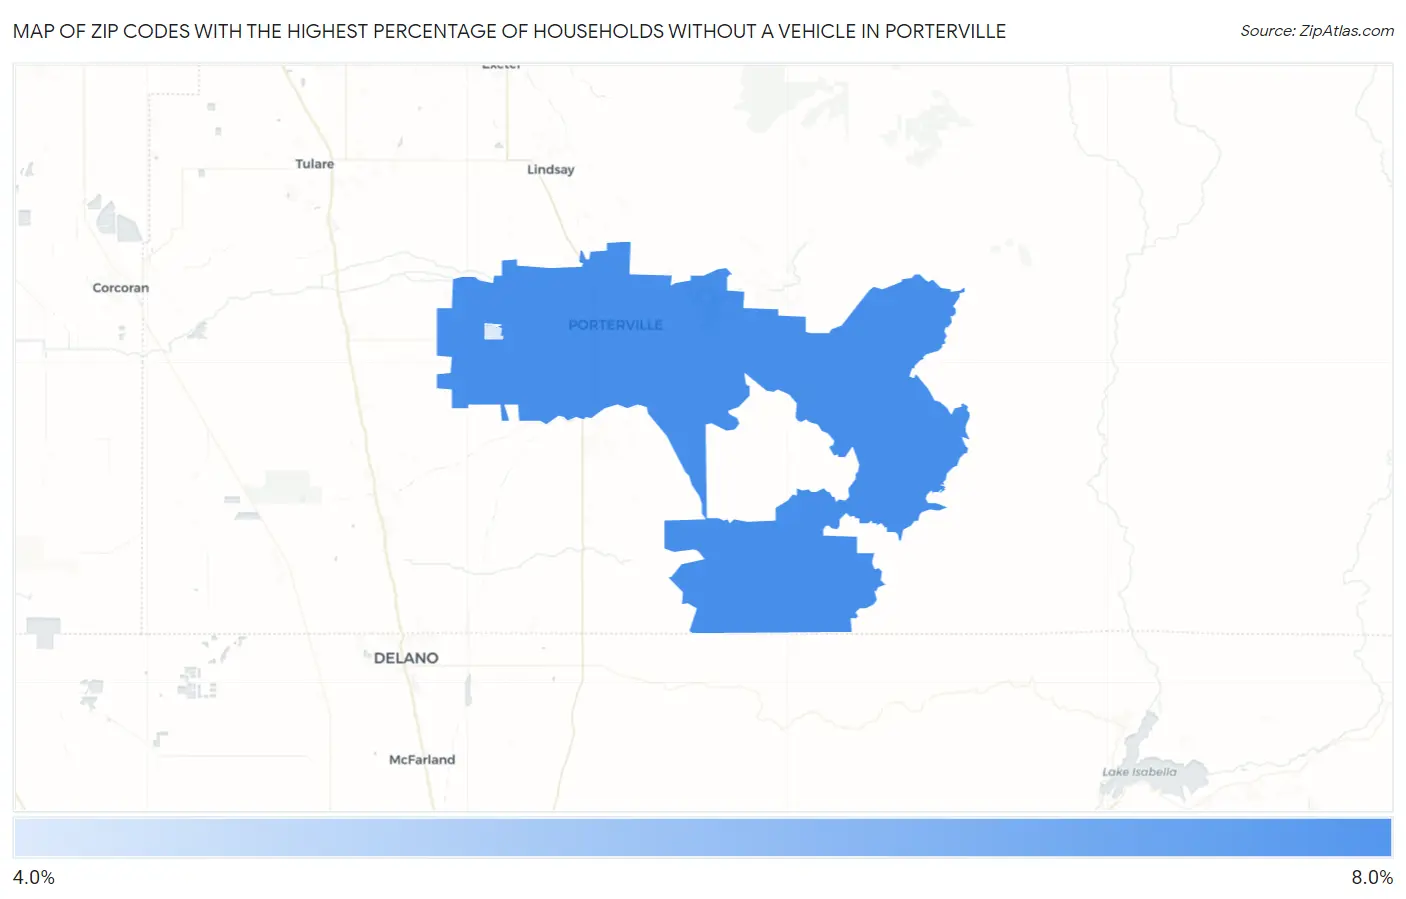
Map of Zip Codes with the Highest Percentage of Households Without a Vehicle in Porterville
4.3%
6.7%
Zip Codes with the Highest Percentage of Households Without a Vehicle in Porterville, CA
| Zip Code | Housholds Without a Car | vs State | vs National | |
| 1. | 93257 | 6.7% | 6.9%(-0.200)#491 | 8.3%(-1.60)#8,998 |
| 2. | 93258 | 4.3% | 6.9%(-2.60)#871 | 8.3%(-4.00)#15,017 |
1
Common Questions
What are the Top Zip Codes with the Highest Percentage of Households Without a Vehicle in Porterville, CA?
Top Zip Codes with the Highest Percentage of Households Without a Vehicle in Porterville, CA are:
What zip code has the Highest Percentage of Households Without a Vehicle in Porterville, CA?
93257 has the Highest Percentage of Households Without a Vehicle in Porterville, CA with 6.7%.
What is the Percentage of Households Without a Vehicle in Porterville, CA?
Percentage of Households Without a Vehicle in Porterville is 5.9%.
What is the Percentage of Households Without a Vehicle in California?
Percentage of Households Without a Vehicle in California is 6.9%.
What is the Percentage of Households Without a Vehicle in the United States?
Percentage of Households Without a Vehicle in the United States is 8.3%.