Cities with the Highest Percentage of Households Without a Vehicle in Pennsylvania
RELATED REPORTS & OPTIONS
Households without a Cars
Pennsylvania
Compare Cities
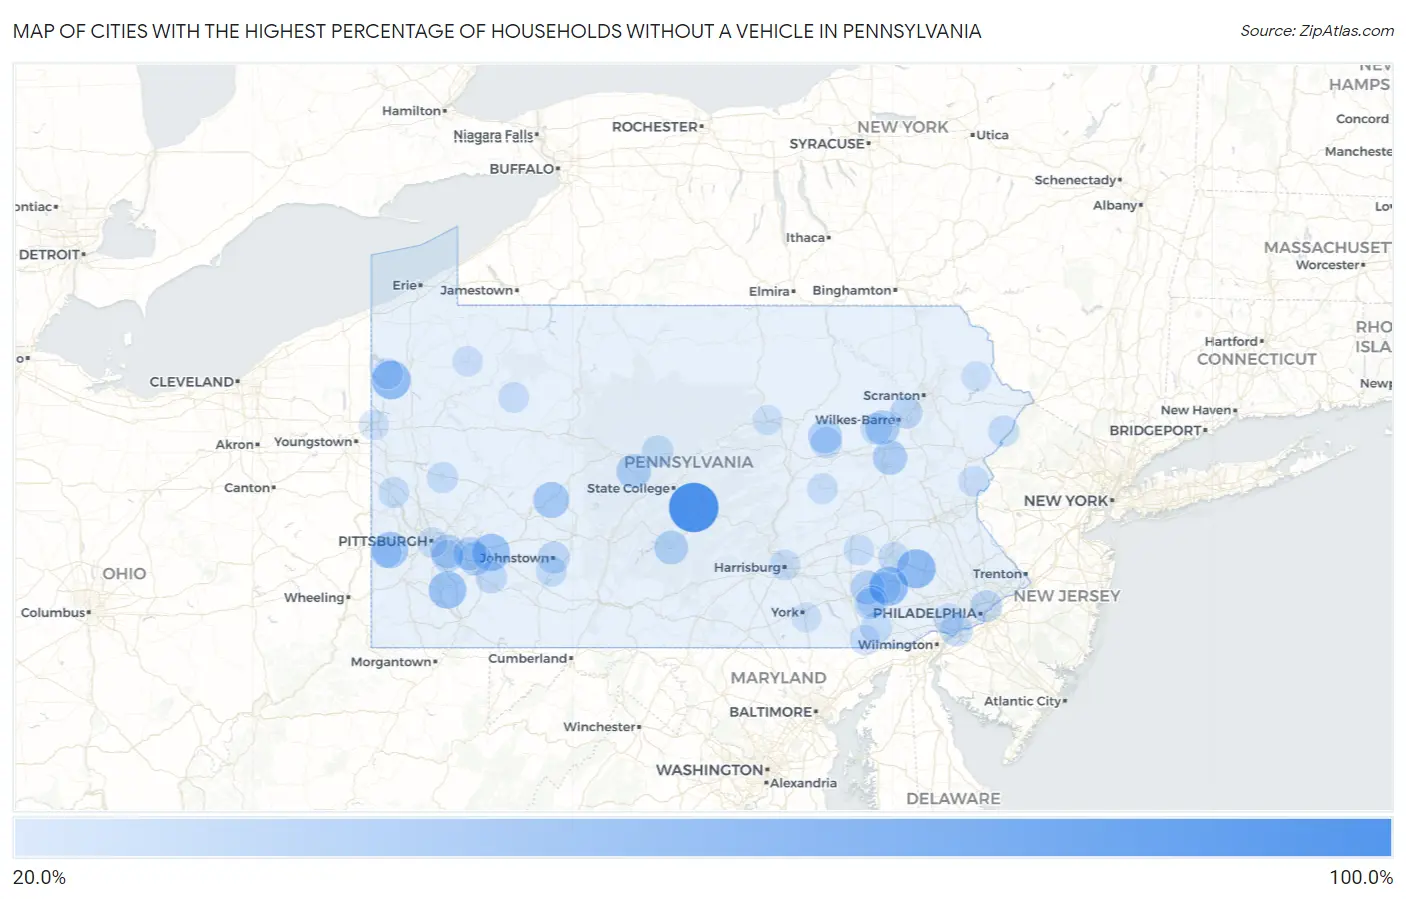
Map of Cities with the Highest Percentage of Households Without a Vehicle in Pennsylvania
0.0%
100.0%
Cities with the Highest Percentage of Households Without a Vehicle in Pennsylvania
| City | Housholds Without a Car | vs State | vs National | |
| 1. | Barrville | 100.0% | 10.6%(+89.4)#1 | 8.3%(+91.7)#24 |
| 2. | Curryville | 56.3% | 10.6%(+45.7)#2 | 8.3%(+48.0)#203 |
| 3. | Douglassville | 56.2% | 10.6%(+45.6)#3 | 8.3%(+47.9)#204 |
| 4. | Atlantic | 55.0% | 10.6%(+44.4)#4 | 8.3%(+46.7)#208 |
| 5. | Churchtown | 54.7% | 10.6%(+44.1)#5 | 8.3%(+46.4)#211 |
| 6. | Naomi | 50.0% | 10.6%(+39.4)#6 | 8.3%(+41.7)#234 |
| 7. | Crabtree | 49.7% | 10.6%(+39.1)#7 | 8.3%(+41.4)#242 |
| 8. | Mount Oliver Borough | 46.2% | 10.6%(+35.6)#8 | 8.3%(+37.9)#267 |
| 9. | Joffre | 45.1% | 10.6%(+34.5)#9 | 8.3%(+36.8)#280 |
| 10. | Commodore | 43.8% | 10.6%(+33.2)#10 | 8.3%(+35.5)#293 |
| 11. | Ore Hill | 43.7% | 10.6%(+33.1)#11 | 8.3%(+35.4)#295 |
| 12. | Braddock Borough | 41.7% | 10.6%(+31.1)#12 | 8.3%(+33.4)#322 |
| 13. | North Philipsburg | 38.2% | 10.6%(+27.6)#13 | 8.3%(+29.9)#364 |
| 14. | Rankin Borough | 38.0% | 10.6%(+27.4)#14 | 8.3%(+29.7)#370 |
| 15. | Lattimer | 38.0% | 10.6%(+27.4)#15 | 8.3%(+29.7)#372 |
| 16. | Sheatown | 37.5% | 10.6%(+26.9)#16 | 8.3%(+29.2)#378 |
| 17. | Homestead Borough | 37.1% | 10.6%(+26.5)#17 | 8.3%(+28.8)#388 |
| 18. | Homewood At Martinsburg | 36.5% | 10.6%(+25.9)#18 | 8.3%(+28.2)#399 |
| 19. | Cedar Crest | 35.7% | 10.6%(+25.1)#19 | 8.3%(+27.4)#413 |
| 20. | Iola | 35.6% | 10.6%(+25.0)#20 | 8.3%(+27.3)#417 |
| 21. | Georgetown Cdp Lancaster County | 35.4% | 10.6%(+24.8)#21 | 8.3%(+27.1)#423 |
| 22. | Duquesne | 34.4% | 10.6%(+23.8)#22 | 8.3%(+26.1)#448 |
| 23. | Grapeville | 34.3% | 10.6%(+23.7)#23 | 8.3%(+26.0)#454 |
| 24. | East Pittsburgh Borough | 34.1% | 10.6%(+23.5)#24 | 8.3%(+25.8)#457 |
| 25. | Farmersville | 34.0% | 10.6%(+23.4)#25 | 8.3%(+25.7)#459 |
| 26. | Mckees Rocks Borough | 33.9% | 10.6%(+23.3)#26 | 8.3%(+25.6)#462 |
| 27. | Harrison City | 33.8% | 10.6%(+23.2)#27 | 8.3%(+25.5)#466 |
| 28. | Braddock Hills Borough | 31.7% | 10.6%(+21.1)#28 | 8.3%(+23.4)#527 |
| 29. | Chester | 30.4% | 10.6%(+19.8)#29 | 8.3%(+22.1)#565 |
| 30. | North Braddock Borough | 30.2% | 10.6%(+19.6)#30 | 8.3%(+21.9)#574 |
| 31. | Blawnox Borough | 30.0% | 10.6%(+19.4)#31 | 8.3%(+21.7)#580 |
| 32. | Wilkinsburg Borough | 29.9% | 10.6%(+19.3)#32 | 8.3%(+21.6)#594 |
| 33. | Darby Borough | 29.7% | 10.6%(+19.1)#33 | 8.3%(+21.4)#602 |
| 34. | Colwyn Borough | 29.7% | 10.6%(+19.1)#34 | 8.3%(+21.4)#603 |
| 35. | Inkerman | 29.4% | 10.6%(+18.8)#35 | 8.3%(+21.1)#617 |
| 36. | Dushore Borough | 29.3% | 10.6%(+18.7)#36 | 8.3%(+21.0)#623 |
| 37. | Johnstown | 28.8% | 10.6%(+18.2)#37 | 8.3%(+20.5)#641 |
| 38. | Mckeesport | 28.4% | 10.6%(+17.8)#38 | 8.3%(+20.1)#659 |
| 39. | Wilmerding Borough | 28.3% | 10.6%(+17.7)#39 | 8.3%(+20.0)#665 |
| 40. | Philadelphia | 28.2% | 10.6%(+17.6)#40 | 8.3%(+19.9)#670 |
| 41. | East Lansdowne Borough | 27.9% | 10.6%(+17.3)#41 | 8.3%(+19.6)#682 |
| 42. | Eyers Grove | 27.5% | 10.6%(+16.9)#42 | 8.3%(+19.2)#703 |
| 43. | Goodville | 27.4% | 10.6%(+16.8)#43 | 8.3%(+19.1)#705 |
| 44. | Intercourse | 27.2% | 10.6%(+16.6)#44 | 8.3%(+18.9)#714 |
| 45. | Moshannon | 27.0% | 10.6%(+16.4)#45 | 8.3%(+18.7)#728 |
| 46. | Cherry Valley Borough | 27.0% | 10.6%(+16.4)#46 | 8.3%(+18.7)#729 |
| 47. | Mammoth | 26.9% | 10.6%(+16.3)#47 | 8.3%(+18.6)#735 |
| 48. | Oreminea | 26.4% | 10.6%(+15.8)#48 | 8.3%(+18.1)#763 |
| 49. | Dale Borough | 26.2% | 10.6%(+15.6)#49 | 8.3%(+17.9)#774 |
| 50. | Briar Creek Borough | 26.2% | 10.6%(+15.6)#50 | 8.3%(+17.9)#775 |
| 51. | Glen Lyon | 26.1% | 10.6%(+15.5)#51 | 8.3%(+17.8)#781 |
| 52. | Honesdale Borough | 25.8% | 10.6%(+15.2)#52 | 8.3%(+17.5)#797 |
| 53. | Pocono Ranch Lands | 25.7% | 10.6%(+15.1)#53 | 8.3%(+17.4)#805 |
| 54. | Kirkwood | 25.6% | 10.6%(+15.0)#54 | 8.3%(+17.3)#815 |
| 55. | Sharpsburg Borough | 25.2% | 10.6%(+14.6)#55 | 8.3%(+16.9)#832 |
| 56. | North Charleroi Borough | 25.1% | 10.6%(+14.5)#56 | 8.3%(+16.8)#837 |
| 57. | Butler | 24.9% | 10.6%(+14.3)#57 | 8.3%(+16.6)#864 |
| 58. | Gordonville | 24.9% | 10.6%(+14.3)#58 | 8.3%(+16.6)#866 |
| 59. | Reading | 24.8% | 10.6%(+14.2)#59 | 8.3%(+16.5)#867 |
| 60. | Beaver Falls | 24.8% | 10.6%(+14.2)#60 | 8.3%(+16.5)#868 |
| 61. | Aaronsburg Cdp Centre County | 24.3% | 10.6%(+13.7)#61 | 8.3%(+16.0)#901 |
| 62. | Davidsville | 24.2% | 10.6%(+13.6)#62 | 8.3%(+15.9)#911 |
| 63. | Harrisburg | 24.0% | 10.6%(+13.4)#63 | 8.3%(+15.7)#922 |
| 64. | Charleroi Borough | 24.0% | 10.6%(+13.4)#64 | 8.3%(+15.7)#923 |
| 65. | Lima | 23.9% | 10.6%(+13.3)#65 | 8.3%(+15.6)#930 |
| 66. | Hartstown | 23.8% | 10.6%(+13.2)#66 | 8.3%(+15.5)#947 |
| 67. | Burnside Borough | 23.6% | 10.6%(+13.0)#67 | 8.3%(+15.3)#963 |
| 68. | Slovan | 23.5% | 10.6%(+12.9)#68 | 8.3%(+15.2)#971 |
| 69. | Aaronsburg Cdp Washington County | 23.5% | 10.6%(+12.9)#69 | 8.3%(+15.2)#974 |
| 70. | Shamokin | 23.3% | 10.6%(+12.7)#70 | 8.3%(+15.0)#983 |
| 71. | Crown | 23.2% | 10.6%(+12.6)#71 | 8.3%(+14.9)#1,003 |
| 72. | Ackermanville | 23.0% | 10.6%(+12.4)#72 | 8.3%(+14.7)#1,016 |
| 73. | Mahanoy City Borough | 22.8% | 10.6%(+12.2)#73 | 8.3%(+14.5)#1,023 |
| 74. | Stouchsburg | 22.8% | 10.6%(+12.2)#74 | 8.3%(+14.5)#1,027 |
| 75. | Milford Borough | 22.7% | 10.6%(+12.1)#75 | 8.3%(+14.4)#1,031 |
| 76. | Fountain Hill Borough | 22.6% | 10.6%(+12.0)#76 | 8.3%(+14.3)#1,036 |
| 77. | Tarentum Borough | 22.4% | 10.6%(+11.8)#77 | 8.3%(+14.1)#1,058 |
| 78. | Rochester Borough | 22.4% | 10.6%(+11.8)#78 | 8.3%(+14.1)#1,059 |
| 79. | Millvale Borough | 22.4% | 10.6%(+11.8)#79 | 8.3%(+14.1)#1,060 |
| 80. | Millbourne Borough | 22.4% | 10.6%(+11.8)#80 | 8.3%(+14.1)#1,065 |
| 81. | State College Borough | 22.3% | 10.6%(+11.7)#81 | 8.3%(+14.0)#1,077 |
| 82. | Wakefield | 22.1% | 10.6%(+11.5)#82 | 8.3%(+13.8)#1,113 |
| 83. | New Brighton Borough | 22.0% | 10.6%(+11.4)#83 | 8.3%(+13.7)#1,118 |
| 84. | Donora Borough | 21.9% | 10.6%(+11.3)#84 | 8.3%(+13.6)#1,132 |
| 85. | Athens Borough | 21.9% | 10.6%(+11.3)#85 | 8.3%(+13.6)#1,133 |
| 86. | Pittsburgh | 21.8% | 10.6%(+11.2)#86 | 8.3%(+13.5)#1,143 |
| 87. | Titusville | 21.8% | 10.6%(+11.2)#87 | 8.3%(+13.5)#1,148 |
| 88. | Avalon Borough | 21.7% | 10.6%(+11.1)#88 | 8.3%(+13.4)#1,156 |
| 89. | Valencia Borough | 21.7% | 10.6%(+11.1)#89 | 8.3%(+13.4)#1,158 |
| 90. | Ambridge Borough | 21.5% | 10.6%(+10.9)#90 | 8.3%(+13.2)#1,174 |
| 91. | Munhall Borough | 21.4% | 10.6%(+10.8)#91 | 8.3%(+13.1)#1,190 |
| 92. | Canton Borough | 21.4% | 10.6%(+10.8)#92 | 8.3%(+13.1)#1,194 |
| 93. | Minersville Borough | 21.3% | 10.6%(+10.7)#93 | 8.3%(+13.0)#1,209 |
| 94. | Farrell | 21.3% | 10.6%(+10.7)#94 | 8.3%(+13.0)#1,210 |
| 95. | Williamsport | 21.1% | 10.6%(+10.5)#95 | 8.3%(+12.8)#1,238 |
| 96. | White Mills | 21.0% | 10.6%(+10.4)#96 | 8.3%(+12.7)#1,261 |
| 97. | Collingdale Borough | 20.9% | 10.6%(+10.3)#97 | 8.3%(+12.6)#1,267 |
| 98. | Ashland Borough | 20.9% | 10.6%(+10.3)#98 | 8.3%(+12.6)#1,269 |
| 99. | Tyler Run | 20.9% | 10.6%(+10.3)#99 | 8.3%(+12.6)#1,271 |
| 100. | Kittanning Borough | 20.8% | 10.6%(+10.2)#100 | 8.3%(+12.5)#1,283 |
Common Questions
What are the Top 10 Cities with the Highest Percentage of Households Without a Vehicle in Pennsylvania?
Top 10 Cities with the Highest Percentage of Households Without a Vehicle in Pennsylvania are:
#1
100.0%
#2
56.2%
#3
55.0%
#4
54.7%
#5
50.0%
#6
49.7%
#7
45.1%
#8
43.8%
#9
38.2%
#10
38.0%
What city has the Highest Percentage of Households Without a Vehicle in Pennsylvania?
Barrville has the Highest Percentage of Households Without a Vehicle in Pennsylvania with 100.0%.
What is the Percentage of Households Without a Vehicle in the State of Pennsylvania?
Percentage of Households Without a Vehicle in Pennsylvania is 10.6%.
What is the Percentage of Households Without a Vehicle in the United States?
Percentage of Households Without a Vehicle in the United States is 8.3%.