Cities with the Highest Percentage of Households Without a Vehicle in Tennessee
RELATED REPORTS & OPTIONS
Households without a Cars
Tennessee
Compare Cities
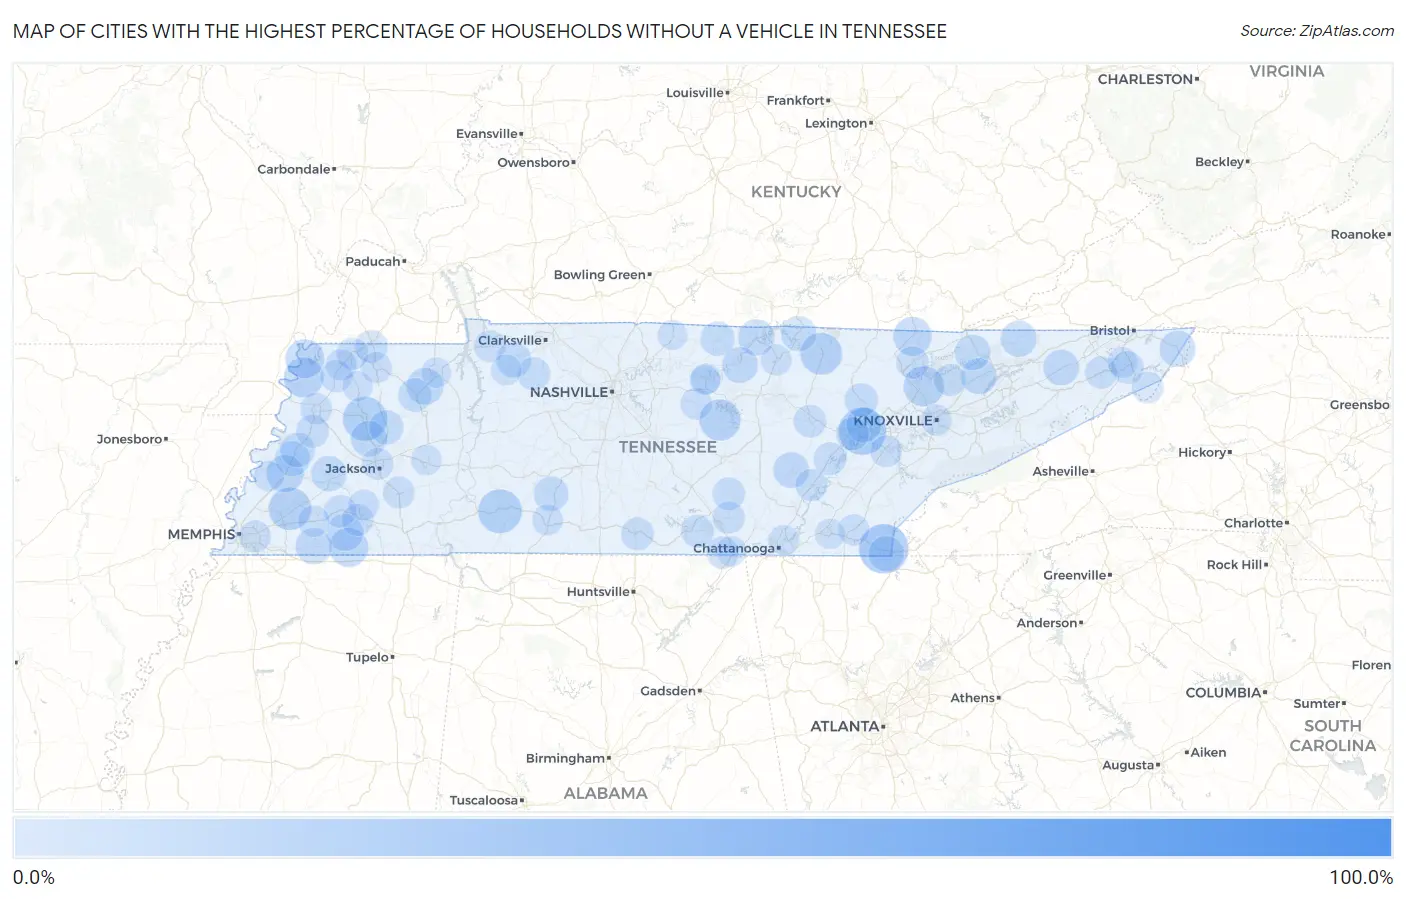
Map of Cities with the Highest Percentage of Households Without a Vehicle in Tennessee
0.0%
100.0%
Cities with the Highest Percentage of Households Without a Vehicle in Tennessee
| City | Housholds Without a Car | vs State | vs National | |
| 1. | Sherwood | 100.0% | 5.3%(+94.7)#1 | 8.3%(+91.7)#57 |
| 2. | Holladay | 70.6% | 5.3%(+65.3)#2 | 8.3%(+62.3)#153 |
| 3. | Dukedom | 52.8% | 5.3%(+47.5)#3 | 8.3%(+44.5)#222 |
| 4. | Miston | 52.3% | 5.3%(+47.0)#4 | 8.3%(+44.0)#225 |
| 5. | Ducktown | 32.8% | 5.3%(+27.5)#5 | 8.3%(+24.5)#498 |
| 6. | Midtown | 30.4% | 5.3%(+25.1)#6 | 8.3%(+22.1)#567 |
| 7. | Trenton | 26.1% | 5.3%(+20.8)#7 | 8.3%(+17.8)#780 |
| 8. | Waynesboro | 25.8% | 5.3%(+20.5)#8 | 8.3%(+17.5)#798 |
| 9. | Gallaway | 24.1% | 5.3%(+18.8)#9 | 8.3%(+15.8)#919 |
| 10. | Jamestown | 23.2% | 5.3%(+17.9)#10 | 8.3%(+14.9)#997 |
| 11. | Smithville | 22.5% | 5.3%(+17.2)#11 | 8.3%(+14.2)#1,049 |
| 12. | Hickman | 21.8% | 5.3%(+16.5)#12 | 8.3%(+13.5)#1,154 |
| 13. | Andersonville | 21.4% | 5.3%(+16.1)#13 | 8.3%(+13.1)#1,203 |
| 14. | Ridgely | 20.7% | 5.3%(+15.4)#14 | 8.3%(+12.4)#1,302 |
| 15. | Saulsbury | 19.7% | 5.3%(+14.4)#15 | 8.3%(+11.4)#1,464 |
| 16. | Tiptonville | 19.6% | 5.3%(+14.3)#16 | 8.3%(+11.3)#1,474 |
| 17. | Jellico | 19.4% | 5.3%(+14.1)#17 | 8.3%(+11.1)#1,516 |
| 18. | Nixon | 17.6% | 5.3%(+12.3)#18 | 8.3%(+9.30)#1,882 |
| 19. | Covington | 17.5% | 5.3%(+12.2)#19 | 8.3%(+9.20)#1,891 |
| 20. | Randolph | 17.4% | 5.3%(+12.1)#20 | 8.3%(+9.10)#1,942 |
| 21. | Hickory Valley | 17.0% | 5.3%(+11.7)#21 | 8.3%(+8.70)#2,037 |
| 22. | Henry | 16.9% | 5.3%(+11.6)#22 | 8.3%(+8.60)#2,058 |
| 23. | Moscow | 16.3% | 5.3%(+11.0)#23 | 8.3%(+8.00)#2,238 |
| 24. | Celina | 16.2% | 5.3%(+10.9)#24 | 8.3%(+7.90)#2,260 |
| 25. | Mountain City | 15.9% | 5.3%(+10.6)#25 | 8.3%(+7.60)#2,346 |
| 26. | Sneedville | 15.9% | 5.3%(+10.6)#26 | 8.3%(+7.60)#2,350 |
| 27. | Gainesboro | 15.8% | 5.3%(+10.5)#27 | 8.3%(+7.50)#2,396 |
| 28. | Humboldt | 15.7% | 5.3%(+10.4)#28 | 8.3%(+7.40)#2,422 |
| 29. | Pikeville | 15.6% | 5.3%(+10.3)#29 | 8.3%(+7.30)#2,465 |
| 30. | Rutledge | 15.6% | 5.3%(+10.3)#30 | 8.3%(+7.30)#2,468 |
| 31. | Mcdonald | 15.6% | 5.3%(+10.3)#31 | 8.3%(+7.30)#2,475 |
| 32. | Baileyton | 15.6% | 5.3%(+10.3)#32 | 8.3%(+7.30)#2,479 |
| 33. | New Tazewell | 15.5% | 5.3%(+10.2)#33 | 8.3%(+7.20)#2,504 |
| 34. | Copperhill | 15.3% | 5.3%(+10.00)#34 | 8.3%(+7.00)#2,599 |
| 35. | Brownsville | 15.1% | 5.3%(+9.80)#35 | 8.3%(+6.80)#2,644 |
| 36. | Byrdstown | 15.1% | 5.3%(+9.80)#36 | 8.3%(+6.80)#2,658 |
| 37. | Hampton | 15.0% | 5.3%(+9.70)#37 | 8.3%(+6.70)#2,691 |
| 38. | Harriman | 14.6% | 5.3%(+9.30)#38 | 8.3%(+6.30)#2,829 |
| 39. | Henning | 14.6% | 5.3%(+9.30)#39 | 8.3%(+6.30)#2,847 |
| 40. | Orebank | 14.6% | 5.3%(+9.30)#40 | 8.3%(+6.30)#2,851 |
| 41. | Cumberland City | 14.5% | 5.3%(+9.20)#41 | 8.3%(+6.20)#2,902 |
| 42. | Summertown | 14.4% | 5.3%(+9.10)#42 | 8.3%(+6.10)#2,950 |
| 43. | Ripley | 14.3% | 5.3%(+9.00)#43 | 8.3%(+6.00)#2,968 |
| 44. | Milan | 13.9% | 5.3%(+8.60)#44 | 8.3%(+5.60)#3,137 |
| 45. | Red Boiling Springs | 13.8% | 5.3%(+8.50)#45 | 8.3%(+5.50)#3,201 |
| 46. | Mckenzie | 13.0% | 5.3%(+7.70)#46 | 8.3%(+4.70)#3,542 |
| 47. | Wartburg | 12.7% | 5.3%(+7.40)#47 | 8.3%(+4.40)#3,712 |
| 48. | Rockwood | 12.4% | 5.3%(+7.10)#48 | 8.3%(+4.10)#3,882 |
| 49. | Slayden | 12.2% | 5.3%(+6.90)#49 | 8.3%(+3.90)#4,038 |
| 50. | Spring City | 12.1% | 5.3%(+6.80)#50 | 8.3%(+3.80)#4,066 |
| 51. | Halls | 12.1% | 5.3%(+6.80)#51 | 8.3%(+3.80)#4,072 |
| 52. | Crossville | 11.9% | 5.3%(+6.60)#52 | 8.3%(+3.60)#4,175 |
| 53. | Cowan | 11.9% | 5.3%(+6.60)#53 | 8.3%(+3.60)#4,207 |
| 54. | Fayetteville | 11.8% | 5.3%(+6.50)#54 | 8.3%(+3.50)#4,253 |
| 55. | South Fulton | 11.8% | 5.3%(+6.50)#55 | 8.3%(+3.50)#4,270 |
| 56. | Whiteville | 11.7% | 5.3%(+6.40)#56 | 8.3%(+3.40)#4,332 |
| 57. | Sullivan Gardens | 11.7% | 5.3%(+6.40)#57 | 8.3%(+3.40)#4,344 |
| 58. | Altamont | 11.7% | 5.3%(+6.40)#58 | 8.3%(+3.40)#4,352 |
| 59. | Orme | 11.5% | 5.3%(+6.20)#59 | 8.3%(+3.20)#4,517 |
| 60. | La Follette | 11.4% | 5.3%(+6.10)#60 | 8.3%(+3.10)#4,533 |
| 61. | Elizabethton | 11.3% | 5.3%(+6.00)#61 | 8.3%(+3.00)#4,580 |
| 62. | Jonesborough | 11.3% | 5.3%(+6.00)#62 | 8.3%(+3.00)#4,586 |
| 63. | Dayton | 11.1% | 5.3%(+5.80)#63 | 8.3%(+2.80)#4,712 |
| 64. | Union City | 11.0% | 5.3%(+5.70)#64 | 8.3%(+2.70)#4,795 |
| 65. | Maynardville | 11.0% | 5.3%(+5.70)#65 | 8.3%(+2.70)#4,822 |
| 66. | Tracy City | 11.0% | 5.3%(+5.70)#66 | 8.3%(+2.70)#4,828 |
| 67. | Whiteside | 11.0% | 5.3%(+5.70)#67 | 8.3%(+2.70)#4,869 |
| 68. | Bolivar | 10.9% | 5.3%(+5.60)#68 | 8.3%(+2.60)#4,893 |
| 69. | Obion | 10.9% | 5.3%(+5.60)#69 | 8.3%(+2.60)#4,923 |
| 70. | Memphis | 10.7% | 5.3%(+5.40)#70 | 8.3%(+2.40)#5,033 |
| 71. | Jackson | 10.7% | 5.3%(+5.40)#71 | 8.3%(+2.40)#5,036 |
| 72. | Henderson | 10.7% | 5.3%(+5.40)#72 | 8.3%(+2.40)#5,054 |
| 73. | Dyersburg | 10.6% | 5.3%(+5.30)#73 | 8.3%(+2.30)#5,114 |
| 74. | Loudon | 10.6% | 5.3%(+5.30)#74 | 8.3%(+2.30)#5,124 |
| 75. | Roan Mountain | 10.6% | 5.3%(+5.30)#75 | 8.3%(+2.30)#5,171 |
| 76. | Somerville | 10.5% | 5.3%(+5.20)#76 | 8.3%(+2.20)#5,232 |
| 77. | Dover | 10.5% | 5.3%(+5.20)#77 | 8.3%(+2.20)#5,241 |
| 78. | Alexandria | 10.5% | 5.3%(+5.20)#78 | 8.3%(+2.20)#5,251 |
| 79. | Troy | 10.2% | 5.3%(+4.90)#79 | 8.3%(+1.90)#5,509 |
| 80. | Benton | 10.1% | 5.3%(+4.80)#80 | 8.3%(+1.80)#5,606 |
| 81. | Martin | 9.8% | 5.3%(+4.50)#81 | 8.3%(+1.50)#5,830 |
| 82. | Finley | 9.8% | 5.3%(+4.50)#82 | 8.3%(+1.50)#5,875 |
| 83. | Knoxville | 9.7% | 5.3%(+4.40)#83 | 8.3%(+1.40)#5,892 |
| 84. | Lawrenceburg | 9.7% | 5.3%(+4.40)#84 | 8.3%(+1.40)#5,912 |
| 85. | Livingston | 9.5% | 5.3%(+4.20)#85 | 8.3%(+1.20)#6,130 |
| 86. | Toone | 9.5% | 5.3%(+4.20)#86 | 8.3%(+1.20)#6,172 |
| 87. | Erin | 9.3% | 5.3%(+4.00)#87 | 8.3%(+1.00)#6,371 |
| 88. | Watauga | 9.3% | 5.3%(+4.00)#88 | 8.3%(+1.00)#6,384 |
| 89. | Lexington | 9.2% | 5.3%(+3.90)#89 | 8.3%(+0.900)#6,436 |
| 90. | Carthage | 9.2% | 5.3%(+3.90)#90 | 8.3%(+0.900)#6,462 |
| 91. | Burlison | 9.1% | 5.3%(+3.80)#91 | 8.3%(+0.800)#6,603 |
| 92. | East Cleveland | 9.0% | 5.3%(+3.70)#92 | 8.3%(+0.700)#6,699 |
| 93. | Chattanooga | 8.9% | 5.3%(+3.60)#93 | 8.3%(+0.600)#6,754 |
| 94. | Blanche | 8.9% | 5.3%(+3.60)#94 | 8.3%(+0.600)#6,855 |
| 95. | South Pittsburg | 8.8% | 5.3%(+3.50)#95 | 8.3%(+0.500)#6,909 |
| 96. | Kenton | 8.8% | 5.3%(+3.50)#96 | 8.3%(+0.500)#6,933 |
| 97. | Paris | 8.7% | 5.3%(+3.40)#97 | 8.3%(+0.400)#7,007 |
| 98. | Westmoreland | 8.7% | 5.3%(+3.40)#98 | 8.3%(+0.400)#7,037 |
| 99. | South Carthage | 8.7% | 5.3%(+3.40)#99 | 8.3%(+0.400)#7,047 |
| 100. | Butler | 8.7% | 5.3%(+3.40)#100 | 8.3%(+0.400)#7,084 |
Common Questions
What are the Top 10 Cities with the Highest Percentage of Households Without a Vehicle in Tennessee?
Top 10 Cities with the Highest Percentage of Households Without a Vehicle in Tennessee are:
#1
32.8%
#2
30.4%
#3
26.1%
#4
25.8%
#5
24.1%
#6
23.2%
#7
22.5%
#8
21.4%
#9
20.7%
#10
19.7%
What city has the Highest Percentage of Households Without a Vehicle in Tennessee?
Ducktown has the Highest Percentage of Households Without a Vehicle in Tennessee with 32.8%.
What is the Percentage of Households Without a Vehicle in the State of Tennessee?
Percentage of Households Without a Vehicle in Tennessee is 5.3%.
What is the Percentage of Households Without a Vehicle in the United States?
Percentage of Households Without a Vehicle in the United States is 8.3%.