Cities with the Highest Percentage of Households Without a Vehicle in Maryland
RELATED REPORTS & OPTIONS
Households without a Cars
Maryland
Compare Cities
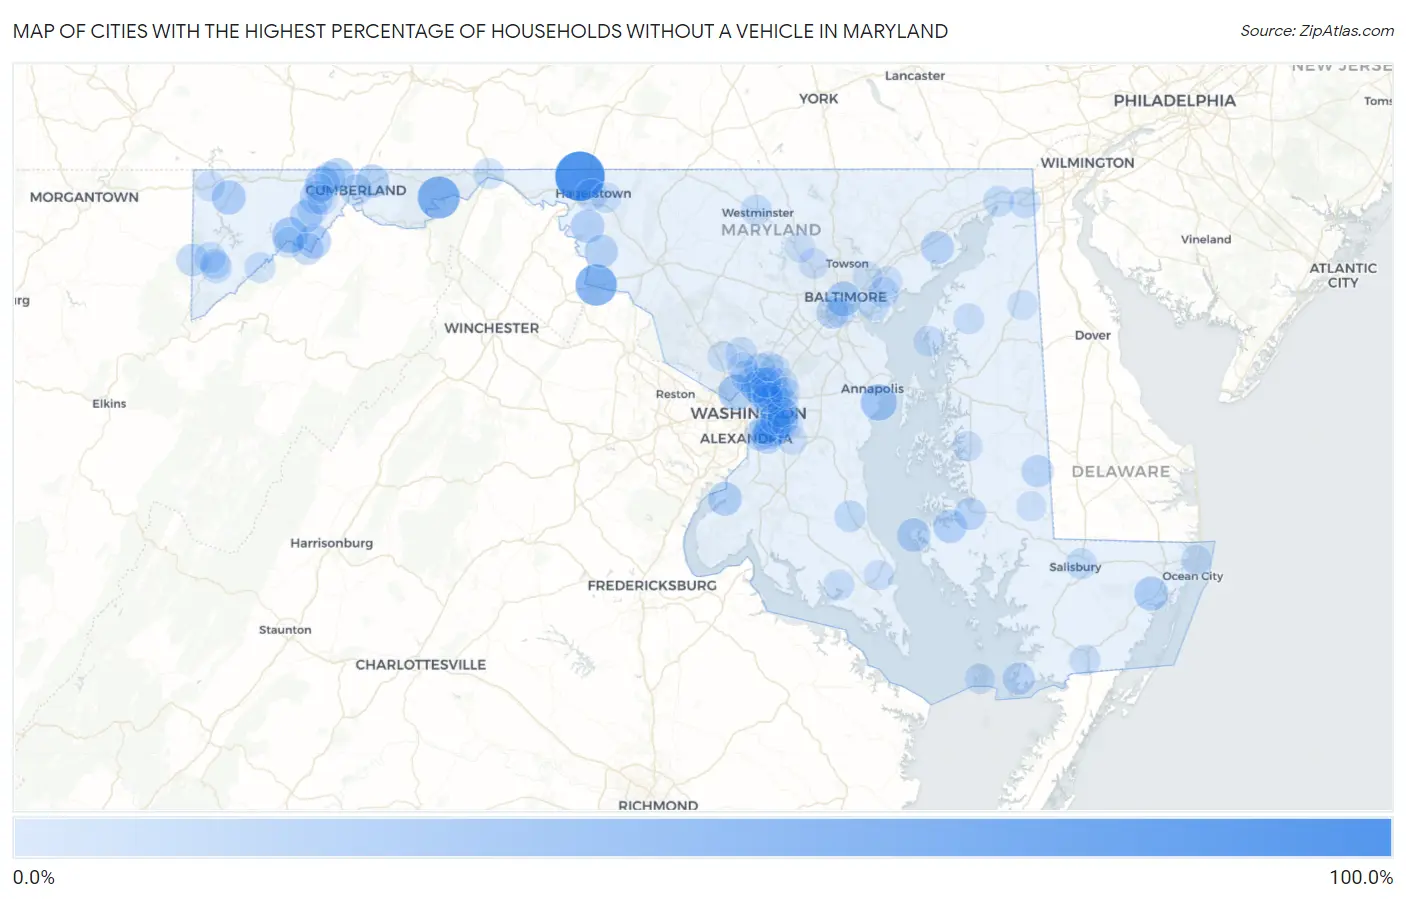
Map of Cities with the Highest Percentage of Households Without a Vehicle in Maryland
0.0%
100.0%
Cities with the Highest Percentage of Households Without a Vehicle in Maryland
| City | Housholds Without a Car | vs State | vs National | |
| 1. | Cearfoss | 83.2% | 8.7%(+74.5)#1 | 8.3%(+74.9)#115 |
| 2. | Little Orleans | 54.0% | 8.7%(+45.3)#2 | 8.3%(+45.7)#217 |
| 3. | Sandy Hook | 51.5% | 8.7%(+42.8)#3 | 8.3%(+43.2)#228 |
| 4. | Highland Beach | 32.4% | 8.7%(+23.7)#4 | 8.3%(+24.1)#515 |
| 5. | Friendship Heights Village | 30.8% | 8.7%(+22.1)#5 | 8.3%(+22.5)#552 |
| 6. | Franklin | 30.1% | 8.7%(+21.4)#6 | 8.3%(+21.8)#578 |
| 7. | Silver Hill | 27.8% | 8.7%(+19.1)#7 | 8.3%(+19.5)#686 |
| 8. | Baltimore | 26.5% | 8.7%(+17.8)#8 | 8.3%(+18.2)#752 |
| 9. | Zihlman | 26.1% | 8.7%(+17.4)#9 | 8.3%(+17.8)#784 |
| 10. | Dawson | 25.0% | 8.7%(+16.3)#10 | 8.3%(+16.7)#857 |
| 11. | Accident | 24.5% | 8.7%(+15.8)#11 | 8.3%(+16.2)#885 |
| 12. | Newark | 24.4% | 8.7%(+15.7)#12 | 8.3%(+16.1)#895 |
| 13. | Potomac Heights | 23.1% | 8.7%(+14.4)#13 | 8.3%(+14.8)#1,007 |
| 14. | Barrelville | 22.9% | 8.7%(+14.2)#14 | 8.3%(+14.6)#1,021 |
| 15. | Church Creek | 22.6% | 8.7%(+13.9)#15 | 8.3%(+14.3)#1,046 |
| 16. | Taylors Island | 22.4% | 8.7%(+13.7)#16 | 8.3%(+14.1)#1,073 |
| 17. | Langley Park | 22.3% | 8.7%(+13.6)#17 | 8.3%(+14.0)#1,078 |
| 18. | Tilghmanton | 22.0% | 8.7%(+13.3)#18 | 8.3%(+13.7)#1,125 |
| 19. | Mount Rainier | 21.8% | 8.7%(+13.1)#19 | 8.3%(+13.5)#1,145 |
| 20. | Pleasant Grove | 21.7% | 8.7%(+13.0)#20 | 8.3%(+13.4)#1,160 |
| 21. | Seat Pleasant | 21.5% | 8.7%(+12.8)#21 | 8.3%(+13.2)#1,177 |
| 22. | Mount Briar | 21.2% | 8.7%(+12.5)#22 | 8.3%(+12.9)#1,234 |
| 23. | Cottage City | 21.1% | 8.7%(+12.4)#23 | 8.3%(+12.8)#1,241 |
| 24. | Perryman | 20.6% | 8.7%(+11.9)#24 | 8.3%(+12.3)#1,320 |
| 25. | Shaft | 20.6% | 8.7%(+11.9)#25 | 8.3%(+12.3)#1,325 |
| 26. | Suitland | 19.3% | 8.7%(+10.6)#26 | 8.3%(+11.0)#1,528 |
| 27. | College Park | 18.9% | 8.7%(+10.2)#27 | 8.3%(+10.6)#1,591 |
| 28. | Lonaconing | 18.9% | 8.7%(+10.2)#28 | 8.3%(+10.6)#1,599 |
| 29. | Lansdowne | 18.5% | 8.7%(+9.80)#29 | 8.3%(+10.2)#1,668 |
| 30. | Hutton | 18.5% | 8.7%(+9.80)#30 | 8.3%(+10.2)#1,684 |
| 31. | Chillum | 17.8% | 8.7%(+9.10)#31 | 8.3%(+9.50)#1,816 |
| 32. | Temple Hills | 17.8% | 8.7%(+9.10)#32 | 8.3%(+9.50)#1,821 |
| 33. | Cambridge | 17.4% | 8.7%(+8.70)#33 | 8.3%(+9.10)#1,923 |
| 34. | Crisfield | 17.3% | 8.7%(+8.60)#34 | 8.3%(+9.00)#1,953 |
| 35. | Federalsburg | 17.2% | 8.7%(+8.50)#35 | 8.3%(+8.90)#1,974 |
| 36. | Mccoole | 17.1% | 8.7%(+8.40)#36 | 8.3%(+8.80)#2,007 |
| 37. | Silver Spring | 16.5% | 8.7%(+7.80)#37 | 8.3%(+8.20)#2,151 |
| 38. | Hagerstown | 16.2% | 8.7%(+7.50)#38 | 8.3%(+7.90)#2,249 |
| 39. | Maryland Park | 16.2% | 8.7%(+7.50)#39 | 8.3%(+7.90)#2,268 |
| 40. | Marlow Heights | 16.1% | 8.7%(+7.40)#40 | 8.3%(+7.80)#2,284 |
| 41. | Cumberland | 15.8% | 8.7%(+7.10)#41 | 8.3%(+7.50)#2,373 |
| 42. | Forest Glen | 15.5% | 8.7%(+6.80)#42 | 8.3%(+7.20)#2,490 |
| 43. | Glassmanor | 15.4% | 8.7%(+6.70)#43 | 8.3%(+7.10)#2,528 |
| 44. | East Riverdale | 15.3% | 8.7%(+6.60)#44 | 8.3%(+7.00)#2,570 |
| 45. | Bladensburg | 15.3% | 8.7%(+6.60)#45 | 8.3%(+7.00)#2,573 |
| 46. | District Heights | 15.3% | 8.7%(+6.60)#46 | 8.3%(+7.00)#2,576 |
| 47. | Mount Savage | 15.3% | 8.7%(+6.60)#47 | 8.3%(+7.00)#2,595 |
| 48. | Prince Frederick | 15.1% | 8.7%(+6.40)#48 | 8.3%(+6.80)#2,653 |
| 49. | White Oak | 15.0% | 8.7%(+6.30)#49 | 8.3%(+6.70)#2,672 |
| 50. | Loch Lynn Heights | 14.9% | 8.7%(+6.20)#50 | 8.3%(+6.60)#2,740 |
| 51. | Landover | 14.8% | 8.7%(+6.10)#51 | 8.3%(+6.50)#2,750 |
| 52. | Takoma Park | 14.7% | 8.7%(+6.00)#52 | 8.3%(+6.40)#2,785 |
| 53. | Oakland | 14.3% | 8.7%(+5.60)#53 | 8.3%(+6.00)#2,981 |
| 54. | Dundalk | 14.2% | 8.7%(+5.50)#54 | 8.3%(+5.90)#3,007 |
| 55. | Hillcrest Heights | 14.1% | 8.7%(+5.40)#55 | 8.3%(+5.80)#3,047 |
| 56. | Hyattsville | 14.0% | 8.7%(+5.30)#56 | 8.3%(+5.70)#3,094 |
| 57. | Leisure World | 14.0% | 8.7%(+5.30)#57 | 8.3%(+5.70)#3,096 |
| 58. | Elkton | 13.8% | 8.7%(+5.10)#58 | 8.3%(+5.50)#3,175 |
| 59. | Burnt Mills | 13.8% | 8.7%(+5.10)#59 | 8.3%(+5.50)#3,186 |
| 60. | Greenbelt | 13.7% | 8.7%(+5.00)#60 | 8.3%(+5.40)#3,223 |
| 61. | Kitzmiller | 13.6% | 8.7%(+4.90)#61 | 8.3%(+5.30)#3,301 |
| 62. | Coral Hills | 13.4% | 8.7%(+4.70)#62 | 8.3%(+5.10)#3,359 |
| 63. | Salisbury | 13.3% | 8.7%(+4.60)#63 | 8.3%(+5.00)#3,395 |
| 64. | North East | 13.3% | 8.7%(+4.60)#64 | 8.3%(+5.00)#3,405 |
| 65. | Walker Mill | 13.1% | 8.7%(+4.40)#65 | 8.3%(+4.80)#3,498 |
| 66. | Hancock | 13.1% | 8.7%(+4.40)#66 | 8.3%(+4.80)#3,513 |
| 67. | Westminster | 12.9% | 8.7%(+4.20)#67 | 8.3%(+4.60)#3,582 |
| 68. | Luke | 12.9% | 8.7%(+4.20)#68 | 8.3%(+4.60)#3,625 |
| 69. | Essex | 12.6% | 8.7%(+3.90)#69 | 8.3%(+4.30)#3,736 |
| 70. | Beltsville | 12.5% | 8.7%(+3.80)#70 | 8.3%(+4.20)#3,793 |
| 71. | Chestertown | 12.4% | 8.7%(+3.70)#71 | 8.3%(+4.10)#3,881 |
| 72. | Rock Hall | 12.4% | 8.7%(+3.70)#72 | 8.3%(+4.10)#3,903 |
| 73. | Pocomoke City | 12.3% | 8.7%(+3.60)#73 | 8.3%(+4.00)#3,939 |
| 74. | Peppermill Village | 12.2% | 8.7%(+3.50)#74 | 8.3%(+3.90)#3,994 |
| 75. | Leonardtown | 12.2% | 8.7%(+3.50)#75 | 8.3%(+3.90)#3,995 |
| 76. | Gilmore | 12.0% | 8.7%(+3.30)#76 | 8.3%(+3.70)#4,156 |
| 77. | Robinwood | 11.7% | 8.7%(+3.00)#77 | 8.3%(+3.40)#4,324 |
| 78. | Brentwood | 11.5% | 8.7%(+2.80)#78 | 8.3%(+3.20)#4,464 |
| 79. | Mountain Lake Park | 11.5% | 8.7%(+2.80)#79 | 8.3%(+3.20)#4,473 |
| 80. | Smith Island | 11.5% | 8.7%(+2.80)#80 | 8.3%(+3.20)#4,502 |
| 81. | New Carrollton | 11.4% | 8.7%(+2.70)#81 | 8.3%(+3.10)#4,526 |
| 82. | Garrison | 11.2% | 8.7%(+2.50)#82 | 8.3%(+2.90)#4,640 |
| 83. | Ocean City | 11.2% | 8.7%(+2.50)#83 | 8.3%(+2.90)#4,645 |
| 84. | Forestville | 11.0% | 8.7%(+2.30)#84 | 8.3%(+2.70)#4,797 |
| 85. | Easton | 10.9% | 8.7%(+2.20)#85 | 8.3%(+2.60)#4,881 |
| 86. | Solomons | 10.9% | 8.7%(+2.20)#86 | 8.3%(+2.60)#4,908 |
| 87. | Wheaton | 10.8% | 8.7%(+2.10)#87 | 8.3%(+2.50)#4,967 |
| 88. | Friendsville | 10.8% | 8.7%(+2.10)#88 | 8.3%(+2.50)#5,023 |
| 89. | Vale Summit | 10.7% | 8.7%(+2.00)#89 | 8.3%(+2.40)#5,099 |
| 90. | Reisterstown | 10.5% | 8.7%(+1.80)#90 | 8.3%(+2.20)#5,202 |
| 91. | Adelphi | 10.5% | 8.7%(+1.80)#91 | 8.3%(+2.20)#5,208 |
| 92. | Baltimore Highlands | 10.4% | 8.7%(+1.70)#92 | 8.3%(+2.10)#5,308 |
| 93. | Frostburg | 10.3% | 8.7%(+1.60)#93 | 8.3%(+2.00)#5,382 |
| 94. | Calverton | 10.2% | 8.7%(+1.50)#94 | 8.3%(+1.90)#5,466 |
| 95. | Millington | 10.2% | 8.7%(+1.50)#95 | 8.3%(+1.90)#5,535 |
| 96. | Rockville | 10.1% | 8.7%(+1.40)#96 | 8.3%(+1.80)#5,558 |
| 97. | Middle River | 10.0% | 8.7%(+1.30)#97 | 8.3%(+1.70)#5,644 |
| 98. | Melwood | 10.0% | 8.7%(+1.30)#98 | 8.3%(+1.70)#5,668 |
| 99. | Brookview | 10.0% | 8.7%(+1.30)#99 | 8.3%(+1.70)#5,720 |
| 100. | Overlea | 9.8% | 8.7%(+1.10)#100 | 8.3%(+1.50)#5,825 |
Common Questions
What are the Top 10 Cities with the Highest Percentage of Households Without a Vehicle in Maryland?
Top 10 Cities with the Highest Percentage of Households Without a Vehicle in Maryland are:
#1
83.2%
#2
54.0%
#3
51.5%
#4
32.4%
#5
30.8%
#6
30.1%
#7
27.8%
#8
26.5%
#9
26.1%
#10
25.0%
What city has the Highest Percentage of Households Without a Vehicle in Maryland?
Cearfoss has the Highest Percentage of Households Without a Vehicle in Maryland with 83.2%.
What is the Percentage of Households Without a Vehicle in the State of Maryland?
Percentage of Households Without a Vehicle in Maryland is 8.7%.
What is the Percentage of Households Without a Vehicle in the United States?
Percentage of Households Without a Vehicle in the United States is 8.3%.