Grass Valley, CA Map & Demographics
Grass Valley Map
Grass Valley Overview
$32,423
PER CAPITA INCOME
$61,742
AVG FAMILY INCOME
$49,855
AVG HOUSEHOLD INCOME
29.2%
WAGE / INCOME GAP [ % ]
70.8¢/ $1
WAGE / INCOME GAP [ $ ]
0.45
INEQUALITY / GINI INDEX
13,964
TOTAL POPULATION
6,183
MALE POPULATION
7,781
FEMALE POPULATION
79.46
MALES / 100 FEMALES
125.85
FEMALES / 100 MALES
47.7
MEDIAN AGE
2.9
AVG FAMILY SIZE
2.0
AVG HOUSEHOLD SIZE
6,048
LABOR FORCE [ PEOPLE ]
53.1%
PERCENT IN LABOR FORCE
2.3%
UNEMPLOYMENT RATE
Grass Valley Area Codes
Income in Grass Valley
Income Overview in Grass Valley
Per Capita Income in Grass Valley is $32,423, while median incomes of families and households are $61,742 and $49,855 respectively.
| Characteristic | Number | Measure |
| Per Capita Income | 13,964 | $32,423 |
| Median Family Income | 2,803 | $61,742 |
| Mean Family Income | 2,803 | $83,295 |
| Median Household Income | 6,654 | $49,855 |
| Mean Household Income | 6,654 | $64,340 |
| Income Deficit | 2,803 | $0 |
| Wage / Income Gap (%) | 13,964 | 29.20% |
| Wage / Income Gap ($) | 13,964 | 70.80¢ per $1 |
| Gini / Inequality Index | 13,964 | 0.45 |
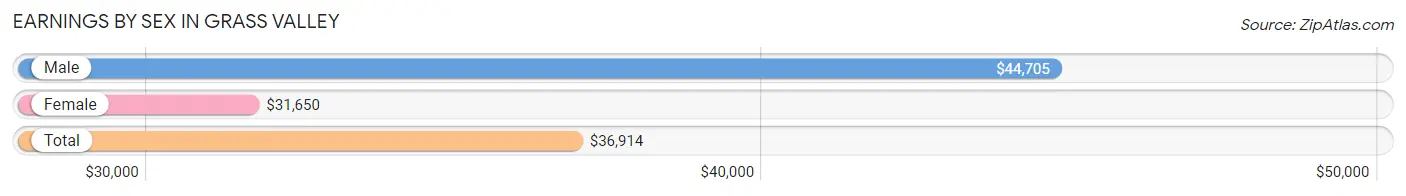
Earnings by Sex in Grass Valley
Average Earnings in Grass Valley are $36,914, $44,705 for men and $31,650 for women, a difference of 29.2%.
| Sex | Number | Average Earnings |
| Male | 2,879 (43.9%) | $44,705 |
| Female | 3,678 (56.1%) | $31,650 |
| Total | 6,557 (100.0%) | $36,914 |
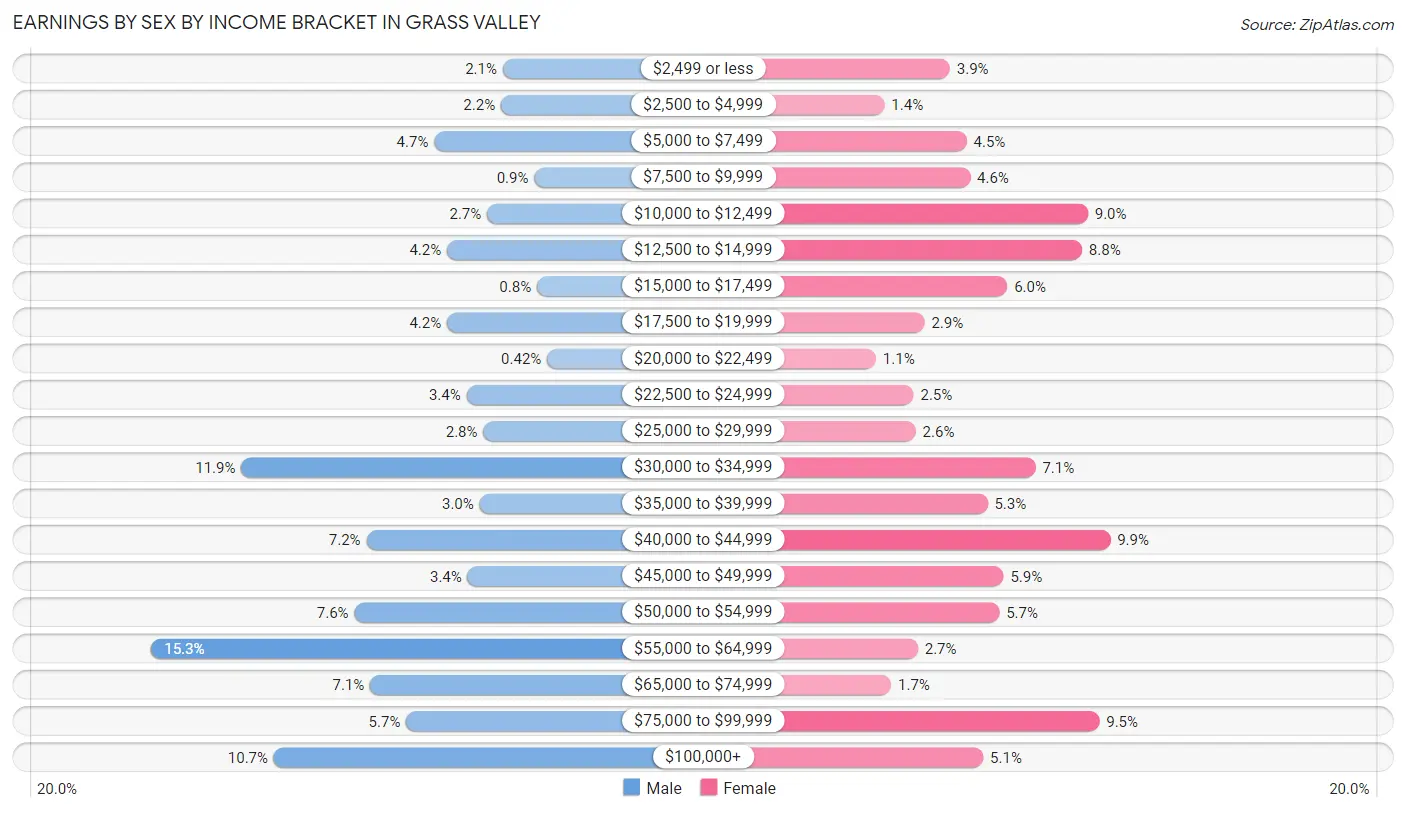
Earnings by Sex by Income Bracket in Grass Valley
The most common earnings brackets in Grass Valley are $55,000 to $64,999 for men (439 | 15.2%) and $40,000 to $44,999 for women (363 | 9.9%).
| Income | Male | Female |
| $2,499 or less | 60 (2.1%) | 142 (3.9%) |
| $2,500 to $4,999 | 62 (2.1%) | 52 (1.4%) |
| $5,000 to $7,499 | 134 (4.6%) | 165 (4.5%) |
| $7,500 to $9,999 | 26 (0.9%) | 170 (4.6%) |
| $10,000 to $12,499 | 77 (2.7%) | 332 (9.0%) |
| $12,500 to $14,999 | 120 (4.2%) | 324 (8.8%) |
| $15,000 to $17,499 | 23 (0.8%) | 221 (6.0%) |
| $17,500 to $19,999 | 120 (4.2%) | 107 (2.9%) |
| $20,000 to $22,499 | 12 (0.4%) | 40 (1.1%) |
| $22,500 to $24,999 | 99 (3.4%) | 92 (2.5%) |
| $25,000 to $29,999 | 81 (2.8%) | 95 (2.6%) |
| $30,000 to $34,999 | 342 (11.9%) | 260 (7.1%) |
| $35,000 to $39,999 | 85 (2.9%) | 194 (5.3%) |
| $40,000 to $44,999 | 207 (7.2%) | 363 (9.9%) |
| $45,000 to $49,999 | 98 (3.4%) | 216 (5.9%) |
| $50,000 to $54,999 | 220 (7.6%) | 210 (5.7%) |
| $55,000 to $64,999 | 439 (15.2%) | 98 (2.7%) |
| $65,000 to $74,999 | 203 (7.0%) | 61 (1.7%) |
| $75,000 to $99,999 | 164 (5.7%) | 348 (9.5%) |
| $100,000+ | 307 (10.7%) | 188 (5.1%) |
| Total | 2,879 (100.0%) | 3,678 (100.0%) |
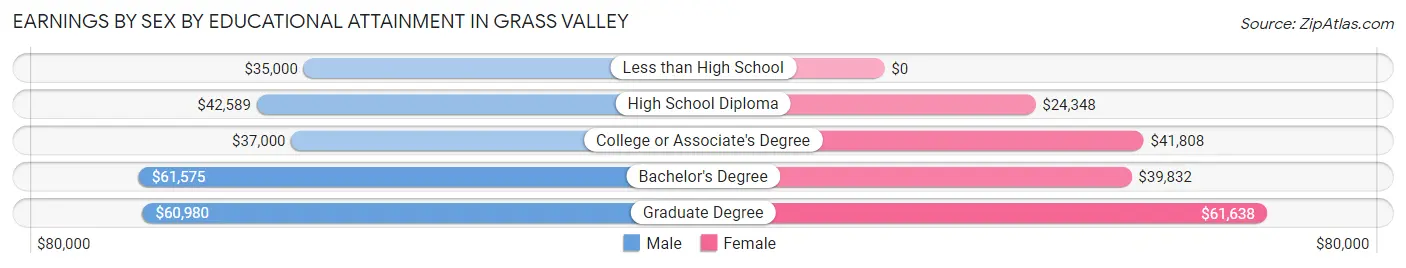
Earnings by Sex by Educational Attainment in Grass Valley
Average earnings in Grass Valley are $50,466 for men and $35,349 for women, a difference of 29.9%. Men with an educational attainment of bachelor's degree enjoy the highest average annual earnings of $61,575, while those with less than high school education earn the least with $35,000. Women with an educational attainment of graduate degree earn the most with the average annual earnings of $61,638, while those with high school diploma education have the smallest earnings of $24,348.
| Educational Attainment | Male Income | Female Income |
| Less than High School | $35,000 | $0 |
| High School Diploma | $42,589 | $24,348 |
| College or Associate's Degree | $37,000 | $41,808 |
| Bachelor's Degree | $61,575 | $39,832 |
| Graduate Degree | $60,980 | $61,638 |
| Total | $50,466 | $35,349 |
Family Income in Grass Valley
Family Income Brackets in Grass Valley
According to the Grass Valley family income data, there are 754 families falling into the $50,000 to $74,999 income range, which is the most common income bracket and makes up 26.9% of all families. Conversely, the less than $10,000 income bracket is the least frequent group with only 118 families (4.2%) belonging to this category.
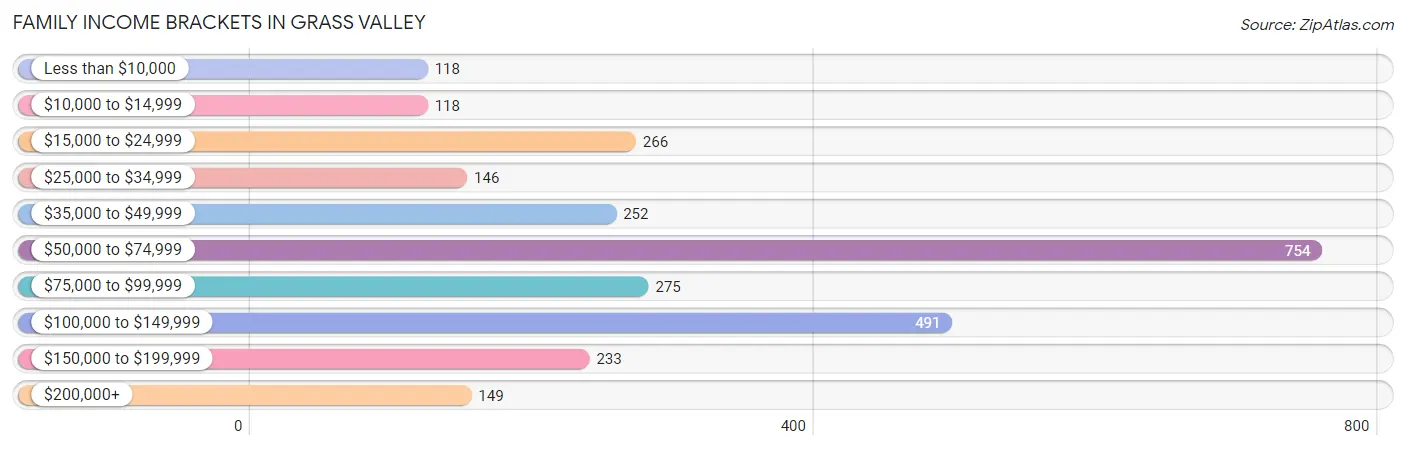
| Income Bracket | # Families | % Families |
| Less than $10,000 | 118 | 4.2% |
| $10,000 to $14,999 | 118 | 4.2% |
| $15,000 to $24,999 | 266 | 9.5% |
| $25,000 to $34,999 | 146 | 5.2% |
| $35,000 to $49,999 | 252 | 9.0% |
| $50,000 to $74,999 | 754 | 26.9% |
| $75,000 to $99,999 | 275 | 9.8% |
| $100,000 to $149,999 | 491 | 17.5% |
| $150,000 to $199,999 | 233 | 8.3% |
| $200,000+ | 149 | 5.3% |
Family Income by Famaliy Size in Grass Valley
3-person families (640 | 22.8%) account for the highest median family income in Grass Valley with $68,250 per family, while 2-person families (1,534 | 54.7%) have the highest median income of $28,951 per family member.
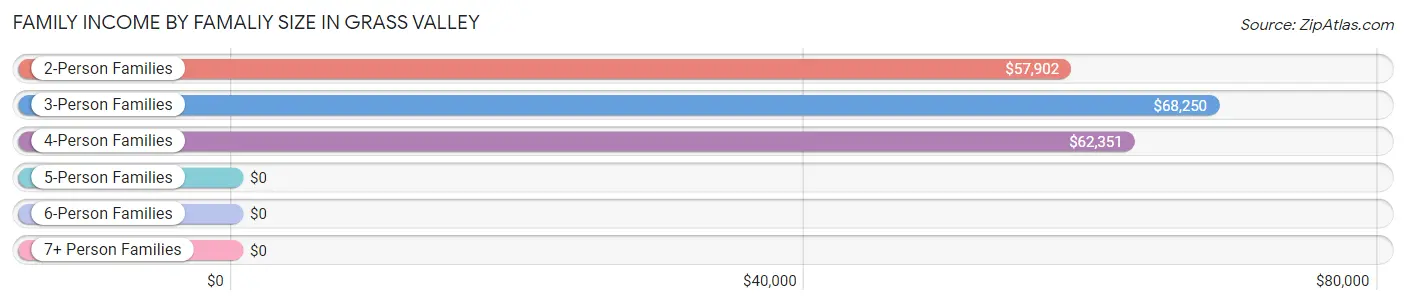
| Income Bracket | # Families | Median Income |
| 2-Person Families | 1,534 (54.7%) | $57,902 |
| 3-Person Families | 640 (22.8%) | $68,250 |
| 4-Person Families | 539 (19.2%) | $62,351 |
| 5-Person Families | 77 (2.8%) | $0 |
| 6-Person Families | 7 (0.3%) | $0 |
| 7+ Person Families | 6 (0.2%) | $0 |
| Total | 2,803 (100.0%) | $61,742 |
Family Income by Number of Earners in Grass Valley
The median family income in Grass Valley is $61,742, with families comprising 3+ earners (154) having the highest median family income of $180,385, while families with no earners (482) have the lowest median family income of $26,111, accounting for 5.5% and 17.2% of families, respectively.
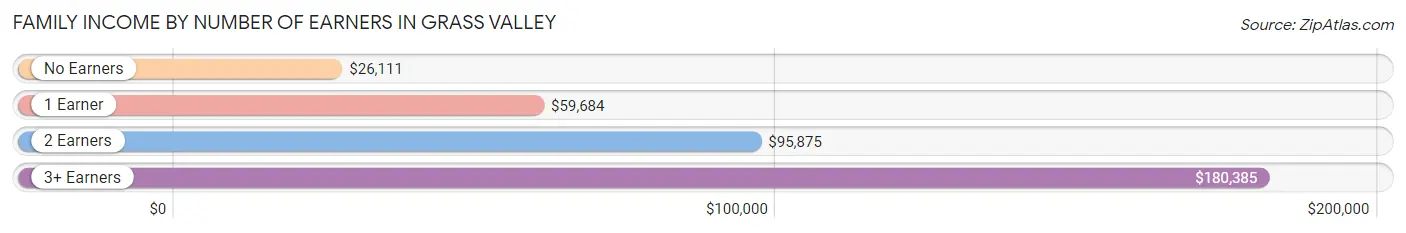
| Number of Earners | # Families | Median Income |
| No Earners | 482 (17.2%) | $26,111 |
| 1 Earner | 1,222 (43.6%) | $59,684 |
| 2 Earners | 945 (33.7%) | $95,875 |
| 3+ Earners | 154 (5.5%) | $180,385 |
| Total | 2,803 (100.0%) | $61,742 |
Household Income in Grass Valley
Household Income Brackets in Grass Valley
With 1,351 households falling in the category, the $50,000 to $74,999 income range is the most frequent in Grass Valley, accounting for 20.3% of all households. In contrast, only 193 households (2.9%) fall into the $200,000+ income bracket, making it the least populous group.
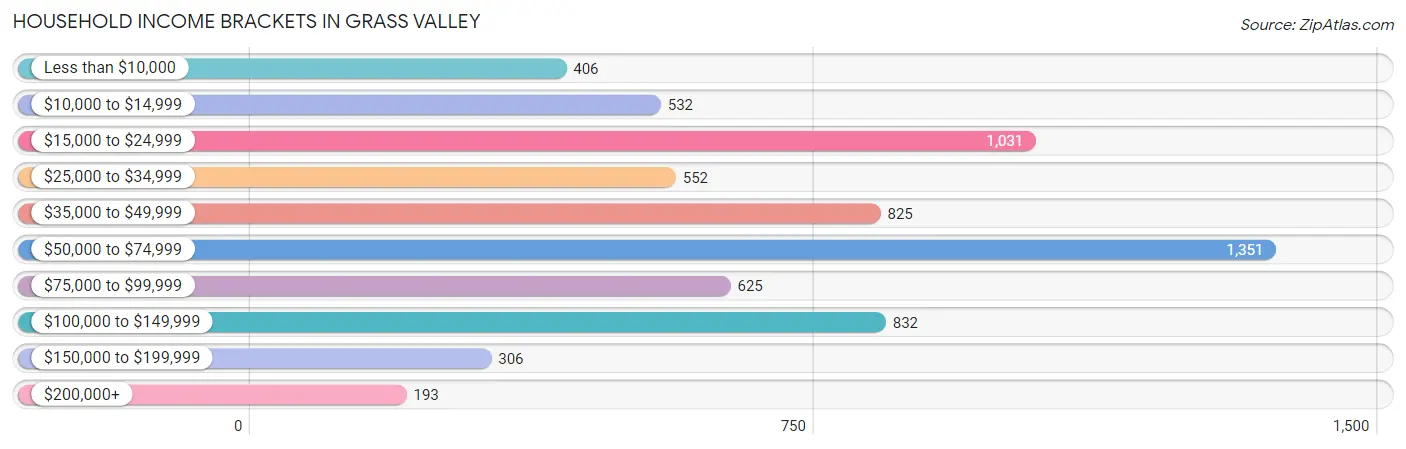
| Income Bracket | # Households | % Households |
| Less than $10,000 | 406 | 6.1% |
| $10,000 to $14,999 | 532 | 8.0% |
| $15,000 to $24,999 | 1,031 | 15.5% |
| $25,000 to $34,999 | 552 | 8.3% |
| $35,000 to $49,999 | 825 | 12.4% |
| $50,000 to $74,999 | 1,351 | 20.3% |
| $75,000 to $99,999 | 625 | 9.4% |
| $100,000 to $149,999 | 832 | 12.5% |
| $150,000 to $199,999 | 306 | 4.6% |
| $200,000+ | 193 | 2.9% |
Household Income by Householder Age in Grass Valley
The median household income in Grass Valley is $49,855, with the highest median household income of $67,600 found in the 25 to 44 years age bracket for the primary householder. A total of 1,548 households (23.3%) fall into this category. Meanwhile, the 65+ years age bracket for the primary householder has the lowest median household income of $40,313, with 2,680 households (40.3%) in this group.
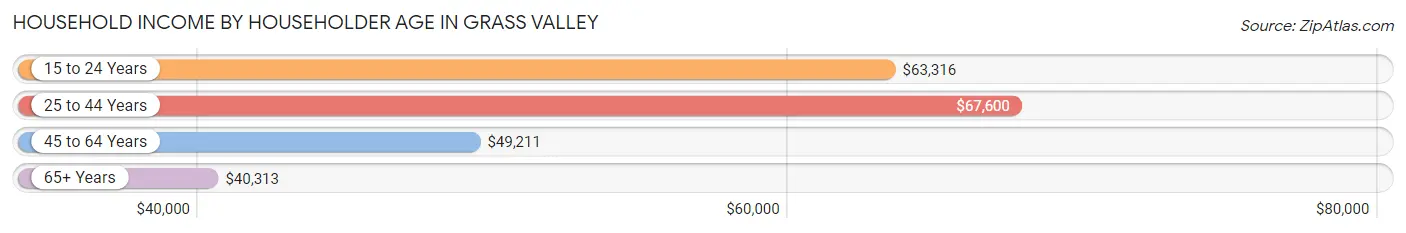
| Income Bracket | # Households | Median Income |
| 15 to 24 Years | 194 (2.9%) | $63,316 |
| 25 to 44 Years | 1,548 (23.3%) | $67,600 |
| 45 to 64 Years | 2,232 (33.5%) | $49,211 |
| 65+ Years | 2,680 (40.3%) | $40,313 |
| Total | 6,654 (100.0%) | $49,855 |
Poverty in Grass Valley
Income Below Poverty by Sex and Age in Grass Valley
With 15.9% poverty level for males and 20.1% for females among the residents of Grass Valley, 15 year old males and 12 to 14 year old females are the most vulnerable to poverty, with 15 males (60.0%) and 111 females (65.7%) in their respective age groups living below the poverty level.
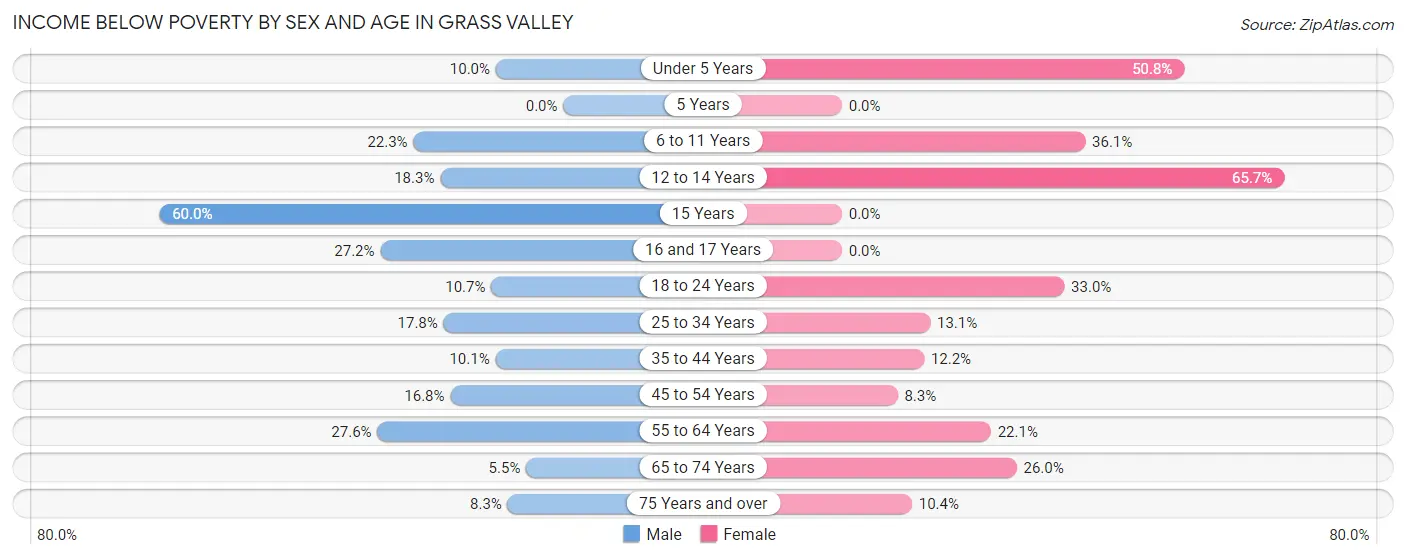
| Age Bracket | Male | Female |
| Under 5 Years | 50 (10.0%) | 181 (50.8%) |
| 5 Years | 0 (0.0%) | 0 (0.0%) |
| 6 to 11 Years | 144 (22.3%) | 112 (36.1%) |
| 12 to 14 Years | 70 (18.3%) | 111 (65.7%) |
| 15 Years | 15 (60.0%) | 0 (0.0%) |
| 16 and 17 Years | 25 (27.2%) | 0 (0.0%) |
| 18 to 24 Years | 38 (10.7%) | 140 (33.0%) |
| 25 to 34 Years | 104 (17.8%) | 132 (13.1%) |
| 35 to 44 Years | 75 (10.1%) | 80 (12.2%) |
| 45 to 54 Years | 120 (16.8%) | 75 (8.3%) |
| 55 to 64 Years | 235 (27.6%) | 198 (22.1%) |
| 65 to 74 Years | 37 (5.5%) | 329 (26.0%) |
| 75 Years and over | 31 (8.3%) | 121 (10.4%) |
| Total | 944 (15.9%) | 1,479 (20.1%) |
Income Above Poverty by Sex and Age in Grass Valley
According to the poverty statistics in Grass Valley, males aged 65 to 74 years and females aged 5 years are the age groups that are most secure financially, with 94.5% of males and 100.0% of females in these age groups living above the poverty line.
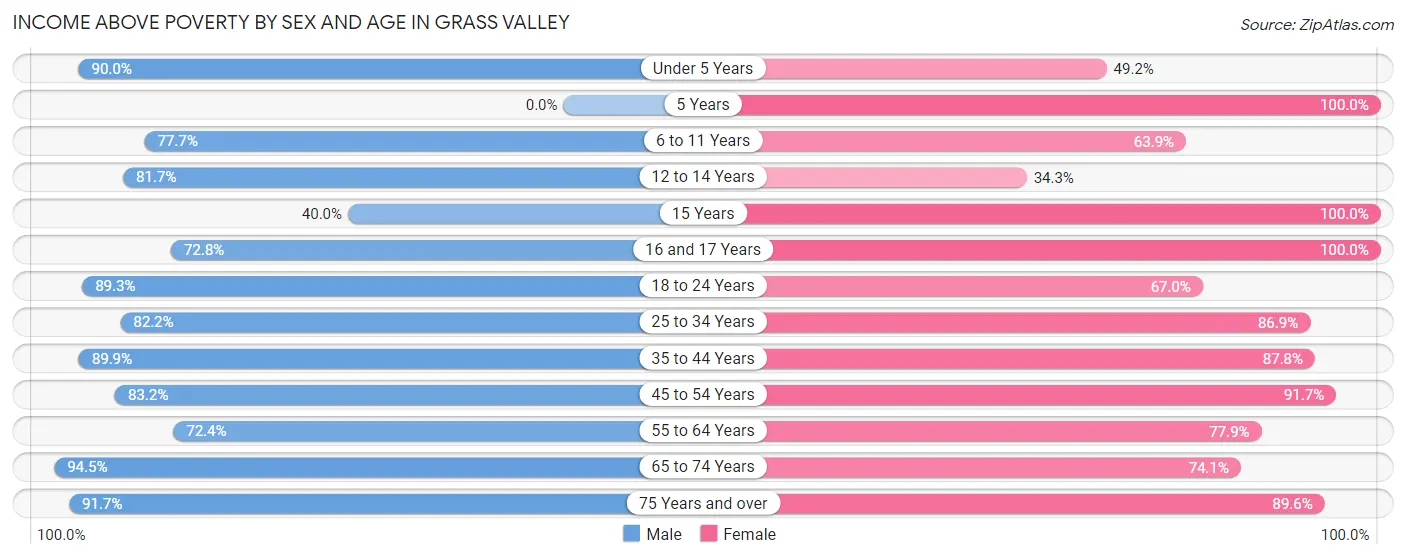
| Age Bracket | Male | Female |
| Under 5 Years | 449 (90.0%) | 175 (49.2%) |
| 5 Years | 0 (0.0%) | 14 (100.0%) |
| 6 to 11 Years | 503 (77.7%) | 198 (63.9%) |
| 12 to 14 Years | 313 (81.7%) | 58 (34.3%) |
| 15 Years | 10 (40.0%) | 139 (100.0%) |
| 16 and 17 Years | 67 (72.8%) | 66 (100.0%) |
| 18 to 24 Years | 317 (89.3%) | 284 (67.0%) |
| 25 to 34 Years | 481 (82.2%) | 876 (86.9%) |
| 35 to 44 Years | 669 (89.9%) | 576 (87.8%) |
| 45 to 54 Years | 595 (83.2%) | 832 (91.7%) |
| 55 to 64 Years | 616 (72.4%) | 697 (77.9%) |
| 65 to 74 Years | 635 (94.5%) | 939 (74.1%) |
| 75 Years and over | 344 (91.7%) | 1,042 (89.6%) |
| Total | 4,999 (84.1%) | 5,896 (79.9%) |
Income Below Poverty Among Married-Couple Families in Grass Valley
The poverty statistics for married-couple families in Grass Valley show that 3.1% or 51 of the total 1,658 families live below the poverty line. Families with 3 or 4 children have the highest poverty rate of 40.0%, comprising of 28 families. On the other hand, families with 1 or 2 children have the lowest poverty rate of 0.0%, which includes 0 families.
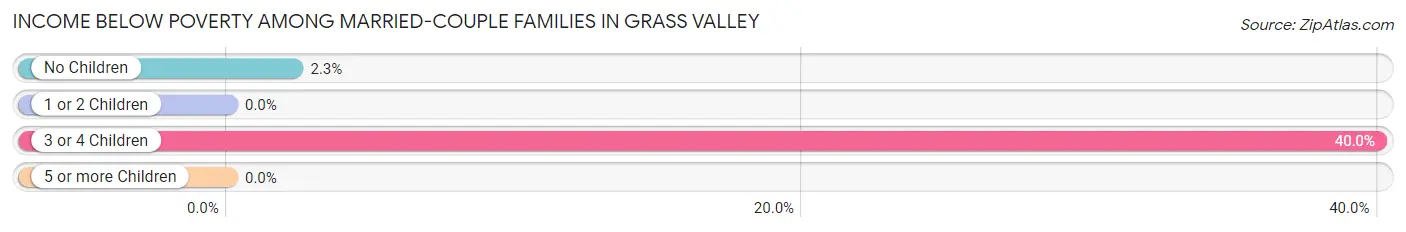
| Children | Above Poverty | Below Poverty |
| No Children | 986 (97.7%) | 23 (2.3%) |
| 1 or 2 Children | 579 (100.0%) | 0 (0.0%) |
| 3 or 4 Children | 42 (60.0%) | 28 (40.0%) |
| 5 or more Children | 0 (0.0%) | 0 (0.0%) |
| Total | 1,607 (96.9%) | 51 (3.1%) |
Income Below Poverty Among Single-Parent Households in Grass Valley
According to the poverty data in Grass Valley, 43.9% or 123 single-father households and 29.8% or 258 single-mother households are living below the poverty line. Among single-father households, those with 1 or 2 children have the highest poverty rate, with 94 households (74.6%) experiencing poverty. Likewise, among single-mother households, those with 3 or 4 children have the highest poverty rate, with 50 households (100.0%) falling below the poverty line.
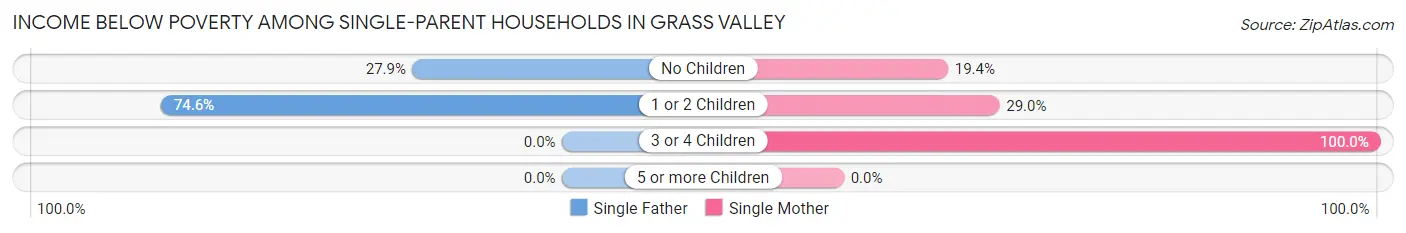
| Children | Single Father | Single Mother |
| No Children | 29 (27.9%) | 57 (19.4%) |
| 1 or 2 Children | 94 (74.6%) | 151 (29.0%) |
| 3 or 4 Children | 0 (0.0%) | 50 (100.0%) |
| 5 or more Children | 0 (0.0%) | 0 (0.0%) |
| Total | 123 (43.9%) | 258 (29.8%) |
Income Below Poverty Among Married-Couple vs Single-Parent Households in Grass Valley
The poverty data for Grass Valley shows that 51 of the married-couple family households (3.1%) and 381 of the single-parent households (33.3%) are living below the poverty level. Within the married-couple family households, those with 3 or 4 children have the highest poverty rate, with 28 households (40.0%) falling below the poverty line. Among the single-parent households, those with 3 or 4 children have the highest poverty rate, with 50 household (50.0%) living below poverty.
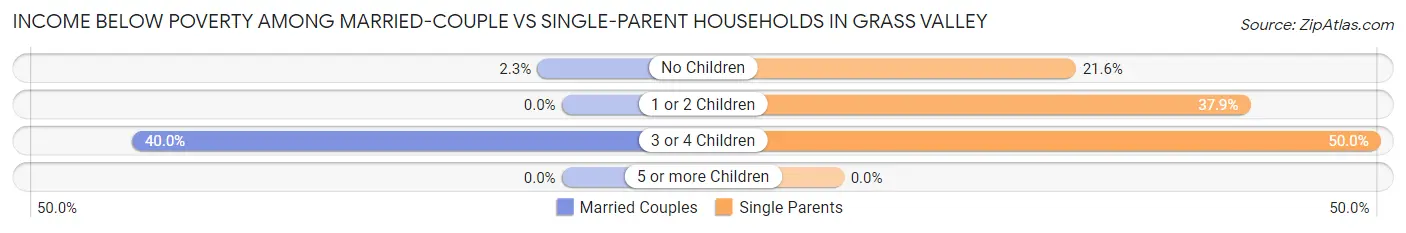
| Children | Married-Couple Families | Single-Parent Households |
| No Children | 23 (2.3%) | 86 (21.6%) |
| 1 or 2 Children | 0 (0.0%) | 245 (37.9%) |
| 3 or 4 Children | 28 (40.0%) | 50 (50.0%) |
| 5 or more Children | 0 (0.0%) | 0 (0.0%) |
| Total | 51 (3.1%) | 381 (33.3%) |
Race in Grass Valley
The most populous races in Grass Valley are White / Caucasian (11,796 | 84.5%), Two or more Races (1,563 | 11.2%), and Hispanic or Latino (1,310 | 9.4%).
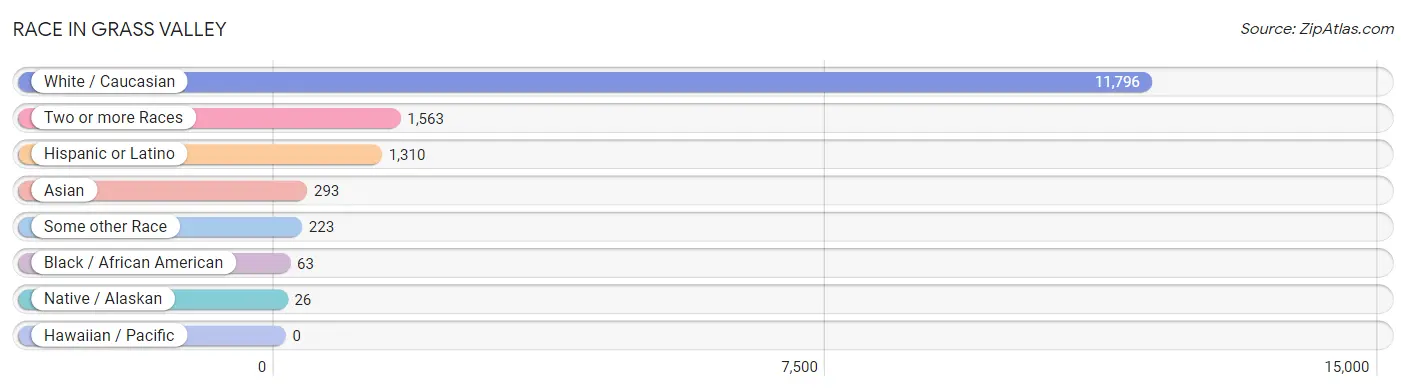
| Race | # Population | % Population |
| Asian | 293 | 2.1% |
| Black / African American | 63 | 0.4% |
| Hawaiian / Pacific | 0 | 0.0% |
| Hispanic or Latino | 1,310 | 9.4% |
| Native / Alaskan | 26 | 0.2% |
| White / Caucasian | 11,796 | 84.5% |
| Two or more Races | 1,563 | 11.2% |
| Some other Race | 223 | 1.6% |
| Total | 13,964 | 100.0% |
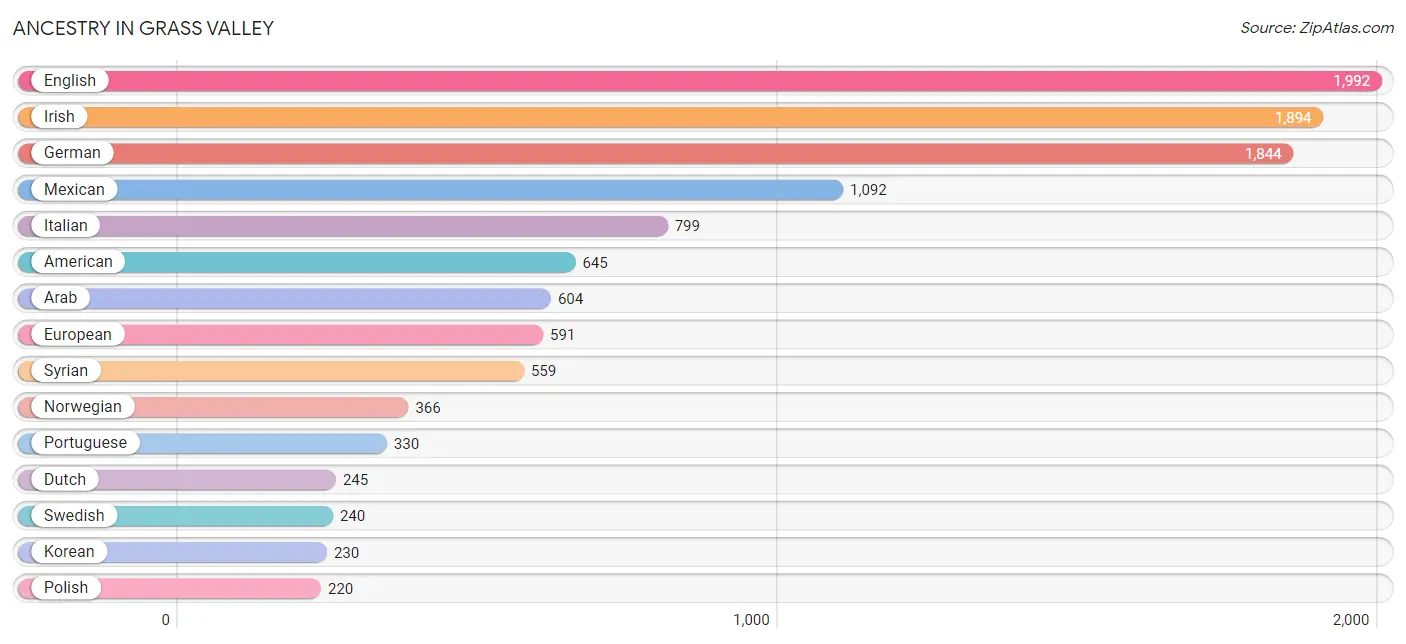
Ancestry in Grass Valley
The most populous ancestries reported in Grass Valley are English (1,992 | 14.3%), Irish (1,894 | 13.6%), German (1,844 | 13.2%), Mexican (1,092 | 7.8%), and Italian (799 | 5.7%), together accounting for 54.6% of all Grass Valley residents.
| Ancestry | # Population | % Population |
| Albanian | 9 | 0.1% |
| American | 645 | 4.6% |
| Arab | 604 | 4.3% |
| Bhutanese | 34 | 0.2% |
| Blackfeet | 26 | 0.2% |
| British | 33 | 0.2% |
| Cajun | 71 | 0.5% |
| Canadian | 14 | 0.1% |
| Central American | 103 | 0.7% |
| Cherokee | 98 | 0.7% |
| Croatian | 85 | 0.6% |
| Danish | 8 | 0.1% |
| Dutch | 245 | 1.8% |
| Eastern European | 45 | 0.3% |
| English | 1,992 | 14.3% |
| European | 591 | 4.2% |
| Filipino | 55 | 0.4% |
| Finnish | 94 | 0.7% |
| French | 185 | 1.3% |
| French Canadian | 121 | 0.9% |
| German | 1,844 | 13.2% |
| Greek | 8 | 0.1% |
| Guatemalan | 103 | 0.7% |
| Hungarian | 43 | 0.3% |
| Icelander | 14 | 0.1% |
| Indian (Asian) | 22 | 0.2% |
| Irish | 1,894 | 13.6% |
| Italian | 799 | 5.7% |
| Jamaican | 2 | 0.0% |
| Korean | 230 | 1.7% |
| Laotian | 121 | 0.9% |
| Lebanese | 45 | 0.3% |
| Lithuanian | 19 | 0.1% |
| Mexican | 1,092 | 7.8% |
| Mexican American Indian | 12 | 0.1% |
| Northern European | 56 | 0.4% |
| Norwegian | 366 | 2.6% |
| Pakistani | 29 | 0.2% |
| Pennsylvania German | 79 | 0.6% |
| Polish | 220 | 1.6% |
| Portuguese | 330 | 2.4% |
| Russian | 41 | 0.3% |
| Scandinavian | 170 | 1.2% |
| Scotch-Irish | 167 | 1.2% |
| Scottish | 210 | 1.5% |
| Serbian | 15 | 0.1% |
| Slovak | 14 | 0.1% |
| Slovene | 27 | 0.2% |
| Spaniard | 60 | 0.4% |
| Sri Lankan | 17 | 0.1% |
| Swedish | 240 | 1.7% |
| Swiss | 14 | 0.1% |
| Syrian | 559 | 4.0% |
| Ukrainian | 62 | 0.4% |
| Welsh | 53 | 0.4% |
| Yugoslavian | 10 | 0.1% | View All 56 Rows |
Immigrants in Grass Valley
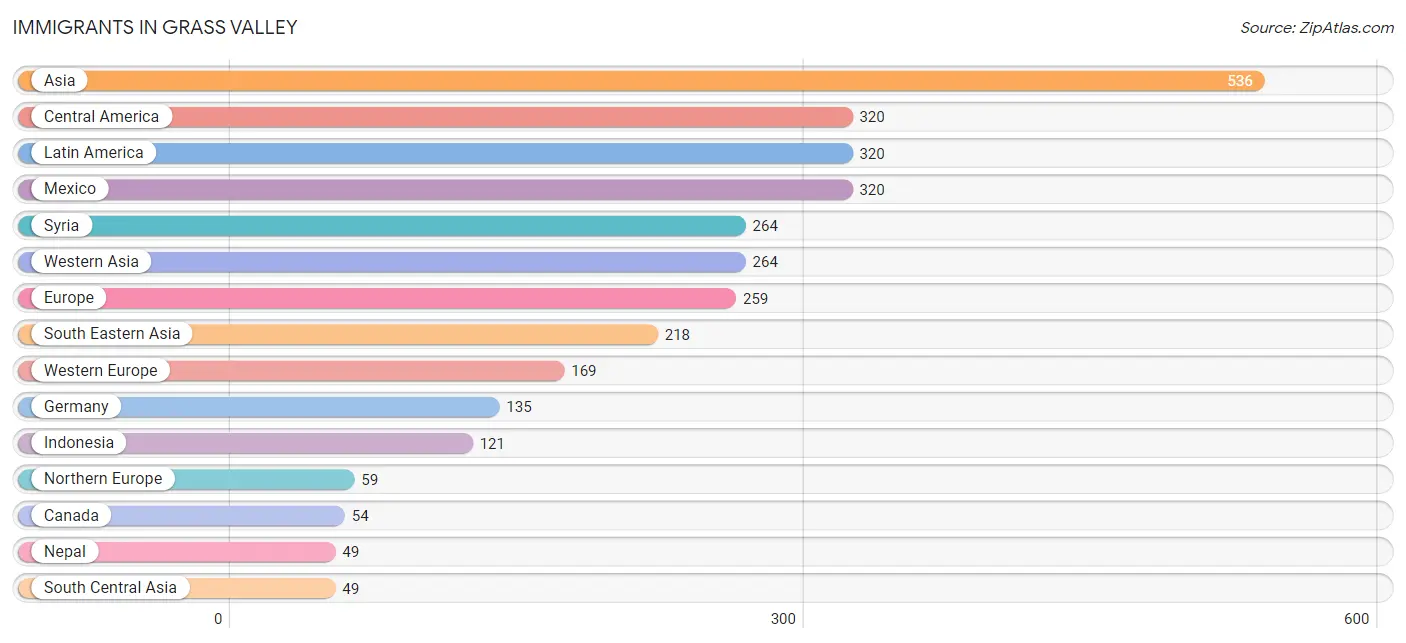
The most numerous immigrant groups reported in Grass Valley came from Asia (536 | 3.8%), Central America (320 | 2.3%), Latin America (320 | 2.3%), Mexico (320 | 2.3%), and Syria (264 | 1.9%), together accounting for 12.6% of all Grass Valley residents.
| Immigration Origin | # Population | % Population |
| Africa | 2 | 0.0% |
| Asia | 536 | 3.8% |
| Canada | 54 | 0.4% |
| Central America | 320 | 2.3% |
| Eastern Africa | 2 | 0.0% |
| Eastern Asia | 5 | 0.0% |
| Eastern Europe | 12 | 0.1% |
| England | 19 | 0.1% |
| Europe | 259 | 1.8% |
| France | 17 | 0.1% |
| Germany | 135 | 1.0% |
| Indonesia | 121 | 0.9% |
| Ireland | 26 | 0.2% |
| Japan | 5 | 0.0% |
| Latin America | 320 | 2.3% |
| Mexico | 320 | 2.3% |
| Nepal | 49 | 0.4% |
| Netherlands | 17 | 0.1% |
| Northern Europe | 59 | 0.4% |
| Oceania | 13 | 0.1% |
| Philippines | 29 | 0.2% |
| Singapore | 22 | 0.2% |
| South Central Asia | 49 | 0.4% |
| South Eastern Asia | 218 | 1.6% |
| Southern Europe | 19 | 0.1% |
| Spain | 19 | 0.1% |
| Syria | 264 | 1.9% |
| Thailand | 29 | 0.2% |
| Ukraine | 12 | 0.1% |
| Vietnam | 17 | 0.1% |
| Western Asia | 264 | 1.9% |
| Western Europe | 169 | 1.2% | View All 32 Rows |
Sex and Age in Grass Valley
Sex and Age in Grass Valley
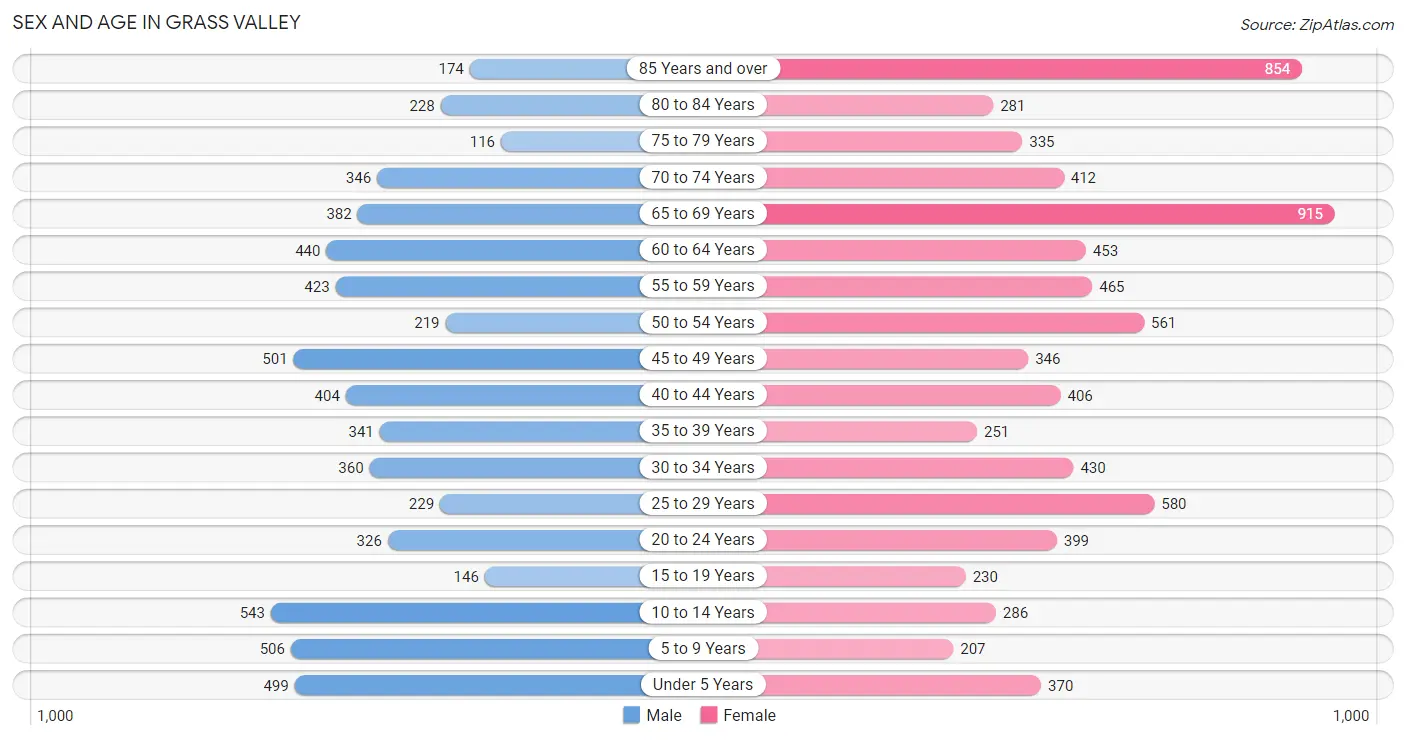
The most populous age groups in Grass Valley are 10 to 14 Years (543 | 8.8%) for men and 65 to 69 Years (915 | 11.8%) for women.
| Age Bracket | Male | Female |
| Under 5 Years | 499 (8.1%) | 370 (4.8%) |
| 5 to 9 Years | 506 (8.2%) | 207 (2.7%) |
| 10 to 14 Years | 543 (8.8%) | 286 (3.7%) |
| 15 to 19 Years | 146 (2.4%) | 230 (3.0%) |
| 20 to 24 Years | 326 (5.3%) | 399 (5.1%) |
| 25 to 29 Years | 229 (3.7%) | 580 (7.4%) |
| 30 to 34 Years | 360 (5.8%) | 430 (5.5%) |
| 35 to 39 Years | 341 (5.5%) | 251 (3.2%) |
| 40 to 44 Years | 404 (6.5%) | 406 (5.2%) |
| 45 to 49 Years | 501 (8.1%) | 346 (4.4%) |
| 50 to 54 Years | 219 (3.5%) | 561 (7.2%) |
| 55 to 59 Years | 423 (6.8%) | 465 (6.0%) |
| 60 to 64 Years | 440 (7.1%) | 453 (5.8%) |
| 65 to 69 Years | 382 (6.2%) | 915 (11.8%) |
| 70 to 74 Years | 346 (5.6%) | 412 (5.3%) |
| 75 to 79 Years | 116 (1.9%) | 335 (4.3%) |
| 80 to 84 Years | 228 (3.7%) | 281 (3.6%) |
| 85 Years and over | 174 (2.8%) | 854 (11.0%) |
| Total | 6,183 (100.0%) | 7,781 (100.0%) |
Families and Households in Grass Valley
Median Family Size in Grass Valley
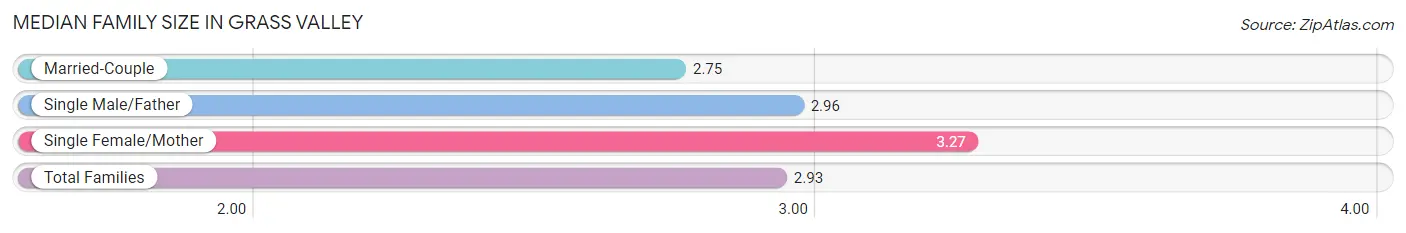
The median family size in Grass Valley is 2.93 persons per family, with single female/mother families (865 | 30.9%) accounting for the largest median family size of 3.27 persons per family. On the other hand, married-couple families (1,658 | 59.2%) represent the smallest median family size with 2.75 persons per family.
| Family Type | # Families | Family Size |
| Married-Couple | 1,658 (59.2%) | 2.75 |
| Single Male/Father | 280 (10.0%) | 2.96 |
| Single Female/Mother | 865 (30.9%) | 3.27 |
| Total Families | 2,803 (100.0%) | 2.93 |
Median Household Size in Grass Valley
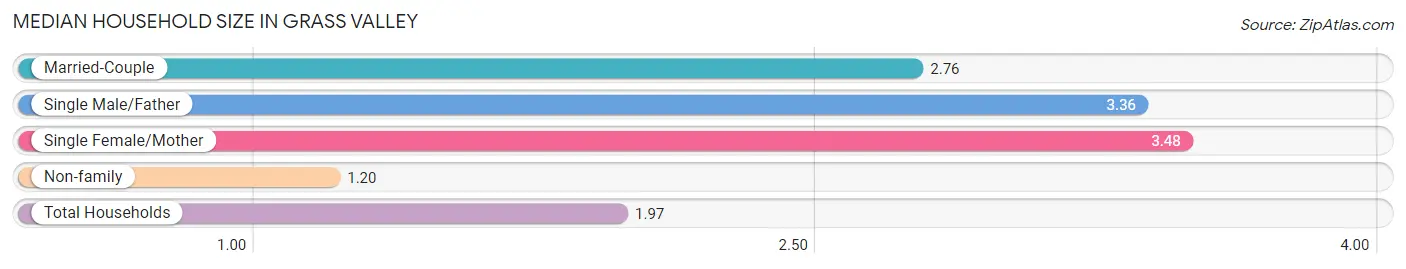
The median household size in Grass Valley is 1.97 persons per household, with single female/mother households (865 | 13.0%) accounting for the largest median household size of 3.48 persons per household. non-family households (3,851 | 57.9%) represent the smallest median household size with 1.20 persons per household.
| Household Type | # Households | Household Size |
| Married-Couple | 1,658 (24.9%) | 2.76 |
| Single Male/Father | 280 (4.2%) | 3.36 |
| Single Female/Mother | 865 (13.0%) | 3.48 |
| Non-family | 3,851 (57.9%) | 1.20 |
| Total Households | 6,654 (100.0%) | 1.97 |
Household Size by Marriage Status in Grass Valley
Out of a total of 6,654 households in Grass Valley, 2,803 (42.1%) are family households, while 3,851 (57.9%) are nonfamily households. The most numerous type of family households are 2-person households, comprising 1,469, and the most common type of nonfamily households are 1-person households, comprising 3,214.
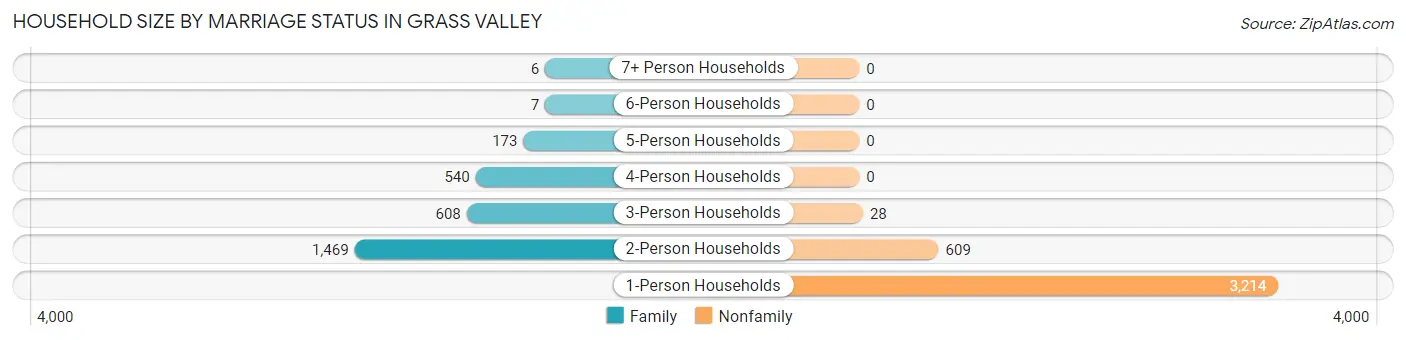
| Household Size | Family Households | Nonfamily Households |
| 1-Person Households | - | 3,214 (48.3%) |
| 2-Person Households | 1,469 (22.1%) | 609 (9.1%) |
| 3-Person Households | 608 (9.1%) | 28 (0.4%) |
| 4-Person Households | 540 (8.1%) | 0 (0.0%) |
| 5-Person Households | 173 (2.6%) | 0 (0.0%) |
| 6-Person Households | 7 (0.1%) | 0 (0.0%) |
| 7+ Person Households | 6 (0.1%) | 0 (0.0%) |
| Total | 2,803 (42.1%) | 3,851 (57.9%) |
Female Fertility in Grass Valley
Fertility by Age in Grass Valley
Average fertility rate in Grass Valley is 88.0 births per 1,000 women. Women in the age bracket of 20 to 34 years have the highest fertility rate with 171.0 births per 1,000 women. Women in the age bracket of 20 to 34 years acount for 98.0% of all women with births.
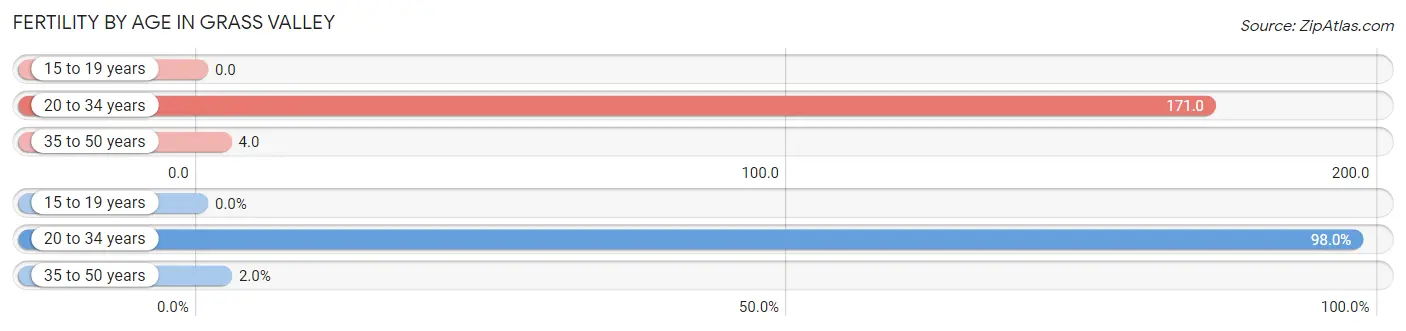
| Age Bracket | Women with Births | Births / 1,000 Women |
| 15 to 19 years | 0 (0.0%) | 0.0 |
| 20 to 34 years | 241 (98.0%) | 171.0 |
| 35 to 50 years | 5 (2.0%) | 4.0 |
| Total | 246 (100.0%) | 88.0 |
Fertility by Age by Marriage Status in Grass Valley
41.5% of women with births (246) in Grass Valley are married. The highest percentage of unmarried women with births falls into 35 to 50 years age bracket with 100.0% of them unmarried at the time of birth, while the lowest percentage of unmarried women with births belong to 20 to 34 years age bracket with 57.7% of them unmarried.
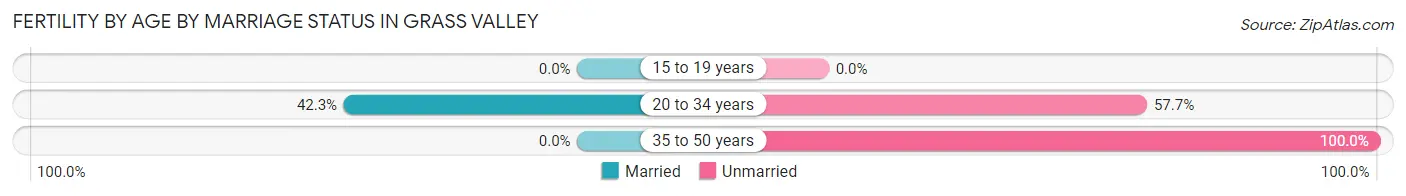
| Age Bracket | Married | Unmarried |
| 15 to 19 years | 0 (0.0%) | 0 (0.0%) |
| 20 to 34 years | 102 (42.3%) | 139 (57.7%) |
| 35 to 50 years | 0 (0.0%) | 5 (100.0%) |
| Total | 102 (41.5%) | 144 (58.5%) |
Fertility by Education in Grass Valley
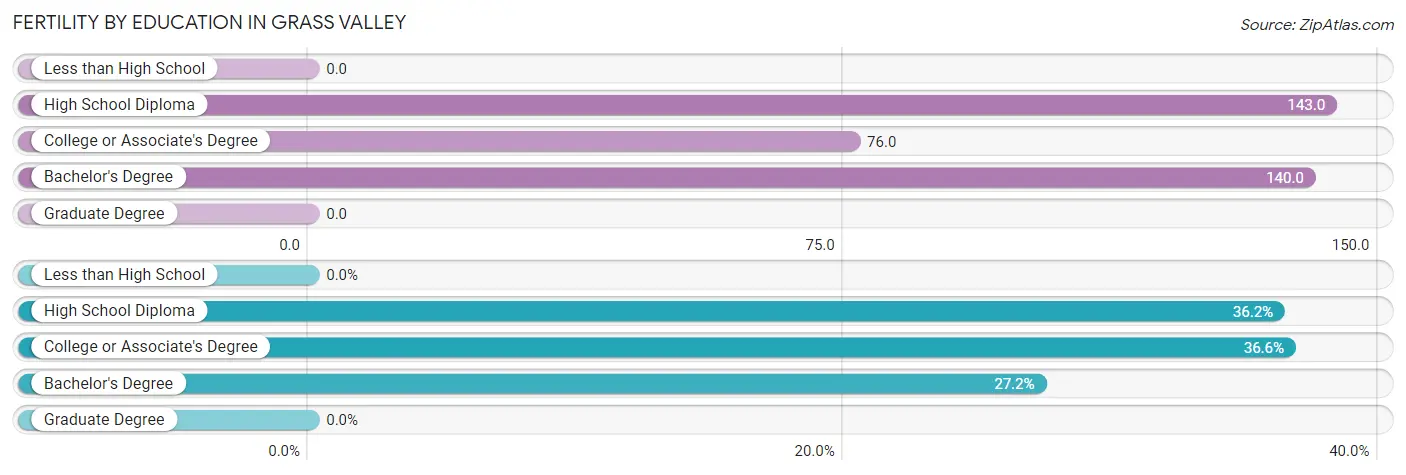
| Educational Attainment | Women with Births | Births / 1,000 Women |
| Less than High School | 0 (0.0%) | 0.0 |
| High School Diploma | 89 (36.2%) | 143.0 |
| College or Associate's Degree | 90 (36.6%) | 76.0 |
| Bachelor's Degree | 67 (27.2%) | 140.0 |
| Graduate Degree | 0 (0.0%) | 0.0 |
| Total | 246 (100.0%) | 88.0 |
Fertility by Education by Marriage Status in Grass Valley
58.5% of women with births in Grass Valley are unmarried. Women with the educational attainment of bachelor's degree are most likely to be married with 100.0% of them married at childbirth, while women with the educational attainment of high school diploma are least likely to be married with 100.0% of them unmarried at childbirth.
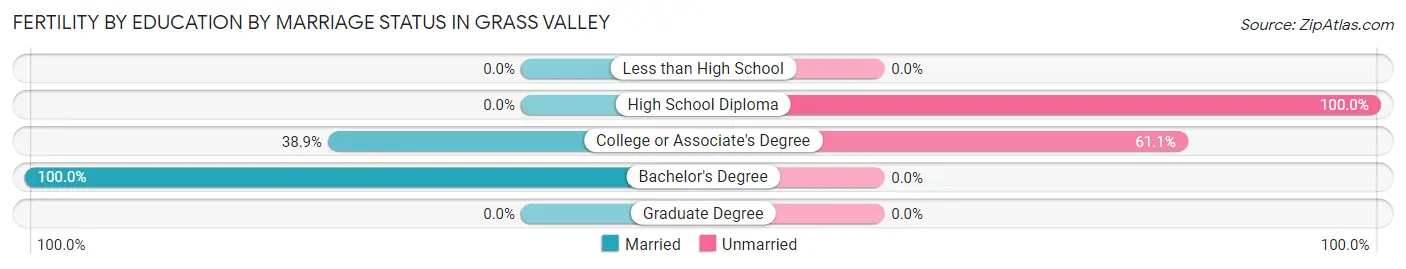
| Educational Attainment | Married | Unmarried |
| Less than High School | 0 (0.0%) | 0 (0.0%) |
| High School Diploma | 0 (0.0%) | 89 (100.0%) |
| College or Associate's Degree | 35 (38.9%) | 55 (61.1%) |
| Bachelor's Degree | 67 (100.0%) | 0 (0.0%) |
| Graduate Degree | 0 (0.0%) | 0 (0.0%) |
| Total | 102 (41.5%) | 144 (58.5%) |
Employment Characteristics in Grass Valley
Employment by Class of Employer in Grass Valley
Among the 5,840 employed individuals in Grass Valley, private company employees (3,400 | 58.2%), self-employed (not incorporated) (637 | 10.9%), and local government employees (589 | 10.1%) make up the most common classes of employment.
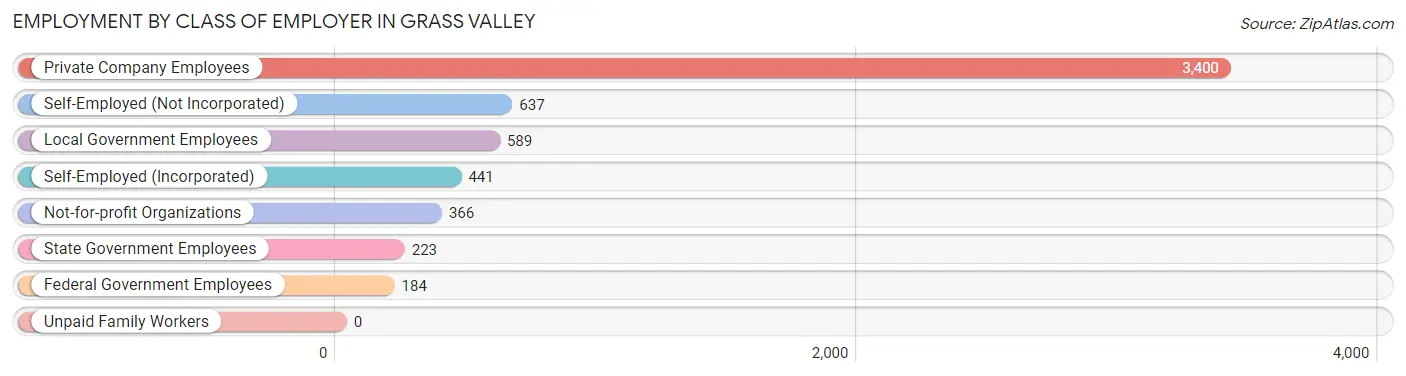
| Employer Class | # Employees | % Employees |
| Private Company Employees | 3,400 | 58.2% |
| Self-Employed (Incorporated) | 441 | 7.5% |
| Self-Employed (Not Incorporated) | 637 | 10.9% |
| Not-for-profit Organizations | 366 | 6.3% |
| Local Government Employees | 589 | 10.1% |
| State Government Employees | 223 | 3.8% |
| Federal Government Employees | 184 | 3.2% |
| Unpaid Family Workers | 0 | 0.0% |
| Total | 5,840 | 100.0% |
Employment Status by Age in Grass Valley
According to the labor force statistics for Grass Valley, out of the total population over 16 years of age (11,389), 53.1% or 6,048 individuals are in the labor force, with 2.3% or 139 of them unemployed. The age group with the highest labor force participation rate is 25 to 29 years, with 92.7% or 750 individuals in the labor force. Within the labor force, the 20 to 24 years age range has the highest percentage of unemployed individuals, with 12.2% or 69 of them being unemployed.
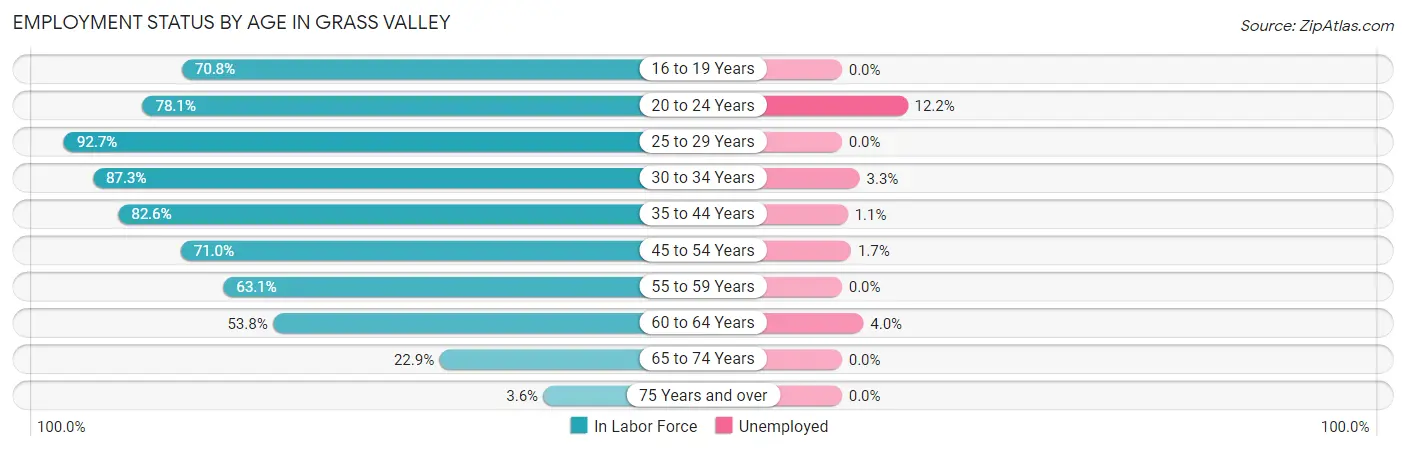
| Age Bracket | In Labor Force | Unemployed |
| 16 to 19 Years | 150 (70.8%) | 0 (0.0%) |
| 20 to 24 Years | 566 (78.1%) | 69 (12.2%) |
| 25 to 29 Years | 750 (92.7%) | 0 (0.0%) |
| 30 to 34 Years | 690 (87.3%) | 23 (3.3%) |
| 35 to 44 Years | 1,158 (82.6%) | 13 (1.1%) |
| 45 to 54 Years | 1,155 (71.0%) | 20 (1.7%) |
| 55 to 59 Years | 560 (63.1%) | 0 (0.0%) |
| 60 to 64 Years | 480 (53.8%) | 19 (4.0%) |
| 65 to 74 Years | 471 (22.9%) | 0 (0.0%) |
| 75 Years and over | 72 (3.6%) | 0 (0.0%) |
| Total | 6,048 (53.1%) | 139 (2.3%) |
Employment Status by Educational Attainment in Grass Valley
According to labor force statistics for Grass Valley, 74.8% of individuals (4,794) out of the total population between 25 and 64 years of age (6,409) are in the labor force, with 1.6% or 77 of them being unemployed. The group with the highest labor force participation rate are those with the educational attainment of bachelor's degree or higher, with 80.3% or 1,628 individuals in the labor force. Within the labor force, individuals with bachelor's degree or higher education have the highest percentage of unemployment, with 2.7% or 44 of them being unemployed.
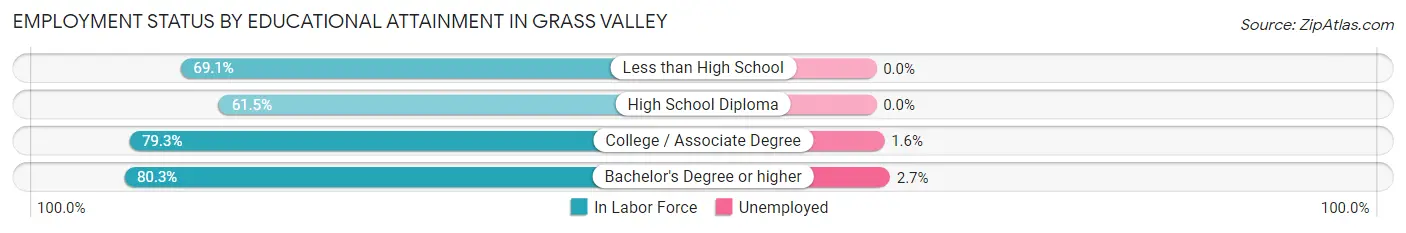
| Educational Attainment | In Labor Force | Unemployed |
| Less than High School | 284 (69.1%) | 0 (0.0%) |
| High School Diploma | 929 (61.5%) | 0 (0.0%) |
| College / Associate Degree | 1,950 (79.3%) | 39 (1.6%) |
| Bachelor's Degree or higher | 1,628 (80.3%) | 55 (2.7%) |
| Total | 4,794 (74.8%) | 103 (1.6%) |
Employment Occupations by Sex in Grass Valley
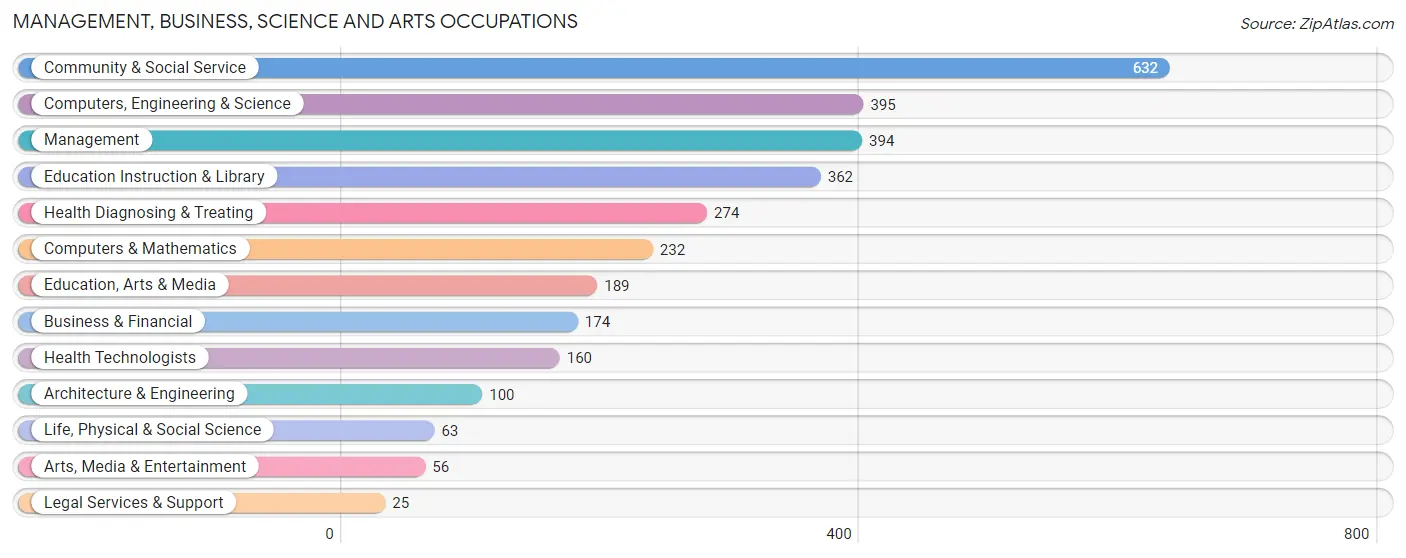
Management, Business, Science and Arts Occupations
The most common Management, Business, Science and Arts occupations in Grass Valley are Community & Social Service (632 | 10.7%), Computers, Engineering & Science (395 | 6.7%), Management (394 | 6.7%), Education Instruction & Library (362 | 6.1%), and Health Diagnosing & Treating (274 | 4.6%).
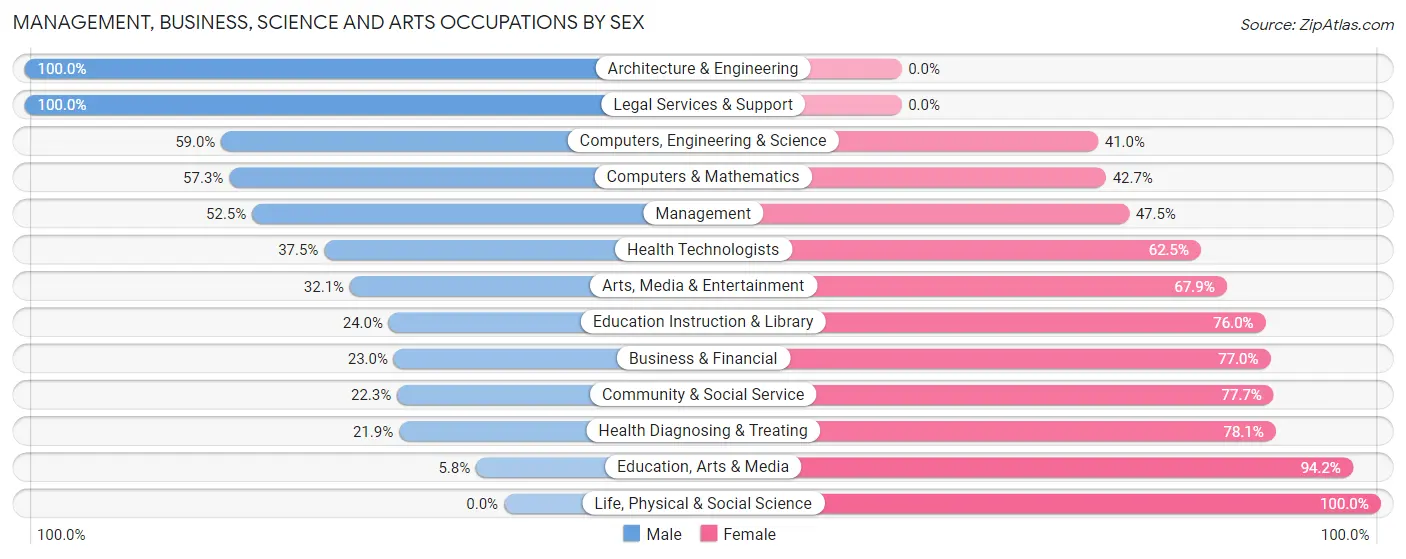
Management, Business, Science and Arts Occupations by Sex
Within the Management, Business, Science and Arts occupations in Grass Valley, the most male-oriented occupations are Architecture & Engineering (100.0%), Legal Services & Support (100.0%), and Computers, Engineering & Science (59.0%), while the most female-oriented occupations are Life, Physical & Social Science (100.0%), Education, Arts & Media (94.2%), and Health Diagnosing & Treating (78.1%).
| Occupation | Male | Female |
| Management | 207 (52.5%) | 187 (47.5%) |
| Business & Financial | 40 (23.0%) | 134 (77.0%) |
| Computers, Engineering & Science | 233 (59.0%) | 162 (41.0%) |
| Computers & Mathematics | 133 (57.3%) | 99 (42.7%) |
| Architecture & Engineering | 100 (100.0%) | 0 (0.0%) |
| Life, Physical & Social Science | 0 (0.0%) | 63 (100.0%) |
| Community & Social Service | 141 (22.3%) | 491 (77.7%) |
| Education, Arts & Media | 11 (5.8%) | 178 (94.2%) |
| Legal Services & Support | 25 (100.0%) | 0 (0.0%) |
| Education Instruction & Library | 87 (24.0%) | 275 (76.0%) |
| Arts, Media & Entertainment | 18 (32.1%) | 38 (67.9%) |
| Health Diagnosing & Treating | 60 (21.9%) | 214 (78.1%) |
| Health Technologists | 60 (37.5%) | 100 (62.5%) |
| Total (Category) | 681 (36.4%) | 1,188 (63.6%) |
| Total (Overall) | 2,666 (45.3%) | 3,221 (54.7%) |
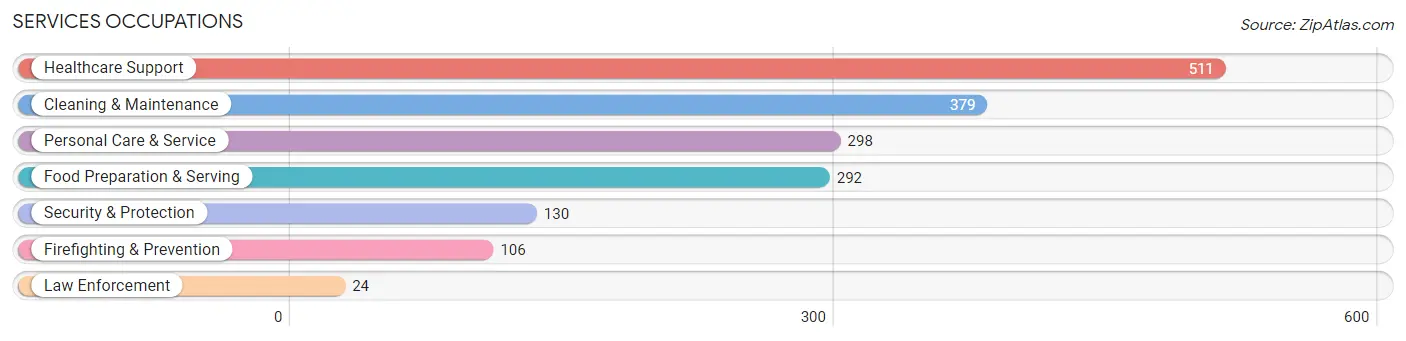
Services Occupations
The most common Services occupations in Grass Valley are Healthcare Support (511 | 8.7%), Cleaning & Maintenance (379 | 6.4%), Personal Care & Service (298 | 5.1%), Food Preparation & Serving (292 | 5.0%), and Security & Protection (130 | 2.2%).
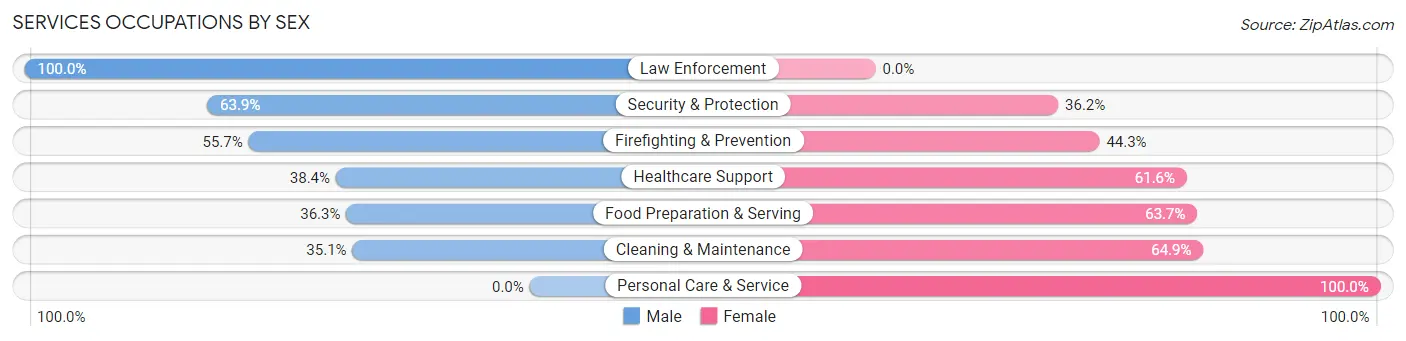
Services Occupations by Sex
Within the Services occupations in Grass Valley, the most male-oriented occupations are Law Enforcement (100.0%), Security & Protection (63.8%), and Firefighting & Prevention (55.7%), while the most female-oriented occupations are Personal Care & Service (100.0%), Cleaning & Maintenance (64.9%), and Food Preparation & Serving (63.7%).
| Occupation | Male | Female |
| Healthcare Support | 196 (38.4%) | 315 (61.6%) |
| Security & Protection | 83 (63.8%) | 47 (36.1%) |
| Firefighting & Prevention | 59 (55.7%) | 47 (44.3%) |
| Law Enforcement | 24 (100.0%) | 0 (0.0%) |
| Food Preparation & Serving | 106 (36.3%) | 186 (63.7%) |
| Cleaning & Maintenance | 133 (35.1%) | 246 (64.9%) |
| Personal Care & Service | 0 (0.0%) | 298 (100.0%) |
| Total (Category) | 518 (32.2%) | 1,092 (67.8%) |
| Total (Overall) | 2,666 (45.3%) | 3,221 (54.7%) |
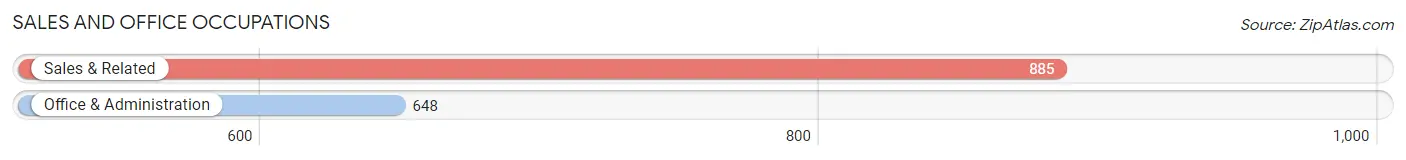
Sales and Office Occupations
The most common Sales and Office occupations in Grass Valley are Sales & Related (885 | 15.0%), and Office & Administration (648 | 11.0%).
Sales and Office Occupations by Sex
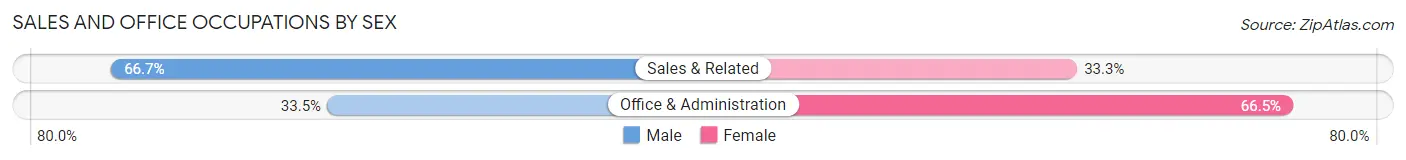
| Occupation | Male | Female |
| Sales & Related | 590 (66.7%) | 295 (33.3%) |
| Office & Administration | 217 (33.5%) | 431 (66.5%) |
| Total (Category) | 807 (52.6%) | 726 (47.4%) |
| Total (Overall) | 2,666 (45.3%) | 3,221 (54.7%) |
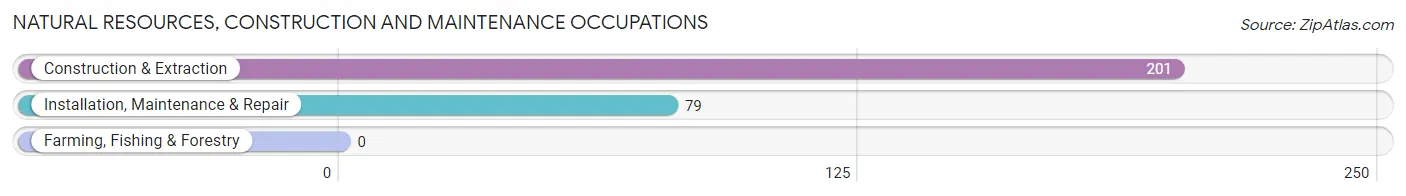
Natural Resources, Construction and Maintenance Occupations
The most common Natural Resources, Construction and Maintenance occupations in Grass Valley are Construction & Extraction (201 | 3.4%), and Installation, Maintenance & Repair (79 | 1.3%).
Natural Resources, Construction and Maintenance Occupations by Sex
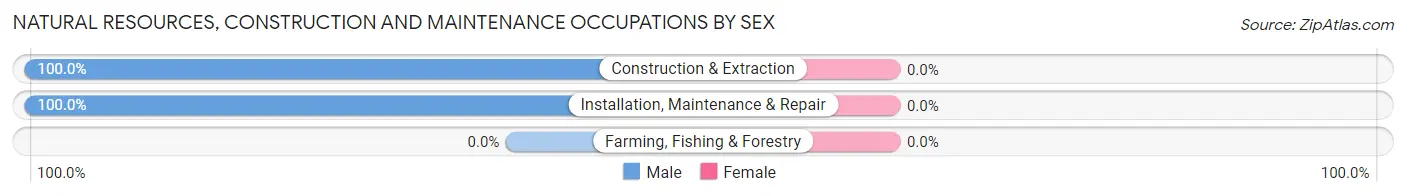
| Occupation | Male | Female |
| Farming, Fishing & Forestry | 0 (0.0%) | 0 (0.0%) |
| Construction & Extraction | 201 (100.0%) | 0 (0.0%) |
| Installation, Maintenance & Repair | 79 (100.0%) | 0 (0.0%) |
| Total (Category) | 280 (100.0%) | 0 (0.0%) |
| Total (Overall) | 2,666 (45.3%) | 3,221 (54.7%) |
Production, Transportation and Moving Occupations
The most common Production, Transportation and Moving occupations in Grass Valley are Transportation (248 | 4.2%), Production (239 | 4.1%), and Material Moving (108 | 1.8%).
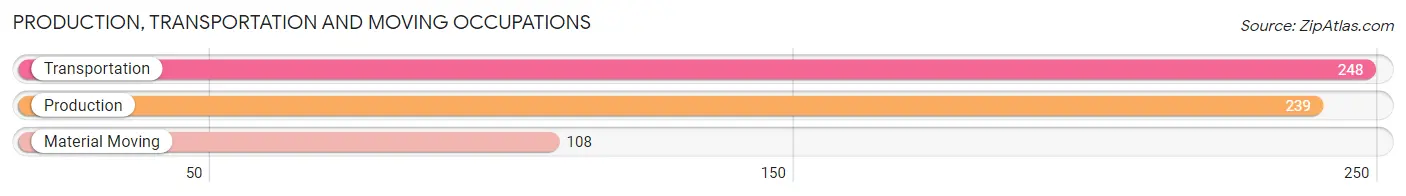
Production, Transportation and Moving Occupations by Sex
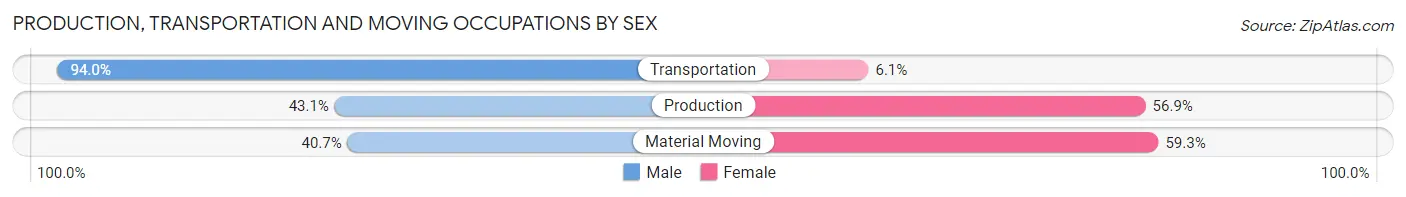
| Occupation | Male | Female |
| Production | 103 (43.1%) | 136 (56.9%) |
| Transportation | 233 (94.0%) | 15 (6.0%) |
| Material Moving | 44 (40.7%) | 64 (59.3%) |
| Total (Category) | 380 (63.9%) | 215 (36.1%) |
| Total (Overall) | 2,666 (45.3%) | 3,221 (54.7%) |
Employment Industries by Sex in Grass Valley
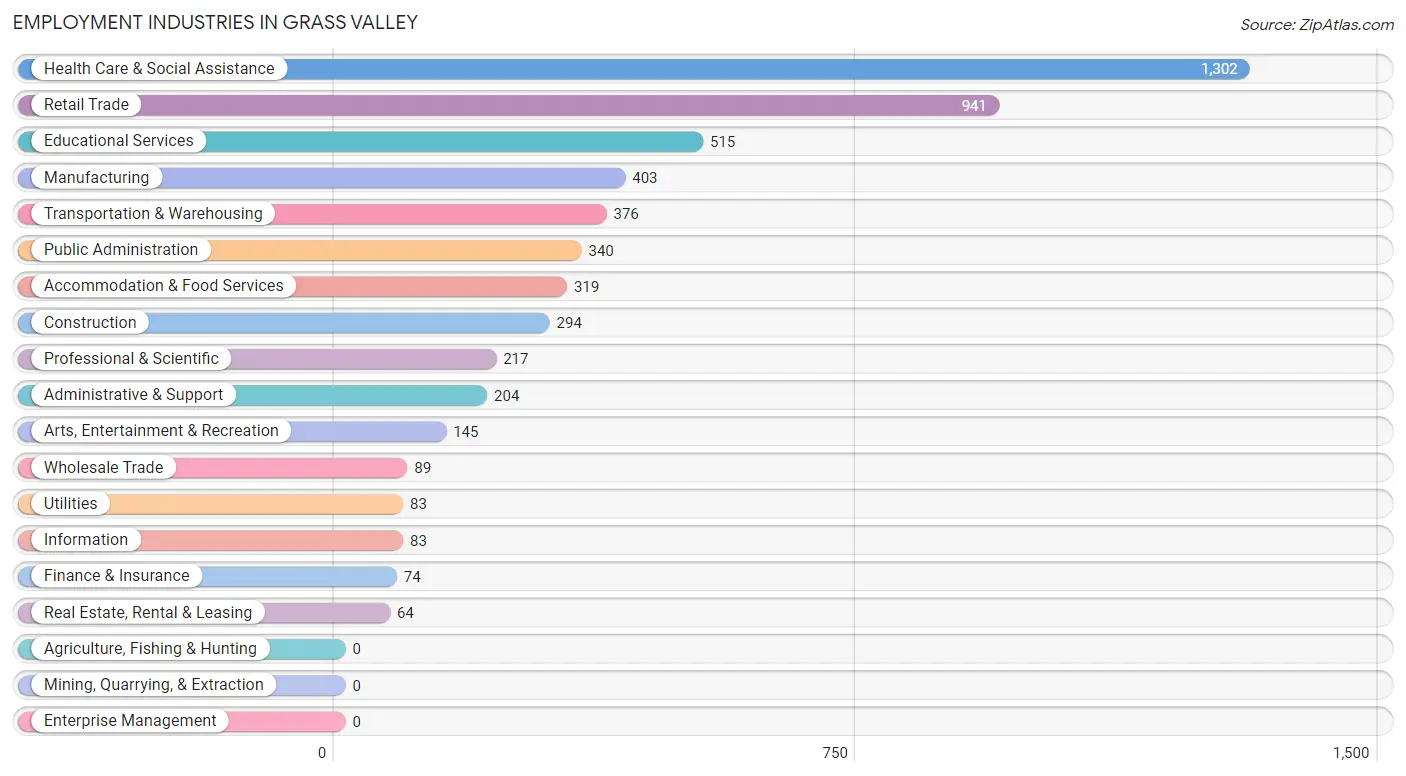
Employment Industries in Grass Valley
The major employment industries in Grass Valley include Health Care & Social Assistance (1,302 | 22.1%), Retail Trade (941 | 16.0%), Educational Services (515 | 8.7%), Manufacturing (403 | 6.9%), and Transportation & Warehousing (376 | 6.4%).
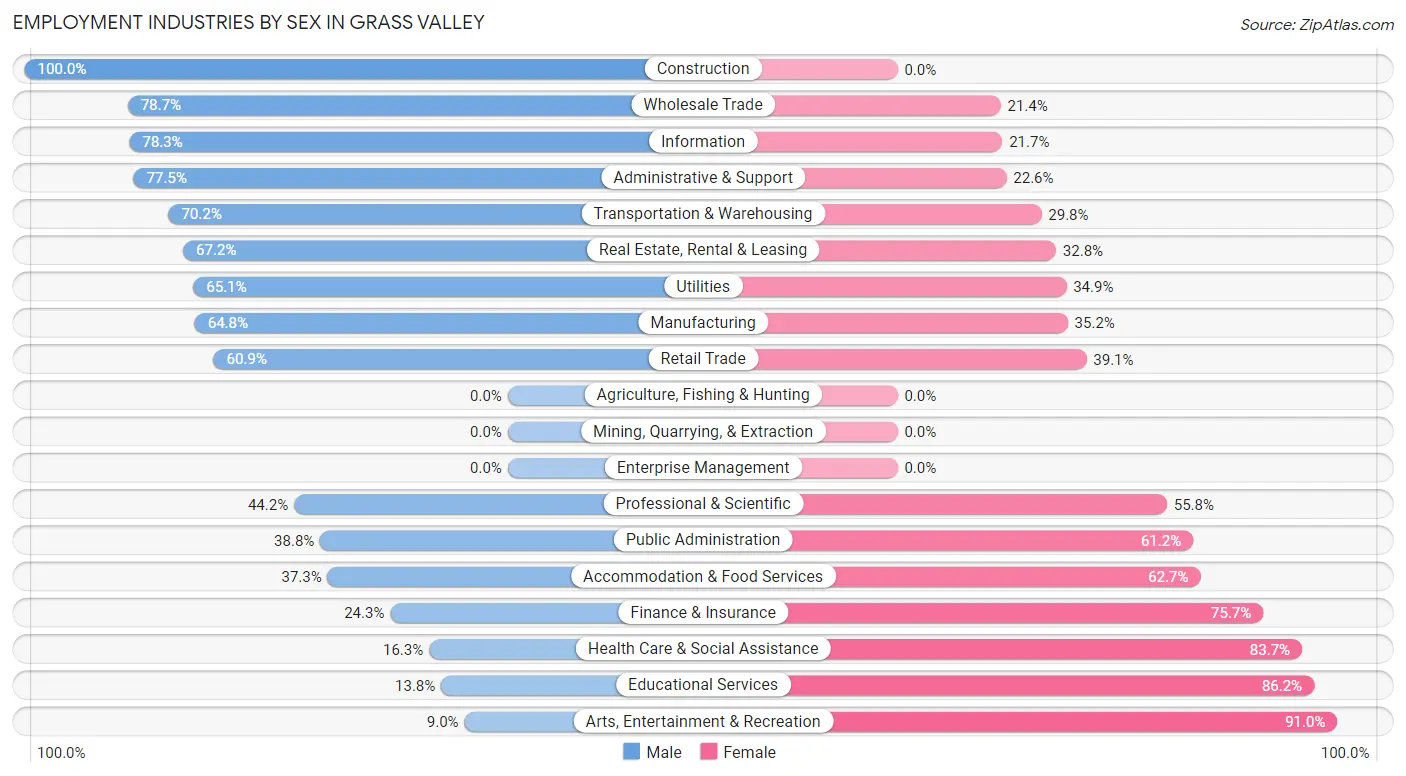
Employment Industries by Sex in Grass Valley
The Grass Valley industries that see more men than women are Construction (100.0%), Wholesale Trade (78.6%), and Information (78.3%), whereas the industries that tend to have a higher number of women are Arts, Entertainment & Recreation (91.0%), Educational Services (86.2%), and Health Care & Social Assistance (83.7%).
| Industry | Male | Female |
| Agriculture, Fishing & Hunting | 0 (0.0%) | 0 (0.0%) |
| Mining, Quarrying, & Extraction | 0 (0.0%) | 0 (0.0%) |
| Construction | 294 (100.0%) | 0 (0.0%) |
| Manufacturing | 261 (64.8%) | 142 (35.2%) |
| Wholesale Trade | 70 (78.6%) | 19 (21.3%) |
| Retail Trade | 573 (60.9%) | 368 (39.1%) |
| Transportation & Warehousing | 264 (70.2%) | 112 (29.8%) |
| Utilities | 54 (65.1%) | 29 (34.9%) |
| Information | 65 (78.3%) | 18 (21.7%) |
| Finance & Insurance | 18 (24.3%) | 56 (75.7%) |
| Real Estate, Rental & Leasing | 43 (67.2%) | 21 (32.8%) |
| Professional & Scientific | 96 (44.2%) | 121 (55.8%) |
| Enterprise Management | 0 (0.0%) | 0 (0.0%) |
| Administrative & Support | 158 (77.4%) | 46 (22.6%) |
| Educational Services | 71 (13.8%) | 444 (86.2%) |
| Health Care & Social Assistance | 212 (16.3%) | 1,090 (83.7%) |
| Arts, Entertainment & Recreation | 13 (9.0%) | 132 (91.0%) |
| Accommodation & Food Services | 119 (37.3%) | 200 (62.7%) |
| Public Administration | 132 (38.8%) | 208 (61.2%) |
| Total | 2,666 (45.3%) | 3,221 (54.7%) |
Education in Grass Valley
School Enrollment in Grass Valley
The most common levels of schooling among the 2,431 students in Grass Valley are elementary school (677 | 27.9%), middle school (656 | 27.0%), and college / undergraduate (439 | 18.1%).
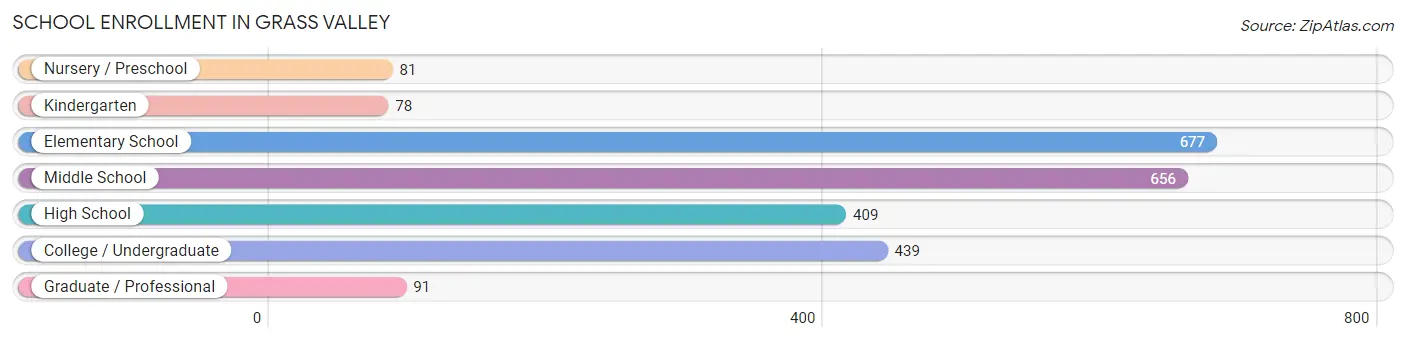
| School Level | # Students | % Students |
| Nursery / Preschool | 81 | 3.3% |
| Kindergarten | 78 | 3.2% |
| Elementary School | 677 | 27.9% |
| Middle School | 656 | 27.0% |
| High School | 409 | 16.8% |
| College / Undergraduate | 439 | 18.1% |
| Graduate / Professional | 91 | 3.7% |
| Total | 2,431 | 100.0% |
School Enrollment by Age by Funding Source in Grass Valley
Out of a total of 2,431 students who are enrolled in schools in Grass Valley, 209 (8.6%) attend a private institution, while the remaining 2,222 (91.4%) are enrolled in public schools. The age group of 35 years and over has the highest likelihood of being enrolled in private schools, with 69 (28.5% in the age bracket) enrolled. Conversely, the age group of 18 to 19 year olds has the lowest likelihood of being enrolled in a private school, with 43 (100.0% in the age bracket) attending a public institution.
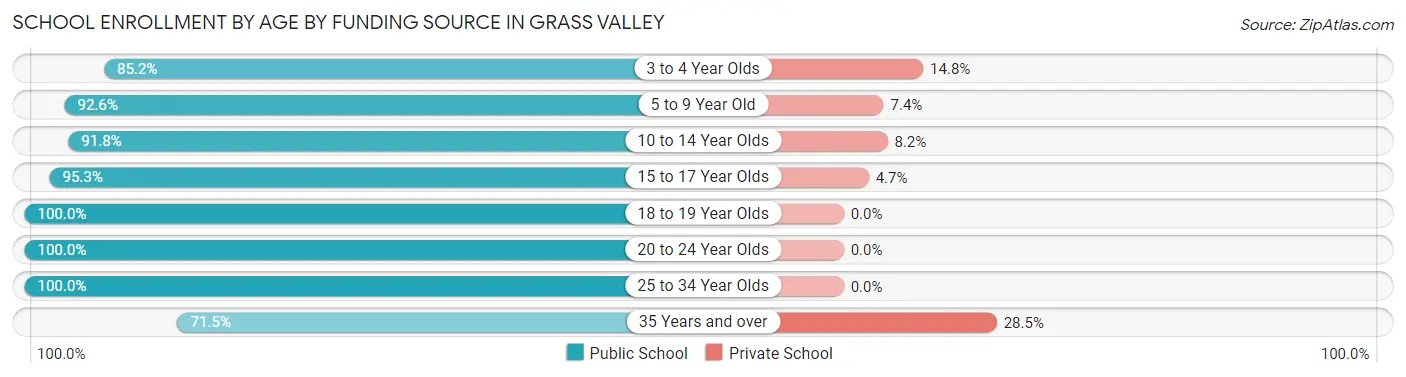
| Age Bracket | Public School | Private School |
| 3 to 4 Year Olds | 69 (85.2%) | 12 (14.8%) |
| 5 to 9 Year Old | 647 (92.6%) | 52 (7.4%) |
| 10 to 14 Year Olds | 697 (91.8%) | 62 (8.2%) |
| 15 to 17 Year Olds | 307 (95.3%) | 15 (4.7%) |
| 18 to 19 Year Olds | 43 (100.0%) | 0 (0.0%) |
| 20 to 24 Year Olds | 146 (100.0%) | 0 (0.0%) |
| 25 to 34 Year Olds | 139 (100.0%) | 0 (0.0%) |
| 35 Years and over | 173 (71.5%) | 69 (28.5%) |
| Total | 2,222 (91.4%) | 209 (8.6%) |
Educational Attainment by Field of Study in Grass Valley
Psychology (482 | 13.5%), visual & performing arts (388 | 10.8%), business (350 | 9.8%), social sciences (326 | 9.1%), and science & technology (300 | 8.4%) are the most common fields of study among 3,577 individuals in Grass Valley who have obtained a bachelor's degree or higher.
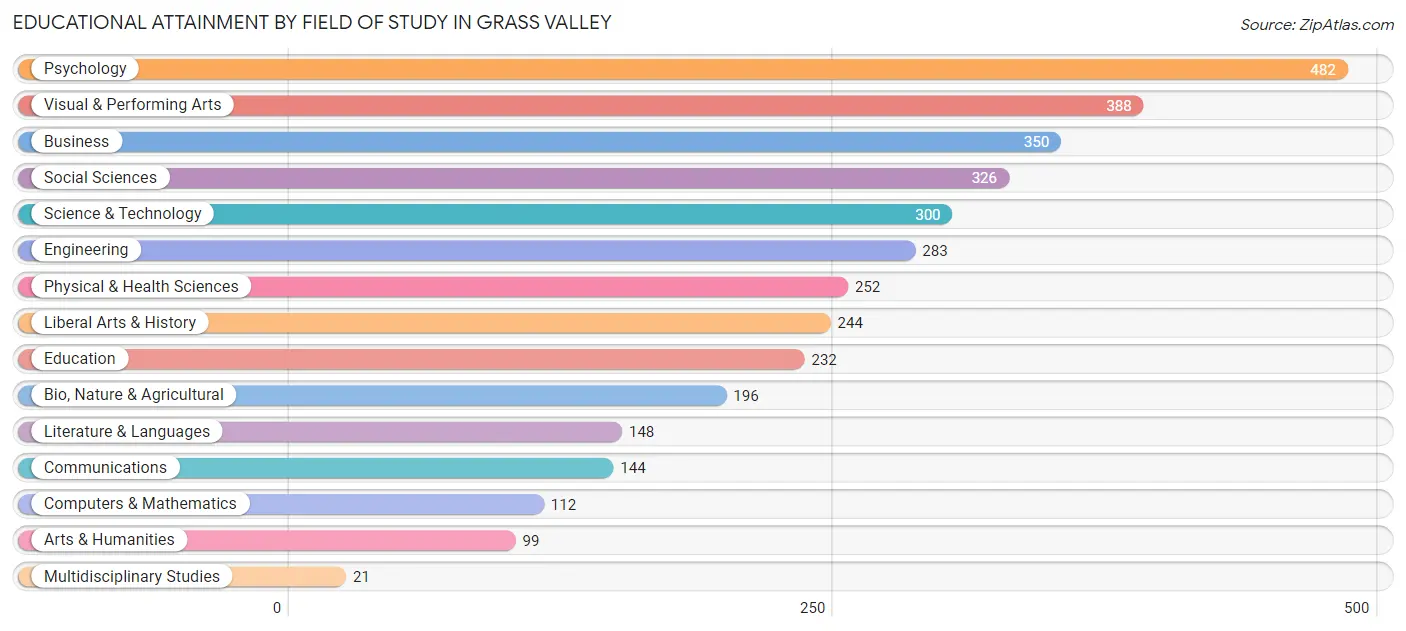
| Field of Study | # Graduates | % Graduates |
| Computers & Mathematics | 112 | 3.1% |
| Bio, Nature & Agricultural | 196 | 5.5% |
| Physical & Health Sciences | 252 | 7.0% |
| Psychology | 482 | 13.5% |
| Social Sciences | 326 | 9.1% |
| Engineering | 283 | 7.9% |
| Multidisciplinary Studies | 21 | 0.6% |
| Science & Technology | 300 | 8.4% |
| Business | 350 | 9.8% |
| Education | 232 | 6.5% |
| Literature & Languages | 148 | 4.1% |
| Liberal Arts & History | 244 | 6.8% |
| Visual & Performing Arts | 388 | 10.8% |
| Communications | 144 | 4.0% |
| Arts & Humanities | 99 | 2.8% |
| Total | 3,577 | 100.0% |
Transportation & Commute in Grass Valley
Vehicle Availability by Sex in Grass Valley
The most prevalent vehicle ownership categories in Grass Valley are males with 2 vehicles (1,138, accounting for 42.6%) and females with 2 vehicles (1,458, making up 36.1%).
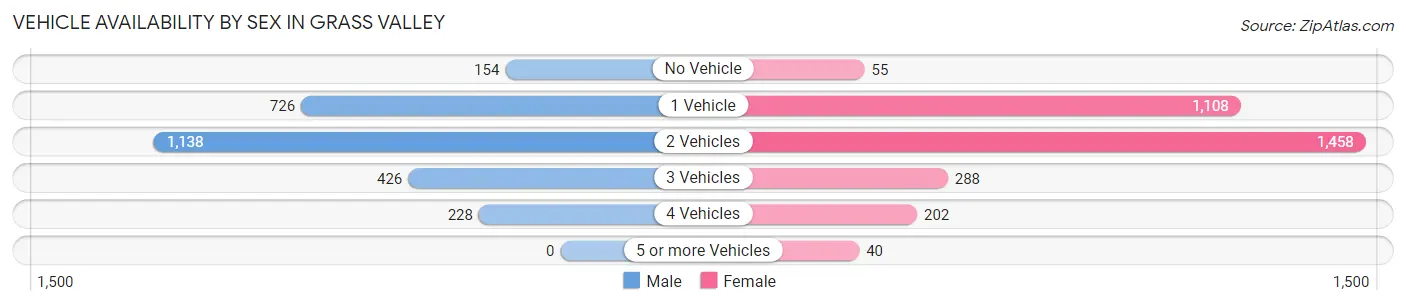
| Vehicles Available | Male | Female |
| No Vehicle | 154 (5.8%) | 55 (1.8%) |
| 1 Vehicle | 726 (27.2%) | 1,108 (35.2%) |
| 2 Vehicles | 1,138 (42.6%) | 1,458 (46.3%) |
| 3 Vehicles | 426 (15.9%) | 288 (9.1%) |
| 4 Vehicles | 228 (8.5%) | 202 (6.4%) |
| 5 or more Vehicles | 0 (0.0%) | 40 (1.3%) |
| Total | 2,672 (100.0%) | 3,151 (100.0%) |
Commute Time in Grass Valley
The most frequently occuring commute durations in Grass Valley are 5 to 9 minutes (1,945 commuters, 38.4%), 10 to 14 minutes (1,073 commuters, 21.2%), and 15 to 19 minutes (638 commuters, 12.6%).
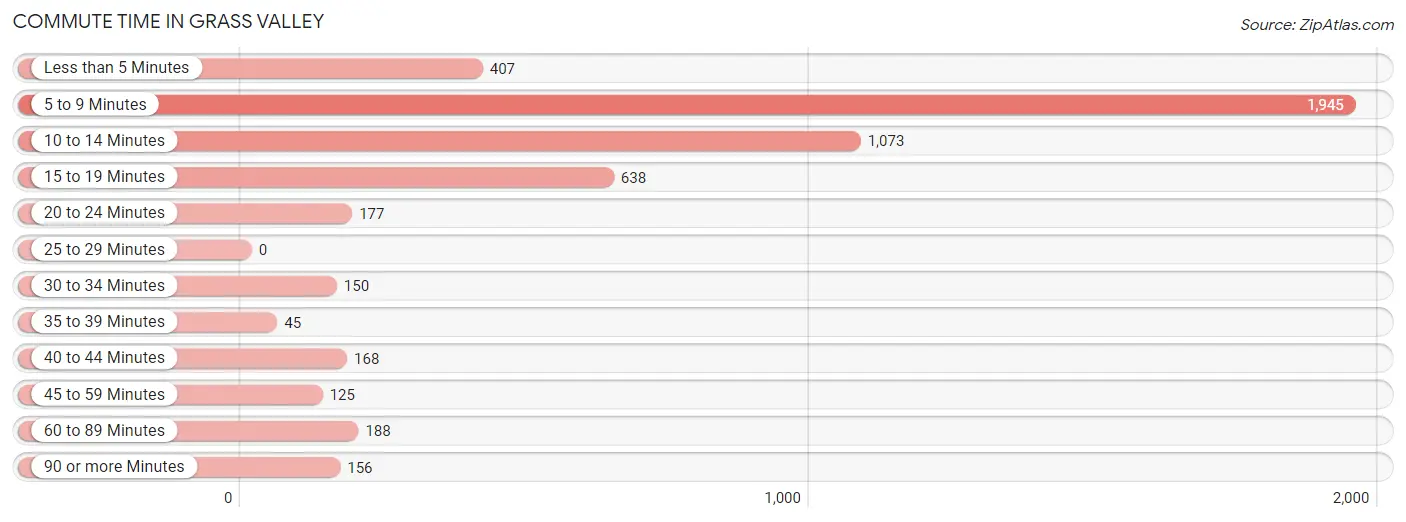
| Commute Time | # Commuters | % Commuters |
| Less than 5 Minutes | 407 | 8.0% |
| 5 to 9 Minutes | 1,945 | 38.4% |
| 10 to 14 Minutes | 1,073 | 21.2% |
| 15 to 19 Minutes | 638 | 12.6% |
| 20 to 24 Minutes | 177 | 3.5% |
| 25 to 29 Minutes | 0 | 0.0% |
| 30 to 34 Minutes | 150 | 3.0% |
| 35 to 39 Minutes | 45 | 0.9% |
| 40 to 44 Minutes | 168 | 3.3% |
| 45 to 59 Minutes | 125 | 2.5% |
| 60 to 89 Minutes | 188 | 3.7% |
| 90 or more Minutes | 156 | 3.1% |
Commute Time by Sex in Grass Valley
The most common commute times in Grass Valley are 5 to 9 minutes (1,041 commuters, 44.6%) for males and 5 to 9 minutes (904 commuters, 33.0%) for females.
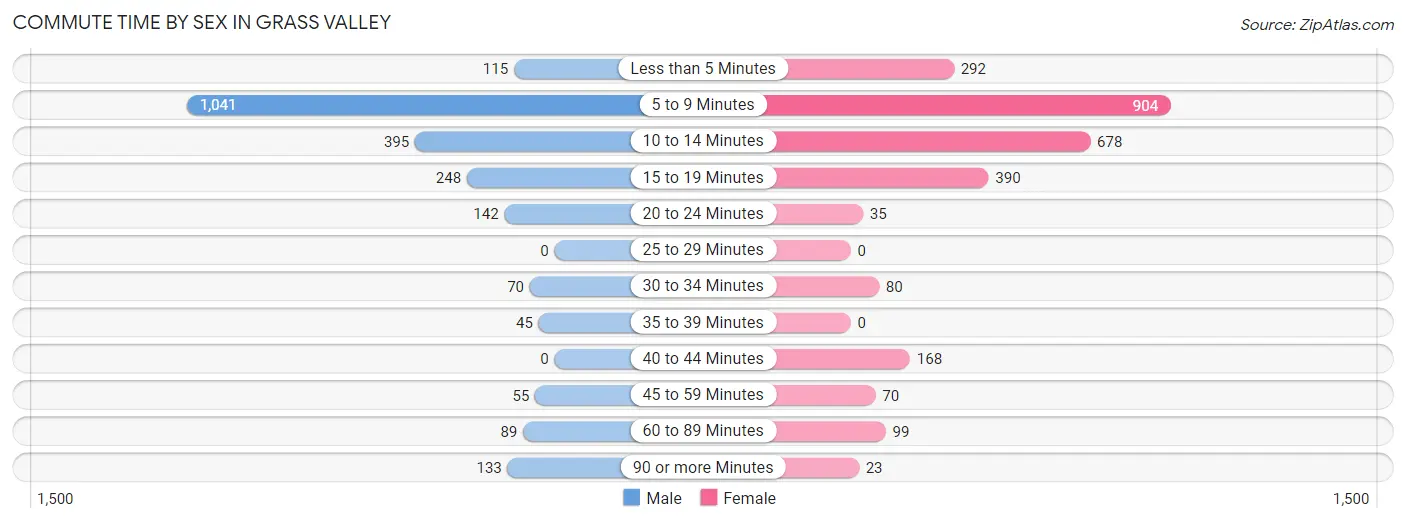
| Commute Time | Male | Female |
| Less than 5 Minutes | 115 (4.9%) | 292 (10.7%) |
| 5 to 9 Minutes | 1,041 (44.6%) | 904 (33.0%) |
| 10 to 14 Minutes | 395 (16.9%) | 678 (24.7%) |
| 15 to 19 Minutes | 248 (10.6%) | 390 (14.2%) |
| 20 to 24 Minutes | 142 (6.1%) | 35 (1.3%) |
| 25 to 29 Minutes | 0 (0.0%) | 0 (0.0%) |
| 30 to 34 Minutes | 70 (3.0%) | 80 (2.9%) |
| 35 to 39 Minutes | 45 (1.9%) | 0 (0.0%) |
| 40 to 44 Minutes | 0 (0.0%) | 168 (6.1%) |
| 45 to 59 Minutes | 55 (2.4%) | 70 (2.6%) |
| 60 to 89 Minutes | 89 (3.8%) | 99 (3.6%) |
| 90 or more Minutes | 133 (5.7%) | 23 (0.8%) |
Time of Departure to Work by Sex in Grass Valley
The most frequent times of departure to work in Grass Valley are 8:30 AM to 8:59 AM (281, 12.0%) for males and 9:00 AM to 9:59 AM (433, 15.8%) for females.
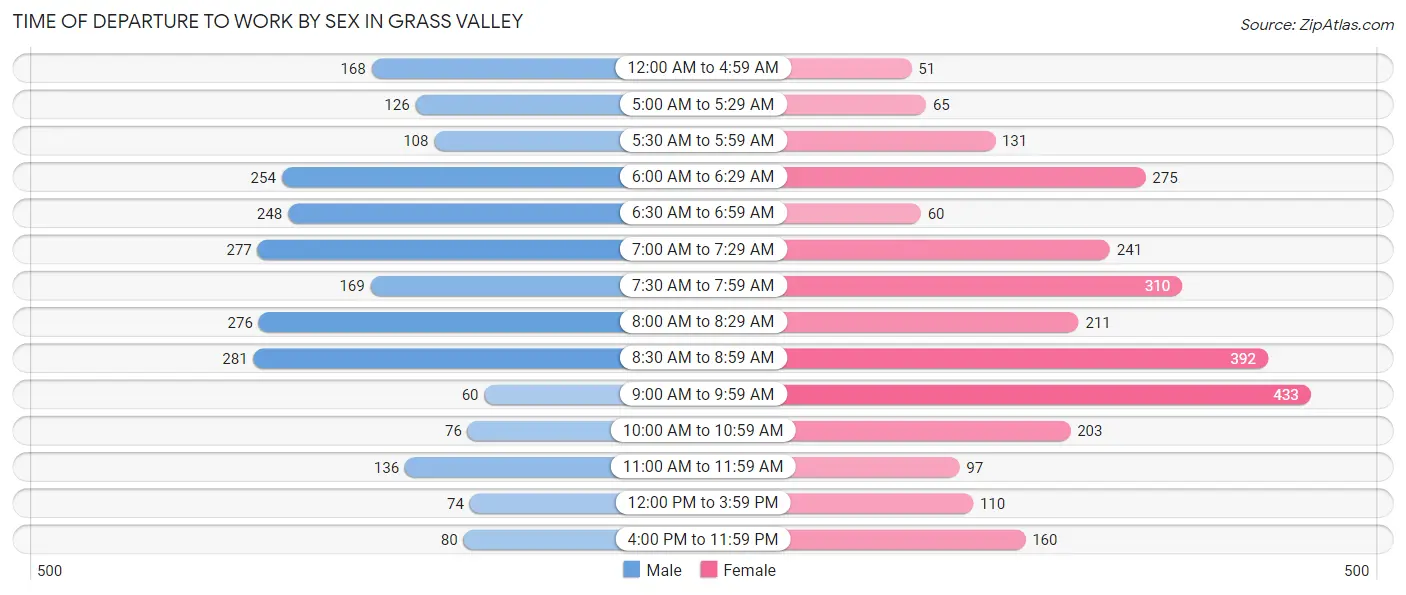
| Time of Departure | Male | Female |
| 12:00 AM to 4:59 AM | 168 (7.2%) | 51 (1.9%) |
| 5:00 AM to 5:29 AM | 126 (5.4%) | 65 (2.4%) |
| 5:30 AM to 5:59 AM | 108 (4.6%) | 131 (4.8%) |
| 6:00 AM to 6:29 AM | 254 (10.9%) | 275 (10.0%) |
| 6:30 AM to 6:59 AM | 248 (10.6%) | 60 (2.2%) |
| 7:00 AM to 7:29 AM | 277 (11.9%) | 241 (8.8%) |
| 7:30 AM to 7:59 AM | 169 (7.2%) | 310 (11.3%) |
| 8:00 AM to 8:29 AM | 276 (11.8%) | 211 (7.7%) |
| 8:30 AM to 8:59 AM | 281 (12.0%) | 392 (14.3%) |
| 9:00 AM to 9:59 AM | 60 (2.6%) | 433 (15.8%) |
| 10:00 AM to 10:59 AM | 76 (3.3%) | 203 (7.4%) |
| 11:00 AM to 11:59 AM | 136 (5.8%) | 97 (3.5%) |
| 12:00 PM to 3:59 PM | 74 (3.2%) | 110 (4.0%) |
| 4:00 PM to 11:59 PM | 80 (3.4%) | 160 (5.8%) |
| Total | 2,333 (100.0%) | 2,739 (100.0%) |
Housing Occupancy in Grass Valley
Occupancy by Ownership in Grass Valley
Of the total 6,654 dwellings in Grass Valley, owner-occupied units account for 2,732 (41.1%), while renter-occupied units make up 3,922 (58.9%).
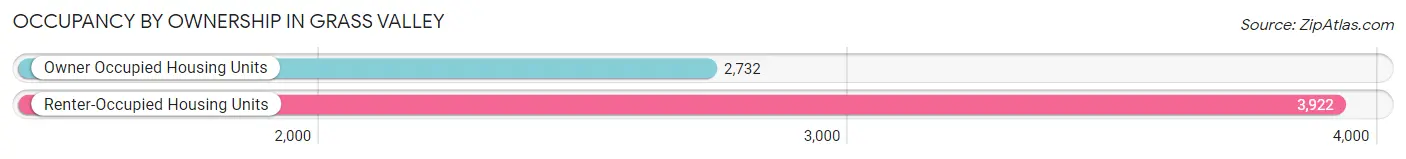
| Occupancy | # Housing Units | % Housing Units |
| Owner Occupied Housing Units | 2,732 | 41.1% |
| Renter-Occupied Housing Units | 3,922 | 58.9% |
| Total Occupied Housing Units | 6,654 | 100.0% |
Occupancy by Household Size in Grass Valley
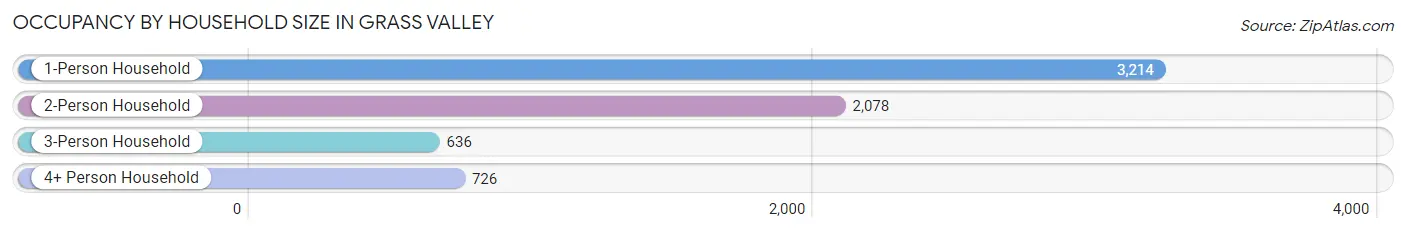
| Household Size | # Housing Units | % Housing Units |
| 1-Person Household | 3,214 | 48.3% |
| 2-Person Household | 2,078 | 31.2% |
| 3-Person Household | 636 | 9.6% |
| 4+ Person Household | 726 | 10.9% |
| Total Housing Units | 6,654 | 100.0% |
Occupancy by Ownership by Household Size in Grass Valley
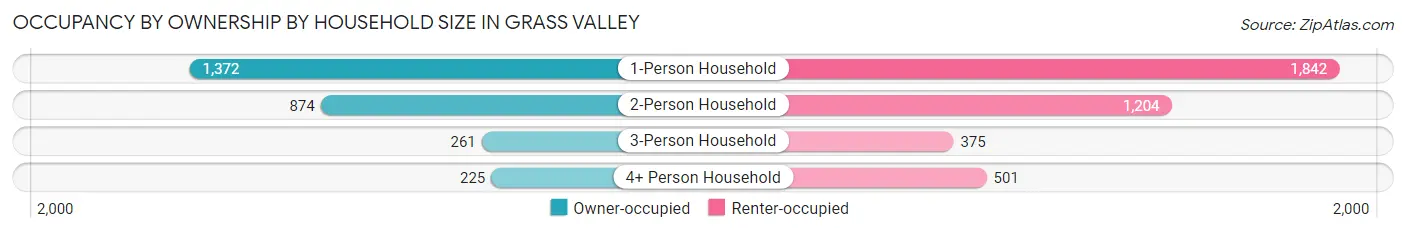
| Household Size | Owner-occupied | Renter-occupied |
| 1-Person Household | 1,372 (42.7%) | 1,842 (57.3%) |
| 2-Person Household | 874 (42.1%) | 1,204 (57.9%) |
| 3-Person Household | 261 (41.0%) | 375 (59.0%) |
| 4+ Person Household | 225 (31.0%) | 501 (69.0%) |
| Total Housing Units | 2,732 (41.1%) | 3,922 (58.9%) |
Occupancy by Educational Attainment in Grass Valley
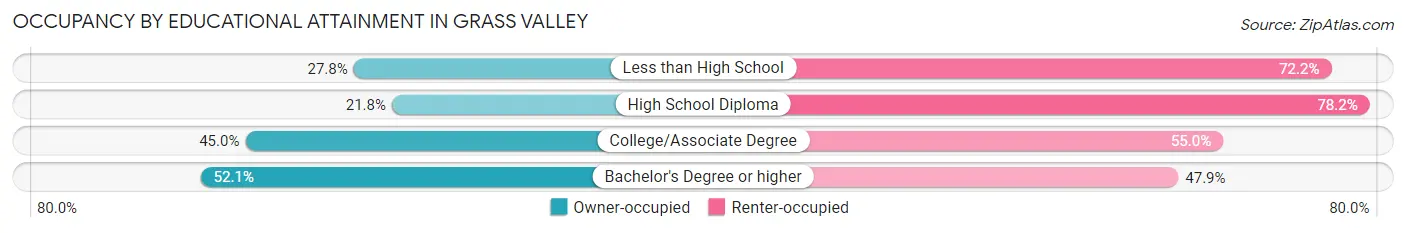
| Household Size | Owner-occupied | Renter-occupied |
| Less than High School | 172 (27.8%) | 446 (72.2%) |
| High School Diploma | 287 (21.8%) | 1,032 (78.2%) |
| College/Associate Degree | 1,165 (45.0%) | 1,424 (55.0%) |
| Bachelor's Degree or higher | 1,108 (52.1%) | 1,020 (47.9%) |
Occupancy by Age of Householder in Grass Valley
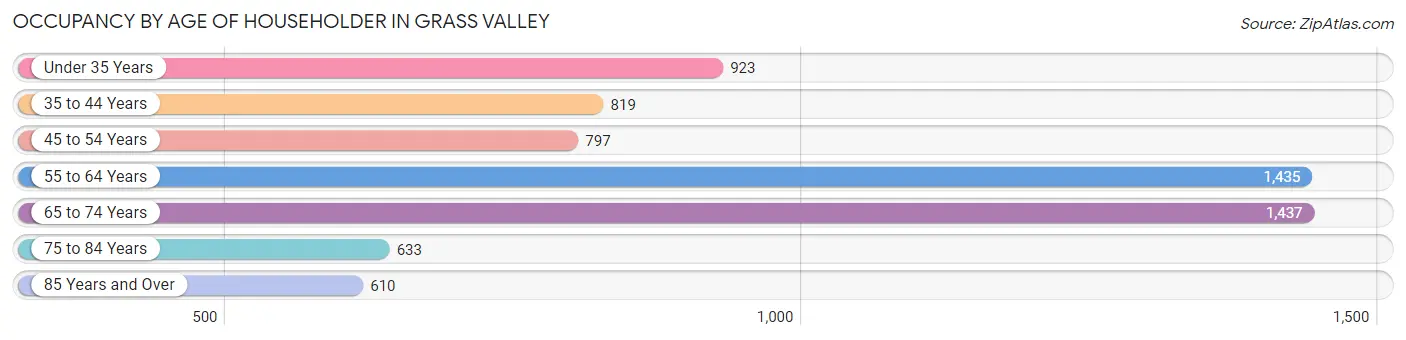
| Age Bracket | # Households | % Households |
| Under 35 Years | 923 | 13.9% |
| 35 to 44 Years | 819 | 12.3% |
| 45 to 54 Years | 797 | 12.0% |
| 55 to 64 Years | 1,435 | 21.6% |
| 65 to 74 Years | 1,437 | 21.6% |
| 75 to 84 Years | 633 | 9.5% |
| 85 Years and Over | 610 | 9.2% |
| Total | 6,654 | 100.0% |
Housing Finances in Grass Valley
Median Income by Occupancy in Grass Valley
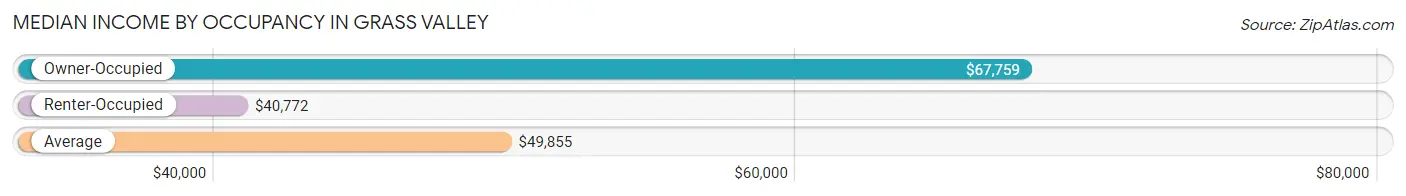
| Occupancy Type | # Households | Median Income |
| Owner-Occupied | 2,732 (41.1%) | $67,759 |
| Renter-Occupied | 3,922 (58.9%) | $40,772 |
| Average | 6,654 (100.0%) | $49,855 |
Occupancy by Householder Income Bracket in Grass Valley
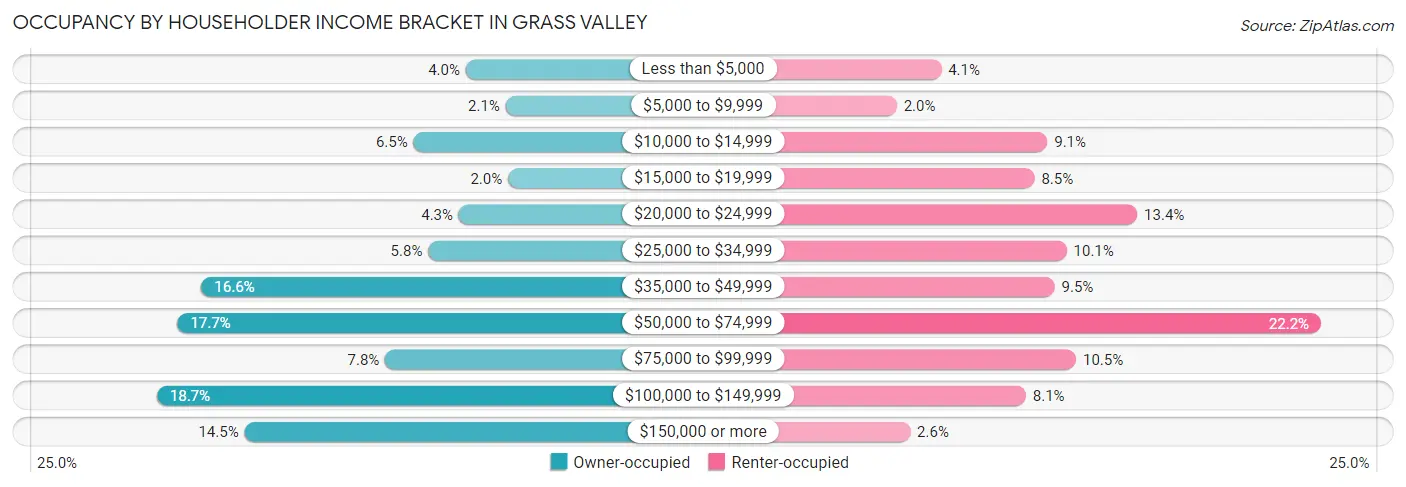
| Income Bracket | Owner-occupied | Renter-occupied |
| Less than $5,000 | 109 (4.0%) | 160 (4.1%) |
| $5,000 to $9,999 | 57 (2.1%) | 77 (2.0%) |
| $10,000 to $14,999 | 177 (6.5%) | 358 (9.1%) |
| $15,000 to $19,999 | 54 (2.0%) | 334 (8.5%) |
| $20,000 to $24,999 | 118 (4.3%) | 526 (13.4%) |
| $25,000 to $34,999 | 158 (5.8%) | 394 (10.1%) |
| $35,000 to $49,999 | 453 (16.6%) | 372 (9.5%) |
| $50,000 to $74,999 | 484 (17.7%) | 869 (22.2%) |
| $75,000 to $99,999 | 214 (7.8%) | 412 (10.5%) |
| $100,000 to $149,999 | 511 (18.7%) | 318 (8.1%) |
| $150,000 or more | 397 (14.5%) | 102 (2.6%) |
| Total | 2,732 (100.0%) | 3,922 (100.0%) |
Monthly Housing Cost Tiers in Grass Valley
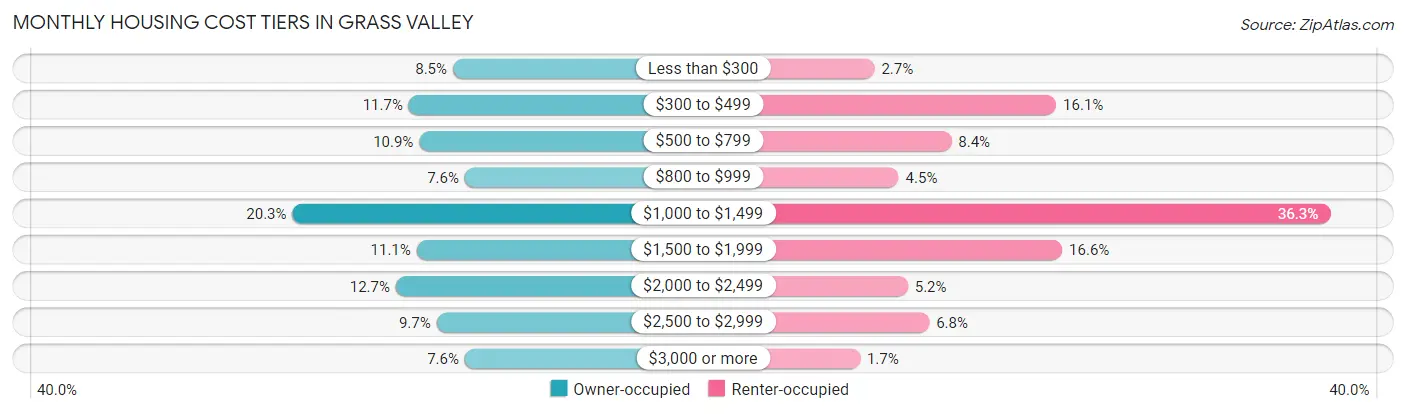
| Monthly Cost | Owner-occupied | Renter-occupied |
| Less than $300 | 231 (8.5%) | 107 (2.7%) |
| $300 to $499 | 320 (11.7%) | 632 (16.1%) |
| $500 to $799 | 299 (10.9%) | 329 (8.4%) |
| $800 to $999 | 207 (7.6%) | 177 (4.5%) |
| $1,000 to $1,499 | 554 (20.3%) | 1,423 (36.3%) |
| $1,500 to $1,999 | 304 (11.1%) | 649 (16.6%) |
| $2,000 to $2,499 | 346 (12.7%) | 203 (5.2%) |
| $2,500 to $2,999 | 264 (9.7%) | 265 (6.8%) |
| $3,000 or more | 207 (7.6%) | 65 (1.7%) |
| Total | 2,732 (100.0%) | 3,922 (100.0%) |
Physical Housing Characteristics in Grass Valley
Housing Structures in Grass Valley
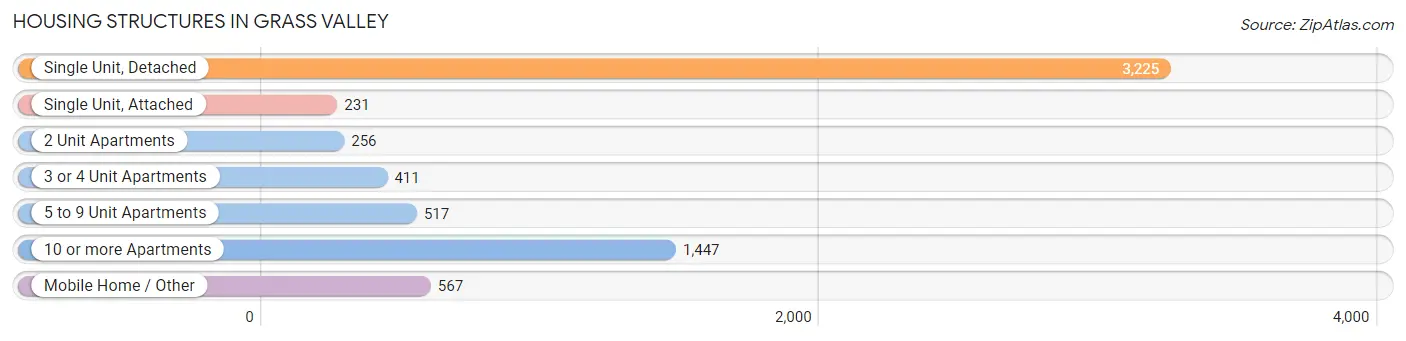
| Structure Type | # Housing Units | % Housing Units |
| Single Unit, Detached | 3,225 | 48.5% |
| Single Unit, Attached | 231 | 3.5% |
| 2 Unit Apartments | 256 | 3.8% |
| 3 or 4 Unit Apartments | 411 | 6.2% |
| 5 to 9 Unit Apartments | 517 | 7.8% |
| 10 or more Apartments | 1,447 | 21.7% |
| Mobile Home / Other | 567 | 8.5% |
| Total | 6,654 | 100.0% |
Housing Structures by Occupancy in Grass Valley
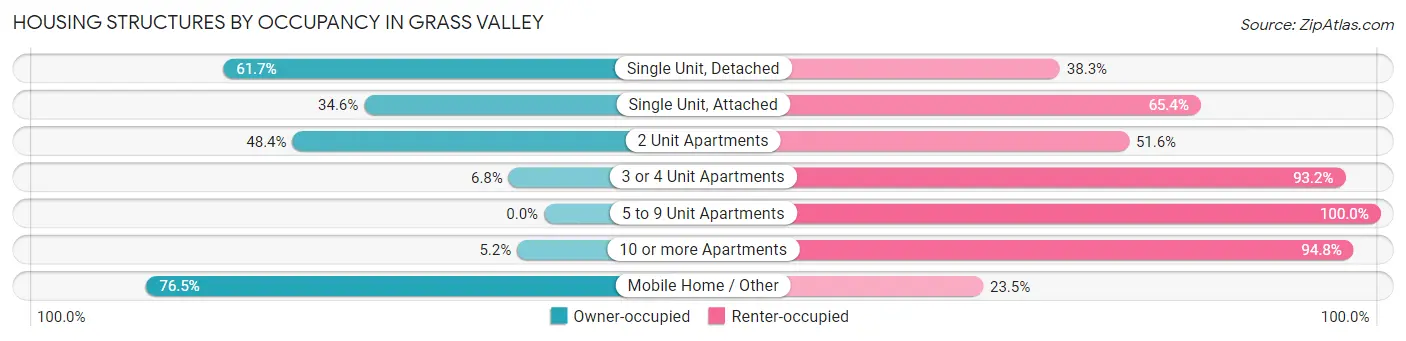
| Structure Type | Owner-occupied | Renter-occupied |
| Single Unit, Detached | 1,991 (61.7%) | 1,234 (38.3%) |
| Single Unit, Attached | 80 (34.6%) | 151 (65.4%) |
| 2 Unit Apartments | 124 (48.4%) | 132 (51.6%) |
| 3 or 4 Unit Apartments | 28 (6.8%) | 383 (93.2%) |
| 5 to 9 Unit Apartments | 0 (0.0%) | 517 (100.0%) |
| 10 or more Apartments | 75 (5.2%) | 1,372 (94.8%) |
| Mobile Home / Other | 434 (76.5%) | 133 (23.5%) |
| Total | 2,732 (41.1%) | 3,922 (58.9%) |
Housing Structures by Number of Rooms in Grass Valley
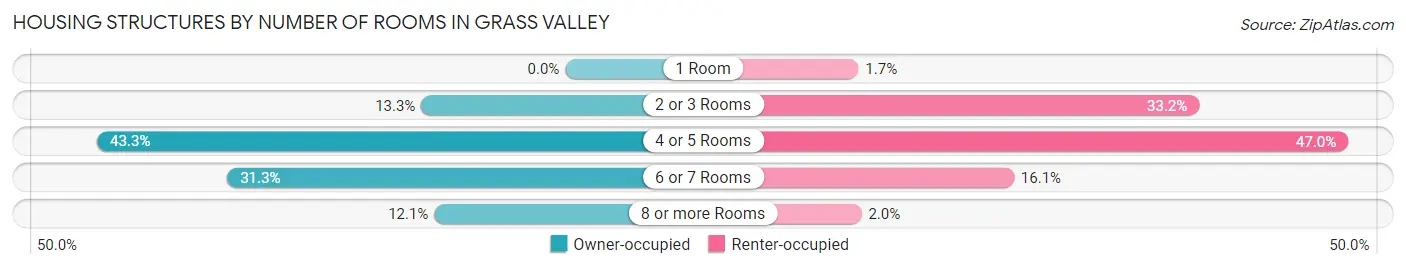
| Number of Rooms | Owner-occupied | Renter-occupied |
| 1 Room | 0 (0.0%) | 67 (1.7%) |
| 2 or 3 Rooms | 364 (13.3%) | 1,303 (33.2%) |
| 4 or 5 Rooms | 1,183 (43.3%) | 1,843 (47.0%) |
| 6 or 7 Rooms | 854 (31.3%) | 631 (16.1%) |
| 8 or more Rooms | 331 (12.1%) | 78 (2.0%) |
| Total | 2,732 (100.0%) | 3,922 (100.0%) |
Housing Structure by Heating Type in Grass Valley
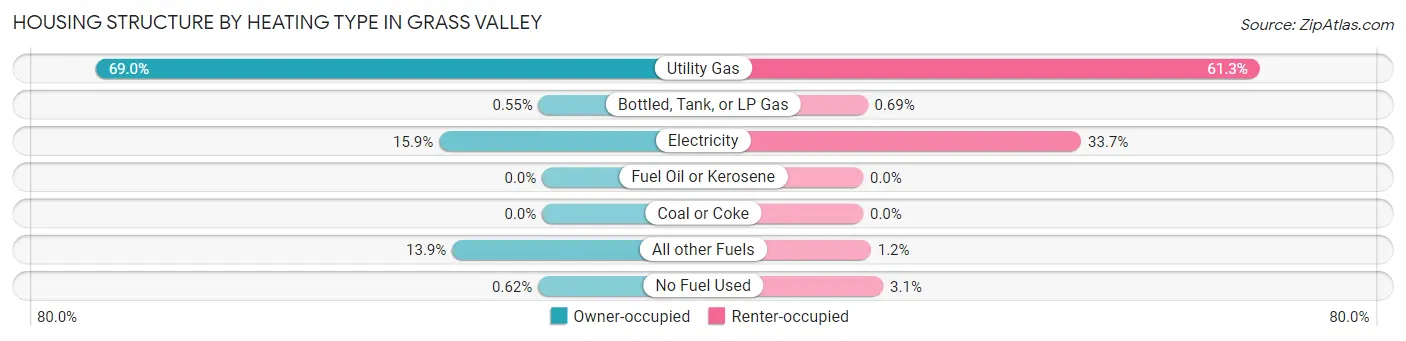
| Heating Type | Owner-occupied | Renter-occupied |
| Utility Gas | 1,885 (69.0%) | 2,404 (61.3%) |
| Bottled, Tank, or LP Gas | 15 (0.5%) | 27 (0.7%) |
| Electricity | 435 (15.9%) | 1,322 (33.7%) |
| Fuel Oil or Kerosene | 0 (0.0%) | 0 (0.0%) |
| Coal or Coke | 0 (0.0%) | 0 (0.0%) |
| All other Fuels | 380 (13.9%) | 47 (1.2%) |
| No Fuel Used | 17 (0.6%) | 122 (3.1%) |
| Total | 2,732 (100.0%) | 3,922 (100.0%) |
Household Vehicle Usage in Grass Valley
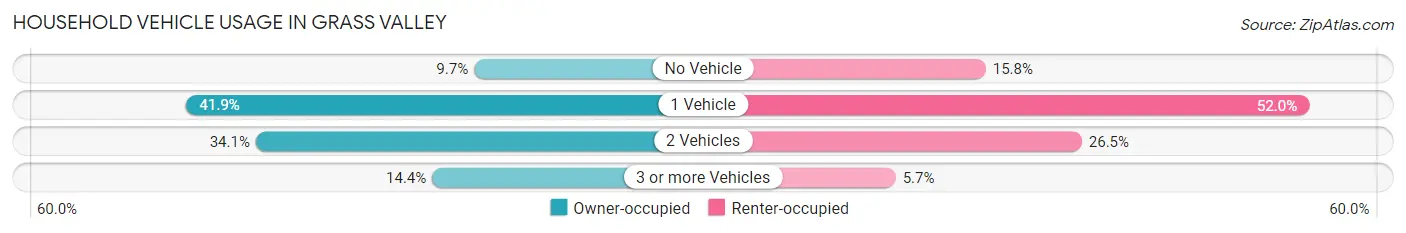
| Vehicles per Household | Owner-occupied | Renter-occupied |
| No Vehicle | 264 (9.7%) | 619 (15.8%) |
| 1 Vehicle | 1,144 (41.9%) | 2,039 (52.0%) |
| 2 Vehicles | 932 (34.1%) | 1,041 (26.5%) |
| 3 or more Vehicles | 392 (14.3%) | 223 (5.7%) |
| Total | 2,732 (100.0%) | 3,922 (100.0%) |
Real Estate & Mortgages in Grass Valley
Real Estate and Mortgage Overview in Grass Valley
| Characteristic | Without Mortgage | With Mortgage |
| Housing Units | 1,311 | 1,421 |
| Median Property Value | $383,900 | $455,800 |
| Median Household Income | $47,266 | $364 |
| Monthly Housing Costs | $612 | $207 |
| Real Estate Taxes | $2,316 | $0 |
Property Value by Mortgage Status in Grass Valley
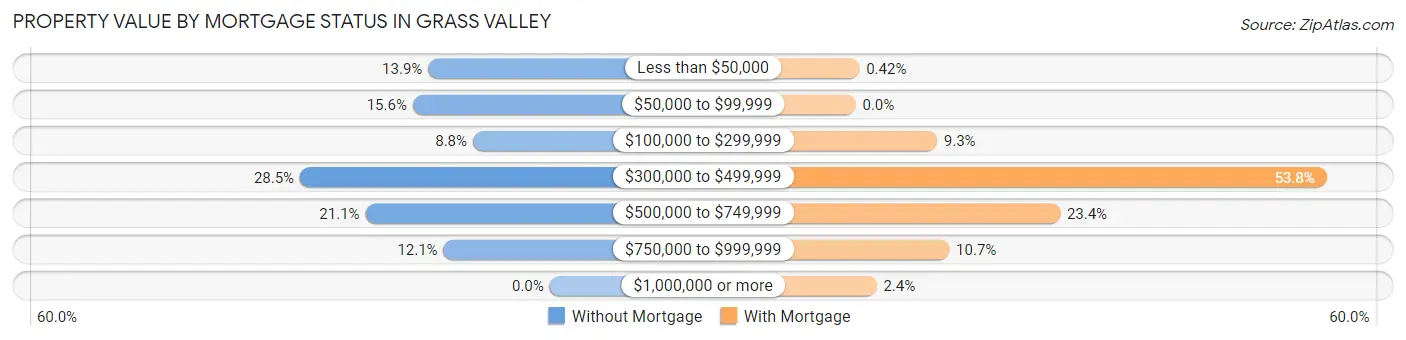
| Property Value | Without Mortgage | With Mortgage |
| Less than $50,000 | 182 (13.9%) | 6 (0.4%) |
| $50,000 to $99,999 | 205 (15.6%) | 0 (0.0%) |
| $100,000 to $299,999 | 115 (8.8%) | 132 (9.3%) |
| $300,000 to $499,999 | 374 (28.5%) | 765 (53.8%) |
| $500,000 to $749,999 | 276 (21.0%) | 332 (23.4%) |
| $750,000 to $999,999 | 159 (12.1%) | 152 (10.7%) |
| $1,000,000 or more | 0 (0.0%) | 34 (2.4%) |
| Total | 1,311 (100.0%) | 1,421 (100.0%) |
Household Income by Mortgage Status in Grass Valley
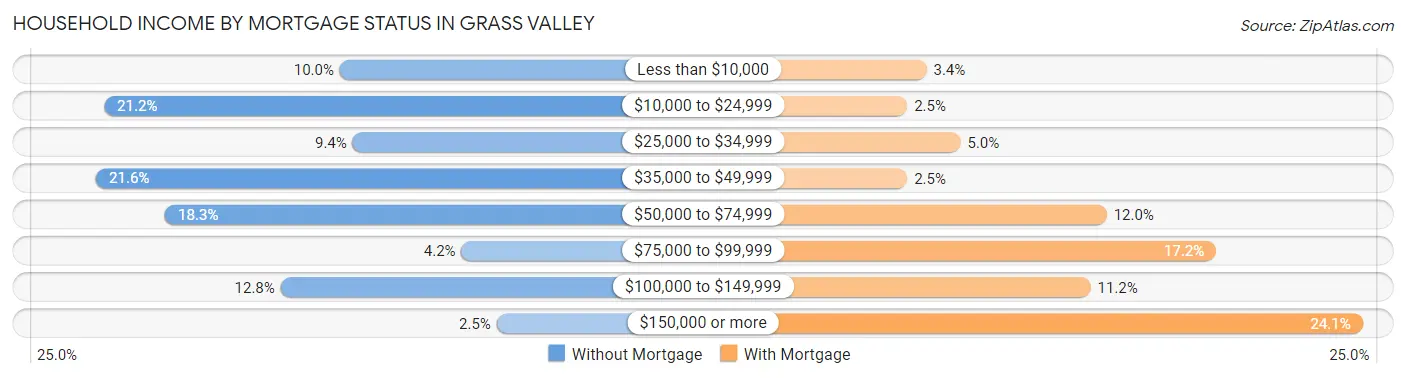
| Household Income | Without Mortgage | With Mortgage |
| Less than $10,000 | 131 (10.0%) | 48 (3.4%) |
| $10,000 to $24,999 | 278 (21.2%) | 35 (2.5%) |
| $25,000 to $34,999 | 123 (9.4%) | 71 (5.0%) |
| $35,000 to $49,999 | 283 (21.6%) | 35 (2.5%) |
| $50,000 to $74,999 | 240 (18.3%) | 170 (12.0%) |
| $75,000 to $99,999 | 55 (4.2%) | 244 (17.2%) |
| $100,000 to $149,999 | 168 (12.8%) | 159 (11.2%) |
| $150,000 or more | 33 (2.5%) | 343 (24.1%) |
| Total | 1,311 (100.0%) | 1,421 (100.0%) |
Property Value to Household Income Ratio in Grass Valley
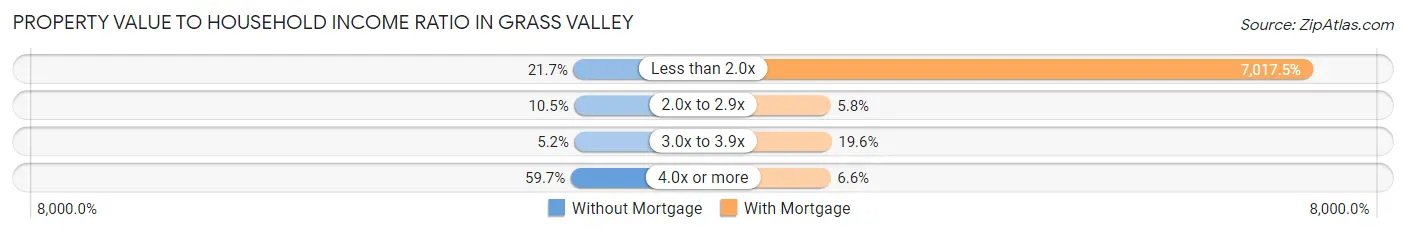
| Value-to-Income Ratio | Without Mortgage | With Mortgage |
| Less than 2.0x | 284 (21.7%) | 99,718 (7,017.4%) |
| 2.0x to 2.9x | 138 (10.5%) | 83 (5.8%) |
| 3.0x to 3.9x | 68 (5.2%) | 279 (19.6%) |
| 4.0x or more | 783 (59.7%) | 94 (6.6%) |
| Total | 1,311 (100.0%) | 1,421 (100.0%) |
Real Estate Taxes by Mortgage Status in Grass Valley
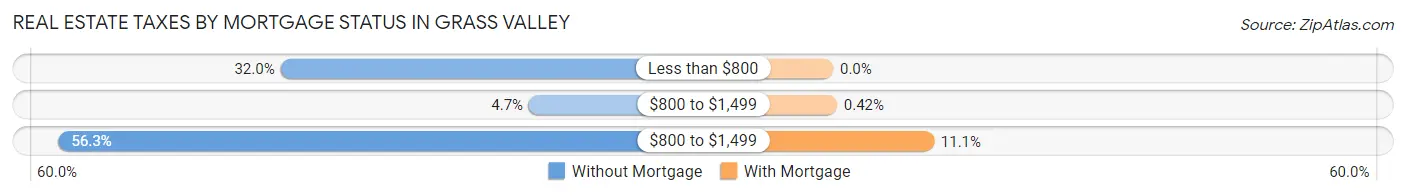
| Property Taxes | Without Mortgage | With Mortgage |
| Less than $800 | 419 (32.0%) | 0 (0.0%) |
| $800 to $1,499 | 62 (4.7%) | 6 (0.4%) |
| $800 to $1,499 | 738 (56.3%) | 157 (11.1%) |
| Total | 1,311 (100.0%) | 1,421 (100.0%) |
Health & Disability in Grass Valley
Health Insurance Coverage by Age in Grass Valley
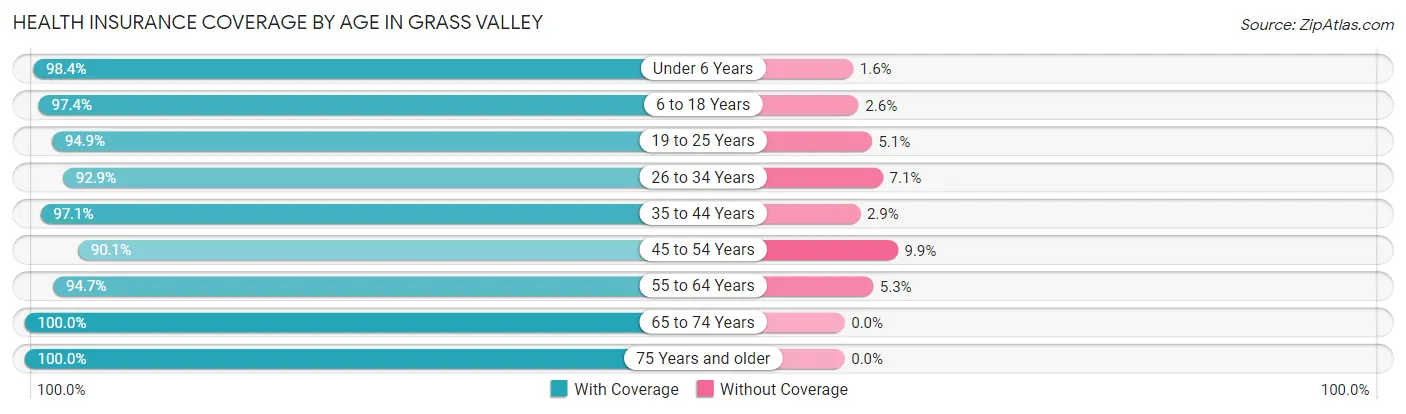
| Age Bracket | With Coverage | Without Coverage |
| Under 6 Years | 869 (98.4%) | 14 (1.6%) |
| 6 to 18 Years | 1,854 (97.4%) | 50 (2.6%) |
| 19 to 25 Years | 730 (94.9%) | 39 (5.1%) |
| 26 to 34 Years | 1,417 (92.9%) | 109 (7.1%) |
| 35 to 44 Years | 1,359 (97.1%) | 41 (2.9%) |
| 45 to 54 Years | 1,461 (90.1%) | 161 (9.9%) |
| 55 to 64 Years | 1,653 (94.7%) | 93 (5.3%) |
| 65 to 74 Years | 1,940 (100.0%) | 0 (0.0%) |
| 75 Years and older | 1,538 (100.0%) | 0 (0.0%) |
| Total | 12,821 (96.2%) | 507 (3.8%) |
Health Insurance Coverage by Citizenship Status in Grass Valley
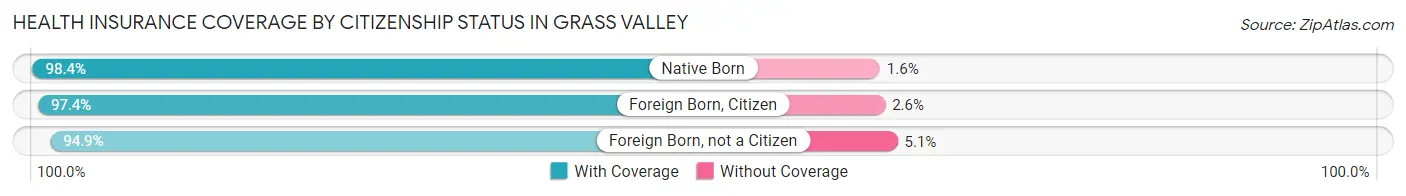
| Citizenship Status | With Coverage | Without Coverage |
| Native Born | 869 (98.4%) | 14 (1.6%) |
| Foreign Born, Citizen | 1,854 (97.4%) | 50 (2.6%) |
| Foreign Born, not a Citizen | 730 (94.9%) | 39 (5.1%) |
Health Insurance Coverage by Household Income in Grass Valley
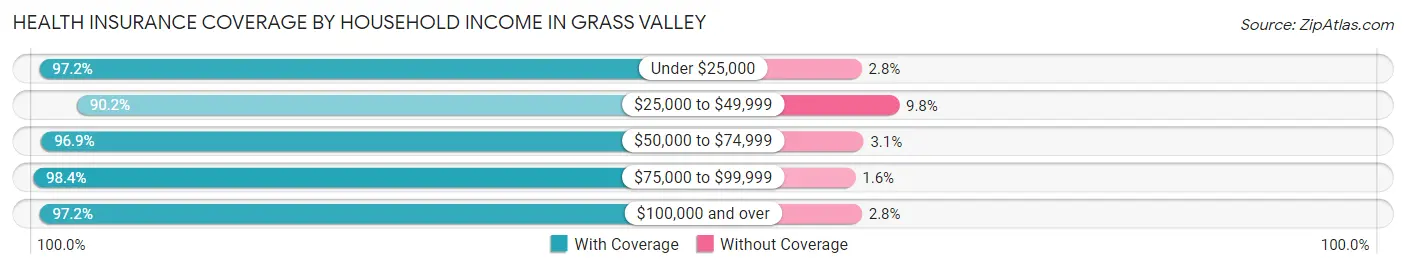
| Household Income | With Coverage | Without Coverage |
| Under $25,000 | 2,592 (97.2%) | 74 (2.8%) |
| $25,000 to $49,999 | 1,953 (90.2%) | 212 (9.8%) |
| $50,000 to $74,999 | 3,070 (96.9%) | 99 (3.1%) |
| $75,000 to $99,999 | 1,779 (98.4%) | 29 (1.6%) |
| $100,000 and over | 3,213 (97.2%) | 93 (2.8%) |
Public vs Private Health Insurance Coverage by Age in Grass Valley
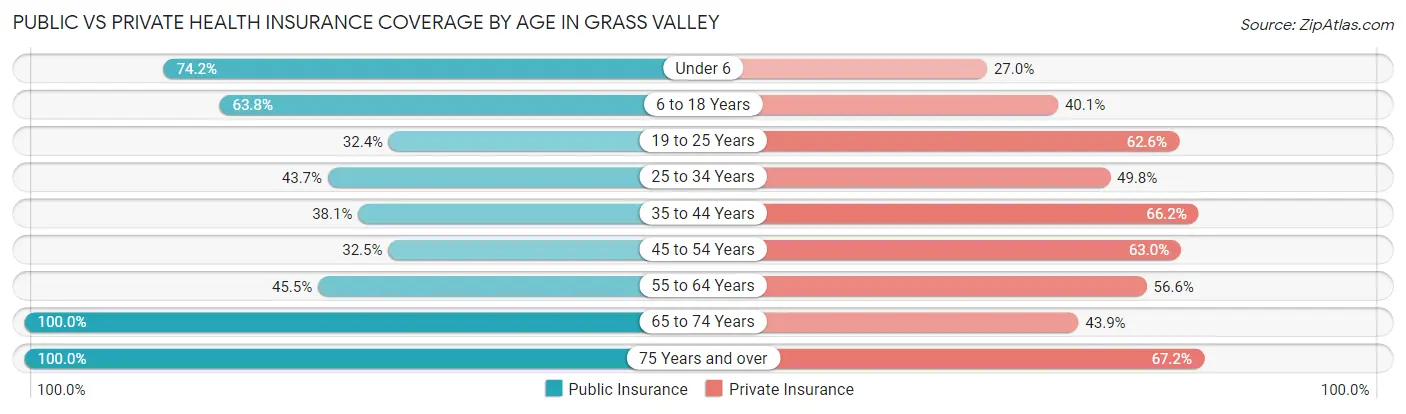
| Age Bracket | Public Insurance | Private Insurance |
| Under 6 | 655 (74.2%) | 238 (27.0%) |
| 6 to 18 Years | 1,215 (63.8%) | 764 (40.1%) |
| 19 to 25 Years | 249 (32.4%) | 481 (62.5%) |
| 25 to 34 Years | 667 (43.7%) | 760 (49.8%) |
| 35 to 44 Years | 533 (38.1%) | 927 (66.2%) |
| 45 to 54 Years | 527 (32.5%) | 1,021 (62.9%) |
| 55 to 64 Years | 795 (45.5%) | 988 (56.6%) |
| 65 to 74 Years | 1,940 (100.0%) | 852 (43.9%) |
| 75 Years and over | 1,538 (100.0%) | 1,033 (67.2%) |
| Total | 8,119 (60.9%) | 7,064 (53.0%) |
Disability Status by Sex by Age in Grass Valley
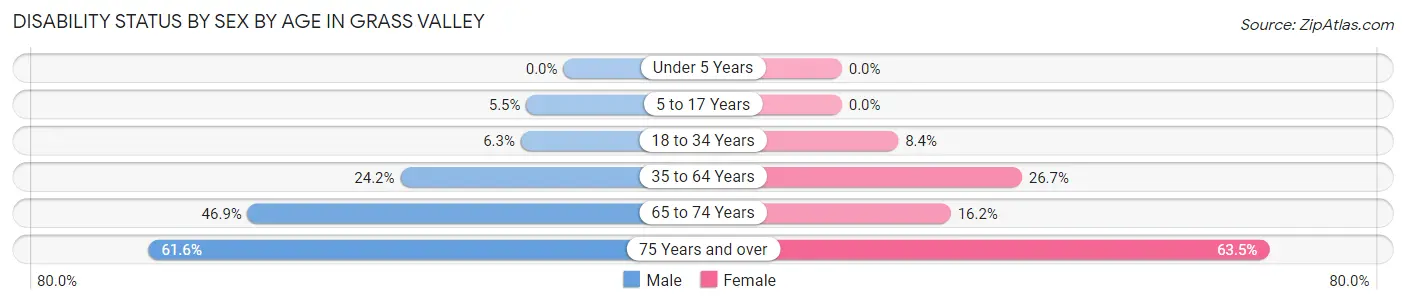
| Age Bracket | Male | Female |
| Under 5 Years | 0 (0.0%) | 0 (0.0%) |
| 5 to 17 Years | 64 (5.5%) | 0 (0.0%) |
| 18 to 34 Years | 58 (6.3%) | 120 (8.4%) |
| 35 to 64 Years | 559 (24.2%) | 657 (26.7%) |
| 65 to 74 Years | 315 (46.9%) | 205 (16.2%) |
| 75 Years and over | 231 (61.6%) | 738 (63.5%) |
Disability Class by Sex by Age in Grass Valley
Disability Class: Hearing Difficulty
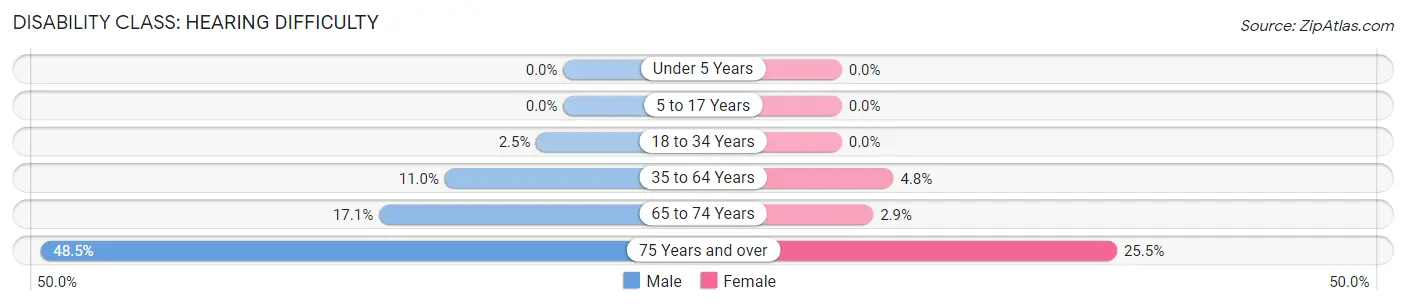
| Age Bracket | Male | Female |
| Under 5 Years | 0 (0.0%) | 0 (0.0%) |
| 5 to 17 Years | 0 (0.0%) | 0 (0.0%) |
| 18 to 34 Years | 23 (2.5%) | 0 (0.0%) |
| 35 to 64 Years | 254 (11.0%) | 118 (4.8%) |
| 65 to 74 Years | 115 (17.1%) | 37 (2.9%) |
| 75 Years and over | 182 (48.5%) | 297 (25.5%) |
Disability Class: Vision Difficulty
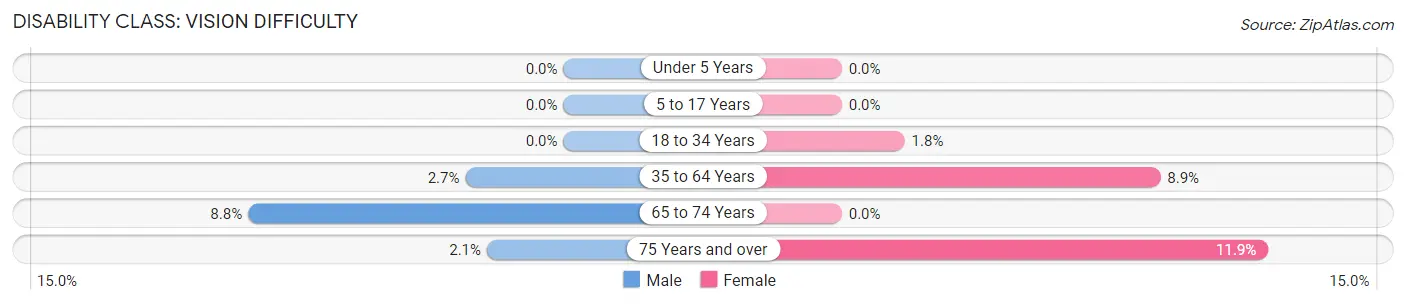
| Age Bracket | Male | Female |
| Under 5 Years | 0 (0.0%) | 0 (0.0%) |
| 5 to 17 Years | 0 (0.0%) | 0 (0.0%) |
| 18 to 34 Years | 0 (0.0%) | 25 (1.8%) |
| 35 to 64 Years | 63 (2.7%) | 218 (8.9%) |
| 65 to 74 Years | 59 (8.8%) | 0 (0.0%) |
| 75 Years and over | 8 (2.1%) | 138 (11.9%) |
Disability Class: Cognitive Difficulty
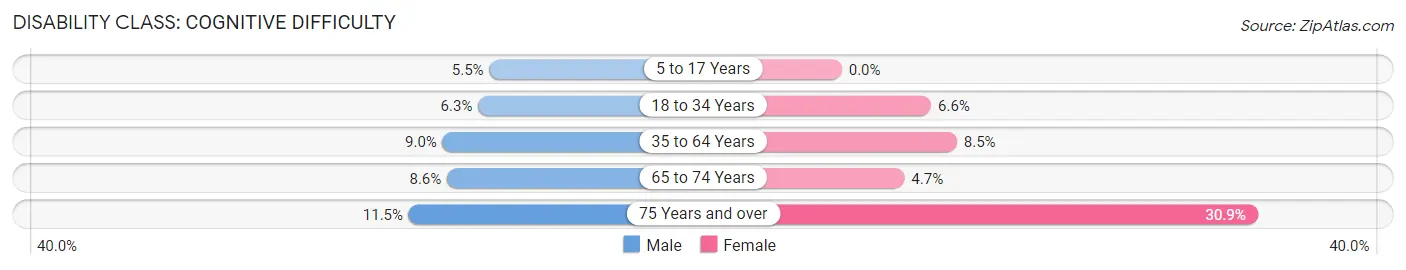
| Age Bracket | Male | Female |
| 5 to 17 Years | 64 (5.5%) | 0 (0.0%) |
| 18 to 34 Years | 58 (6.3%) | 95 (6.6%) |
| 35 to 64 Years | 207 (9.0%) | 210 (8.5%) |
| 65 to 74 Years | 58 (8.6%) | 59 (4.6%) |
| 75 Years and over | 43 (11.5%) | 359 (30.9%) |
Disability Class: Ambulatory Difficulty
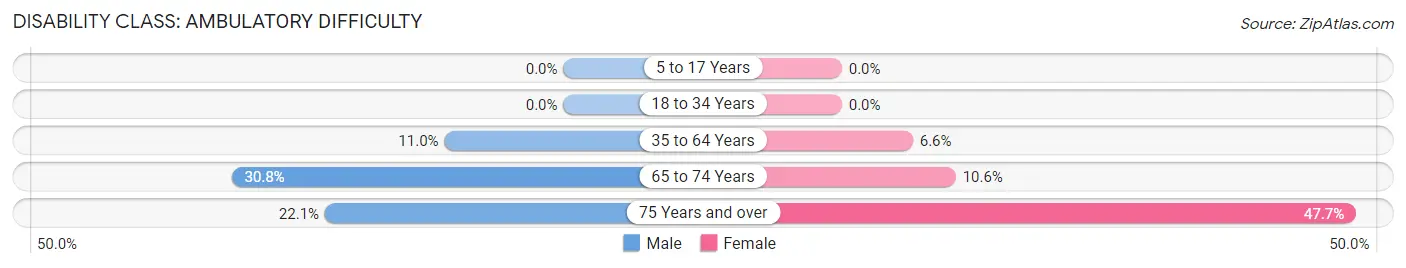
| Age Bracket | Male | Female |
| 5 to 17 Years | 0 (0.0%) | 0 (0.0%) |
| 18 to 34 Years | 0 (0.0%) | 0 (0.0%) |
| 35 to 64 Years | 255 (11.0%) | 162 (6.6%) |
| 65 to 74 Years | 207 (30.8%) | 134 (10.6%) |
| 75 Years and over | 83 (22.1%) | 555 (47.7%) |
Disability Class: Self-Care Difficulty
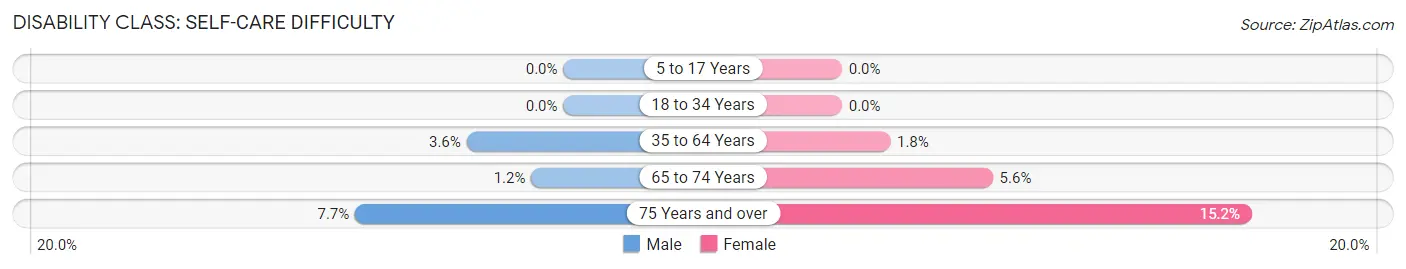
| Age Bracket | Male | Female |
| 5 to 17 Years | 0 (0.0%) | 0 (0.0%) |
| 18 to 34 Years | 0 (0.0%) | 0 (0.0%) |
| 35 to 64 Years | 83 (3.6%) | 44 (1.8%) |
| 65 to 74 Years | 8 (1.2%) | 71 (5.6%) |
| 75 Years and over | 29 (7.7%) | 177 (15.2%) |
Technology Access in Grass Valley
Computing Device Access in Grass Valley
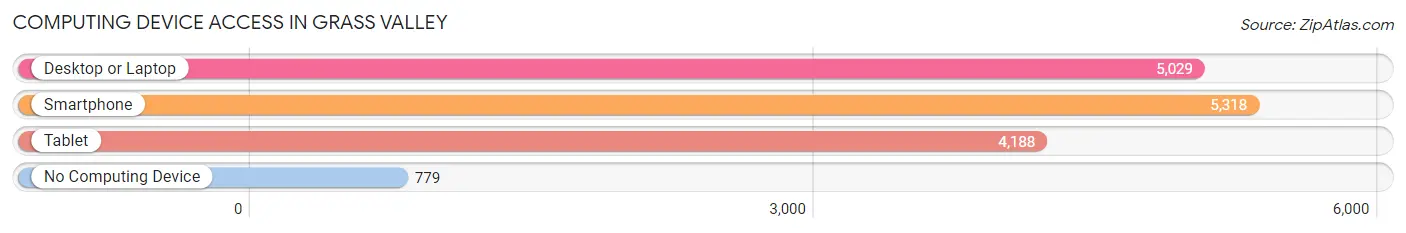
| Device Type | # Households | % Households |
| Desktop or Laptop | 5,029 | 75.6% |
| Smartphone | 5,318 | 79.9% |
| Tablet | 4,188 | 62.9% |
| No Computing Device | 779 | 11.7% |
| Total | 6,654 | 100.0% |
Internet Access in Grass Valley
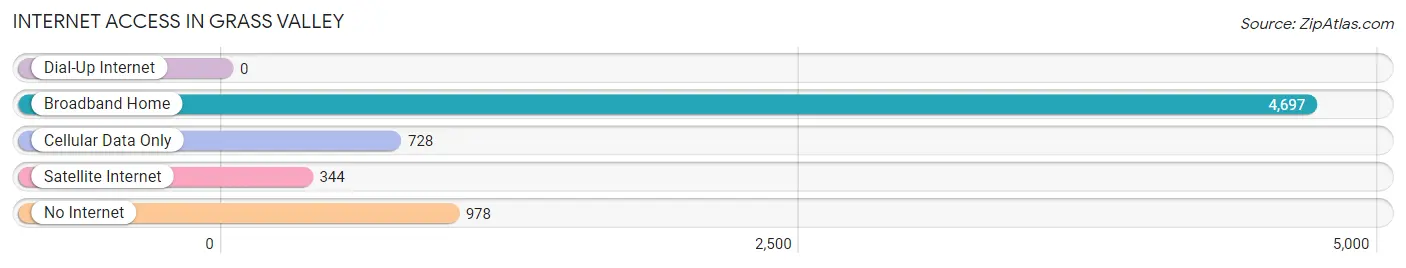
| Internet Type | # Households | % Households |
| Dial-Up Internet | 0 | 0.0% |
| Broadband Home | 4,697 | 70.6% |
| Cellular Data Only | 728 | 10.9% |
| Satellite Internet | 344 | 5.2% |
| No Internet | 978 | 14.7% |
| Total | 6,654 | 100.0% |
Grass Valley Summary
Grass Valley is a city located in Nevada County, California, United States. It is situated in the Sierra Nevada foothills, about 40 miles (64 km) northeast of Sacramento, and is part of the Sacramento–Arden-Arcade–Roseville Metropolitan Statistical Area. The population was 12,860 at the 2010 census.
History
Grass Valley was first settled in 1849 by miners during the California Gold Rush. The city was originally named Boston Ravine after a nearby stream. In 1851, the town was renamed Grass Valley after the lush grass that grew in the area. The city was incorporated in 1860.
Grass Valley was an important center for the mining industry during the Gold Rush. It was the site of the first long-distance telephone line in the world, connecting French Corral with French Lake, a distance of 12 miles (19 km). The first transcontinental telegraph line in the United States was also constructed through Grass Valley.
Geography
Grass Valley is located at 39°13′9″N 121°3′30″W (39.219167, -121.058333). According to the United States Census Bureau, the city has a total area of 4.7 square miles (12.2 km2), all of it land.
Grass Valley is located in the Sierra Nevada foothills, about 40 miles (64 km) northeast of Sacramento. The city is situated at an elevation of 2,500 feet (760 m) above sea level.
Economy
Grass Valley is a major center for the mining industry. The city is home to several gold mines, including the Empire Mine, which was the largest gold mine in California. The city is also home to several technology companies, including Grass Valley Group, a manufacturer of broadcast and professional video equipment.
The city is also a popular tourist destination, with several wineries, golf courses, and outdoor recreation areas.
Demographics
As of the census of 2010, there were 12,860 people, 5,902 households, and 3,072 families residing in the city. The population density was 2,717.3 people per square mile (1,051.2/km2). There were 6,521 housing units at an average density of 1,380.3 per square mile (532.7/km2). The racial makeup of the city was 87.2% White, 0.7% African American, 1.2% Native American, 1.3% Asian, 0.4% Pacific Islander, 6.2% from other races, and 3.2% from two or more races. Hispanic or Latino of any race were 13.5% of the population.
There were 5,902 households, out of which 24.2% had children under the age of 18 living with them, 41.2% were married couples living together, 11.7% had a female householder with no husband present, and 43.2% were non-families. 35.2% of all households were made up of individuals, and 14.5% had someone living alone who was 65 years of age or older. The average household size was 2.17 and the average family size was 2.79.
In the city, the population was spread out, with 20.2% under the age of 18, 8.2% from 18 to 24, 24.3% from 25 to 44, 28.2% from 45 to 64, and 19.1% who were 65 years of age or older. The median age was 43 years. For every 100 females, there were 90.3 males. For every 100 females age 18 and over, there were 86.9 males.
The median income for a household in the city was $37,813, and the median income for a family was $46,838. Males had a median income of $40,844 versus $30,917 for females. The per capita income for the city was $22,945. About 10.2% of families and 13.7% of the population were below the poverty line, including 19.2% of those under age 18 and 6.7% of those age 65 or over.
Common Questions
What is Per Capita Income in Grass Valley?
Per Capita income in Grass Valley is $32,423.
What is the Median Family Income in Grass Valley?
Median Family Income in Grass Valley is $61,742.
What is the Median Household income in Grass Valley?
Median Household Income in Grass Valley is $49,855.
What is Income or Wage Gap in Grass Valley?
Income or Wage Gap in Grass Valley is 29.2%.
Women in Grass Valley earn 70.8 cents for every dollar earned by a man.
What is Inequality or Gini Index in Grass Valley?
Inequality or Gini Index in Grass Valley is 0.45.
What is the Total Population of Grass Valley?
Total Population of Grass Valley is 13,964.
What is the Total Male Population of Grass Valley?
Total Male Population of Grass Valley is 6,183.
What is the Total Female Population of Grass Valley?
Total Female Population of Grass Valley is 7,781.
What is the Ratio of Males per 100 Females in Grass Valley?
There are 79.46 Males per 100 Females in Grass Valley.
What is the Ratio of Females per 100 Males in Grass Valley?
There are 125.85 Females per 100 Males in Grass Valley.
What is the Median Population Age in Grass Valley?
Median Population Age in Grass Valley is 47.7 Years.
What is the Average Family Size in Grass Valley
Average Family Size in Grass Valley is 2.9 People.
What is the Average Household Size in Grass Valley
Average Household Size in Grass Valley is 2.0 People.
How Large is the Labor Force in Grass Valley?
There are 6,048 People in the Labor Forcein in Grass Valley.
What is the Percentage of People in the Labor Force in Grass Valley?
53.1% of People are in the Labor Force in Grass Valley.
What is the Unemployment Rate in Grass Valley?
Unemployment Rate in Grass Valley is 2.3%.