Fruitridge Pocket, CA Map & Demographics
Fruitridge Pocket Map
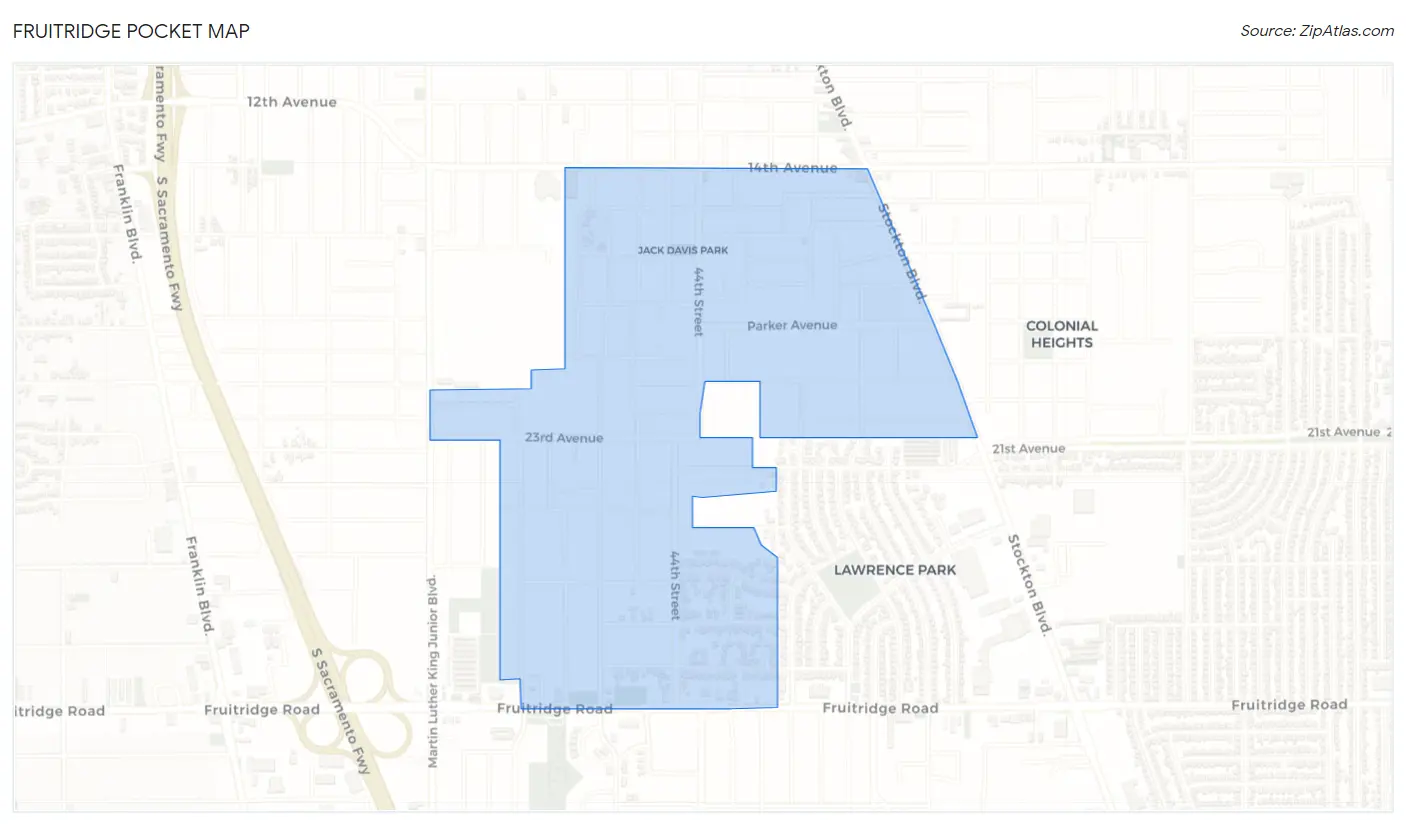
Fruitridge Pocket Overview
$19,854
PER CAPITA INCOME
$55,188
AVG FAMILY INCOME
$47,604
AVG HOUSEHOLD INCOME
13.3%
WAGE / INCOME GAP [ % ]
86.7¢/ $1
WAGE / INCOME GAP [ $ ]
0.44
INEQUALITY / GINI INDEX
5,596
TOTAL POPULATION
2,851
MALE POPULATION
2,745
FEMALE POPULATION
103.86
MALES / 100 FEMALES
96.28
FEMALES / 100 MALES
34.8
MEDIAN AGE
3.3
AVG FAMILY SIZE
3.0
AVG HOUSEHOLD SIZE
2,117
LABOR FORCE [ PEOPLE ]
47.0%
PERCENT IN LABOR FORCE
6.4%
UNEMPLOYMENT RATE
Income in Fruitridge Pocket
Income Overview in Fruitridge Pocket
Per Capita Income in Fruitridge Pocket is $19,854, while median incomes of families and households are $55,188 and $47,604 respectively.
| Characteristic | Number | Measure |
| Per Capita Income | 5,596 | $19,854 |
| Median Family Income | 1,329 | $55,188 |
| Mean Family Income | 1,329 | $60,925 |
| Median Household Income | 1,788 | $47,604 |
| Mean Household Income | 1,788 | $58,056 |
| Income Deficit | 1,329 | $0 |
| Wage / Income Gap (%) | 5,596 | 13.30% |
| Wage / Income Gap ($) | 5,596 | 86.70¢ per $1 |
| Gini / Inequality Index | 5,596 | 0.44 |
Earnings by Sex in Fruitridge Pocket
Average Earnings in Fruitridge Pocket are $36,358, $40,919 for men and $35,477 for women, a difference of 13.3%.
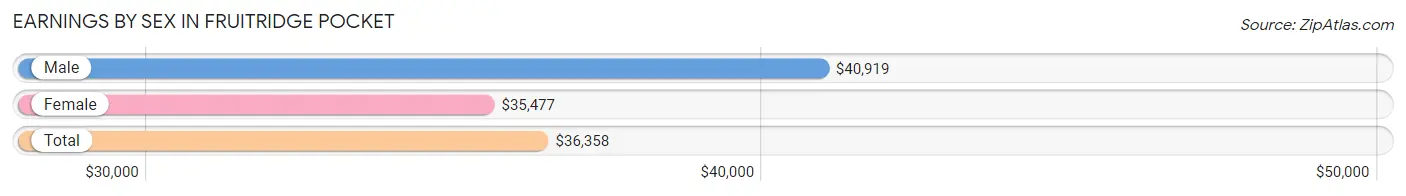
| Sex | Number | Average Earnings |
| Male | 1,161 (55.7%) | $40,919 |
| Female | 922 (44.3%) | $35,477 |
| Total | 2,083 (100.0%) | $36,358 |
Earnings by Sex by Income Bracket in Fruitridge Pocket
The most common earnings brackets in Fruitridge Pocket are $50,000 to $54,999 for men (160 | 13.8%) and $35,000 to $39,999 for women (181 | 19.6%).
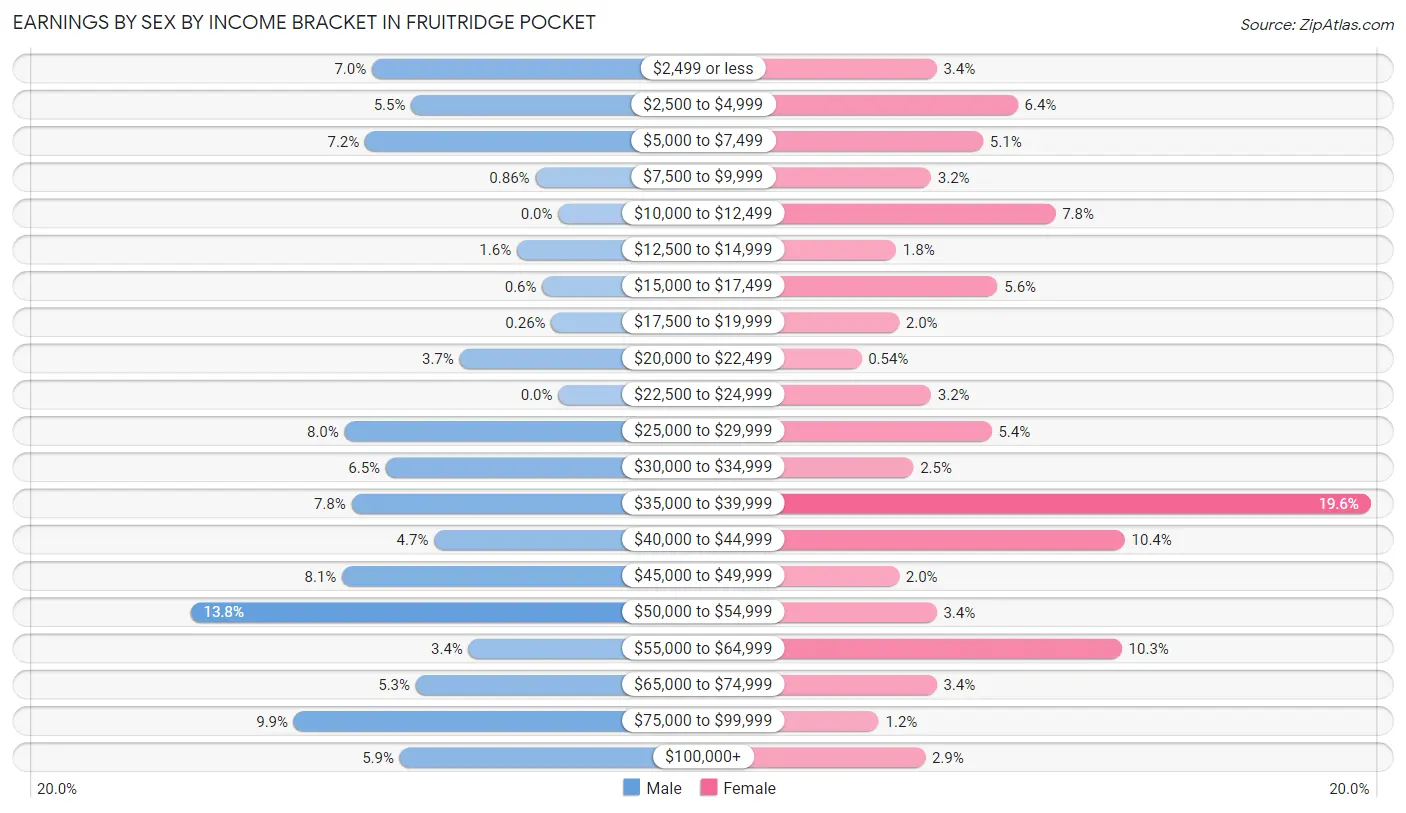
| Income | Male | Female |
| $2,499 or less | 81 (7.0%) | 31 (3.4%) |
| $2,500 to $4,999 | 64 (5.5%) | 59 (6.4%) |
| $5,000 to $7,499 | 84 (7.2%) | 47 (5.1%) |
| $7,500 to $9,999 | 10 (0.9%) | 29 (3.2%) |
| $10,000 to $12,499 | 0 (0.0%) | 72 (7.8%) |
| $12,500 to $14,999 | 18 (1.5%) | 17 (1.8%) |
| $15,000 to $17,499 | 7 (0.6%) | 52 (5.6%) |
| $17,500 to $19,999 | 3 (0.3%) | 18 (1.9%) |
| $20,000 to $22,499 | 43 (3.7%) | 5 (0.5%) |
| $22,500 to $24,999 | 0 (0.0%) | 29 (3.2%) |
| $25,000 to $29,999 | 93 (8.0%) | 50 (5.4%) |
| $30,000 to $34,999 | 75 (6.5%) | 23 (2.5%) |
| $35,000 to $39,999 | 90 (7.7%) | 181 (19.6%) |
| $40,000 to $44,999 | 54 (4.6%) | 96 (10.4%) |
| $45,000 to $49,999 | 94 (8.1%) | 18 (1.9%) |
| $50,000 to $54,999 | 160 (13.8%) | 31 (3.4%) |
| $55,000 to $64,999 | 39 (3.4%) | 95 (10.3%) |
| $65,000 to $74,999 | 62 (5.3%) | 31 (3.4%) |
| $75,000 to $99,999 | 115 (9.9%) | 11 (1.2%) |
| $100,000+ | 69 (5.9%) | 27 (2.9%) |
| Total | 1,161 (100.0%) | 922 (100.0%) |
Earnings by Sex by Educational Attainment in Fruitridge Pocket
Average earnings in Fruitridge Pocket are $45,554 for men and $35,889 for women, a difference of 21.2%. Men with an educational attainment of bachelor's degree enjoy the highest average annual earnings of $51,219, while those with college or associate's degree education earn the least with $36,791. Women with an educational attainment of bachelor's degree earn the most with the average annual earnings of $63,649, while those with less than high school education have the smallest earnings of $25,776.
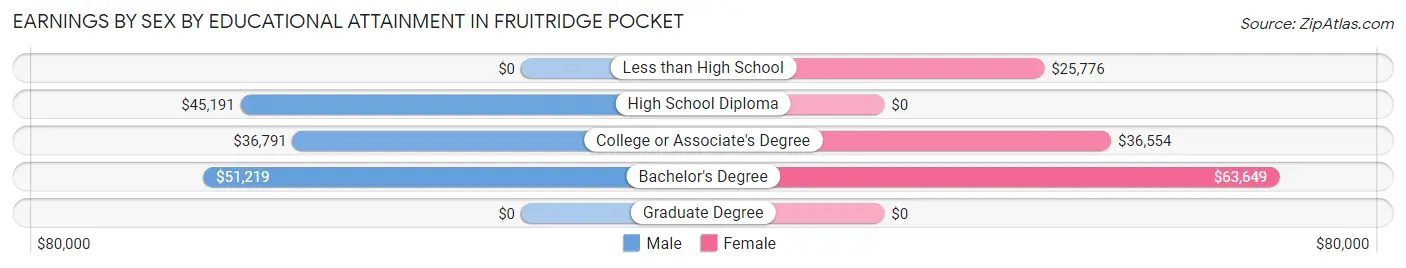
| Educational Attainment | Male Income | Female Income |
| Less than High School | - | - |
| High School Diploma | $45,191 | $0 |
| College or Associate's Degree | $36,791 | $36,554 |
| Bachelor's Degree | $51,219 | $63,649 |
| Graduate Degree | - | - |
| Total | $45,554 | $35,889 |
Family Income in Fruitridge Pocket
Family Income Brackets in Fruitridge Pocket
According to the Fruitridge Pocket family income data, there are 255 families falling into the $50,000 to $74,999 income range, which is the most common income bracket and makes up 19.2% of all families.
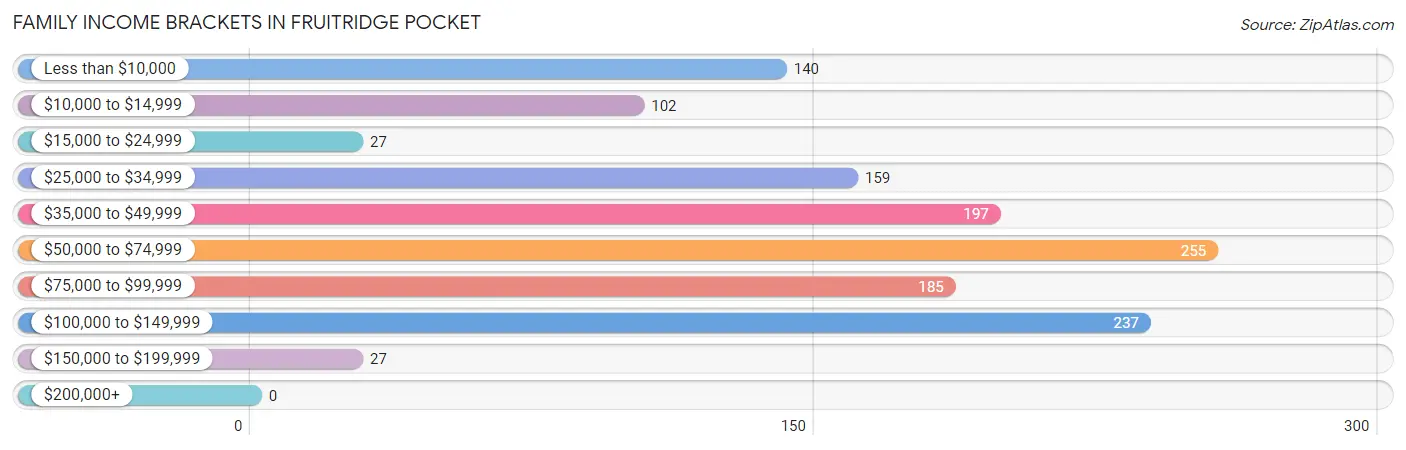
| Income Bracket | # Families | % Families |
| Less than $10,000 | 140 | 10.5% |
| $10,000 to $14,999 | 102 | 7.7% |
| $15,000 to $24,999 | 27 | 2.0% |
| $25,000 to $34,999 | 159 | 12.0% |
| $35,000 to $49,999 | 197 | 14.8% |
| $50,000 to $74,999 | 255 | 19.2% |
| $75,000 to $99,999 | 185 | 13.9% |
| $100,000 to $149,999 | 237 | 17.8% |
| $150,000 to $199,999 | 27 | 2.0% |
| $200,000+ | 0 | 0.0% |
Family Income by Famaliy Size in Fruitridge Pocket
4-person families (296 | 22.3%) account for the highest median family income in Fruitridge Pocket with $58,235 per family, while 2-person families (588 | 44.2%) have the highest median income of $24,882 per family member.
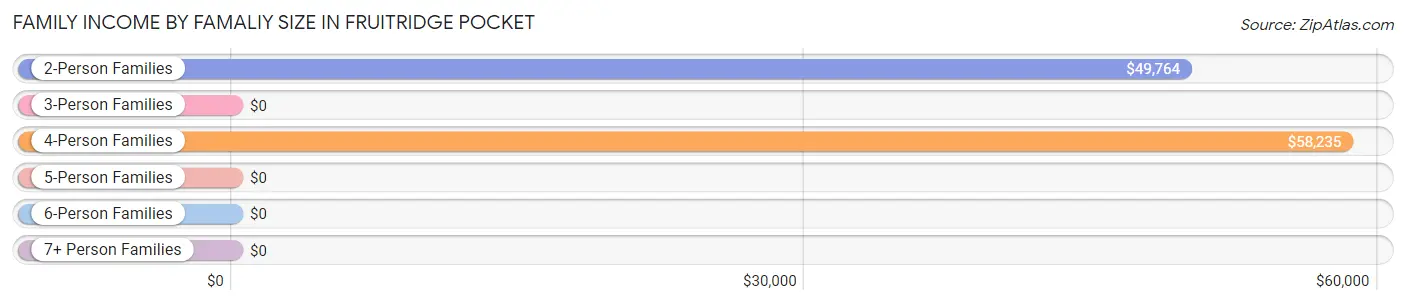
| Income Bracket | # Families | Median Income |
| 2-Person Families | 588 (44.2%) | $49,764 |
| 3-Person Families | 208 (15.7%) | $0 |
| 4-Person Families | 296 (22.3%) | $58,235 |
| 5-Person Families | 77 (5.8%) | $0 |
| 6-Person Families | 73 (5.5%) | $0 |
| 7+ Person Families | 87 (6.6%) | $0 |
| Total | 1,329 (100.0%) | $55,188 |
Family Income by Number of Earners in Fruitridge Pocket
The median family income in Fruitridge Pocket is $55,188, with families comprising 2 earners (295) having the highest median family income of $98,466, while families with no earners (300) have the lowest median family income of $13,929, accounting for 22.2% and 22.6% of families, respectively.
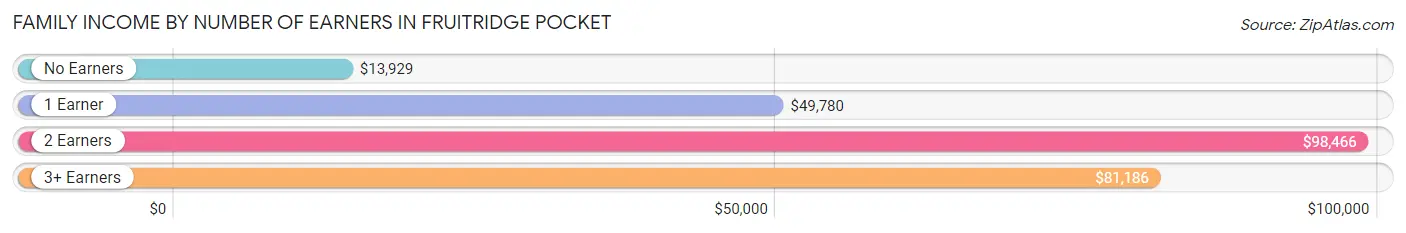
| Number of Earners | # Families | Median Income |
| No Earners | 300 (22.6%) | $13,929 |
| 1 Earner | 607 (45.7%) | $49,780 |
| 2 Earners | 295 (22.2%) | $98,466 |
| 3+ Earners | 127 (9.6%) | $81,186 |
| Total | 1,329 (100.0%) | $55,188 |
Household Income in Fruitridge Pocket
Household Income Brackets in Fruitridge Pocket
With 295 households falling in the category, the $50,000 to $74,999 income range is the most frequent in Fruitridge Pocket, accounting for 16.5% of all households. In contrast, only 18 households (1.0%) fall into the $200,000+ income bracket, making it the least populous group.
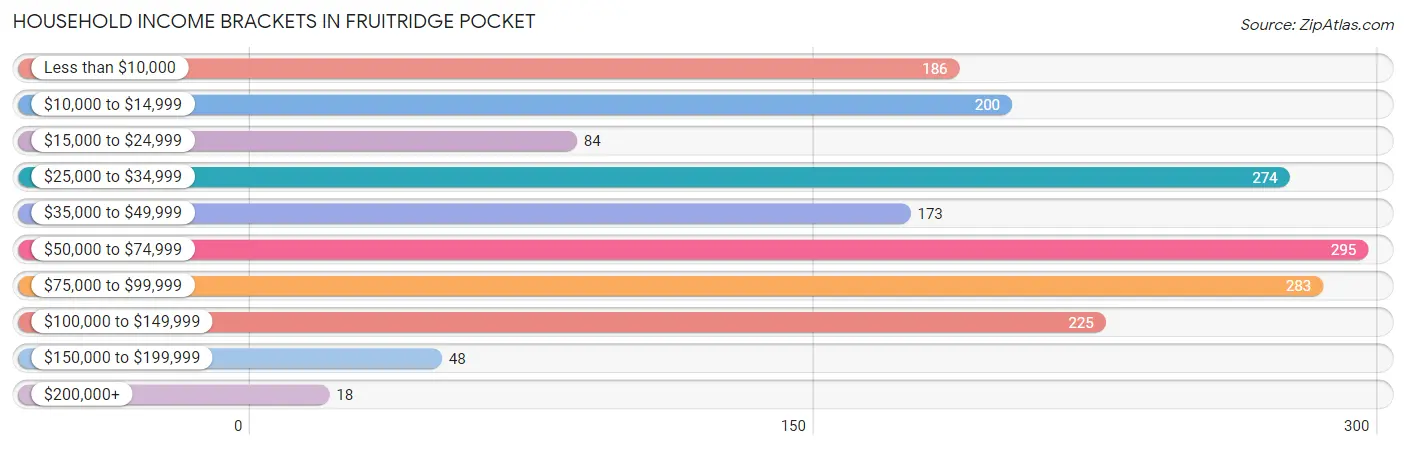
| Income Bracket | # Households | % Households |
| Less than $10,000 | 186 | 10.4% |
| $10,000 to $14,999 | 200 | 11.2% |
| $15,000 to $24,999 | 84 | 4.7% |
| $25,000 to $34,999 | 274 | 15.3% |
| $35,000 to $49,999 | 173 | 9.7% |
| $50,000 to $74,999 | 295 | 16.5% |
| $75,000 to $99,999 | 283 | 15.8% |
| $100,000 to $149,999 | 225 | 12.6% |
| $150,000 to $199,999 | 48 | 2.7% |
| $200,000+ | 18 | 1.0% |
Household Income by Householder Age in Fruitridge Pocket
The median household income in Fruitridge Pocket is $47,604, with the highest median household income of $62,083 found in the 45 to 64 years age bracket for the primary householder. A total of 727 households (40.7%) fall into this category. Meanwhile, the 15 to 24 years age bracket for the primary householder has the lowest median household income of $0, with 30 households (1.7%) in this group.
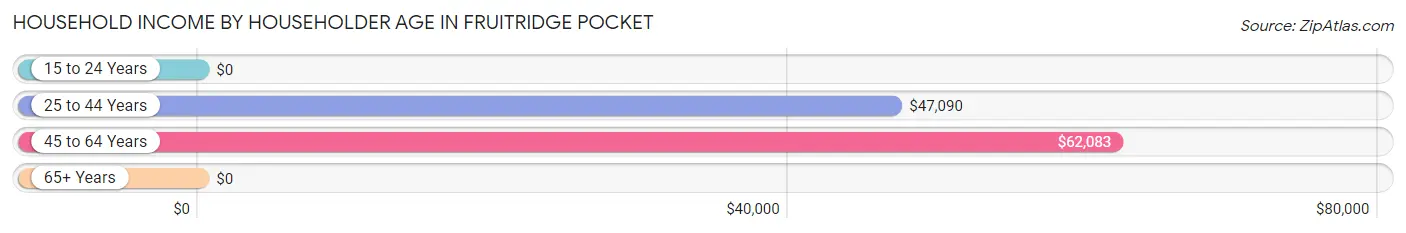
| Income Bracket | # Households | Median Income |
| 15 to 24 Years | 30 (1.7%) | $0 |
| 25 to 44 Years | 532 (29.7%) | $47,090 |
| 45 to 64 Years | 727 (40.7%) | $62,083 |
| 65+ Years | 499 (27.9%) | $0 |
| Total | 1,788 (100.0%) | $47,604 |
Poverty in Fruitridge Pocket
Income Below Poverty by Sex and Age in Fruitridge Pocket
With 25.8% poverty level for males and 40.7% for females among the residents of Fruitridge Pocket, 15 year old males and 12 to 14 year old females are the most vulnerable to poverty, with 71 males (100.0%) and 76 females (81.7%) in their respective age groups living below the poverty level.
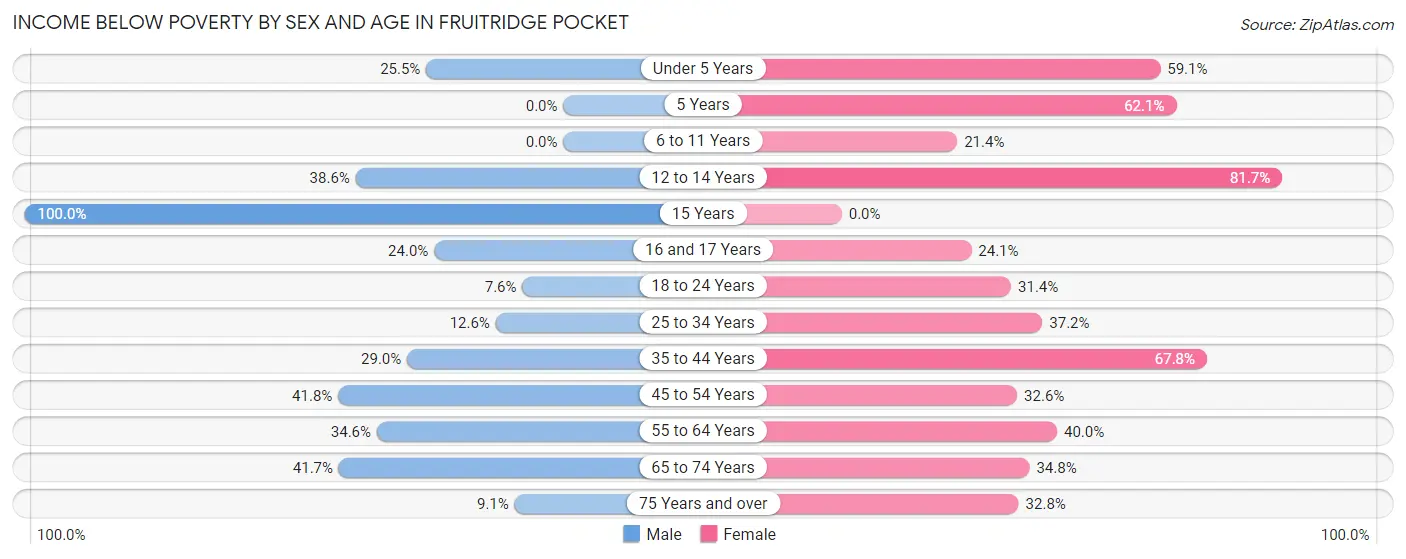
| Age Bracket | Male | Female |
| Under 5 Years | 69 (25.5%) | 81 (59.1%) |
| 5 Years | 0 (0.0%) | 18 (62.1%) |
| 6 to 11 Years | 0 (0.0%) | 42 (21.4%) |
| 12 to 14 Years | 69 (38.6%) | 76 (81.7%) |
| 15 Years | 71 (100.0%) | 0 (0.0%) |
| 16 and 17 Years | 41 (24.0%) | 38 (24.0%) |
| 18 to 24 Years | 15 (7.6%) | 66 (31.4%) |
| 25 to 34 Years | 76 (12.6%) | 137 (37.2%) |
| 35 to 44 Years | 58 (29.0%) | 229 (67.7%) |
| 45 to 54 Years | 102 (41.8%) | 153 (32.6%) |
| 55 to 64 Years | 117 (34.6%) | 157 (40.0%) |
| 65 to 74 Years | 95 (41.7%) | 54 (34.8%) |
| 75 Years and over | 21 (9.0%) | 65 (32.8%) |
| Total | 734 (25.8%) | 1,116 (40.7%) |
Income Above Poverty by Sex and Age in Fruitridge Pocket
According to the poverty statistics in Fruitridge Pocket, males aged 5 years and females aged 6 to 11 years are the age groups that are most secure financially, with 100.0% of males and 78.6% of females in these age groups living above the poverty line.
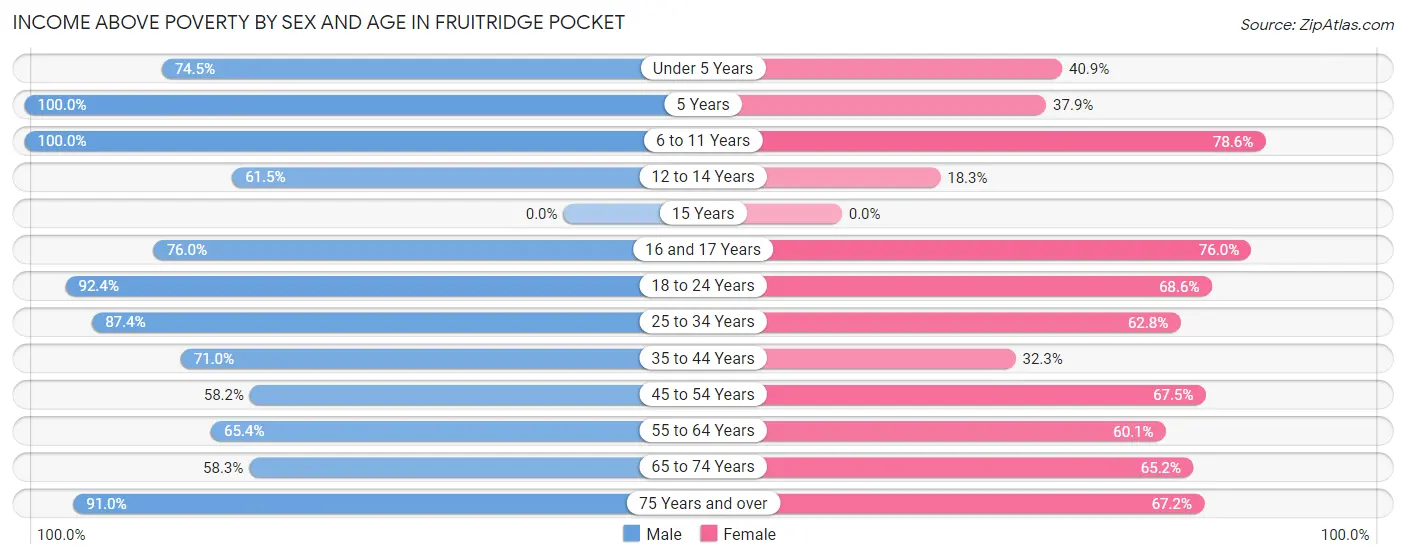
| Age Bracket | Male | Female |
| Under 5 Years | 202 (74.5%) | 56 (40.9%) |
| 5 Years | 24 (100.0%) | 11 (37.9%) |
| 6 to 11 Years | 91 (100.0%) | 154 (78.6%) |
| 12 to 14 Years | 110 (61.5%) | 17 (18.3%) |
| 15 Years | 0 (0.0%) | 0 (0.0%) |
| 16 and 17 Years | 130 (76.0%) | 120 (75.9%) |
| 18 to 24 Years | 182 (92.4%) | 144 (68.6%) |
| 25 to 34 Years | 529 (87.4%) | 231 (62.8%) |
| 35 to 44 Years | 142 (71.0%) | 109 (32.3%) |
| 45 to 54 Years | 142 (58.2%) | 317 (67.4%) |
| 55 to 64 Years | 221 (65.4%) | 236 (60.1%) |
| 65 to 74 Years | 133 (58.3%) | 101 (65.2%) |
| 75 Years and over | 211 (90.9%) | 133 (67.2%) |
| Total | 2,117 (74.3%) | 1,629 (59.3%) |
Income Below Poverty Among Married-Couple Families in Fruitridge Pocket
The poverty statistics for married-couple families in Fruitridge Pocket show that 17.8% or 115 of the total 646 families live below the poverty line. Families with 1 or 2 children have the highest poverty rate of 28.3%, comprising of 51 families. On the other hand, families with no children have the lowest poverty rate of 12.9%, which includes 44 families.
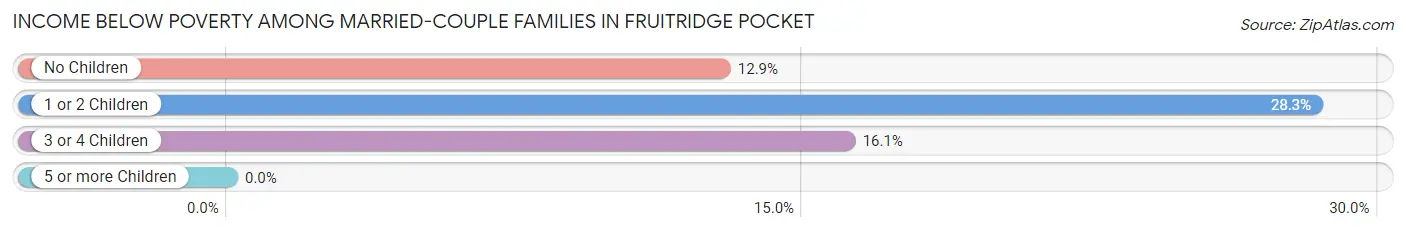
| Children | Above Poverty | Below Poverty |
| No Children | 298 (87.1%) | 44 (12.9%) |
| 1 or 2 Children | 129 (71.7%) | 51 (28.3%) |
| 3 or 4 Children | 104 (83.9%) | 20 (16.1%) |
| 5 or more Children | 0 (0.0%) | 0 (0.0%) |
| Total | 531 (82.2%) | 115 (17.8%) |
Income Below Poverty Among Single-Parent Households in Fruitridge Pocket
According to the poverty data in Fruitridge Pocket, 21.1% or 56 single-father households and 38.0% or 159 single-mother households are living below the poverty line. Among single-father households, those with 1 or 2 children have the highest poverty rate, with 56 households (43.8%) experiencing poverty. Likewise, among single-mother households, those with 5 or more children have the highest poverty rate, with 17 households (100.0%) falling below the poverty line.
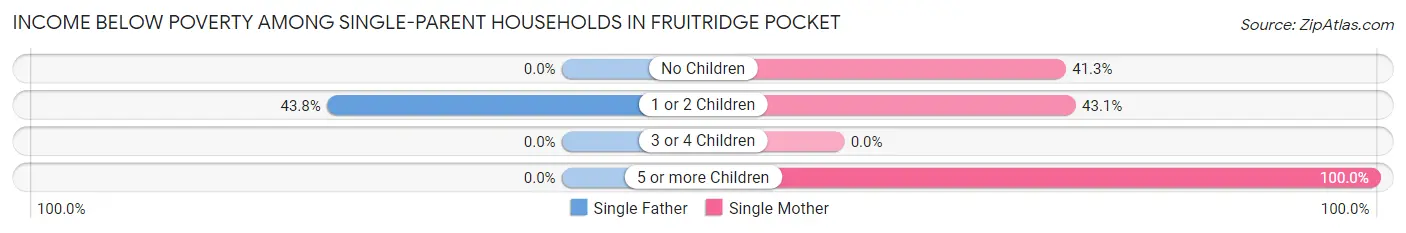
| Children | Single Father | Single Mother |
| No Children | 0 (0.0%) | 45 (41.3%) |
| 1 or 2 Children | 56 (43.8%) | 97 (43.1%) |
| 3 or 4 Children | 0 (0.0%) | 0 (0.0%) |
| 5 or more Children | 0 (0.0%) | 17 (100.0%) |
| Total | 56 (21.1%) | 159 (38.0%) |
Income Below Poverty Among Married-Couple vs Single-Parent Households in Fruitridge Pocket
The poverty data for Fruitridge Pocket shows that 115 of the married-couple family households (17.8%) and 215 of the single-parent households (31.5%) are living below the poverty level. Within the married-couple family households, those with 1 or 2 children have the highest poverty rate, with 51 households (28.3%) falling below the poverty line. Among the single-parent households, those with 5 or more children have the highest poverty rate, with 17 household (100.0%) living below poverty.
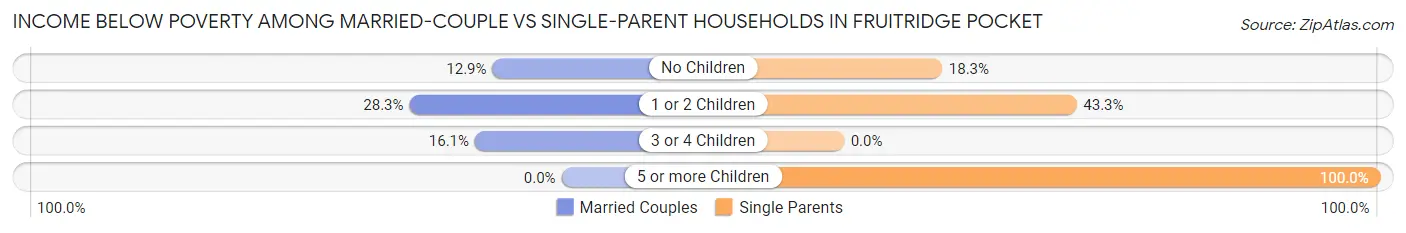
| Children | Married-Couple Families | Single-Parent Households |
| No Children | 44 (12.9%) | 45 (18.3%) |
| 1 or 2 Children | 51 (28.3%) | 153 (43.3%) |
| 3 or 4 Children | 20 (16.1%) | 0 (0.0%) |
| 5 or more Children | 0 (0.0%) | 17 (100.0%) |
| Total | 115 (17.8%) | 215 (31.5%) |
Race in Fruitridge Pocket
The most populous races in Fruitridge Pocket are Hispanic or Latino (2,412 | 43.1%), White / Caucasian (1,575 | 28.1%), and Some other Race (1,574 | 28.1%).
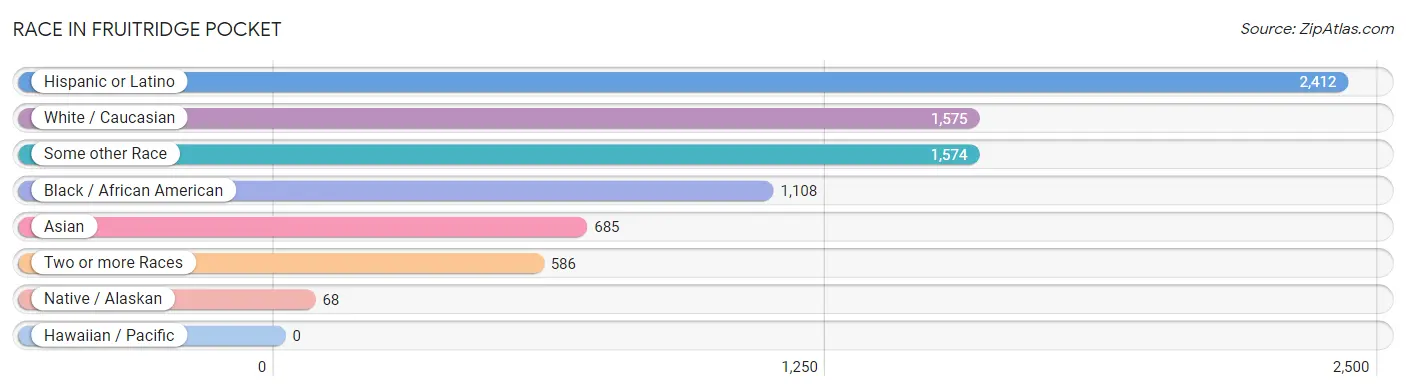
| Race | # Population | % Population |
| Asian | 685 | 12.2% |
| Black / African American | 1,108 | 19.8% |
| Hawaiian / Pacific | 0 | 0.0% |
| Hispanic or Latino | 2,412 | 43.1% |
| Native / Alaskan | 68 | 1.2% |
| White / Caucasian | 1,575 | 28.1% |
| Two or more Races | 586 | 10.5% |
| Some other Race | 1,574 | 28.1% |
| Total | 5,596 | 100.0% |
Ancestry in Fruitridge Pocket
The most populous ancestries reported in Fruitridge Pocket are Mexican (2,281 | 40.8%), German (353 | 6.3%), Sri Lankan (256 | 4.6%), Indian (Asian) (249 | 4.4%), and Irish (235 | 4.2%), together accounting for 60.3% of all Fruitridge Pocket residents.
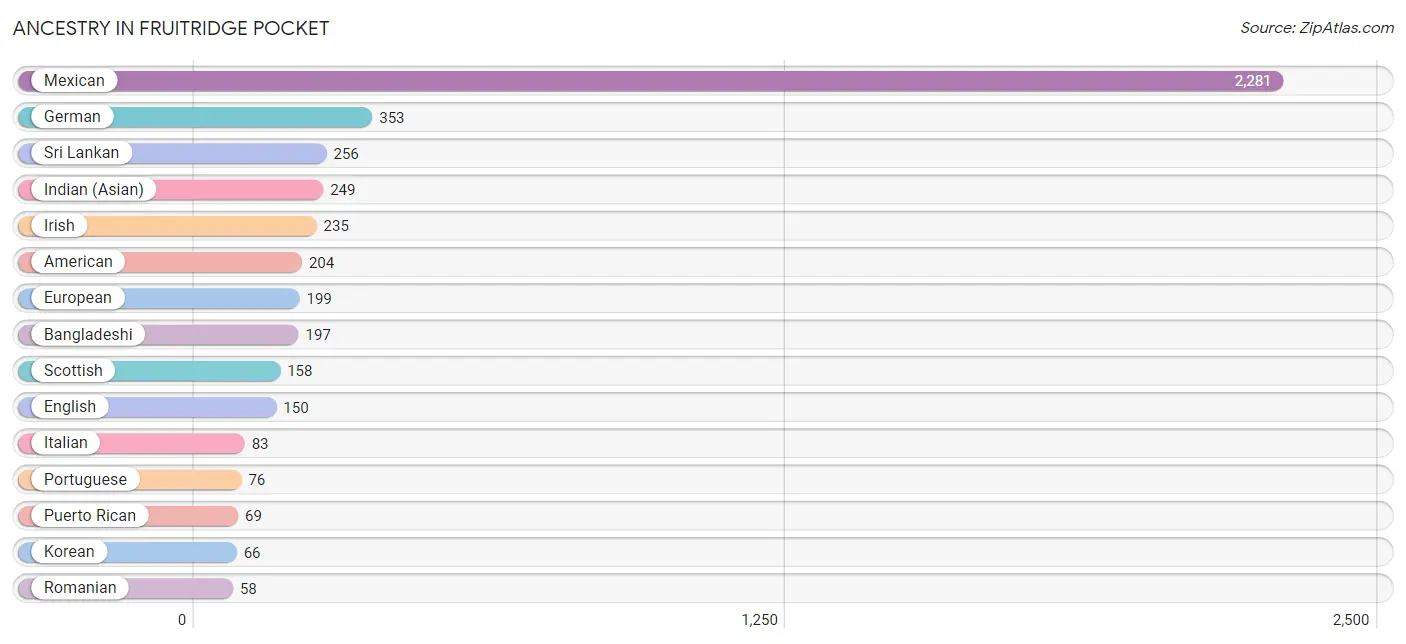
| Ancestry | # Population | % Population |
| Afghan | 7 | 0.1% |
| African | 33 | 0.6% |
| American | 204 | 3.6% |
| Bangladeshi | 197 | 3.5% |
| Bhutanese | 21 | 0.4% |
| British | 10 | 0.2% |
| Bulgarian | 26 | 0.5% |
| Central American | 52 | 0.9% |
| Central American Indian | 28 | 0.5% |
| English | 150 | 2.7% |
| European | 199 | 3.6% |
| German | 353 | 6.3% |
| Greek | 7 | 0.1% |
| Guatemalan | 52 | 0.9% |
| Hungarian | 8 | 0.1% |
| Indian (Asian) | 249 | 4.4% |
| Irish | 235 | 4.2% |
| Italian | 83 | 1.5% |
| Korean | 66 | 1.2% |
| Mexican | 2,281 | 40.8% |
| Mexican American Indian | 40 | 0.7% |
| Norwegian | 38 | 0.7% |
| Osage | 46 | 0.8% |
| Portuguese | 76 | 1.4% |
| Puerto Rican | 69 | 1.2% |
| Romanian | 58 | 1.0% |
| Russian | 29 | 0.5% |
| Scotch-Irish | 23 | 0.4% |
| Scottish | 158 | 2.8% |
| Sioux | 11 | 0.2% |
| Spaniard | 3 | 0.1% |
| Spanish | 4 | 0.1% |
| Sri Lankan | 256 | 4.6% |
| Subsaharan African | 33 | 0.6% |
| Swedish | 8 | 0.1% | View All 35 Rows |
Immigrants in Fruitridge Pocket
The most numerous immigrant groups reported in Fruitridge Pocket came from Central America (746 | 13.3%), Latin America (746 | 13.3%), Mexico (707 | 12.6%), Asia (513 | 9.2%), and South Eastern Asia (402 | 7.2%), together accounting for 55.6% of all Fruitridge Pocket residents.
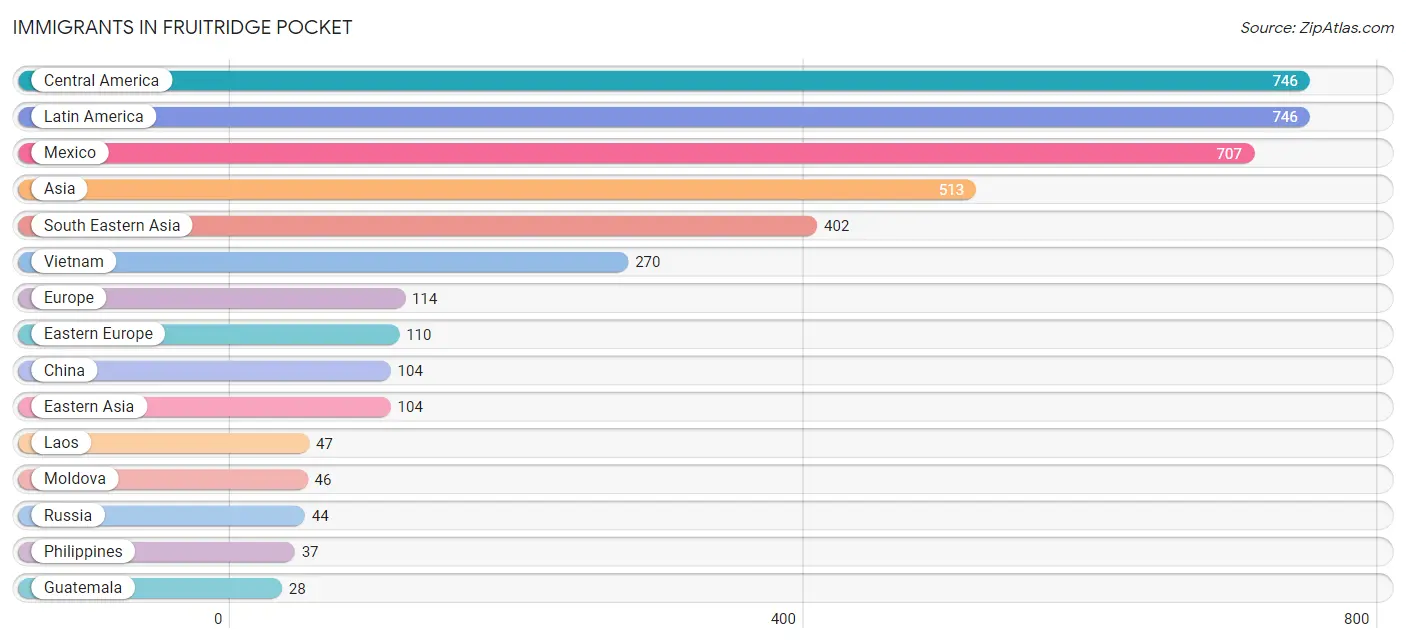
| Immigration Origin | # Population | % Population |
| Afghanistan | 7 | 0.1% |
| Asia | 513 | 9.2% |
| Central America | 746 | 13.3% |
| China | 104 | 1.9% |
| Eastern Asia | 104 | 1.9% |
| Eastern Europe | 110 | 2.0% |
| Europe | 114 | 2.0% |
| Germany | 4 | 0.1% |
| Guatemala | 28 | 0.5% |
| Hong Kong | 27 | 0.5% |
| Laos | 47 | 0.8% |
| Latin America | 746 | 13.3% |
| Malaysia | 18 | 0.3% |
| Mexico | 707 | 12.6% |
| Moldova | 46 | 0.8% |
| Nicaragua | 11 | 0.2% |
| Philippines | 37 | 0.7% |
| Romania | 20 | 0.4% |
| Russia | 44 | 0.8% |
| Singapore | 10 | 0.2% |
| South Central Asia | 7 | 0.1% |
| South Eastern Asia | 402 | 7.2% |
| Thailand | 20 | 0.4% |
| Vietnam | 270 | 4.8% |
| Western Europe | 4 | 0.1% | View All 25 Rows |
Sex and Age in Fruitridge Pocket
Sex and Age in Fruitridge Pocket
The most populous age groups in Fruitridge Pocket are 25 to 29 Years (354 | 12.4%) for men and 50 to 54 Years (236 | 8.6%) for women.
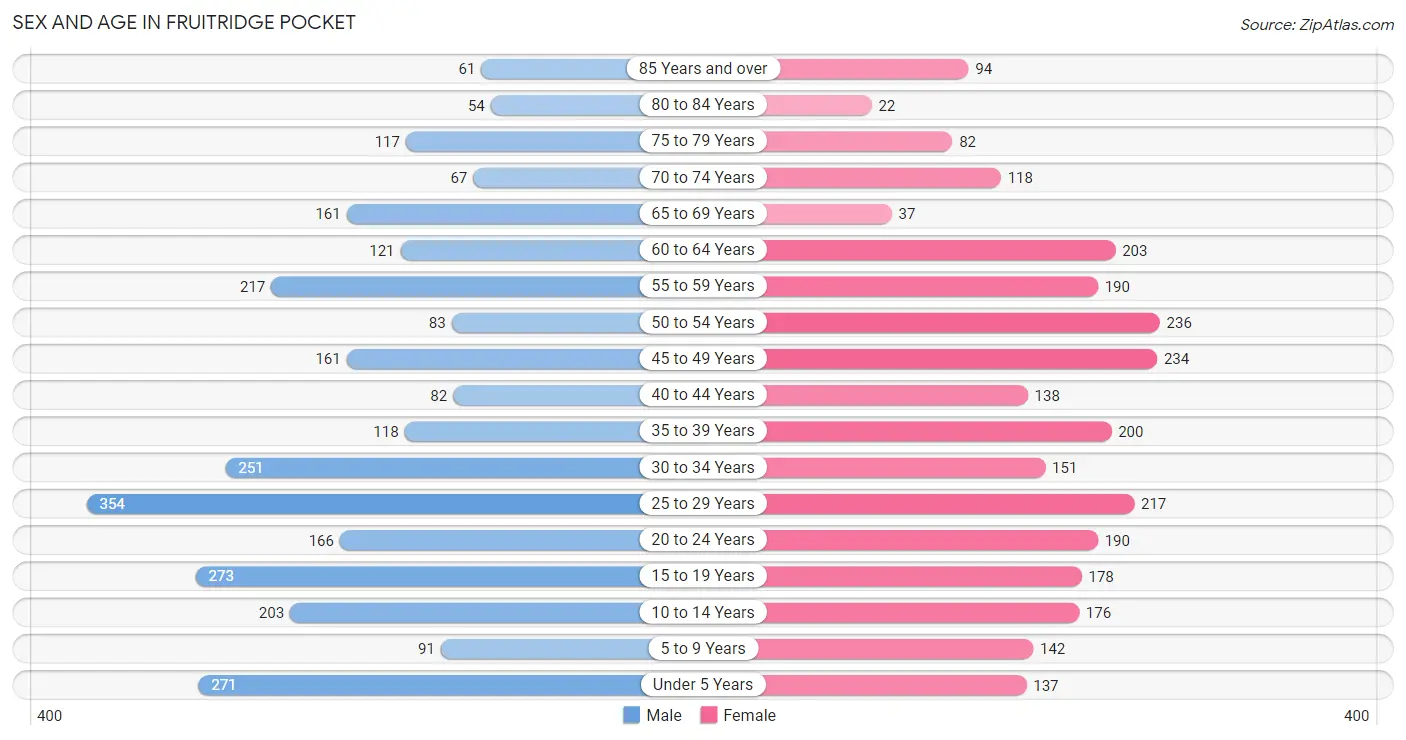
| Age Bracket | Male | Female |
| Under 5 Years | 271 (9.5%) | 137 (5.0%) |
| 5 to 9 Years | 91 (3.2%) | 142 (5.2%) |
| 10 to 14 Years | 203 (7.1%) | 176 (6.4%) |
| 15 to 19 Years | 273 (9.6%) | 178 (6.5%) |
| 20 to 24 Years | 166 (5.8%) | 190 (6.9%) |
| 25 to 29 Years | 354 (12.4%) | 217 (7.9%) |
| 30 to 34 Years | 251 (8.8%) | 151 (5.5%) |
| 35 to 39 Years | 118 (4.1%) | 200 (7.3%) |
| 40 to 44 Years | 82 (2.9%) | 138 (5.0%) |
| 45 to 49 Years | 161 (5.7%) | 234 (8.5%) |
| 50 to 54 Years | 83 (2.9%) | 236 (8.6%) |
| 55 to 59 Years | 217 (7.6%) | 190 (6.9%) |
| 60 to 64 Years | 121 (4.2%) | 203 (7.4%) |
| 65 to 69 Years | 161 (5.7%) | 37 (1.3%) |
| 70 to 74 Years | 67 (2.4%) | 118 (4.3%) |
| 75 to 79 Years | 117 (4.1%) | 82 (3.0%) |
| 80 to 84 Years | 54 (1.9%) | 22 (0.8%) |
| 85 Years and over | 61 (2.1%) | 94 (3.4%) |
| Total | 2,851 (100.0%) | 2,745 (100.0%) |
Families and Households in Fruitridge Pocket
Median Family Size in Fruitridge Pocket
The median family size in Fruitridge Pocket is 3.34 persons per family, with single female/mother families (418 | 31.5%) accounting for the largest median family size of 3.69 persons per family. On the other hand, single male/father families (265 | 19.9%) represent the smallest median family size with 2.62 persons per family.
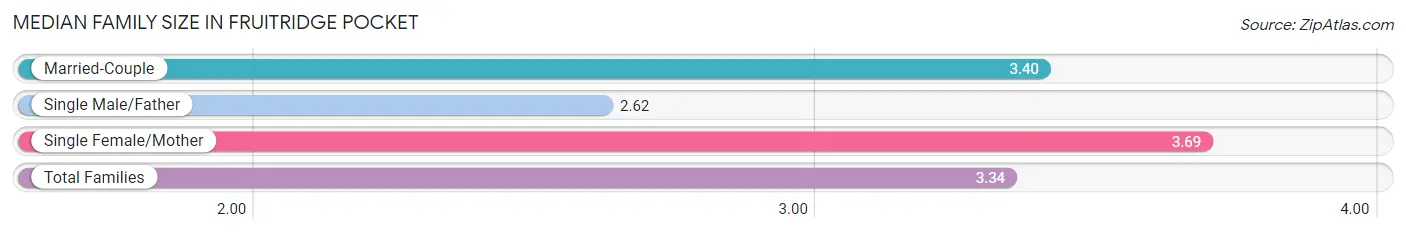
| Family Type | # Families | Family Size |
| Married-Couple | 646 (48.6%) | 3.40 |
| Single Male/Father | 265 (19.9%) | 2.62 |
| Single Female/Mother | 418 (31.5%) | 3.69 |
| Total Families | 1,329 (100.0%) | 3.34 |
Median Household Size in Fruitridge Pocket
The median household size in Fruitridge Pocket is 2.96 persons per household, with single female/mother households (418 | 23.4%) accounting for the largest median household size of 4.17 persons per household. non-family households (459 | 25.7%) represent the smallest median household size with 1.23 persons per household.
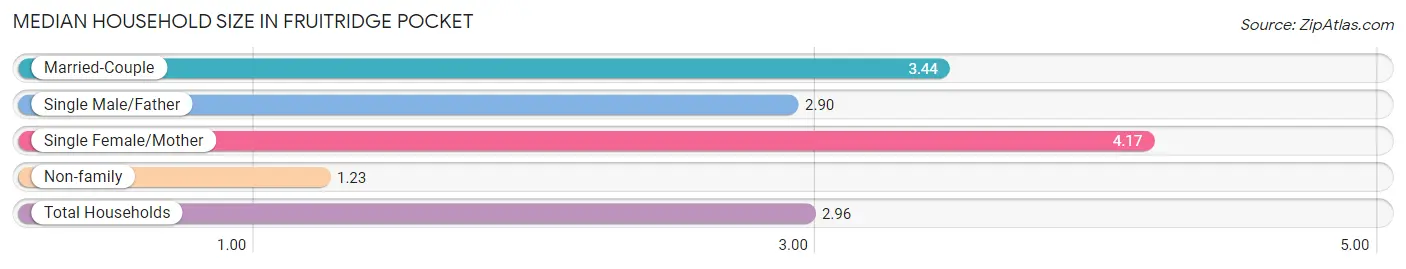
| Household Type | # Households | Household Size |
| Married-Couple | 646 (36.1%) | 3.44 |
| Single Male/Father | 265 (14.8%) | 2.90 |
| Single Female/Mother | 418 (23.4%) | 4.17 |
| Non-family | 459 (25.7%) | 1.23 |
| Total Households | 1,788 (100.0%) | 2.96 |
Household Size by Marriage Status in Fruitridge Pocket
Out of a total of 1,788 households in Fruitridge Pocket, 1,329 (74.3%) are family households, while 459 (25.7%) are nonfamily households. The most numerous type of family households are 2-person households, comprising 430, and the most common type of nonfamily households are 1-person households, comprising 385.
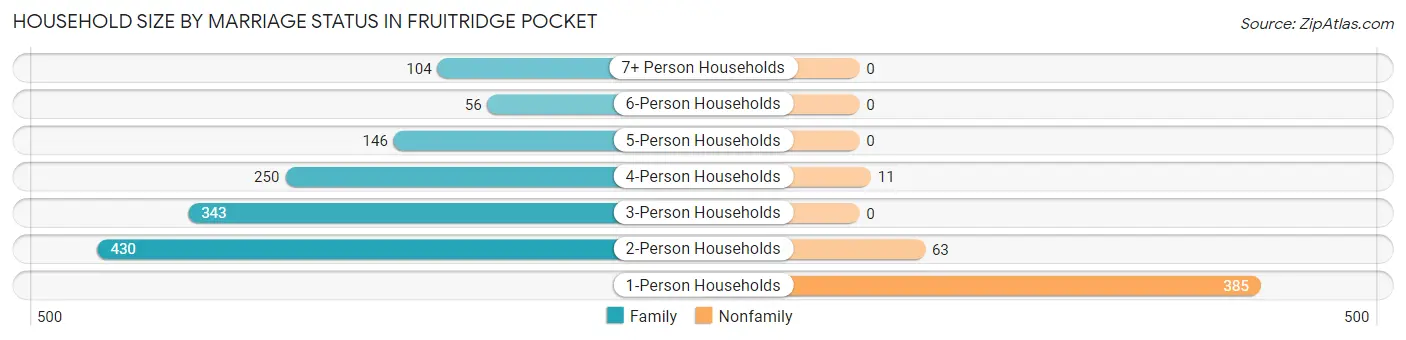
| Household Size | Family Households | Nonfamily Households |
| 1-Person Households | - | 385 (21.5%) |
| 2-Person Households | 430 (24.0%) | 63 (3.5%) |
| 3-Person Households | 343 (19.2%) | 0 (0.0%) |
| 4-Person Households | 250 (14.0%) | 11 (0.6%) |
| 5-Person Households | 146 (8.2%) | 0 (0.0%) |
| 6-Person Households | 56 (3.1%) | 0 (0.0%) |
| 7+ Person Households | 104 (5.8%) | 0 (0.0%) |
| Total | 1,329 (74.3%) | 459 (25.7%) |
Female Fertility in Fruitridge Pocket
Fertility by Age in Fruitridge Pocket
Average fertility rate in Fruitridge Pocket is 25.0 births per 1,000 women. Women in the age bracket of 20 to 34 years have the highest fertility rate with 66.0 births per 1,000 women. Women in the age bracket of 20 to 34 years acount for 100.0% of all women with births.
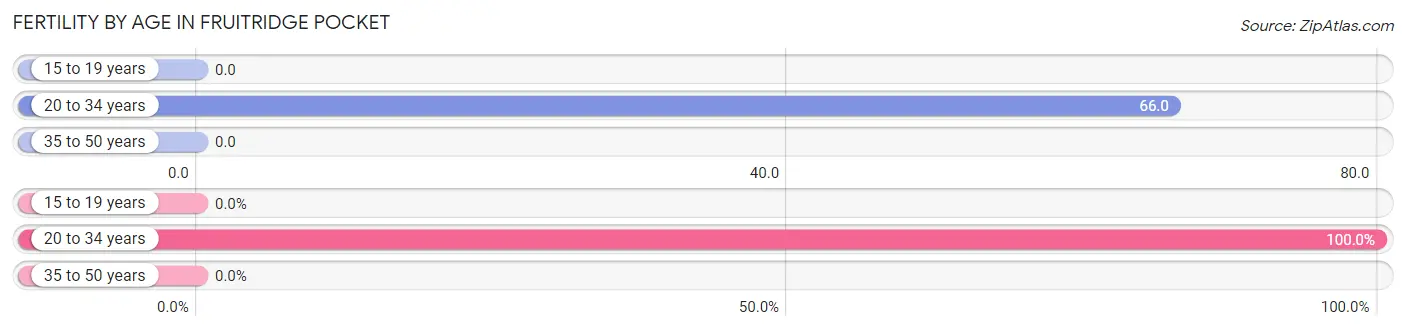
| Age Bracket | Women with Births | Births / 1,000 Women |
| 15 to 19 years | 0 (0.0%) | 0.0 |
| 20 to 34 years | 37 (100.0%) | 66.0 |
| 35 to 50 years | 0 (0.0%) | 0.0 |
| Total | 37 (100.0%) | 25.0 |
Fertility by Age by Marriage Status in Fruitridge Pocket
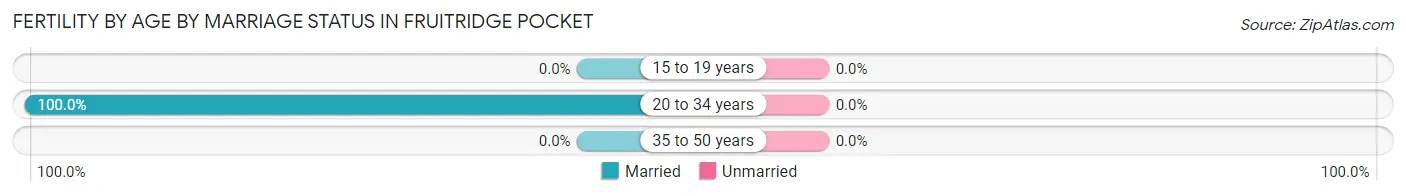
| Age Bracket | Married | Unmarried |
| 15 to 19 years | 0 (0.0%) | 0 (0.0%) |
| 20 to 34 years | 37 (100.0%) | 0 (0.0%) |
| 35 to 50 years | 0 (0.0%) | 0 (0.0%) |
| Total | 37 (100.0%) | 0 (0.0%) |
Fertility by Education in Fruitridge Pocket
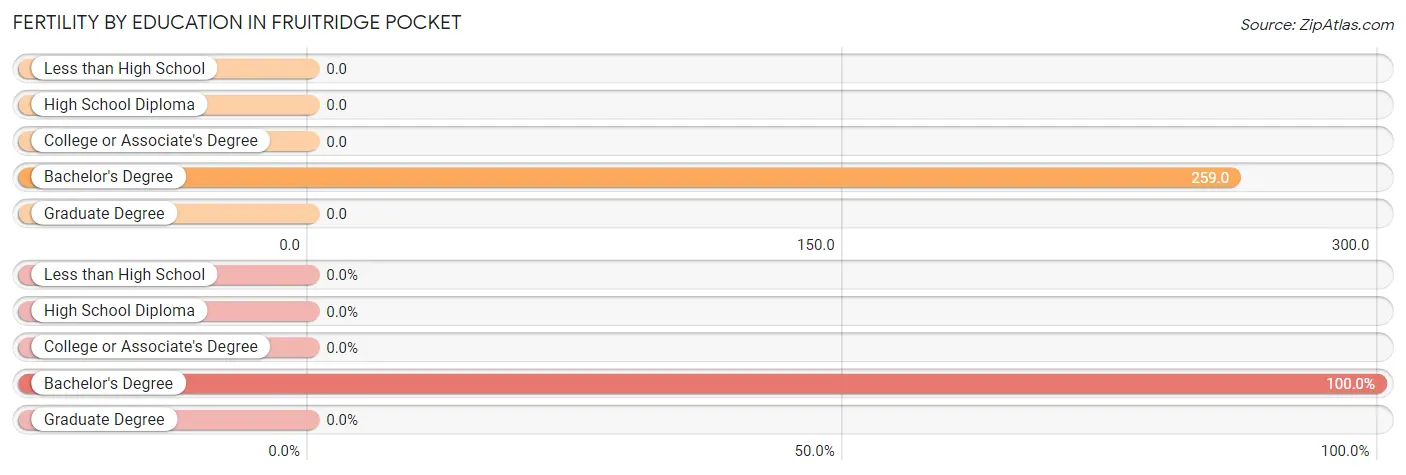
| Educational Attainment | Women with Births | Births / 1,000 Women |
| Less than High School | 0 (0.0%) | 0.0 |
| High School Diploma | 0 (0.0%) | 0.0 |
| College or Associate's Degree | 0 (0.0%) | 0.0 |
| Bachelor's Degree | 37 (100.0%) | 259.0 |
| Graduate Degree | 0 (0.0%) | 0.0 |
| Total | 37 (100.0%) | 25.0 |
Fertility by Education by Marriage Status in Fruitridge Pocket
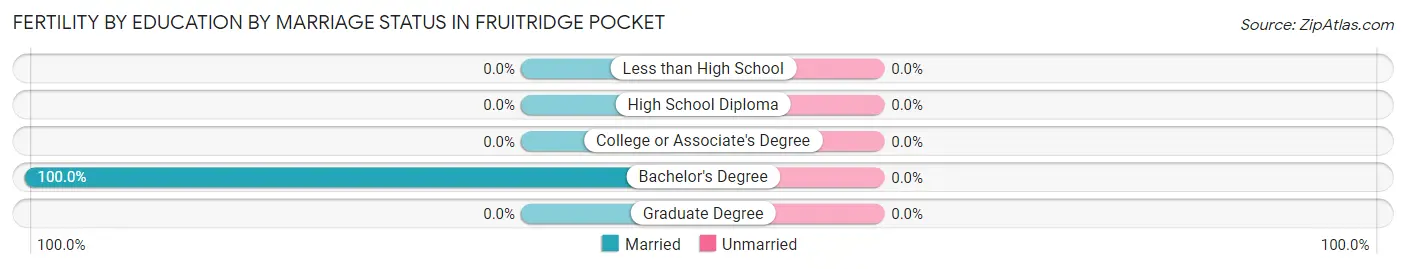
| Educational Attainment | Married | Unmarried |
| Less than High School | 0 (0.0%) | 0 (0.0%) |
| High School Diploma | 0 (0.0%) | 0 (0.0%) |
| College or Associate's Degree | 0 (0.0%) | 0 (0.0%) |
| Bachelor's Degree | 37 (100.0%) | 0 (0.0%) |
| Graduate Degree | 0 (0.0%) | 0 (0.0%) |
| Total | 37 (100.0%) | 0 (0.0%) |
Employment Characteristics in Fruitridge Pocket
Employment by Class of Employer in Fruitridge Pocket
Among the 1,931 employed individuals in Fruitridge Pocket, private company employees (1,263 | 65.4%), federal government employees (155 | 8.0%), and self-employed (not incorporated) (139 | 7.2%) make up the most common classes of employment.
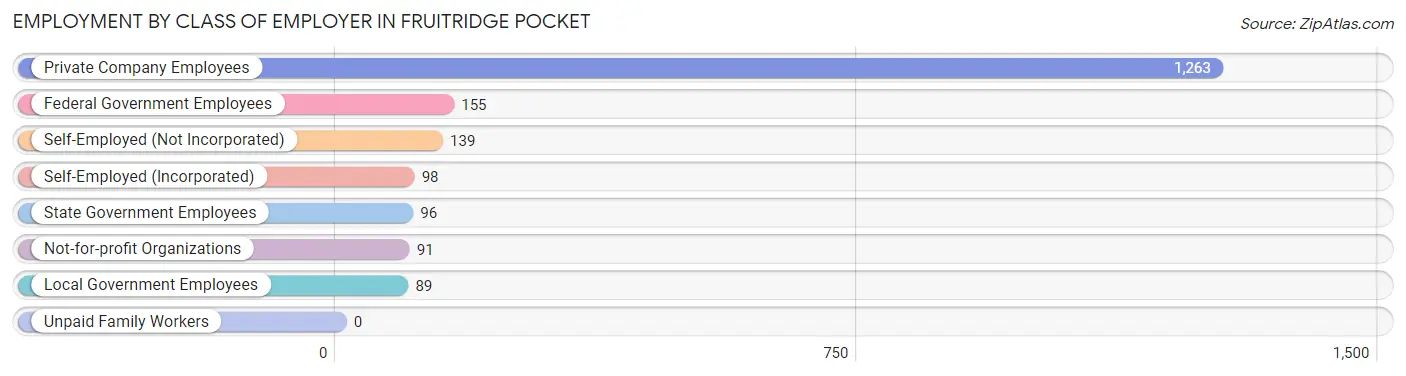
| Employer Class | # Employees | % Employees |
| Private Company Employees | 1,263 | 65.4% |
| Self-Employed (Incorporated) | 98 | 5.1% |
| Self-Employed (Not Incorporated) | 139 | 7.2% |
| Not-for-profit Organizations | 91 | 4.7% |
| Local Government Employees | 89 | 4.6% |
| State Government Employees | 96 | 5.0% |
| Federal Government Employees | 155 | 8.0% |
| Unpaid Family Workers | 0 | 0.0% |
| Total | 1,931 | 100.0% |
Employment Status by Age in Fruitridge Pocket
According to the labor force statistics for Fruitridge Pocket, out of the total population over 16 years of age (4,505), 47.0% or 2,117 individuals are in the labor force, with 6.4% or 135 of them unemployed. The age group with the highest labor force participation rate is 25 to 29 years, with 83.0% or 474 individuals in the labor force. Within the labor force, the 30 to 34 years age range has the highest percentage of unemployed individuals, with 18.3% or 56 of them being unemployed.
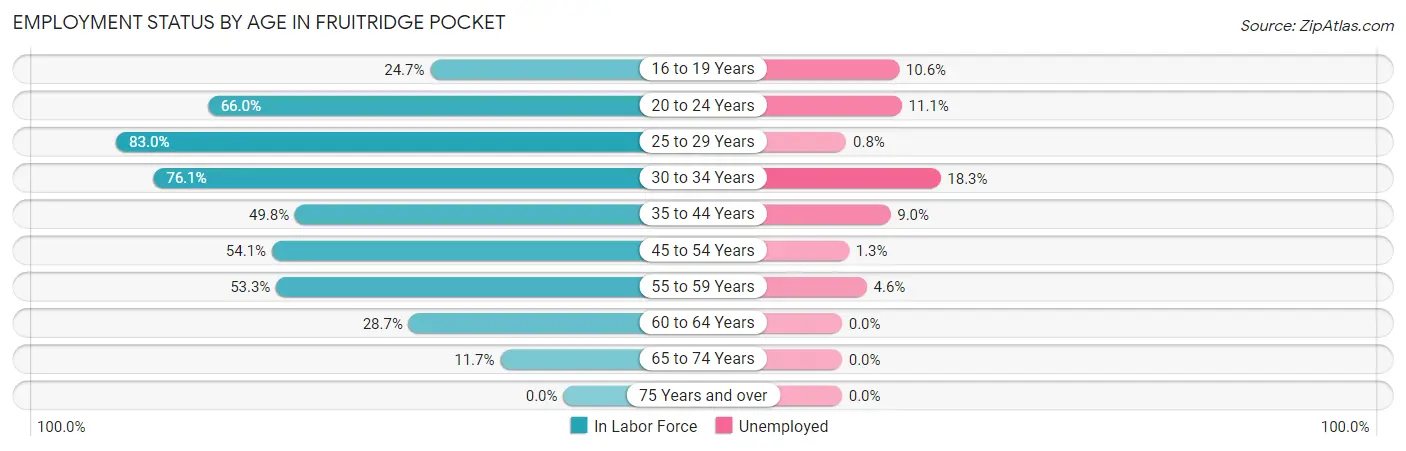
| Age Bracket | In Labor Force | Unemployed |
| 16 to 19 Years | 94 (24.7%) | 10 (10.6%) |
| 20 to 24 Years | 235 (66.0%) | 26 (11.1%) |
| 25 to 29 Years | 474 (83.0%) | 4 (0.8%) |
| 30 to 34 Years | 306 (76.1%) | 56 (18.3%) |
| 35 to 44 Years | 268 (49.8%) | 24 (9.0%) |
| 45 to 54 Years | 386 (54.1%) | 5 (1.3%) |
| 55 to 59 Years | 217 (53.3%) | 10 (4.6%) |
| 60 to 64 Years | 93 (28.7%) | 0 (0.0%) |
| 65 to 74 Years | 45 (11.7%) | 0 (0.0%) |
| 75 Years and over | 0 (0.0%) | 0 (0.0%) |
| Total | 2,117 (47.0%) | 135 (6.4%) |
Employment Status by Educational Attainment in Fruitridge Pocket
According to labor force statistics for Fruitridge Pocket, 59.0% of individuals (1,744) out of the total population between 25 and 64 years of age (2,956) are in the labor force, with 5.7% or 99 of them being unemployed. The group with the highest labor force participation rate are those with the educational attainment of bachelor's degree or higher, with 81.9% or 442 individuals in the labor force. Within the labor force, individuals with high school diploma education have the highest percentage of unemployment, with 10.9% or 43 of them being unemployed.
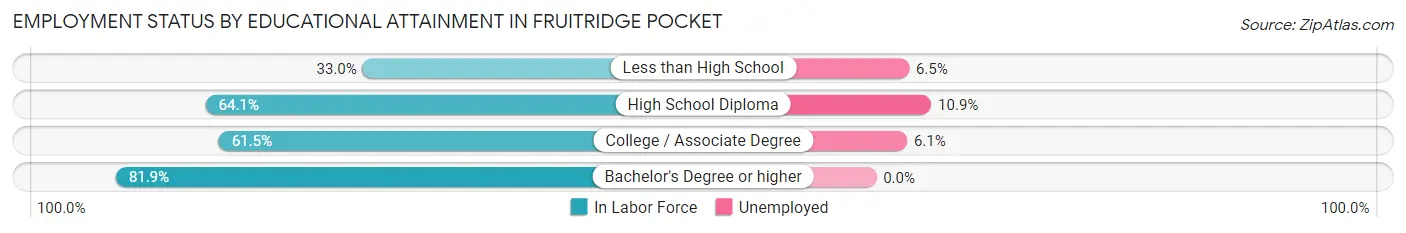
| Educational Attainment | In Labor Force | Unemployed |
| Less than High School | 231 (33.0%) | 46 (6.5%) |
| High School Diploma | 396 (64.1%) | 67 (10.9%) |
| College / Associate Degree | 675 (61.5%) | 67 (6.1%) |
| Bachelor's Degree or higher | 442 (81.9%) | 0 (0.0%) |
| Total | 1,744 (59.0%) | 168 (5.7%) |
Employment Occupations by Sex in Fruitridge Pocket
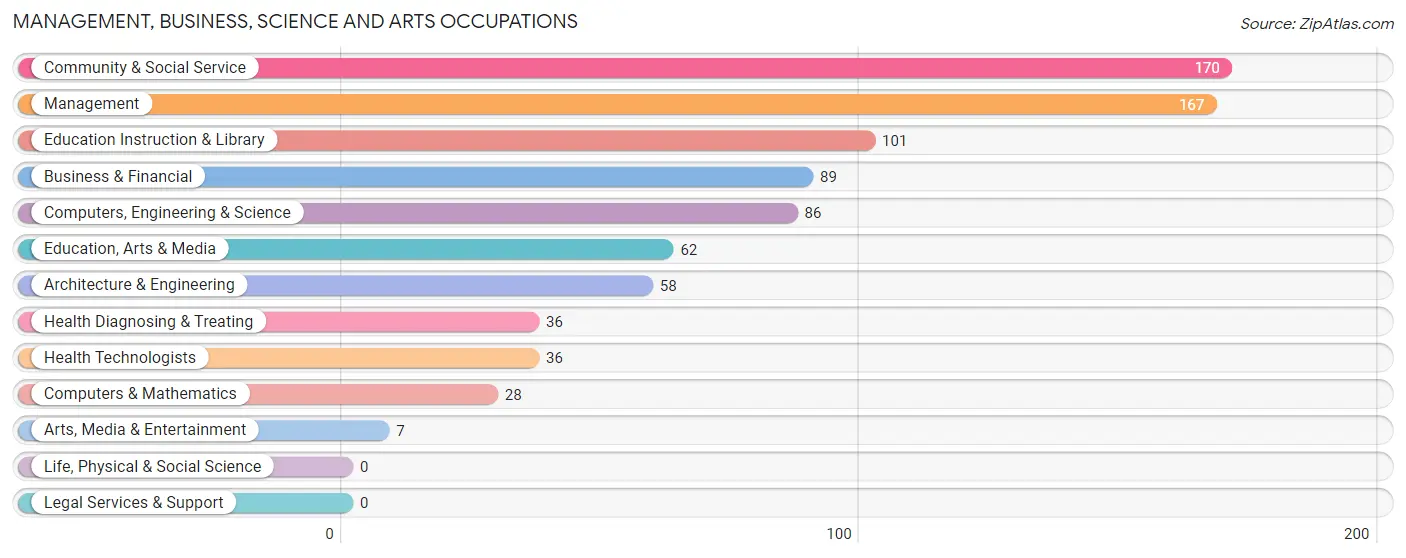
Management, Business, Science and Arts Occupations
The most common Management, Business, Science and Arts occupations in Fruitridge Pocket are Community & Social Service (170 | 8.6%), Management (167 | 8.4%), Education Instruction & Library (101 | 5.1%), Business & Financial (89 | 4.5%), and Computers, Engineering & Science (86 | 4.3%).
Management, Business, Science and Arts Occupations by Sex
Within the Management, Business, Science and Arts occupations in Fruitridge Pocket, the most male-oriented occupations are Architecture & Engineering (100.0%), Education, Arts & Media (85.5%), and Computers, Engineering & Science (76.7%), while the most female-oriented occupations are Education Instruction & Library (100.0%), Health Diagnosing & Treating (100.0%), and Health Technologists (100.0%).
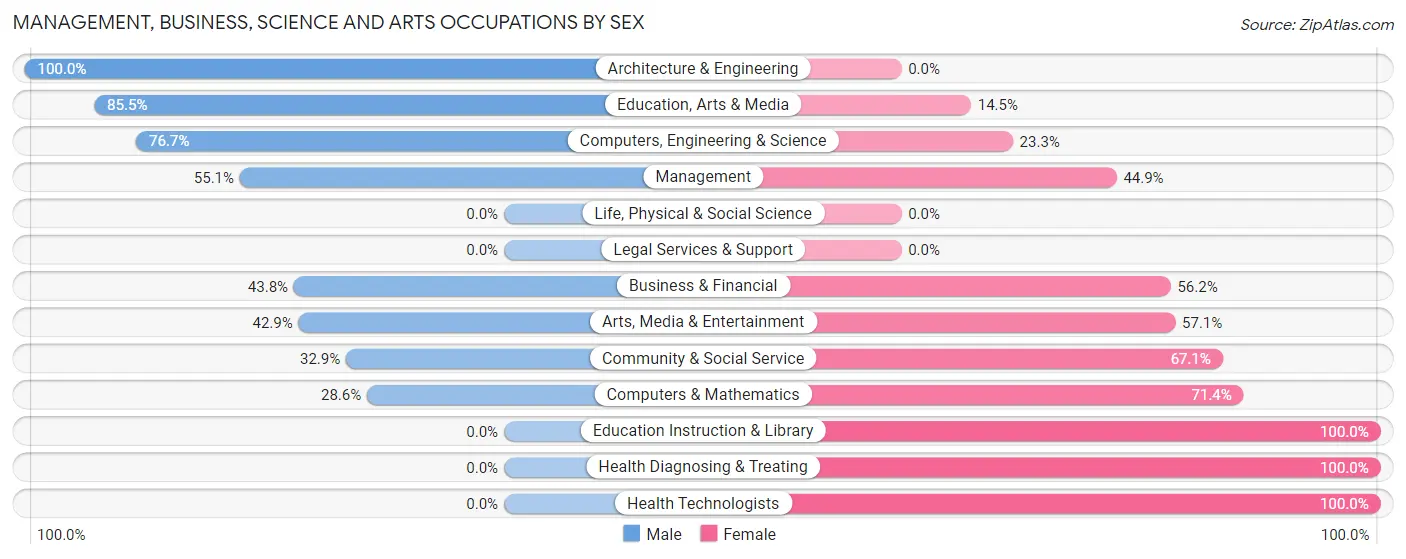
| Occupation | Male | Female |
| Management | 92 (55.1%) | 75 (44.9%) |
| Business & Financial | 39 (43.8%) | 50 (56.2%) |
| Computers, Engineering & Science | 66 (76.7%) | 20 (23.3%) |
| Computers & Mathematics | 8 (28.6%) | 20 (71.4%) |
| Architecture & Engineering | 58 (100.0%) | 0 (0.0%) |
| Life, Physical & Social Science | 0 (0.0%) | 0 (0.0%) |
| Community & Social Service | 56 (32.9%) | 114 (67.1%) |
| Education, Arts & Media | 53 (85.5%) | 9 (14.5%) |
| Legal Services & Support | 0 (0.0%) | 0 (0.0%) |
| Education Instruction & Library | 0 (0.0%) | 101 (100.0%) |
| Arts, Media & Entertainment | 3 (42.9%) | 4 (57.1%) |
| Health Diagnosing & Treating | 0 (0.0%) | 36 (100.0%) |
| Health Technologists | 0 (0.0%) | 36 (100.0%) |
| Total (Category) | 253 (46.2%) | 295 (53.8%) |
| Total (Overall) | 1,102 (55.6%) | 881 (44.4%) |
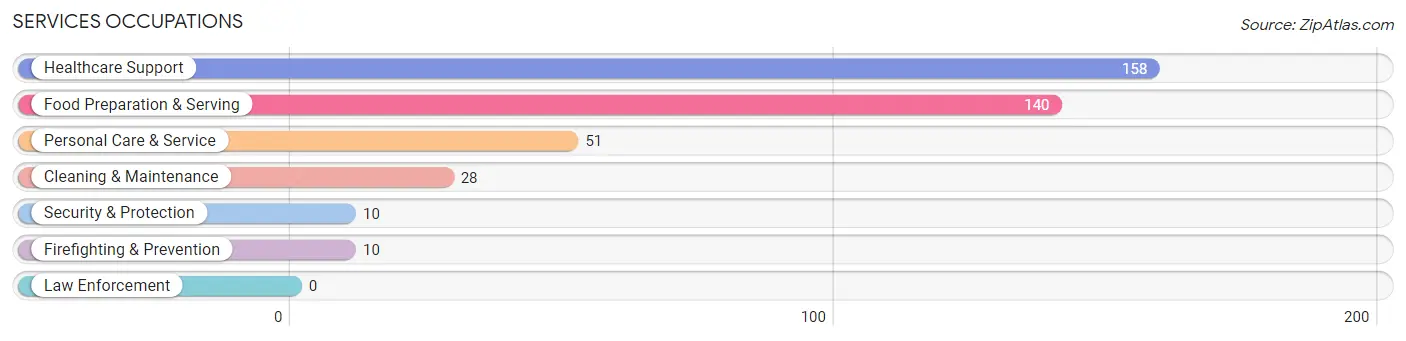
Services Occupations
The most common Services occupations in Fruitridge Pocket are Healthcare Support (158 | 8.0%), Food Preparation & Serving (140 | 7.1%), Personal Care & Service (51 | 2.6%), Cleaning & Maintenance (28 | 1.4%), and Security & Protection (10 | 0.5%).
Services Occupations by Sex
Within the Services occupations in Fruitridge Pocket, the most male-oriented occupations are Security & Protection (100.0%), Firefighting & Prevention (100.0%), and Cleaning & Maintenance (100.0%), while the most female-oriented occupations are Personal Care & Service (86.3%), Food Preparation & Serving (71.4%), and Healthcare Support (57.0%).
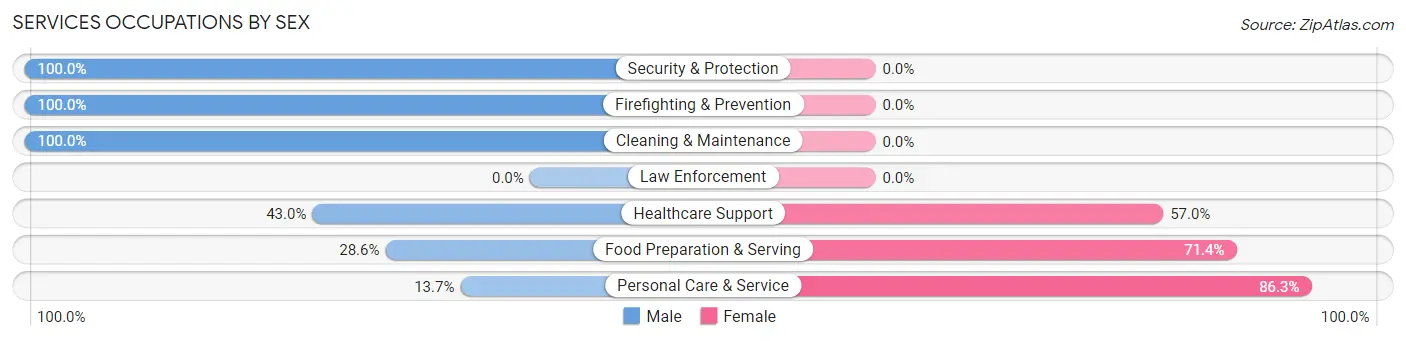
| Occupation | Male | Female |
| Healthcare Support | 68 (43.0%) | 90 (57.0%) |
| Security & Protection | 10 (100.0%) | 0 (0.0%) |
| Firefighting & Prevention | 10 (100.0%) | 0 (0.0%) |
| Law Enforcement | 0 (0.0%) | 0 (0.0%) |
| Food Preparation & Serving | 40 (28.6%) | 100 (71.4%) |
| Cleaning & Maintenance | 28 (100.0%) | 0 (0.0%) |
| Personal Care & Service | 7 (13.7%) | 44 (86.3%) |
| Total (Category) | 153 (39.5%) | 234 (60.5%) |
| Total (Overall) | 1,102 (55.6%) | 881 (44.4%) |
Sales and Office Occupations
The most common Sales and Office occupations in Fruitridge Pocket are Office & Administration (322 | 16.2%), and Sales & Related (124 | 6.2%).

Sales and Office Occupations by Sex
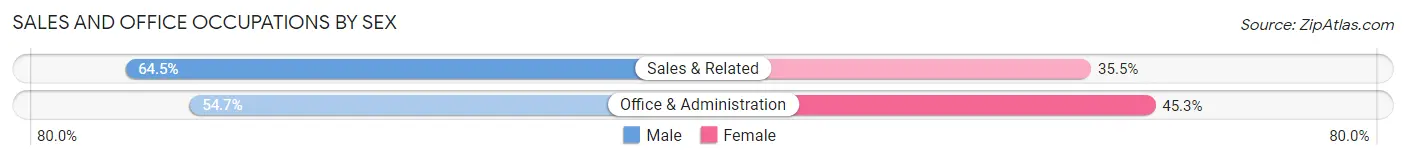
| Occupation | Male | Female |
| Sales & Related | 80 (64.5%) | 44 (35.5%) |
| Office & Administration | 176 (54.7%) | 146 (45.3%) |
| Total (Category) | 256 (57.4%) | 190 (42.6%) |
| Total (Overall) | 1,102 (55.6%) | 881 (44.4%) |
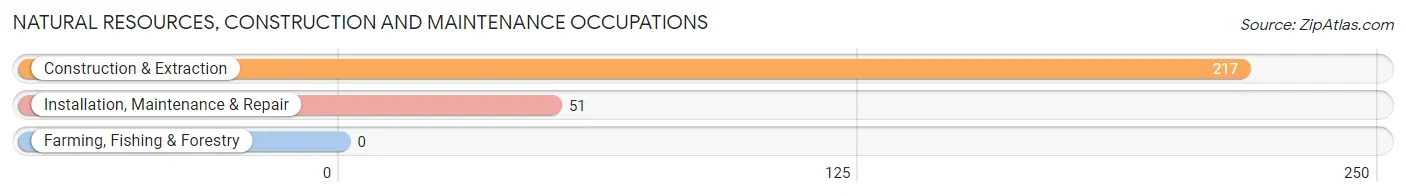
Natural Resources, Construction and Maintenance Occupations
The most common Natural Resources, Construction and Maintenance occupations in Fruitridge Pocket are Construction & Extraction (217 | 10.9%), and Installation, Maintenance & Repair (51 | 2.6%).
Natural Resources, Construction and Maintenance Occupations by Sex
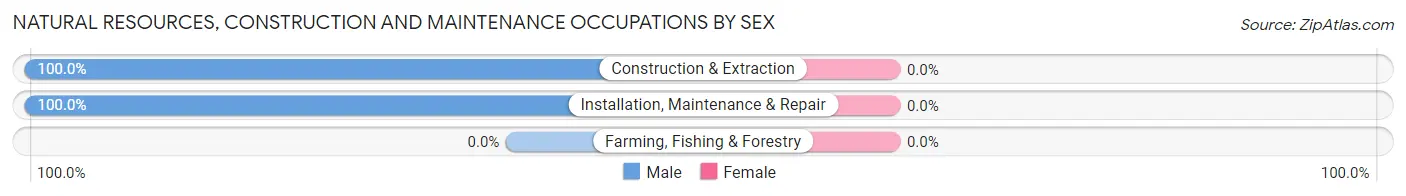
| Occupation | Male | Female |
| Farming, Fishing & Forestry | 0 (0.0%) | 0 (0.0%) |
| Construction & Extraction | 217 (100.0%) | 0 (0.0%) |
| Installation, Maintenance & Repair | 51 (100.0%) | 0 (0.0%) |
| Total (Category) | 268 (100.0%) | 0 (0.0%) |
| Total (Overall) | 1,102 (55.6%) | 881 (44.4%) |
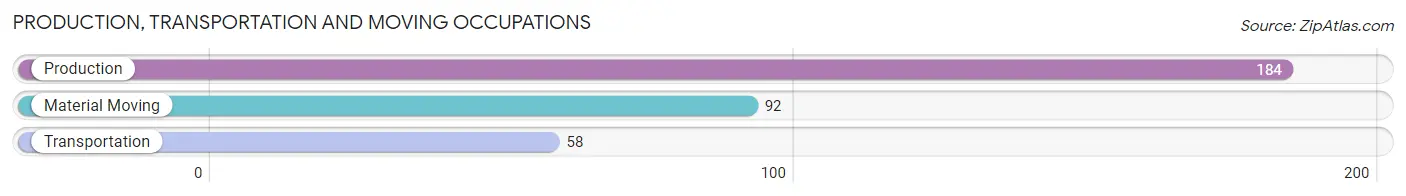
Production, Transportation and Moving Occupations
The most common Production, Transportation and Moving occupations in Fruitridge Pocket are Production (184 | 9.3%), Material Moving (92 | 4.6%), and Transportation (58 | 2.9%).
Production, Transportation and Moving Occupations by Sex
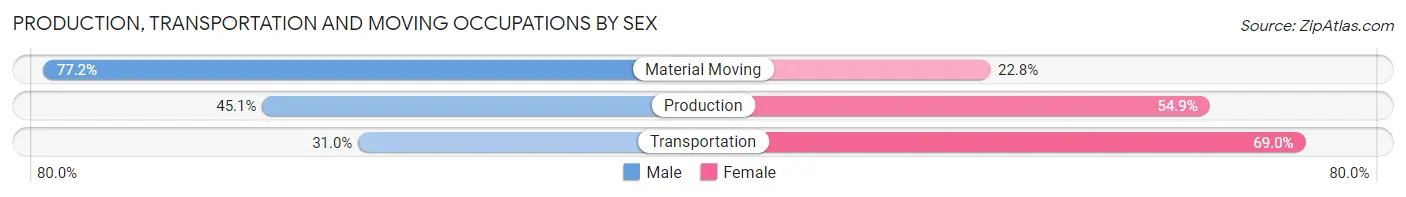
| Occupation | Male | Female |
| Production | 83 (45.1%) | 101 (54.9%) |
| Transportation | 18 (31.0%) | 40 (69.0%) |
| Material Moving | 71 (77.2%) | 21 (22.8%) |
| Total (Category) | 172 (51.5%) | 162 (48.5%) |
| Total (Overall) | 1,102 (55.6%) | 881 (44.4%) |
Employment Industries by Sex in Fruitridge Pocket
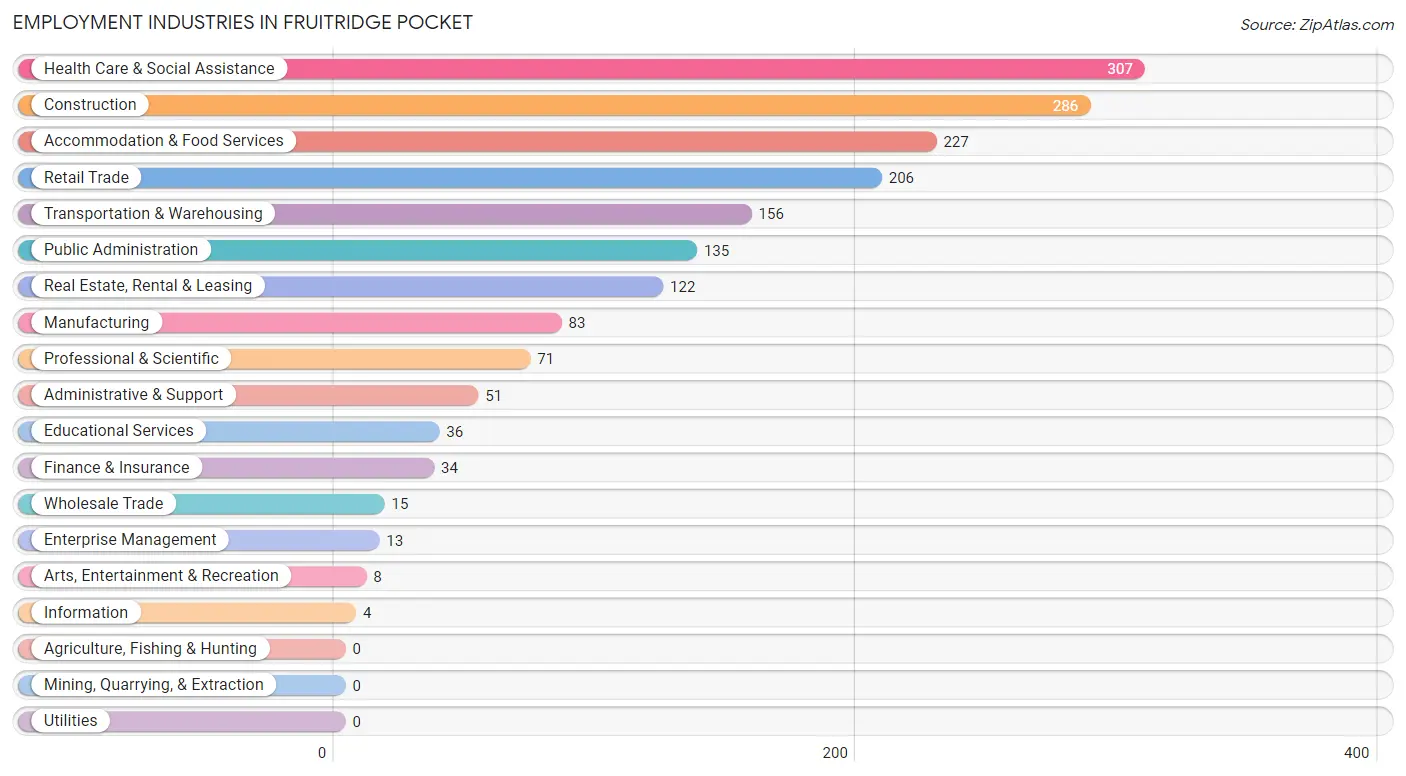
Employment Industries in Fruitridge Pocket
The major employment industries in Fruitridge Pocket include Health Care & Social Assistance (307 | 15.5%), Construction (286 | 14.4%), Accommodation & Food Services (227 | 11.5%), Retail Trade (206 | 10.4%), and Transportation & Warehousing (156 | 7.9%).
Employment Industries by Sex in Fruitridge Pocket
The Fruitridge Pocket industries that see more men than women are Administrative & Support (100.0%), Arts, Entertainment & Recreation (100.0%), and Transportation & Warehousing (98.7%), whereas the industries that tend to have a higher number of women are Information (100.0%), Enterprise Management (100.0%), and Professional & Scientific (93.0%).
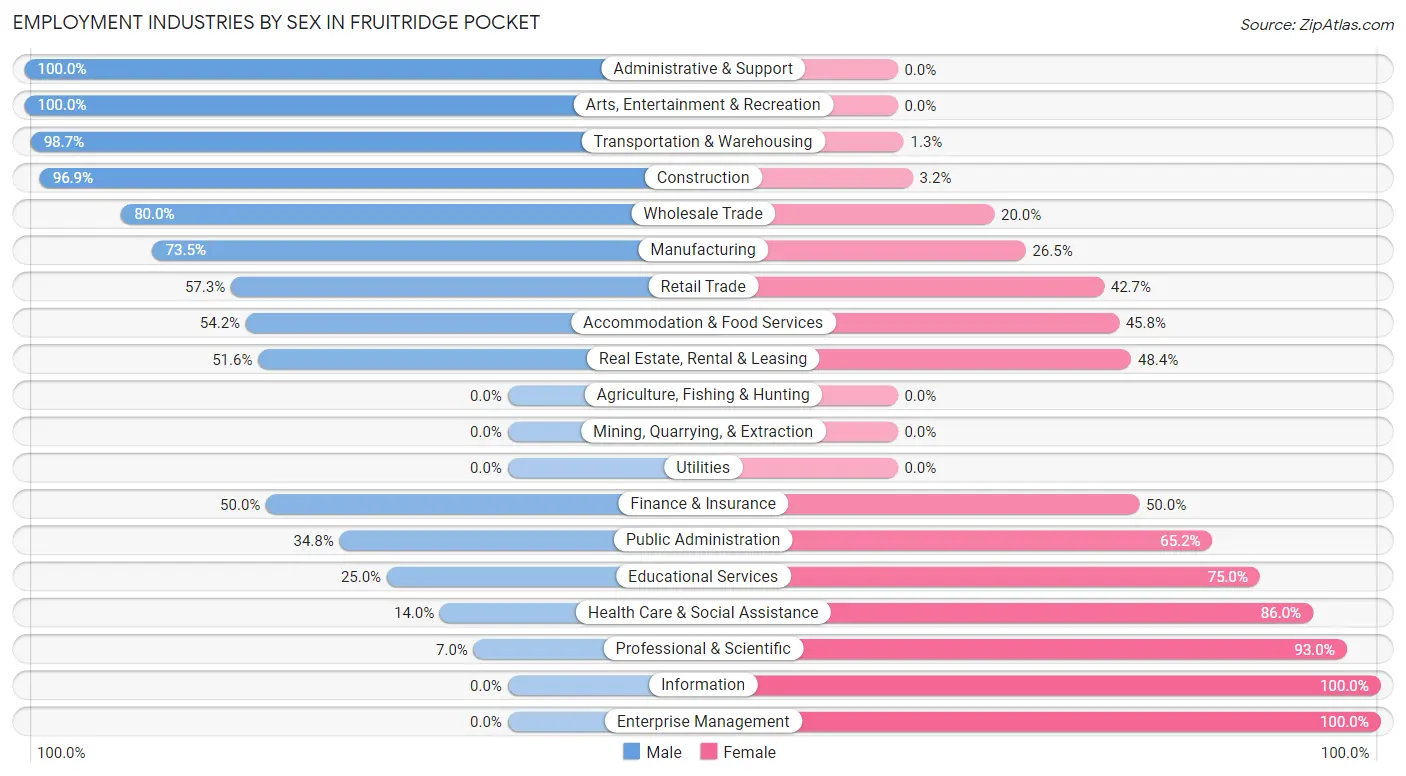
| Industry | Male | Female |
| Agriculture, Fishing & Hunting | 0 (0.0%) | 0 (0.0%) |
| Mining, Quarrying, & Extraction | 0 (0.0%) | 0 (0.0%) |
| Construction | 277 (96.9%) | 9 (3.2%) |
| Manufacturing | 61 (73.5%) | 22 (26.5%) |
| Wholesale Trade | 12 (80.0%) | 3 (20.0%) |
| Retail Trade | 118 (57.3%) | 88 (42.7%) |
| Transportation & Warehousing | 154 (98.7%) | 2 (1.3%) |
| Utilities | 0 (0.0%) | 0 (0.0%) |
| Information | 0 (0.0%) | 4 (100.0%) |
| Finance & Insurance | 17 (50.0%) | 17 (50.0%) |
| Real Estate, Rental & Leasing | 63 (51.6%) | 59 (48.4%) |
| Professional & Scientific | 5 (7.0%) | 66 (93.0%) |
| Enterprise Management | 0 (0.0%) | 13 (100.0%) |
| Administrative & Support | 51 (100.0%) | 0 (0.0%) |
| Educational Services | 9 (25.0%) | 27 (75.0%) |
| Health Care & Social Assistance | 43 (14.0%) | 264 (86.0%) |
| Arts, Entertainment & Recreation | 8 (100.0%) | 0 (0.0%) |
| Accommodation & Food Services | 123 (54.2%) | 104 (45.8%) |
| Public Administration | 47 (34.8%) | 88 (65.2%) |
| Total | 1,102 (55.6%) | 881 (44.4%) |
Education in Fruitridge Pocket
School Enrollment in Fruitridge Pocket
The most common levels of schooling among the 1,529 students in Fruitridge Pocket are high school (487 | 31.9%), college / undergraduate (293 | 19.2%), and middle school (252 | 16.5%).
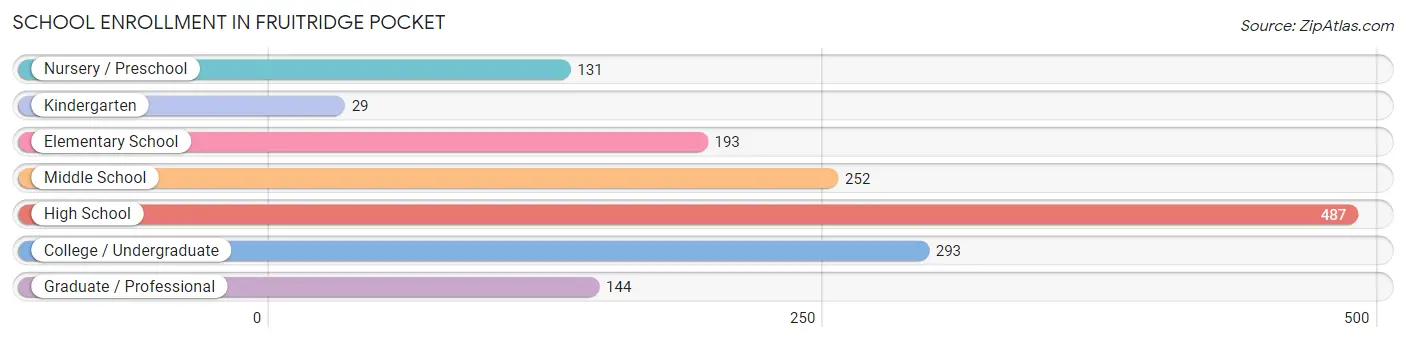
| School Level | # Students | % Students |
| Nursery / Preschool | 131 | 8.6% |
| Kindergarten | 29 | 1.9% |
| Elementary School | 193 | 12.6% |
| Middle School | 252 | 16.5% |
| High School | 487 | 31.9% |
| College / Undergraduate | 293 | 19.2% |
| Graduate / Professional | 144 | 9.4% |
| Total | 1,529 | 100.0% |
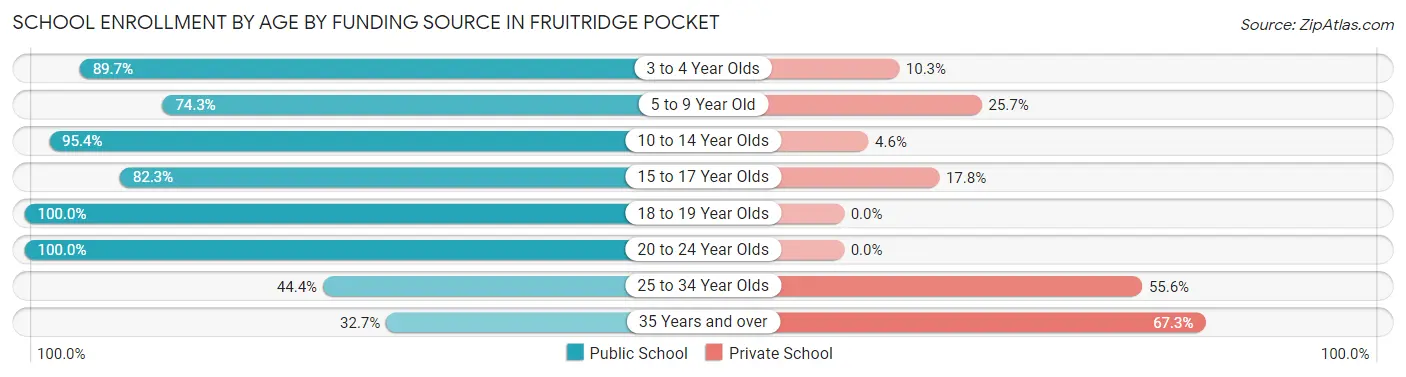
School Enrollment by Age by Funding Source in Fruitridge Pocket
Out of a total of 1,529 students who are enrolled in schools in Fruitridge Pocket, 350 (22.9%) attend a private institution, while the remaining 1,179 (77.1%) are enrolled in public schools. The age group of 35 years and over has the highest likelihood of being enrolled in private schools, with 134 (67.3% in the age bracket) enrolled. Conversely, the age group of 18 to 19 year olds has the lowest likelihood of being enrolled in a private school, with 7 (100.0% in the age bracket) attending a public institution.
| Age Bracket | Public School | Private School |
| 3 to 4 Year Olds | 96 (89.7%) | 11 (10.3%) |
| 5 to 9 Year Old | 165 (74.3%) | 57 (25.7%) |
| 10 to 14 Year Olds | 356 (95.4%) | 17 (4.6%) |
| 15 to 17 Year Olds | 329 (82.3%) | 71 (17.7%) |
| 18 to 19 Year Olds | 7 (100.0%) | 0 (0.0%) |
| 20 to 24 Year Olds | 113 (100.0%) | 0 (0.0%) |
| 25 to 34 Year Olds | 48 (44.4%) | 60 (55.6%) |
| 35 Years and over | 65 (32.7%) | 134 (67.3%) |
| Total | 1,179 (77.1%) | 350 (22.9%) |
Educational Attainment by Field of Study in Fruitridge Pocket
Arts & humanities (202 | 26.4%), social sciences (148 | 19.4%), business (139 | 18.2%), bio, nature & agricultural (61 | 8.0%), and science & technology (48 | 6.3%) are the most common fields of study among 764 individuals in Fruitridge Pocket who have obtained a bachelor's degree or higher.
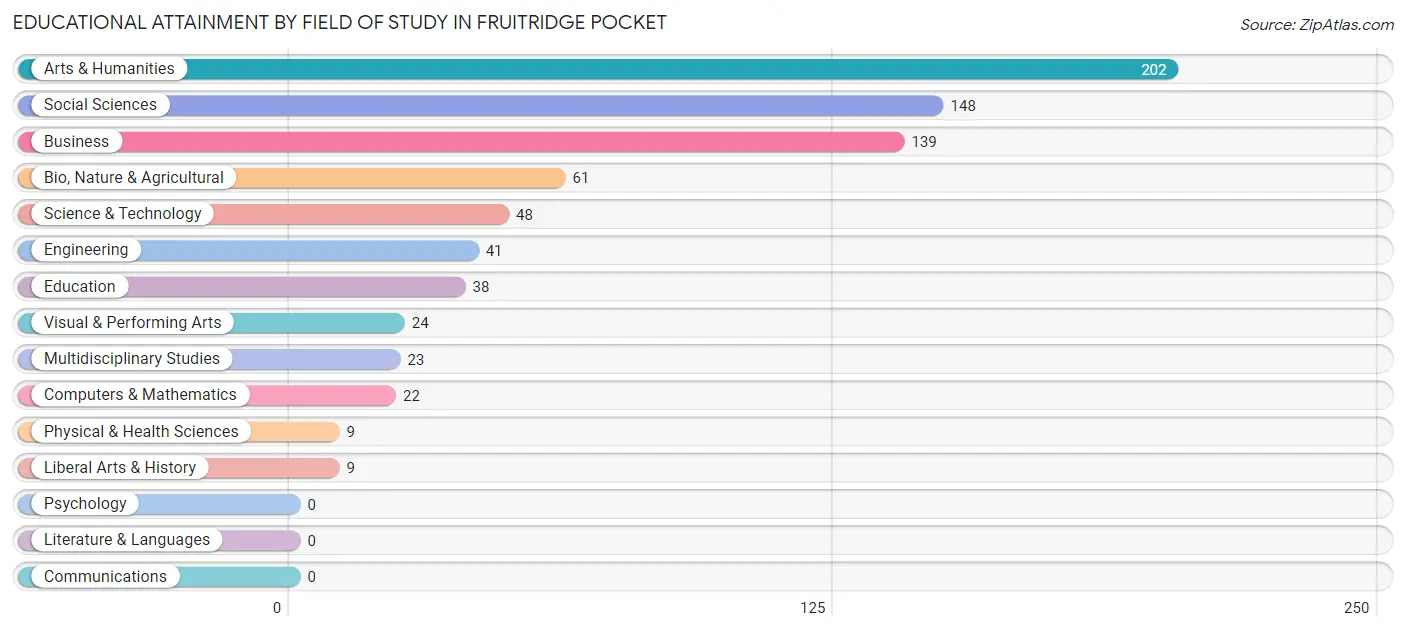
| Field of Study | # Graduates | % Graduates |
| Computers & Mathematics | 22 | 2.9% |
| Bio, Nature & Agricultural | 61 | 8.0% |
| Physical & Health Sciences | 9 | 1.2% |
| Psychology | 0 | 0.0% |
| Social Sciences | 148 | 19.4% |
| Engineering | 41 | 5.4% |
| Multidisciplinary Studies | 23 | 3.0% |
| Science & Technology | 48 | 6.3% |
| Business | 139 | 18.2% |
| Education | 38 | 5.0% |
| Literature & Languages | 0 | 0.0% |
| Liberal Arts & History | 9 | 1.2% |
| Visual & Performing Arts | 24 | 3.1% |
| Communications | 0 | 0.0% |
| Arts & Humanities | 202 | 26.4% |
| Total | 764 | 100.0% |
Transportation & Commute in Fruitridge Pocket
Vehicle Availability by Sex in Fruitridge Pocket
The most prevalent vehicle ownership categories in Fruitridge Pocket are males with 2 vehicles (441, accounting for 41.1%) and females with 2 vehicles (204, making up 52.4%).
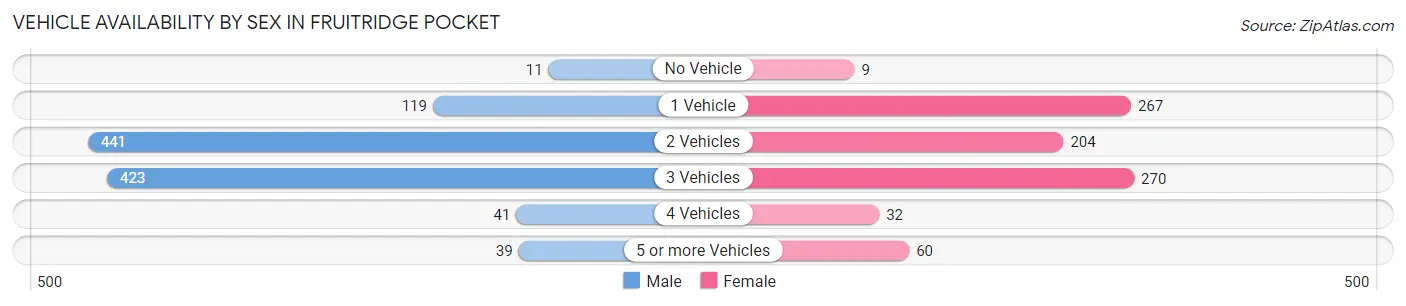
| Vehicles Available | Male | Female |
| No Vehicle | 11 (1.0%) | 9 (1.1%) |
| 1 Vehicle | 119 (11.1%) | 267 (31.7%) |
| 2 Vehicles | 441 (41.1%) | 204 (24.2%) |
| 3 Vehicles | 423 (39.4%) | 270 (32.1%) |
| 4 Vehicles | 41 (3.8%) | 32 (3.8%) |
| 5 or more Vehicles | 39 (3.6%) | 60 (7.1%) |
| Total | 1,074 (100.0%) | 842 (100.0%) |
Commute Time in Fruitridge Pocket
The most frequently occuring commute durations in Fruitridge Pocket are 20 to 24 minutes (326 commuters, 18.1%), 15 to 19 minutes (306 commuters, 17.0%), and 30 to 34 minutes (266 commuters, 14.7%).
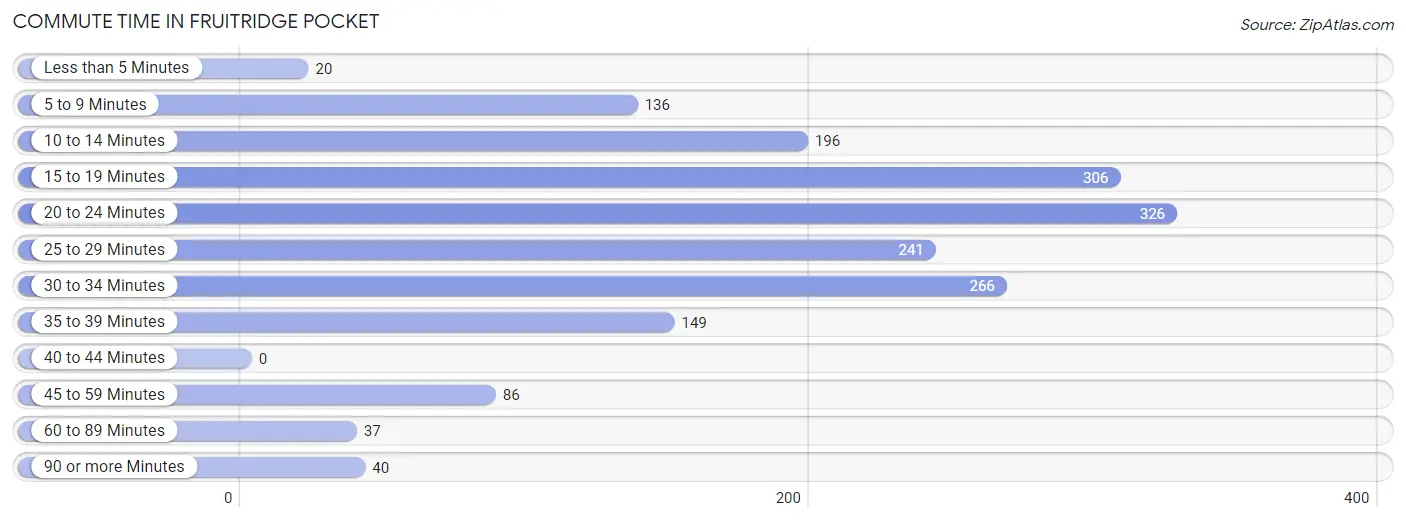
| Commute Time | # Commuters | % Commuters |
| Less than 5 Minutes | 20 | 1.1% |
| 5 to 9 Minutes | 136 | 7.5% |
| 10 to 14 Minutes | 196 | 10.9% |
| 15 to 19 Minutes | 306 | 17.0% |
| 20 to 24 Minutes | 326 | 18.1% |
| 25 to 29 Minutes | 241 | 13.4% |
| 30 to 34 Minutes | 266 | 14.7% |
| 35 to 39 Minutes | 149 | 8.3% |
| 40 to 44 Minutes | 0 | 0.0% |
| 45 to 59 Minutes | 86 | 4.8% |
| 60 to 89 Minutes | 37 | 2.1% |
| 90 or more Minutes | 40 | 2.2% |
Commute Time by Sex in Fruitridge Pocket
The most common commute times in Fruitridge Pocket are 25 to 29 minutes (205 commuters, 20.3%) for males and 20 to 24 minutes (222 commuters, 27.9%) for females.
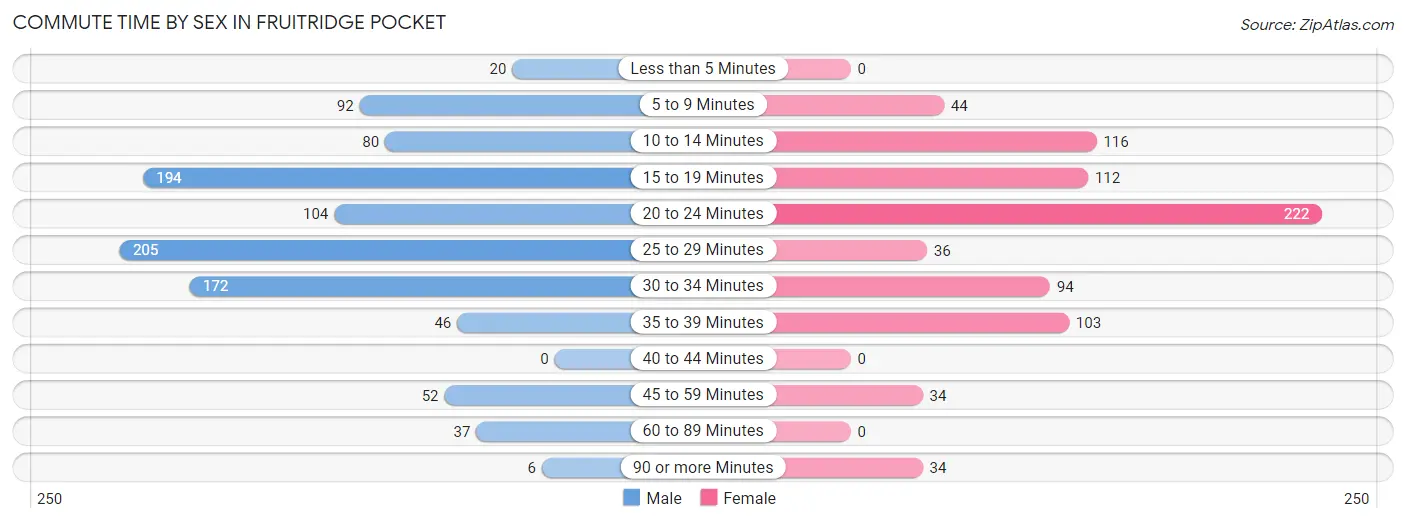
| Commute Time | Male | Female |
| Less than 5 Minutes | 20 (2.0%) | 0 (0.0%) |
| 5 to 9 Minutes | 92 (9.1%) | 44 (5.5%) |
| 10 to 14 Minutes | 80 (7.9%) | 116 (14.6%) |
| 15 to 19 Minutes | 194 (19.3%) | 112 (14.1%) |
| 20 to 24 Minutes | 104 (10.3%) | 222 (27.9%) |
| 25 to 29 Minutes | 205 (20.3%) | 36 (4.5%) |
| 30 to 34 Minutes | 172 (17.1%) | 94 (11.8%) |
| 35 to 39 Minutes | 46 (4.6%) | 103 (13.0%) |
| 40 to 44 Minutes | 0 (0.0%) | 0 (0.0%) |
| 45 to 59 Minutes | 52 (5.2%) | 34 (4.3%) |
| 60 to 89 Minutes | 37 (3.7%) | 0 (0.0%) |
| 90 or more Minutes | 6 (0.6%) | 34 (4.3%) |
Time of Departure to Work by Sex in Fruitridge Pocket
The most frequent times of departure to work in Fruitridge Pocket are 6:00 AM to 6:29 AM (188, 18.6%) for males and 4:00 PM to 11:59 PM (178, 22.4%) for females.
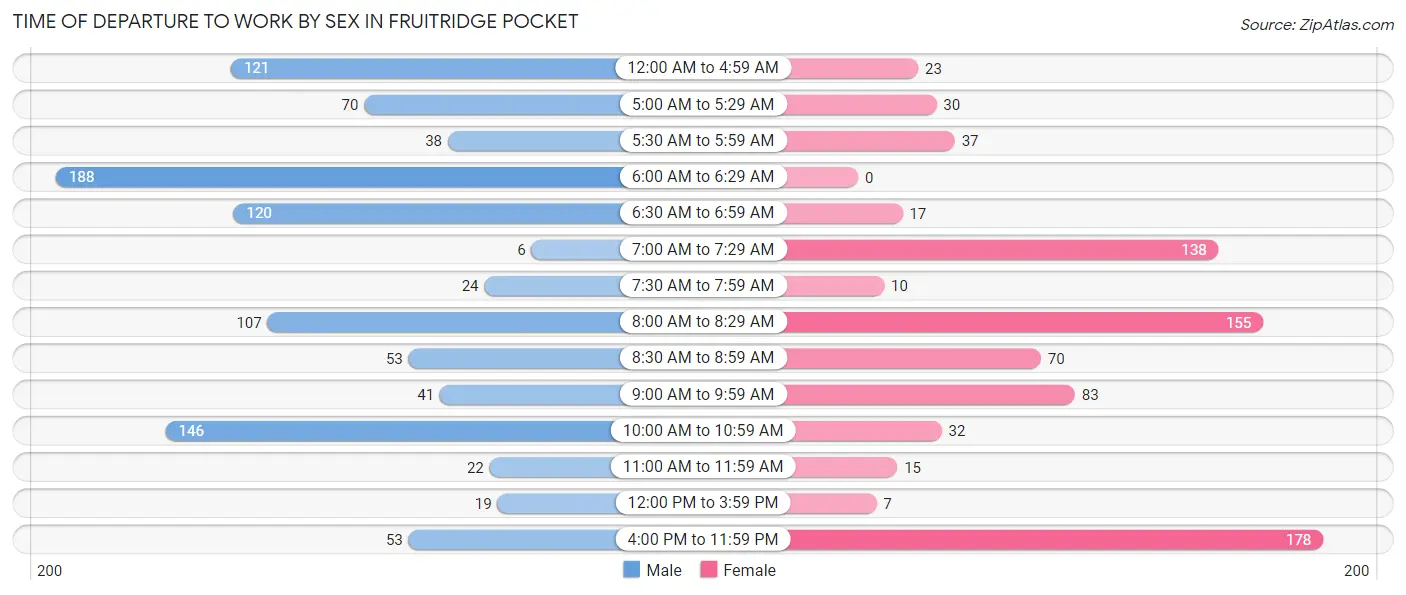
| Time of Departure | Male | Female |
| 12:00 AM to 4:59 AM | 121 (12.0%) | 23 (2.9%) |
| 5:00 AM to 5:29 AM | 70 (6.9%) | 30 (3.8%) |
| 5:30 AM to 5:59 AM | 38 (3.8%) | 37 (4.6%) |
| 6:00 AM to 6:29 AM | 188 (18.6%) | 0 (0.0%) |
| 6:30 AM to 6:59 AM | 120 (11.9%) | 17 (2.1%) |
| 7:00 AM to 7:29 AM | 6 (0.6%) | 138 (17.4%) |
| 7:30 AM to 7:59 AM | 24 (2.4%) | 10 (1.3%) |
| 8:00 AM to 8:29 AM | 107 (10.6%) | 155 (19.5%) |
| 8:30 AM to 8:59 AM | 53 (5.3%) | 70 (8.8%) |
| 9:00 AM to 9:59 AM | 41 (4.1%) | 83 (10.4%) |
| 10:00 AM to 10:59 AM | 146 (14.5%) | 32 (4.0%) |
| 11:00 AM to 11:59 AM | 22 (2.2%) | 15 (1.9%) |
| 12:00 PM to 3:59 PM | 19 (1.9%) | 7 (0.9%) |
| 4:00 PM to 11:59 PM | 53 (5.3%) | 178 (22.4%) |
| Total | 1,008 (100.0%) | 795 (100.0%) |
Housing Occupancy in Fruitridge Pocket
Occupancy by Ownership in Fruitridge Pocket
Of the total 1,788 dwellings in Fruitridge Pocket, owner-occupied units account for 913 (51.1%), while renter-occupied units make up 875 (48.9%).
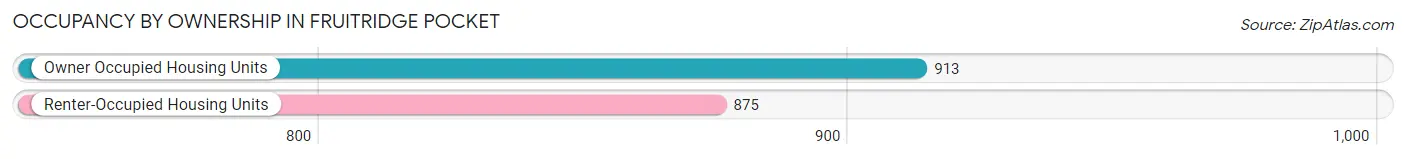
| Occupancy | # Housing Units | % Housing Units |
| Owner Occupied Housing Units | 913 | 51.1% |
| Renter-Occupied Housing Units | 875 | 48.9% |
| Total Occupied Housing Units | 1,788 | 100.0% |
Occupancy by Household Size in Fruitridge Pocket
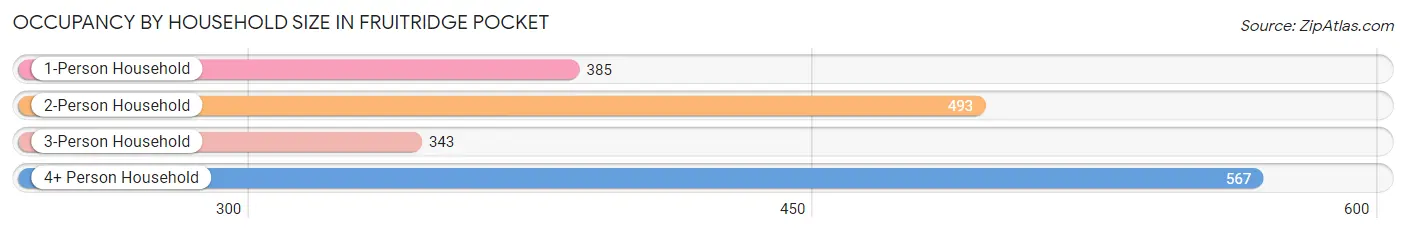
| Household Size | # Housing Units | % Housing Units |
| 1-Person Household | 385 | 21.5% |
| 2-Person Household | 493 | 27.6% |
| 3-Person Household | 343 | 19.2% |
| 4+ Person Household | 567 | 31.7% |
| Total Housing Units | 1,788 | 100.0% |
Occupancy by Ownership by Household Size in Fruitridge Pocket
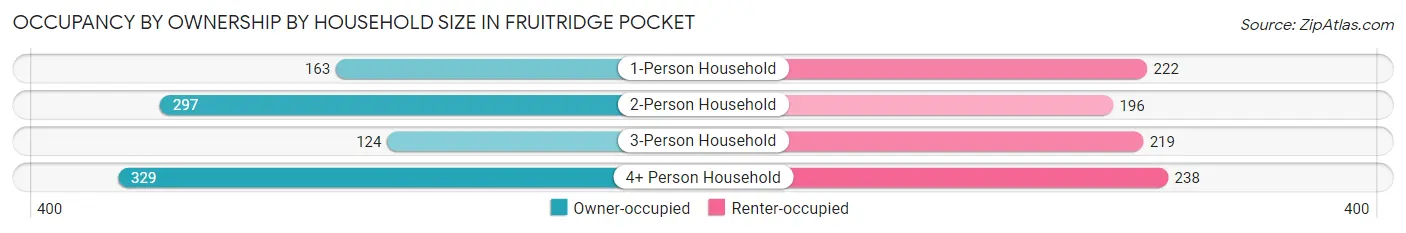
| Household Size | Owner-occupied | Renter-occupied |
| 1-Person Household | 163 (42.3%) | 222 (57.7%) |
| 2-Person Household | 297 (60.2%) | 196 (39.8%) |
| 3-Person Household | 124 (36.1%) | 219 (63.8%) |
| 4+ Person Household | 329 (58.0%) | 238 (42.0%) |
| Total Housing Units | 913 (51.1%) | 875 (48.9%) |
Occupancy by Educational Attainment in Fruitridge Pocket
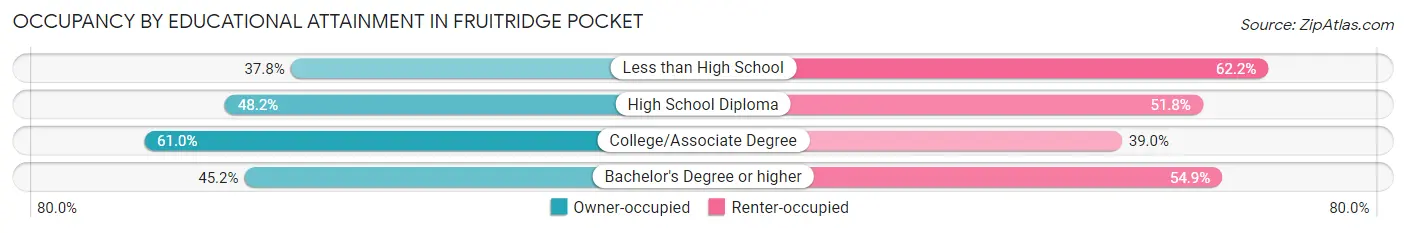
| Household Size | Owner-occupied | Renter-occupied |
| Less than High School | 115 (37.8%) | 189 (62.2%) |
| High School Diploma | 190 (48.2%) | 204 (51.8%) |
| College/Associate Degree | 445 (61.0%) | 284 (39.0%) |
| Bachelor's Degree or higher | 163 (45.2%) | 198 (54.8%) |
Occupancy by Age of Householder in Fruitridge Pocket
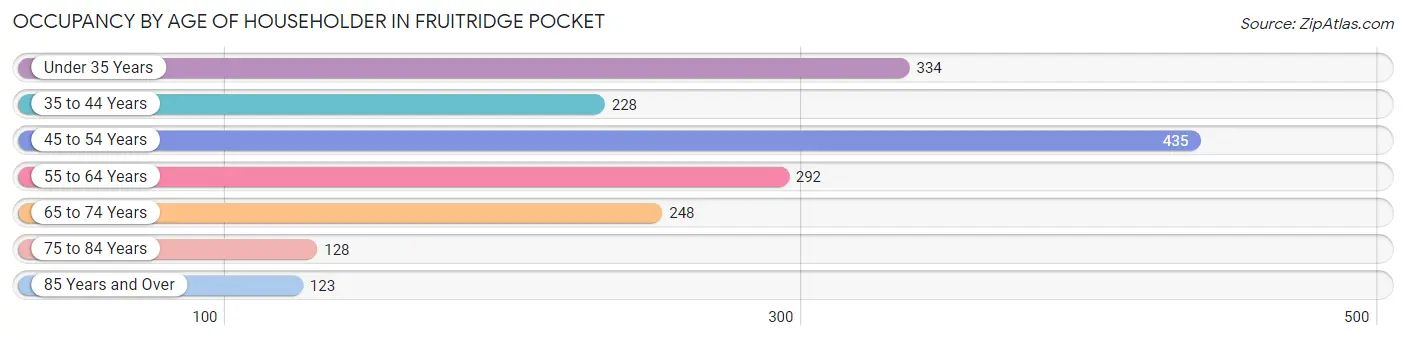
| Age Bracket | # Households | % Households |
| Under 35 Years | 334 | 18.7% |
| 35 to 44 Years | 228 | 12.8% |
| 45 to 54 Years | 435 | 24.3% |
| 55 to 64 Years | 292 | 16.3% |
| 65 to 74 Years | 248 | 13.9% |
| 75 to 84 Years | 128 | 7.2% |
| 85 Years and Over | 123 | 6.9% |
| Total | 1,788 | 100.0% |
Housing Finances in Fruitridge Pocket
Median Income by Occupancy in Fruitridge Pocket
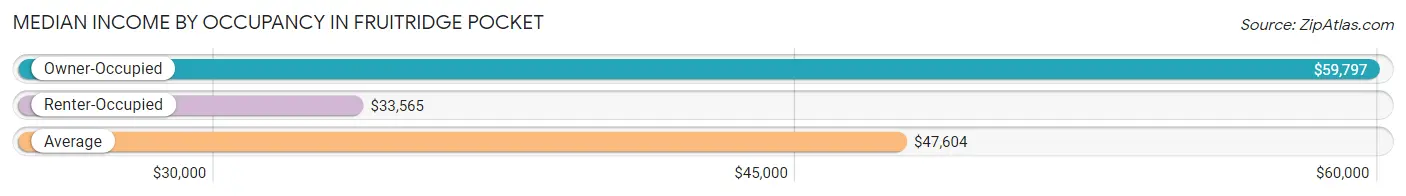
| Occupancy Type | # Households | Median Income |
| Owner-Occupied | 913 (51.1%) | $59,797 |
| Renter-Occupied | 875 (48.9%) | $33,565 |
| Average | 1,788 (100.0%) | $47,604 |
Occupancy by Householder Income Bracket in Fruitridge Pocket
| Income Bracket | Owner-occupied | Renter-occupied |
| Less than $5,000 | 45 (4.9%) | 90 (10.3%) |
| $5,000 to $9,999 | 21 (2.3%) | 30 (3.4%) |
| $10,000 to $14,999 | 44 (4.8%) | 156 (17.8%) |
| $15,000 to $19,999 | 40 (4.4%) | 7 (0.8%) |
| $20,000 to $24,999 | 33 (3.6%) | 4 (0.5%) |
| $25,000 to $34,999 | 108 (11.8%) | 166 (19.0%) |
| $35,000 to $49,999 | 43 (4.7%) | 130 (14.9%) |
| $50,000 to $74,999 | 198 (21.7%) | 97 (11.1%) |
| $75,000 to $99,999 | 180 (19.7%) | 103 (11.8%) |
| $100,000 to $149,999 | 134 (14.7%) | 92 (10.5%) |
| $150,000 or more | 67 (7.3%) | 0 (0.0%) |
| Total | 913 (100.0%) | 875 (100.0%) |
Monthly Housing Cost Tiers in Fruitridge Pocket
| Monthly Cost | Owner-occupied | Renter-occupied |
| Less than $300 | 91 (10.0%) | 57 (6.5%) |
| $300 to $499 | 130 (14.2%) | 11 (1.3%) |
| $500 to $799 | 137 (15.0%) | 100 (11.4%) |
| $800 to $999 | 49 (5.4%) | 116 (13.3%) |
| $1,000 to $1,499 | 222 (24.3%) | 227 (25.9%) |
| $1,500 to $1,999 | 209 (22.9%) | 183 (20.9%) |
| $2,000 to $2,499 | 18 (2.0%) | 61 (7.0%) |
| $2,500 to $2,999 | 9 (1.0%) | 0 (0.0%) |
| $3,000 or more | 48 (5.3%) | 17 (1.9%) |
| Total | 913 (100.0%) | 875 (100.0%) |
Physical Housing Characteristics in Fruitridge Pocket
Housing Structures in Fruitridge Pocket
| Structure Type | # Housing Units | % Housing Units |
| Single Unit, Detached | 1,491 | 83.4% |
| Single Unit, Attached | 59 | 3.3% |
| 2 Unit Apartments | 14 | 0.8% |
| 3 or 4 Unit Apartments | 81 | 4.5% |
| 5 to 9 Unit Apartments | 29 | 1.6% |
| 10 or more Apartments | 94 | 5.3% |
| Mobile Home / Other | 20 | 1.1% |
| Total | 1,788 | 100.0% |
Housing Structures by Occupancy in Fruitridge Pocket
| Structure Type | Owner-occupied | Renter-occupied |
| Single Unit, Detached | 860 (57.7%) | 631 (42.3%) |
| Single Unit, Attached | 11 (18.6%) | 48 (81.4%) |
| 2 Unit Apartments | 3 (21.4%) | 11 (78.6%) |
| 3 or 4 Unit Apartments | 0 (0.0%) | 81 (100.0%) |
| 5 to 9 Unit Apartments | 0 (0.0%) | 29 (100.0%) |
| 10 or more Apartments | 39 (41.5%) | 55 (58.5%) |
| Mobile Home / Other | 0 (0.0%) | 20 (100.0%) |
| Total | 913 (51.1%) | 875 (48.9%) |
Housing Structures by Number of Rooms in Fruitridge Pocket
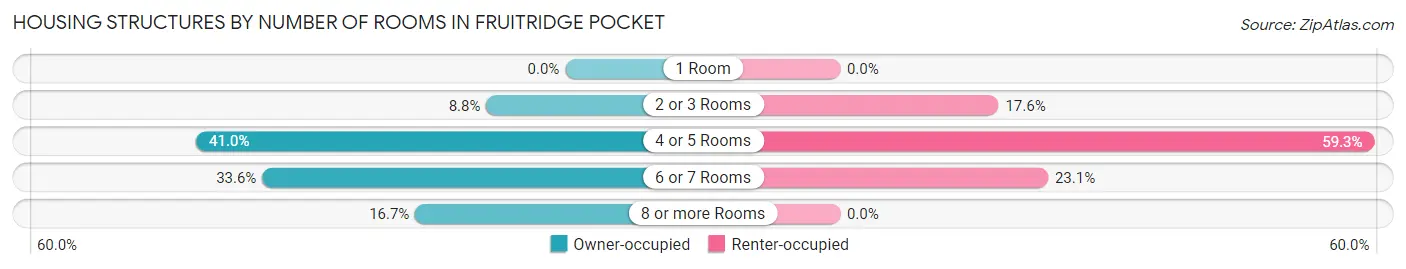
| Number of Rooms | Owner-occupied | Renter-occupied |
| 1 Room | 0 (0.0%) | 0 (0.0%) |
| 2 or 3 Rooms | 80 (8.8%) | 154 (17.6%) |
| 4 or 5 Rooms | 374 (41.0%) | 519 (59.3%) |
| 6 or 7 Rooms | 307 (33.6%) | 202 (23.1%) |
| 8 or more Rooms | 152 (16.7%) | 0 (0.0%) |
| Total | 913 (100.0%) | 875 (100.0%) |
Housing Structure by Heating Type in Fruitridge Pocket
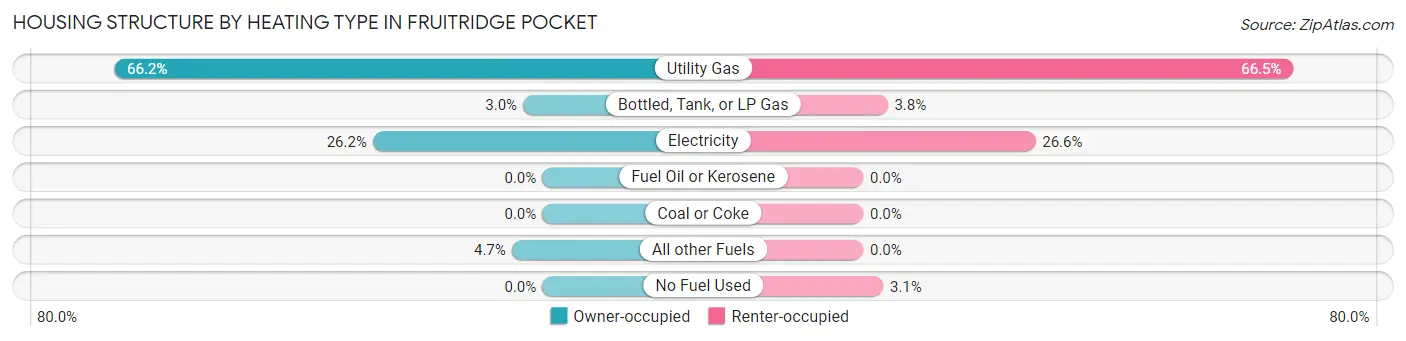
| Heating Type | Owner-occupied | Renter-occupied |
| Utility Gas | 604 (66.2%) | 582 (66.5%) |
| Bottled, Tank, or LP Gas | 27 (3.0%) | 33 (3.8%) |
| Electricity | 239 (26.2%) | 233 (26.6%) |
| Fuel Oil or Kerosene | 0 (0.0%) | 0 (0.0%) |
| Coal or Coke | 0 (0.0%) | 0 (0.0%) |
| All other Fuels | 43 (4.7%) | 0 (0.0%) |
| No Fuel Used | 0 (0.0%) | 27 (3.1%) |
| Total | 913 (100.0%) | 875 (100.0%) |
Household Vehicle Usage in Fruitridge Pocket
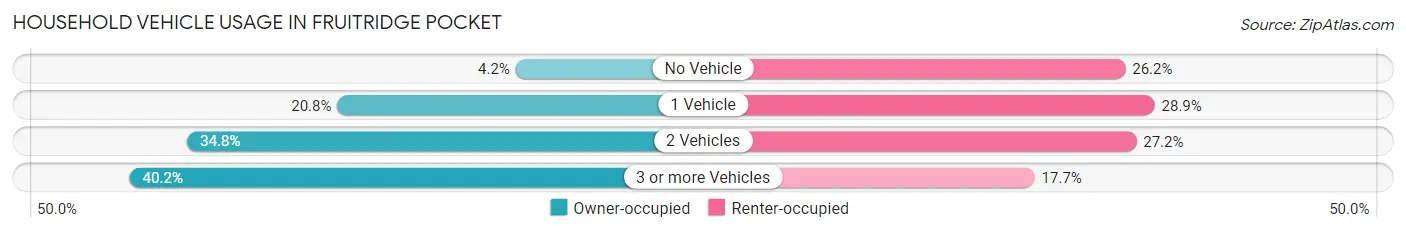
| Vehicles per Household | Owner-occupied | Renter-occupied |
| No Vehicle | 38 (4.2%) | 229 (26.2%) |
| 1 Vehicle | 190 (20.8%) | 253 (28.9%) |
| 2 Vehicles | 318 (34.8%) | 238 (27.2%) |
| 3 or more Vehicles | 367 (40.2%) | 155 (17.7%) |
| Total | 913 (100.0%) | 875 (100.0%) |
Real Estate & Mortgages in Fruitridge Pocket
Real Estate and Mortgage Overview in Fruitridge Pocket
| Characteristic | Without Mortgage | With Mortgage |
| Housing Units | 394 | 519 |
| Median Property Value | $334,900 | $283,800 |
| Median Household Income | - | - |
| Monthly Housing Costs | $486 | $48 |
| Real Estate Taxes | $3,039 | $0 |
Property Value by Mortgage Status in Fruitridge Pocket
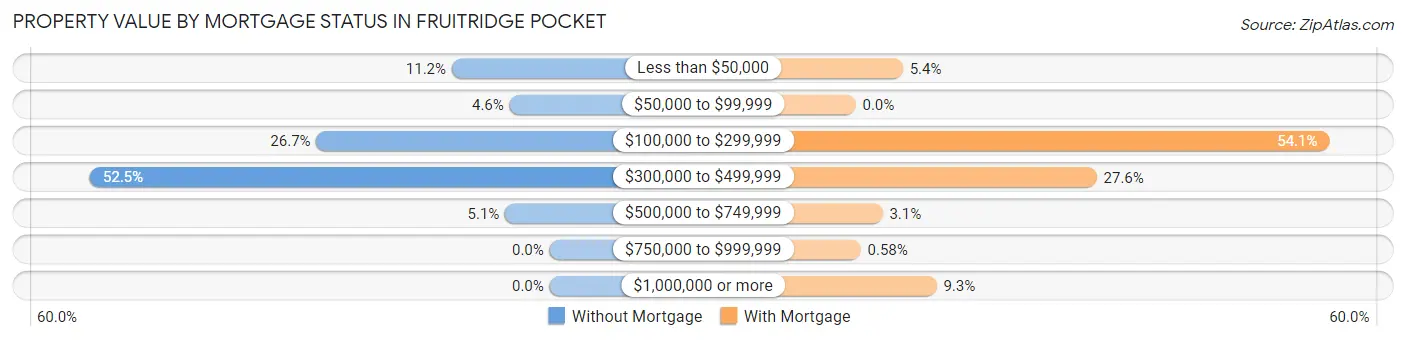
| Property Value | Without Mortgage | With Mortgage |
| Less than $50,000 | 44 (11.2%) | 28 (5.4%) |
| $50,000 to $99,999 | 18 (4.6%) | 0 (0.0%) |
| $100,000 to $299,999 | 105 (26.7%) | 281 (54.1%) |
| $300,000 to $499,999 | 207 (52.5%) | 143 (27.6%) |
| $500,000 to $749,999 | 20 (5.1%) | 16 (3.1%) |
| $750,000 to $999,999 | 0 (0.0%) | 3 (0.6%) |
| $1,000,000 or more | 0 (0.0%) | 48 (9.2%) |
| Total | 394 (100.0%) | 519 (100.0%) |
Household Income by Mortgage Status in Fruitridge Pocket
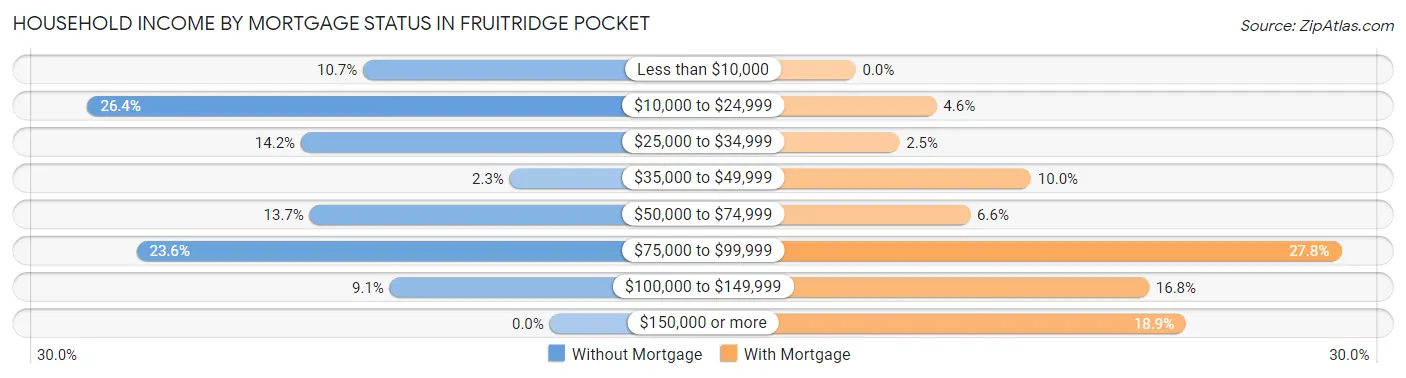
| Household Income | Without Mortgage | With Mortgage |
| Less than $10,000 | 42 (10.7%) | 0 (0.0%) |
| $10,000 to $24,999 | 104 (26.4%) | 24 (4.6%) |
| $25,000 to $34,999 | 56 (14.2%) | 13 (2.5%) |
| $35,000 to $49,999 | 9 (2.3%) | 52 (10.0%) |
| $50,000 to $74,999 | 54 (13.7%) | 34 (6.6%) |
| $75,000 to $99,999 | 93 (23.6%) | 144 (27.8%) |
| $100,000 to $149,999 | 36 (9.1%) | 87 (16.8%) |
| $150,000 or more | 0 (0.0%) | 98 (18.9%) |
| Total | 394 (100.0%) | 519 (100.0%) |
Property Value to Household Income Ratio in Fruitridge Pocket
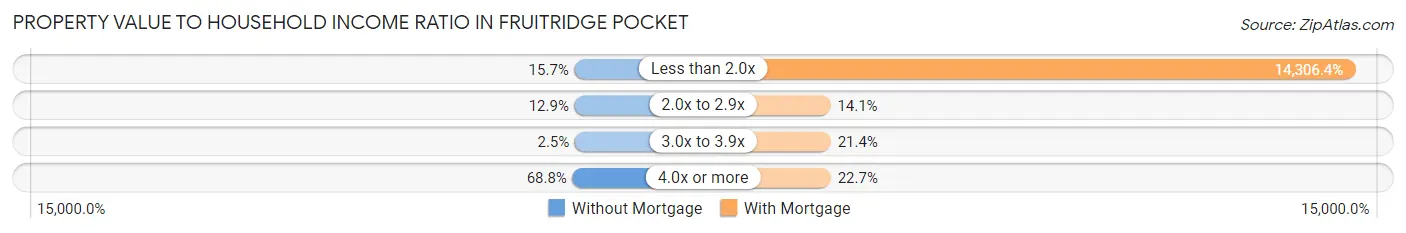
| Value-to-Income Ratio | Without Mortgage | With Mortgage |
| Less than 2.0x | 62 (15.7%) | 74,250 (14,306.4%) |
| 2.0x to 2.9x | 51 (12.9%) | 73 (14.1%) |
| 3.0x to 3.9x | 10 (2.5%) | 111 (21.4%) |
| 4.0x or more | 271 (68.8%) | 118 (22.7%) |
| Total | 394 (100.0%) | 519 (100.0%) |
Real Estate Taxes by Mortgage Status in Fruitridge Pocket
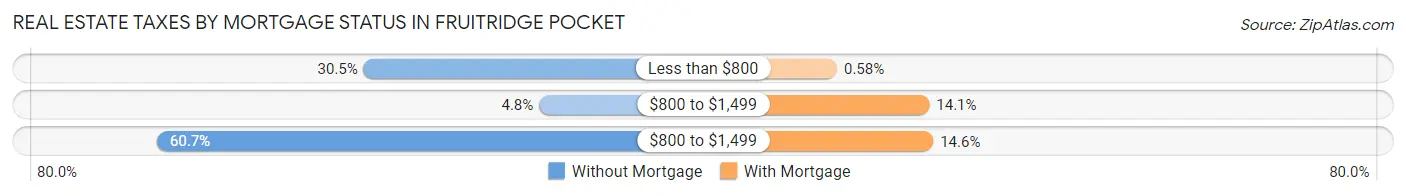
| Property Taxes | Without Mortgage | With Mortgage |
| Less than $800 | 120 (30.5%) | 3 (0.6%) |
| $800 to $1,499 | 19 (4.8%) | 73 (14.1%) |
| $800 to $1,499 | 239 (60.7%) | 76 (14.6%) |
| Total | 394 (100.0%) | 519 (100.0%) |
Health & Disability in Fruitridge Pocket
Health Insurance Coverage by Age in Fruitridge Pocket
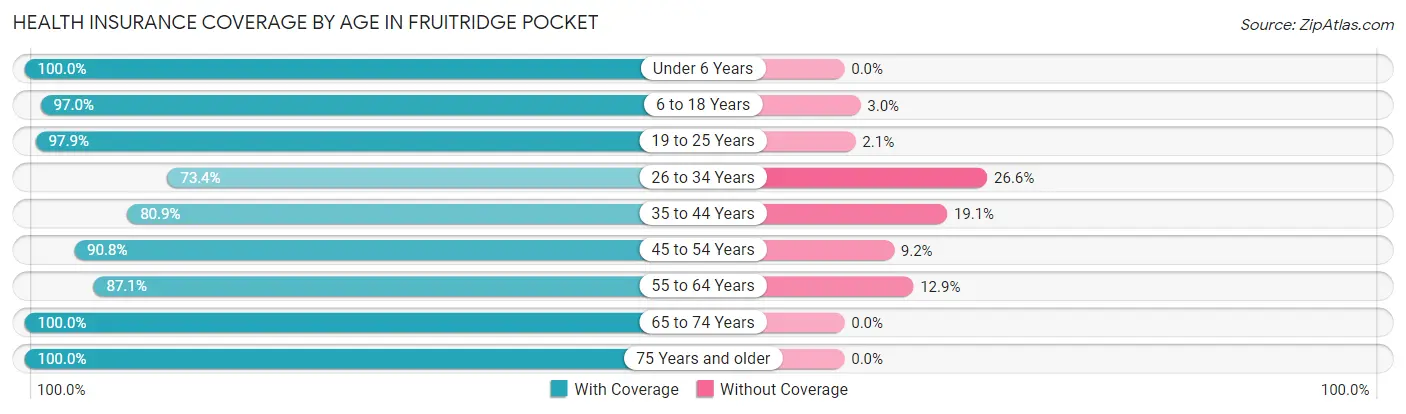
| Age Bracket | With Coverage | Without Coverage |
| Under 6 Years | 461 (100.0%) | 0 (0.0%) |
| 6 to 18 Years | 937 (97.0%) | 29 (3.0%) |
| 19 to 25 Years | 473 (97.9%) | 10 (2.1%) |
| 26 to 34 Years | 653 (73.4%) | 237 (26.6%) |
| 35 to 44 Years | 435 (80.9%) | 103 (19.1%) |
| 45 to 54 Years | 648 (90.8%) | 66 (9.2%) |
| 55 to 64 Years | 637 (87.1%) | 94 (12.9%) |
| 65 to 74 Years | 383 (100.0%) | 0 (0.0%) |
| 75 Years and older | 430 (100.0%) | 0 (0.0%) |
| Total | 5,057 (90.4%) | 539 (9.6%) |
Health Insurance Coverage by Citizenship Status in Fruitridge Pocket
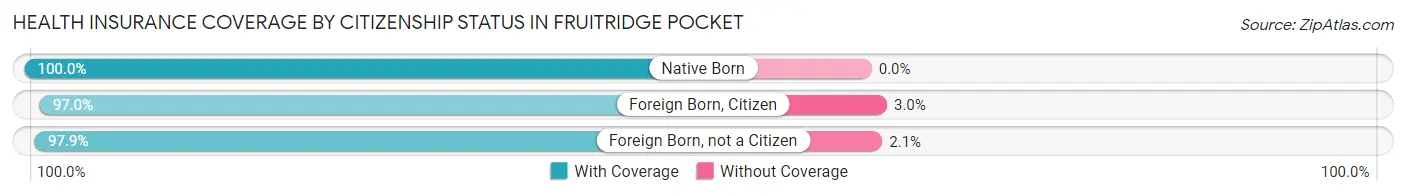
| Citizenship Status | With Coverage | Without Coverage |
| Native Born | 461 (100.0%) | 0 (0.0%) |
| Foreign Born, Citizen | 937 (97.0%) | 29 (3.0%) |
| Foreign Born, not a Citizen | 473 (97.9%) | 10 (2.1%) |
Health Insurance Coverage by Household Income in Fruitridge Pocket
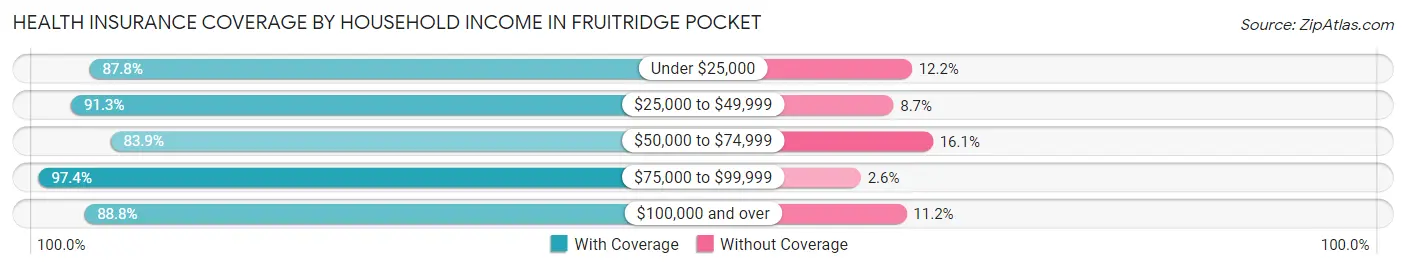
| Household Income | With Coverage | Without Coverage |
| Under $25,000 | 968 (87.8%) | 134 (12.2%) |
| $25,000 to $49,999 | 1,206 (91.3%) | 115 (8.7%) |
| $50,000 to $74,999 | 740 (83.9%) | 142 (16.1%) |
| $75,000 to $99,999 | 970 (97.4%) | 26 (2.6%) |
| $100,000 and over | 883 (88.8%) | 111 (11.2%) |
Public vs Private Health Insurance Coverage by Age in Fruitridge Pocket
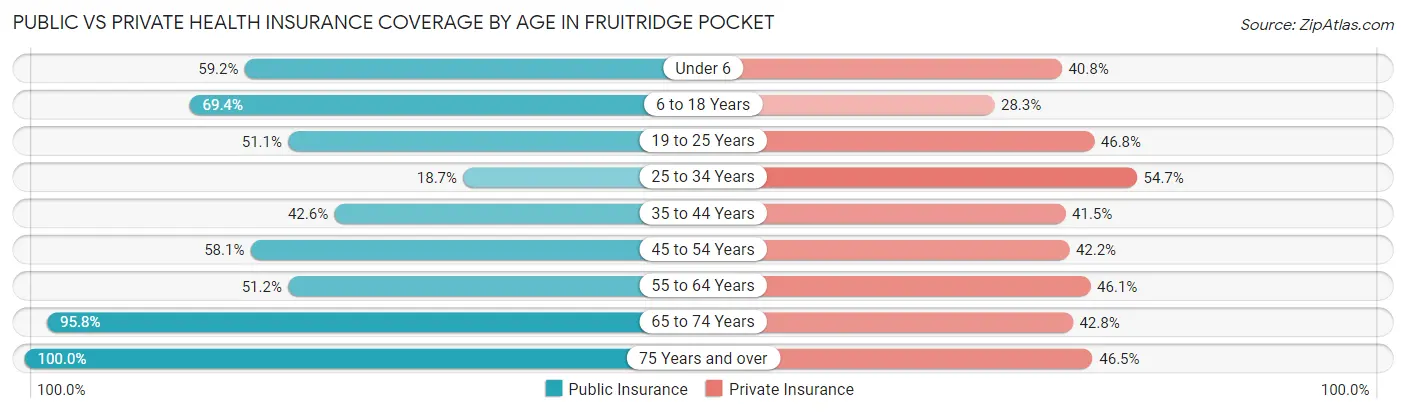
| Age Bracket | Public Insurance | Private Insurance |
| Under 6 | 273 (59.2%) | 188 (40.8%) |
| 6 to 18 Years | 670 (69.4%) | 273 (28.3%) |
| 19 to 25 Years | 247 (51.1%) | 226 (46.8%) |
| 25 to 34 Years | 166 (18.6%) | 487 (54.7%) |
| 35 to 44 Years | 229 (42.6%) | 223 (41.4%) |
| 45 to 54 Years | 415 (58.1%) | 301 (42.2%) |
| 55 to 64 Years | 374 (51.2%) | 337 (46.1%) |
| 65 to 74 Years | 367 (95.8%) | 164 (42.8%) |
| 75 Years and over | 430 (100.0%) | 200 (46.5%) |
| Total | 3,171 (56.7%) | 2,399 (42.9%) |
Disability Status by Sex by Age in Fruitridge Pocket
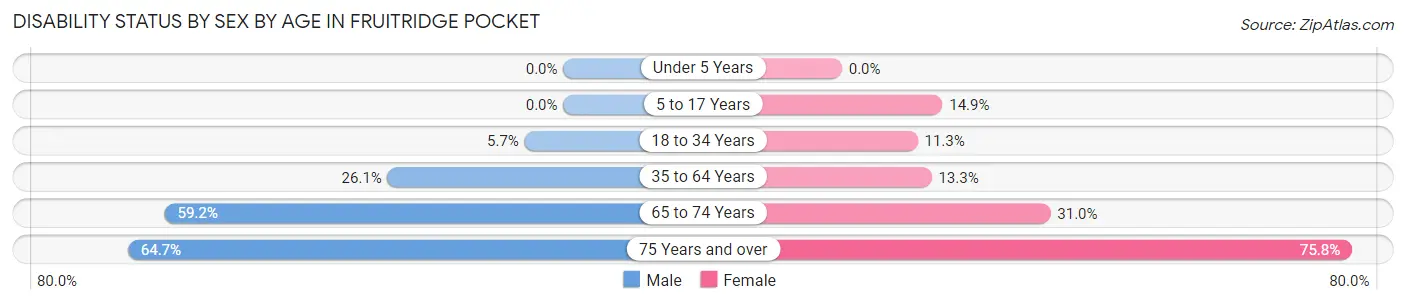
| Age Bracket | Male | Female |
| Under 5 Years | 0 (0.0%) | 0 (0.0%) |
| 5 to 17 Years | 0 (0.0%) | 71 (14.9%) |
| 18 to 34 Years | 46 (5.7%) | 65 (11.3%) |
| 35 to 64 Years | 204 (26.1%) | 160 (13.3%) |
| 65 to 74 Years | 135 (59.2%) | 48 (31.0%) |
| 75 Years and over | 150 (64.7%) | 150 (75.8%) |
Disability Class by Sex by Age in Fruitridge Pocket
Disability Class: Hearing Difficulty
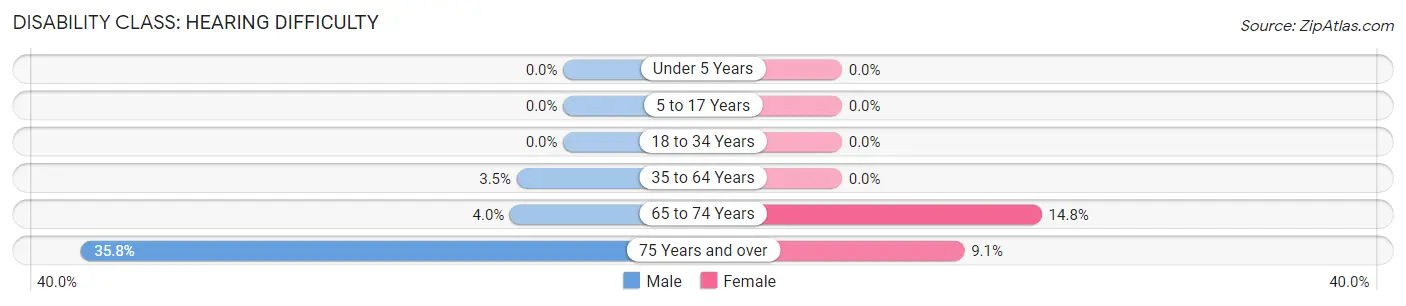
| Age Bracket | Male | Female |
| Under 5 Years | 0 (0.0%) | 0 (0.0%) |
| 5 to 17 Years | 0 (0.0%) | 0 (0.0%) |
| 18 to 34 Years | 0 (0.0%) | 0 (0.0%) |
| 35 to 64 Years | 27 (3.5%) | 0 (0.0%) |
| 65 to 74 Years | 9 (4.0%) | 23 (14.8%) |
| 75 Years and over | 83 (35.8%) | 18 (9.1%) |
Disability Class: Vision Difficulty
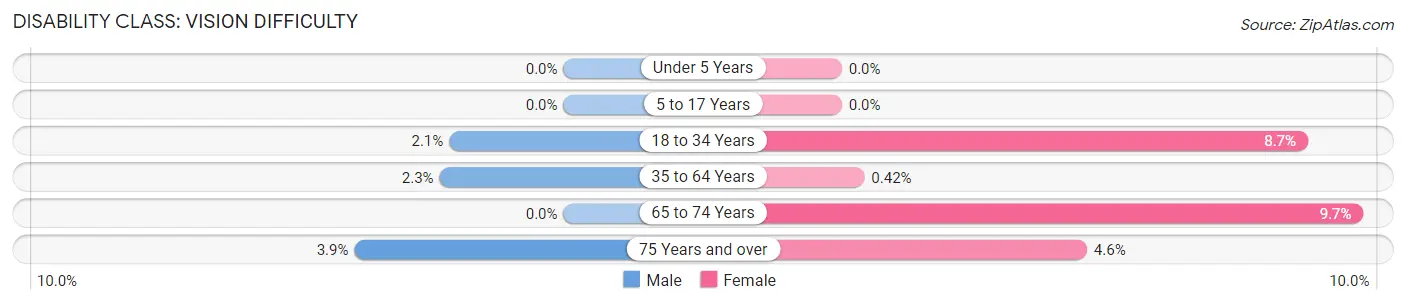
| Age Bracket | Male | Female |
| Under 5 Years | 0 (0.0%) | 0 (0.0%) |
| 5 to 17 Years | 0 (0.0%) | 0 (0.0%) |
| 18 to 34 Years | 17 (2.1%) | 50 (8.6%) |
| 35 to 64 Years | 18 (2.3%) | 5 (0.4%) |
| 65 to 74 Years | 0 (0.0%) | 15 (9.7%) |
| 75 Years and over | 9 (3.9%) | 9 (4.5%) |
Disability Class: Cognitive Difficulty
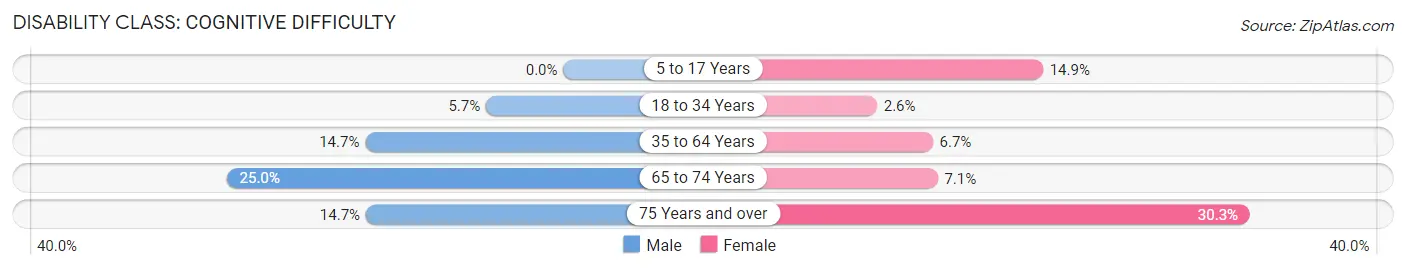
| Age Bracket | Male | Female |
| 5 to 17 Years | 0 (0.0%) | 71 (14.9%) |
| 18 to 34 Years | 46 (5.7%) | 15 (2.6%) |
| 35 to 64 Years | 115 (14.7%) | 81 (6.7%) |
| 65 to 74 Years | 57 (25.0%) | 11 (7.1%) |
| 75 Years and over | 34 (14.7%) | 60 (30.3%) |
Disability Class: Ambulatory Difficulty
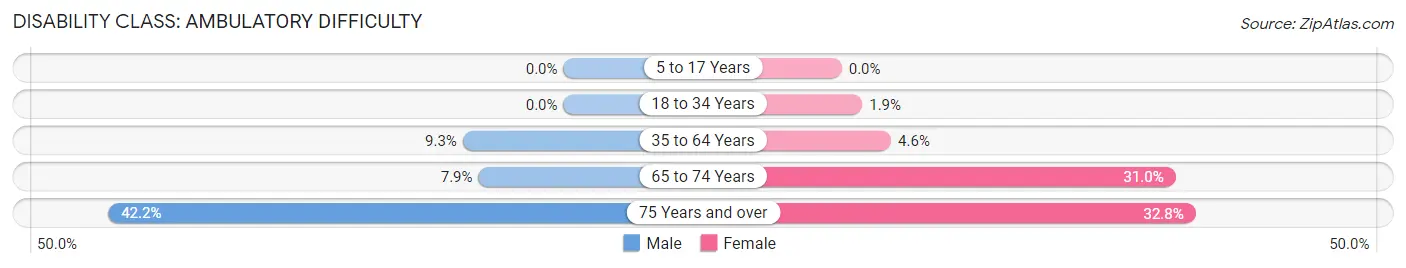
| Age Bracket | Male | Female |
| 5 to 17 Years | 0 (0.0%) | 0 (0.0%) |
| 18 to 34 Years | 0 (0.0%) | 11 (1.9%) |
| 35 to 64 Years | 73 (9.3%) | 55 (4.6%) |
| 65 to 74 Years | 18 (7.9%) | 48 (31.0%) |
| 75 Years and over | 98 (42.2%) | 65 (32.8%) |
Disability Class: Self-Care Difficulty
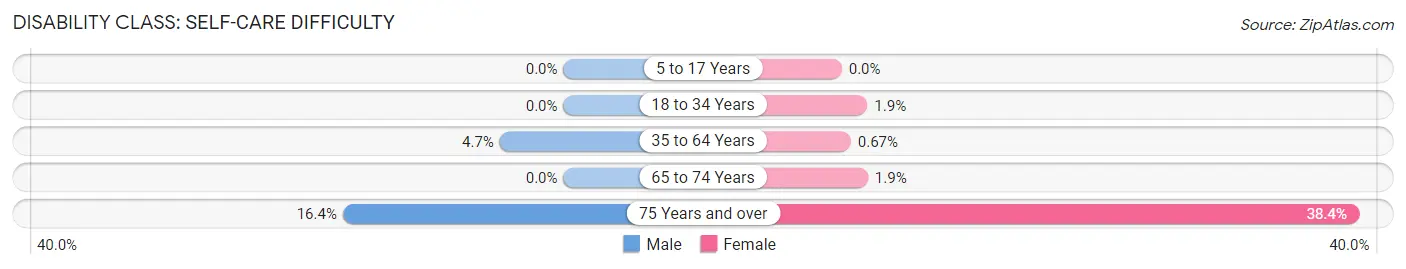
| Age Bracket | Male | Female |
| 5 to 17 Years | 0 (0.0%) | 0 (0.0%) |
| 18 to 34 Years | 0 (0.0%) | 11 (1.9%) |
| 35 to 64 Years | 37 (4.7%) | 8 (0.7%) |
| 65 to 74 Years | 0 (0.0%) | 3 (1.9%) |
| 75 Years and over | 38 (16.4%) | 76 (38.4%) |
Technology Access in Fruitridge Pocket
Computing Device Access in Fruitridge Pocket
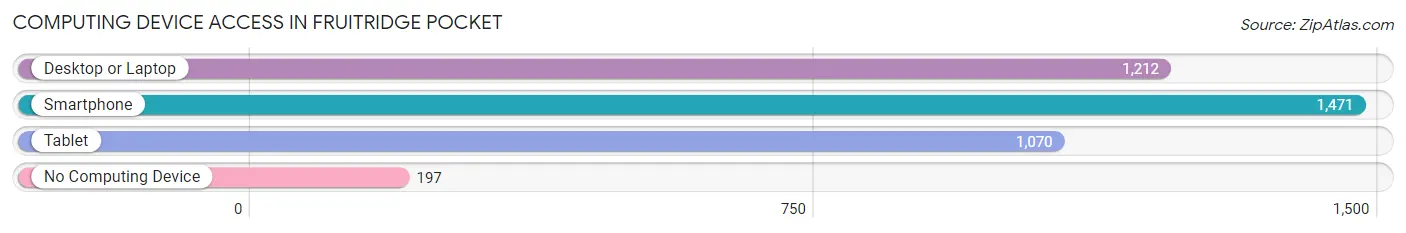
| Device Type | # Households | % Households |
| Desktop or Laptop | 1,212 | 67.8% |
| Smartphone | 1,471 | 82.3% |
| Tablet | 1,070 | 59.8% |
| No Computing Device | 197 | 11.0% |
| Total | 1,788 | 100.0% |
Internet Access in Fruitridge Pocket
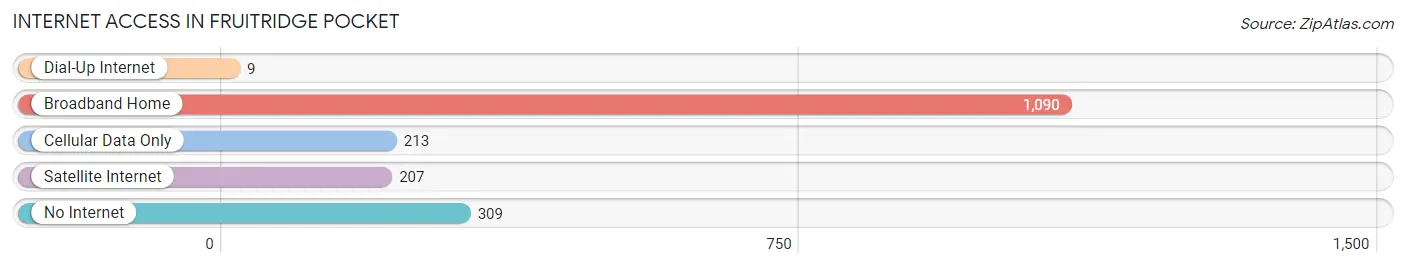
| Internet Type | # Households | % Households |
| Dial-Up Internet | 9 | 0.5% |
| Broadband Home | 1,090 | 61.0% |
| Cellular Data Only | 213 | 11.9% |
| Satellite Internet | 207 | 11.6% |
| No Internet | 309 | 17.3% |
| Total | 1,788 | 100.0% |
Fruitridge Pocket Summary
Fruitridge Pocket is a census-designated place (CDP) located in Sacramento County, California. It is situated in the southeastern part of the county, approximately 8 miles south of downtown Sacramento. The population of Fruitridge Pocket was 8,845 at the 2010 census.
Geography
Fruitridge Pocket is located at 38°30'25" North, 121°22'45" West (38.506944, -121.379167). It has an area of 1.7 square miles, all of which is land. The terrain is generally flat, with some rolling hills. The area is bordered by the cities of Sacramento, Galt, and Elk Grove.
History
Fruitridge Pocket was originally inhabited by the Nisenan Native Americans. The area was first settled by Europeans in the mid-1800s, when it was part of the Rancho Rio de los Americanos land grant. The area was known as Fruitridge because of the abundance of fruit trees in the area. The Pocket portion of the name was added in the 1950s when the area was annexed by the City of Sacramento.
Economy
Fruitridge Pocket is primarily a residential area, with most of its residents commuting to nearby cities for work. The area is home to several small businesses, including restaurants, convenience stores, and auto repair shops. The area is also home to a number of churches and schools.
Demographics
As of the 2010 census, Fruitridge Pocket had a population of 8,845. The racial makeup of the area was 57.3% White, 16.2% African American, 0.7% Native American, 11.2% Asian, 0.3% Pacific Islander, 10.2% from other races, and 4.2% from two or more races. Hispanic or Latino of any race were 24.3% of the population.
The median household income in Fruitridge Pocket was $45,945, and the median family income was $50,945. The per capita income was $20,945. About 16.2% of families and 19.2% of the population were below the poverty line, including 28.2% of those under age 18 and 8.2% of those age 65 or over.
Conclusion
Fruitridge Pocket is a census-designated place located in Sacramento County, California. It is situated in the southeastern part of the county, approximately 8 miles south of downtown Sacramento. The population of Fruitridge Pocket was 8,845 at the 2010 census. The area is primarily residential, with most of its residents commuting to nearby cities for work. The racial makeup of the area was 57.3% White, 16.2% African American, 0.7% Native American, 11.2% Asian, 0.3% Pacific Islander, 10.2% from other races, and 4.2% from two or more races. The median household income in Fruitridge Pocket was $45,945, and the median family income was $50,945. The per capita income was $20,945. About 16.2% of families and 19.2% of the population were below the poverty line.
Common Questions
What is Per Capita Income in Fruitridge Pocket?
Per Capita income in Fruitridge Pocket is $19,854.
What is the Median Family Income in Fruitridge Pocket?
Median Family Income in Fruitridge Pocket is $55,188.
What is the Median Household income in Fruitridge Pocket?
Median Household Income in Fruitridge Pocket is $47,604.
What is Income or Wage Gap in Fruitridge Pocket?
Income or Wage Gap in Fruitridge Pocket is 13.3%.
Women in Fruitridge Pocket earn 86.7 cents for every dollar earned by a man.
What is Inequality or Gini Index in Fruitridge Pocket?
Inequality or Gini Index in Fruitridge Pocket is 0.44.
What is the Total Population of Fruitridge Pocket?
Total Population of Fruitridge Pocket is 5,596.
What is the Total Male Population of Fruitridge Pocket?
Total Male Population of Fruitridge Pocket is 2,851.
What is the Total Female Population of Fruitridge Pocket?
Total Female Population of Fruitridge Pocket is 2,745.
What is the Ratio of Males per 100 Females in Fruitridge Pocket?
There are 103.86 Males per 100 Females in Fruitridge Pocket.
What is the Ratio of Females per 100 Males in Fruitridge Pocket?
There are 96.28 Females per 100 Males in Fruitridge Pocket.
What is the Median Population Age in Fruitridge Pocket?
Median Population Age in Fruitridge Pocket is 34.8 Years.
What is the Average Family Size in Fruitridge Pocket
Average Family Size in Fruitridge Pocket is 3.3 People.
What is the Average Household Size in Fruitridge Pocket
Average Household Size in Fruitridge Pocket is 3.0 People.
How Large is the Labor Force in Fruitridge Pocket?
There are 2,117 People in the Labor Forcein in Fruitridge Pocket.
What is the Percentage of People in the Labor Force in Fruitridge Pocket?
47.0% of People are in the Labor Force in Fruitridge Pocket.
What is the Unemployment Rate in Fruitridge Pocket?
Unemployment Rate in Fruitridge Pocket is 6.4%.