Cities with the Highest Percentage of Households Without a Vehicle in Delaware
RELATED REPORTS & OPTIONS
Households without a Cars
Delaware
Compare Cities
Map of Cities with the Highest Percentage of Households Without a Vehicle in Delaware
0.0%
25.0%
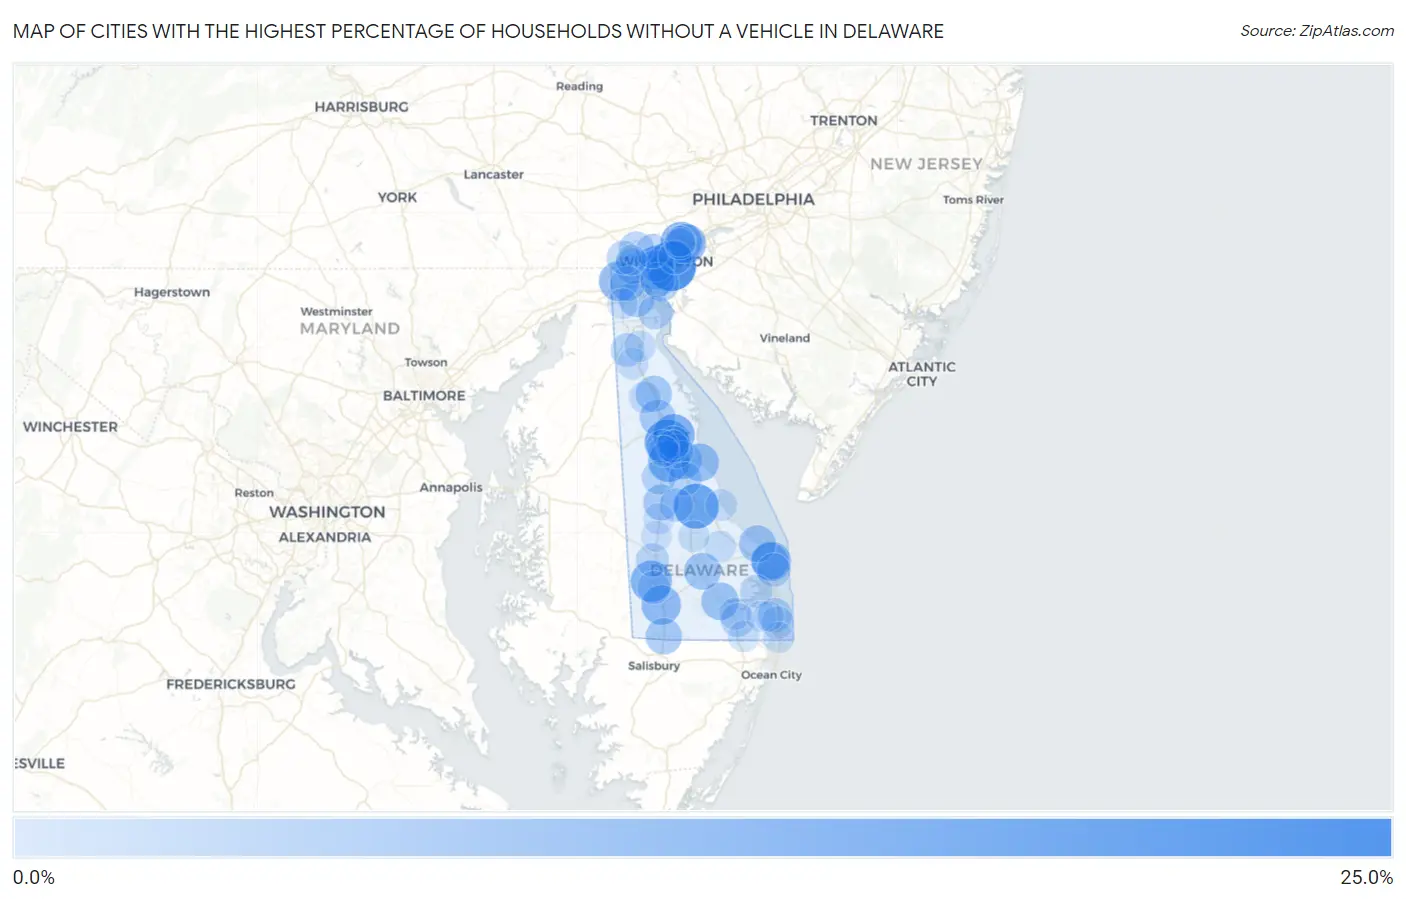
Cities with the Highest Percentage of Households Without a Vehicle in Delaware
| City | Housholds Without a Car | vs State | vs National | |
| 1. | Wilmington | 20.4% | 6.1%(+14.3)#1 | 8.3%(+12.1)#1,341 |
| 2. | Rodney Village | 16.2% | 6.1%(+10.1)#2 | 8.3%(+7.90)#2,262 |
| 3. | Milford | 15.4% | 6.1%(+9.30)#3 | 8.3%(+7.10)#2,530 |
| 4. | Lincoln | 12.5% | 6.1%(+6.40)#4 | 8.3%(+4.20)#3,823 |
| 5. | Dover | 12.1% | 6.1%(+6.00)#5 | 8.3%(+3.80)#4,045 |
| 6. | Woodside East | 11.6% | 6.1%(+5.50)#6 | 8.3%(+3.30)#4,397 |
| 7. | Seaford | 11.5% | 6.1%(+5.40)#7 | 8.3%(+3.20)#4,454 |
| 8. | Ardentown | 11.5% | 6.1%(+5.40)#8 | 8.3%(+3.20)#4,504 |
| 9. | Newark | 9.8% | 6.1%(+3.70)#9 | 8.3%(+1.50)#5,819 |
| 10. | Claymont | 9.7% | 6.1%(+3.60)#10 | 8.3%(+1.40)#5,915 |
| 11. | Laurel | 9.7% | 6.1%(+3.60)#11 | 8.3%(+1.40)#5,933 |
| 12. | Henlopen Acres | 9.7% | 6.1%(+3.60)#12 | 8.3%(+1.40)#5,995 |
| 13. | Newport | 8.9% | 6.1%(+2.80)#13 | 8.3%(+0.600)#6,819 |
| 14. | Magnolia | 8.5% | 6.1%(+2.40)#14 | 8.3%(+0.200)#7,319 |
| 15. | Bowers | 8.1% | 6.1%(+2.00)#15 | 8.3%(-0.200)#7,820 |
| 16. | Millsboro | 7.6% | 6.1%(+1.50)#16 | 8.3%(-0.700)#8,418 |
| 17. | Rehoboth Beach | 7.3% | 6.1%(+1.20)#17 | 8.3%(-1.00)#8,906 |
| 18. | Lewes | 7.0% | 6.1%(+0.900)#18 | 8.3%(-1.30)#9,318 |
| 19. | Georgetown | 6.9% | 6.1%(+0.800)#19 | 8.3%(-1.40)#9,457 |
| 20. | Delmar | 6.4% | 6.1%(+0.300)#20 | 8.3%(-1.90)#10,310 |
| 21. | Bear | 6.3% | 6.1%(+0.200)#21 | 8.3%(-2.00)#10,411 |
| 22. | Smyrna | 6.1% | 6.1%(=0.000)#22 | 8.3%(-2.20)#10,784 |
| 23. | Cheswold | 6.1% | 6.1%(=0.000)#23 | 8.3%(-2.20)#10,851 |
| 24. | Elsmere | 6.0% | 6.1%(-0.100)#24 | 8.3%(-2.30)#10,989 |
| 25. | Harrington | 6.0% | 6.1%(-0.100)#25 | 8.3%(-2.30)#11,010 |
| 26. | Pike Creek Valley | 5.3% | 6.1%(-0.800)#26 | 8.3%(-3.00)#12,357 |
| 27. | New Castle | 5.2% | 6.1%(-0.900)#27 | 8.3%(-3.10)#12,561 |
| 28. | Brookside | 4.7% | 6.1%(-1.40)#28 | 8.3%(-3.60)#13,574 |
| 29. | Wilmington Manor | 4.6% | 6.1%(-1.50)#29 | 8.3%(-3.70)#13,798 |
| 30. | Hockessin | 4.5% | 6.1%(-1.60)#30 | 8.3%(-3.80)#13,964 |
| 31. | Rising Sun Lebanon | 4.2% | 6.1%(-1.90)#31 | 8.3%(-4.10)#14,674 |
| 32. | Greenville | 4.2% | 6.1%(-1.90)#32 | 8.3%(-4.10)#14,692 |
| 33. | Bethany Beach | 4.2% | 6.1%(-1.90)#33 | 8.3%(-4.10)#14,736 |
| 34. | Felton | 4.0% | 6.1%(-2.10)#34 | 8.3%(-4.30)#15,174 |
| 35. | North Star | 3.8% | 6.1%(-2.30)#35 | 8.3%(-4.50)#15,566 |
| 36. | Delaware City | 3.7% | 6.1%(-2.40)#36 | 8.3%(-4.60)#15,894 |
| 37. | Frankford | 3.7% | 6.1%(-2.40)#37 | 8.3%(-4.60)#15,939 |
| 38. | Middletown | 3.6% | 6.1%(-2.50)#38 | 8.3%(-4.70)#16,046 |
| 39. | Dewey Beach | 3.6% | 6.1%(-2.50)#39 | 8.3%(-4.70)#16,224 |
| 40. | Edgemoor | 3.5% | 6.1%(-2.60)#40 | 8.3%(-4.80)#16,337 |
| 41. | Frederica | 3.5% | 6.1%(-2.60)#41 | 8.3%(-4.80)#16,424 |
| 42. | Houston | 3.4% | 6.1%(-2.70)#42 | 8.3%(-4.90)#16,704 |
| 43. | Bridgeville | 3.2% | 6.1%(-2.90)#43 | 8.3%(-5.10)#17,082 |
| 44. | Blades | 3.0% | 6.1%(-3.10)#44 | 8.3%(-5.30)#17,629 |
| 45. | Long Neck | 2.6% | 6.1%(-3.50)#45 | 8.3%(-5.70)#18,558 |
| 46. | Kent Acres | 2.6% | 6.1%(-3.50)#46 | 8.3%(-5.70)#18,571 |
| 47. | South Bethany | 2.6% | 6.1%(-3.50)#47 | 8.3%(-5.70)#18,667 |
| 48. | Wyoming | 2.5% | 6.1%(-3.60)#48 | 8.3%(-5.80)#18,855 |
| 49. | Highland Acres | 2.2% | 6.1%(-3.90)#49 | 8.3%(-6.10)#19,570 |
| 50. | Clayton | 2.0% | 6.1%(-4.10)#50 | 8.3%(-6.30)#20,043 |
| 51. | Dagsboro | 1.9% | 6.1%(-4.20)#51 | 8.3%(-6.40)#20,358 |
| 52. | Slaughter Beach | 1.7% | 6.1%(-4.40)#52 | 8.3%(-6.60)#20,958 |
| 53. | Milton | 1.4% | 6.1%(-4.70)#53 | 8.3%(-6.90)#21,527 |
| 54. | Selbyville | 1.4% | 6.1%(-4.70)#54 | 8.3%(-6.90)#21,537 |
| 55. | Townsend | 1.4% | 6.1%(-4.70)#55 | 8.3%(-6.90)#21,539 |
| 56. | Odessa | 1.3% | 6.1%(-4.80)#56 | 8.3%(-7.00)#21,913 |
| 57. | Ellendale | 1.2% | 6.1%(-4.90)#57 | 8.3%(-7.10)#22,106 |
| 58. | Ardencroft | 1.1% | 6.1%(-5.00)#58 | 8.3%(-7.20)#22,405 |
| 59. | Camden | 1.0% | 6.1%(-5.10)#59 | 8.3%(-7.30)#22,477 |
| 60. | Fenwick Island | 1.0% | 6.1%(-5.10)#60 | 8.3%(-7.30)#22,625 |
| 61. | Farmington | 0.90% | 6.1%(-5.20)#61 | 8.3%(-7.40)#22,875 |
| 62. | Millville | 0.80% | 6.1%(-5.30)#62 | 8.3%(-7.50)#22,958 |
| 63. | Greenwood | 0.80% | 6.1%(-5.30)#63 | 8.3%(-7.50)#22,964 |
| 64. | Arden | 0.70% | 6.1%(-5.40)#64 | 8.3%(-7.60)#23,226 |
| 65. | Glasgow | 0.60% | 6.1%(-5.50)#65 | 8.3%(-7.70)#23,278 |
| 66. | Pike Creek | 0.60% | 6.1%(-5.50)#66 | 8.3%(-7.70)#23,294 |
| 67. | Ocean View | 0.30% | 6.1%(-5.80)#67 | 8.3%(-8.00)#23,719 |
1
Common Questions
What are the Top 10 Cities with the Highest Percentage of Households Without a Vehicle in Delaware?
Top 10 Cities with the Highest Percentage of Households Without a Vehicle in Delaware are:
#1
20.4%
#2
16.2%
#3
15.4%
#4
12.1%
#5
11.6%
#6
11.5%
#7
11.5%
#8
9.8%
#9
9.7%
#10
9.7%
What city has the Highest Percentage of Households Without a Vehicle in Delaware?
Wilmington has the Highest Percentage of Households Without a Vehicle in Delaware with 20.4%.
What is the Percentage of Households Without a Vehicle in the State of Delaware?
Percentage of Households Without a Vehicle in Delaware is 6.1%.
What is the Percentage of Households Without a Vehicle in the United States?
Percentage of Households Without a Vehicle in the United States is 8.3%.