Zip Codes with the Highest Percentage of Households Without a Vehicle in San Jose, CA
RELATED REPORTS & OPTIONS
Households without a Cars
San Jose
Compare Zip Codes
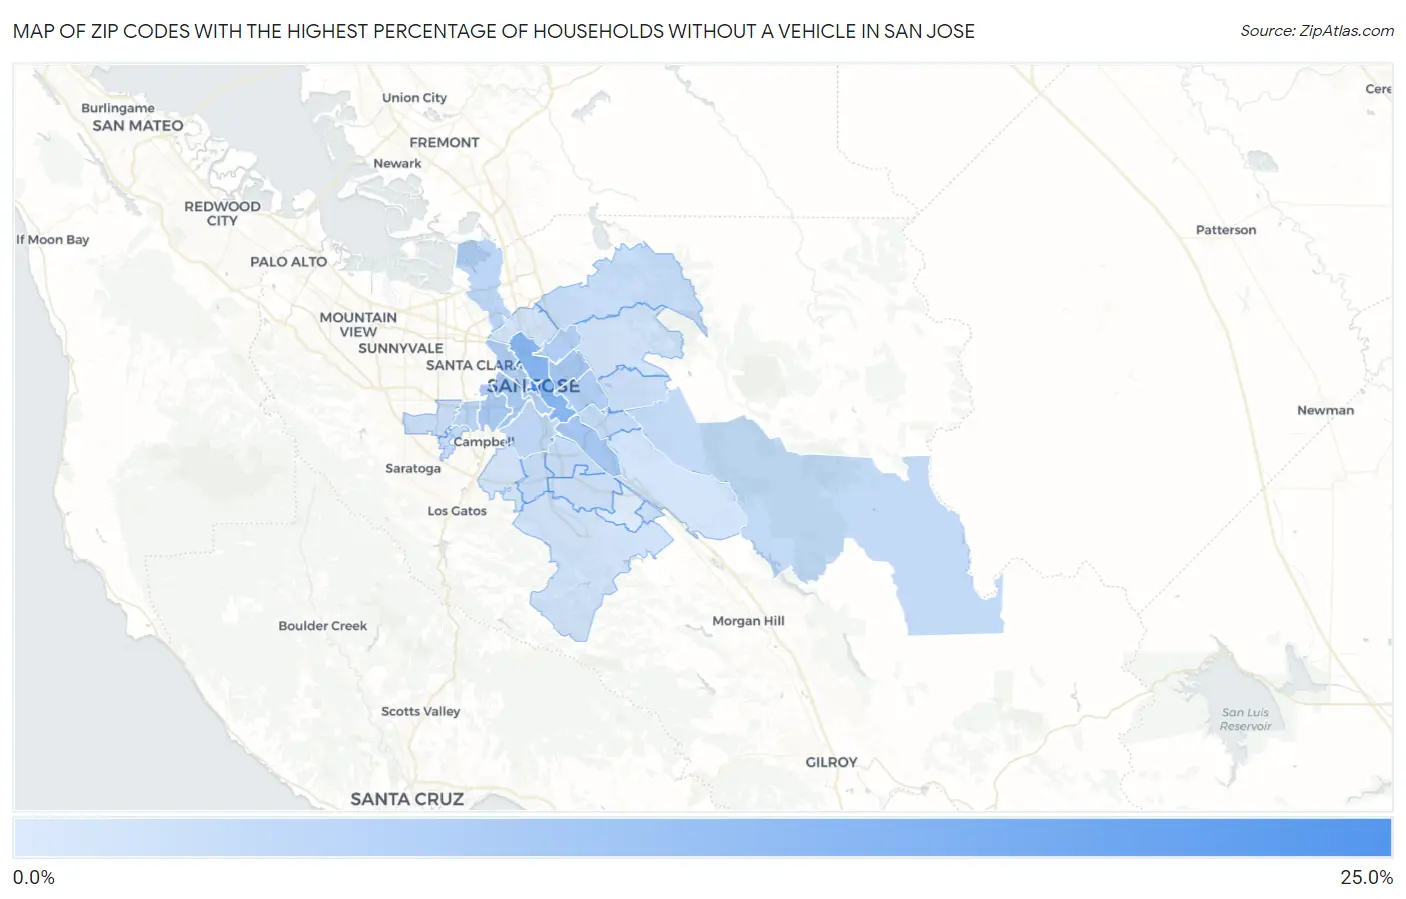
Map of Zip Codes with the Highest Percentage of Households Without a Vehicle in San Jose
1.3%
23.8%
Zip Codes with the Highest Percentage of Households Without a Vehicle in San Jose, CA
| Zip Code | Housholds Without a Car | vs State | vs National | |
| 1. | 95113 | 23.8% | 6.9%(+16.9)#48 | 8.3%(+15.5)#1,155 |
| 2. | 95112 | 13.4% | 6.9%(+6.50)#142 | 8.3%(+5.10)#2,910 |
| 3. | 95111 | 9.2% | 6.9%(+2.30)#265 | 8.3%(+0.900)#5,511 |
| 4. | 95116 | 9.2% | 6.9%(+2.30)#266 | 8.3%(+0.900)#5,513 |
| 5. | 95126 | 8.9% | 6.9%(+2.00)#282 | 8.3%(+0.600)#5,831 |
| 6. | 95128 | 8.4% | 6.9%(+1.50)#326 | 8.3%(+0.100)#6,426 |
| 7. | 95110 | 7.3% | 6.9%(+0.400)#431 | 8.3%(-1.00)#8,056 |
| 8. | 95133 | 7.1% | 6.9%(+0.200)#455 | 8.3%(-1.20)#8,379 |
| 9. | 95122 | 7.0% | 6.9%(+0.100)#460 | 8.3%(-1.30)#8,520 |
| 10. | 95134 | 5.9% | 6.9%(-1.00)#621 | 8.3%(-2.40)#10,678 |
| 11. | 95117 | 5.8% | 6.9%(-1.10)#642 | 8.3%(-2.50)#10,904 |
| 12. | 95125 | 5.1% | 6.9%(-1.80)#724 | 8.3%(-3.20)#12,575 |
| 13. | 95135 | 4.8% | 6.9%(-2.10)#773 | 8.3%(-3.50)#13,385 |
| 14. | 95121 | 4.6% | 6.9%(-2.30)#798 | 8.3%(-3.70)#13,907 |
| 15. | 95132 | 4.1% | 6.9%(-2.80)#904 | 8.3%(-4.20)#15,370 |
| 16. | 95136 | 4.0% | 6.9%(-2.90)#927 | 8.3%(-4.30)#15,685 |
| 17. | 95118 | 4.0% | 6.9%(-2.90)#933 | 8.3%(-4.30)#15,712 |
| 18. | 95148 | 3.9% | 6.9%(-3.00)#946 | 8.3%(-4.40)#15,984 |
| 19. | 95129 | 3.9% | 6.9%(-3.00)#949 | 8.3%(-4.40)#15,994 |
| 20. | 95130 | 3.9% | 6.9%(-3.00)#955 | 8.3%(-4.40)#16,072 |
| 21. | 95123 | 3.6% | 6.9%(-3.30)#1,000 | 8.3%(-4.70)#16,947 |
| 22. | 95139 | 3.4% | 6.9%(-3.50)#1,055 | 8.3%(-4.90)#17,734 |
| 23. | 95127 | 3.0% | 6.9%(-3.90)#1,119 | 8.3%(-5.30)#19,029 |
| 24. | 95120 | 2.9% | 6.9%(-4.00)#1,142 | 8.3%(-5.40)#19,386 |
| 25. | 95131 | 2.9% | 6.9%(-4.00)#1,145 | 8.3%(-5.40)#19,405 |
| 26. | 95124 | 2.7% | 6.9%(-4.20)#1,173 | 8.3%(-5.60)#20,069 |
| 27. | 95138 | 2.5% | 6.9%(-4.40)#1,213 | 8.3%(-5.80)#20,759 |
| 28. | 95119 | 1.3% | 6.9%(-5.60)#1,403 | 8.3%(-7.00)#24,773 |
1
Common Questions
What are the Top 10 Zip Codes with the Highest Percentage of Households Without a Vehicle in San Jose, CA?
Top 10 Zip Codes with the Highest Percentage of Households Without a Vehicle in San Jose, CA are:
What zip code has the Highest Percentage of Households Without a Vehicle in San Jose, CA?
95113 has the Highest Percentage of Households Without a Vehicle in San Jose, CA with 23.8%.
What is the Percentage of Households Without a Vehicle in San Jose, CA?
Percentage of Households Without a Vehicle in San Jose is 5.9%.
What is the Percentage of Households Without a Vehicle in California?
Percentage of Households Without a Vehicle in California is 6.9%.
What is the Percentage of Households Without a Vehicle in the United States?
Percentage of Households Without a Vehicle in the United States is 8.3%.