Zip Codes with the Highest Percentage of Households Without a Vehicle in San Diego, CA
RELATED REPORTS & OPTIONS
Households without a Cars
San Diego
Compare Zip Codes
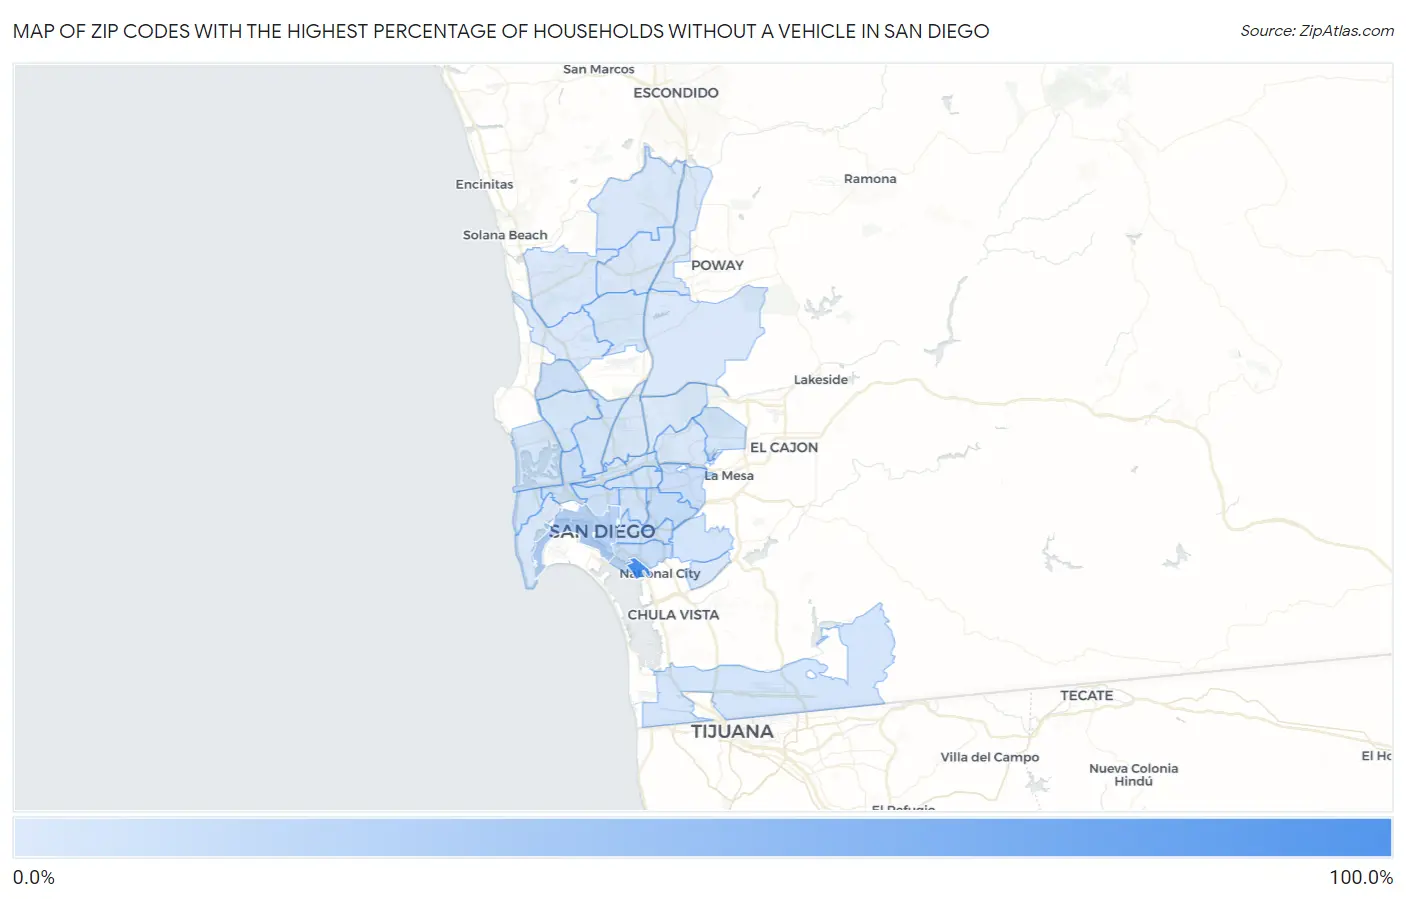
Map of Zip Codes with the Highest Percentage of Households Without a Vehicle in San Diego
0.90%
100.0%
Zip Codes with the Highest Percentage of Households Without a Vehicle in San Diego, CA
| Zip Code | Housholds Without a Car | vs State | vs National | |
| 1. | 92136 | 100.0% | 6.9%(+93.1)#1 | 8.3%(+91.7)#2 |
| 2. | 92101 | 19.6% | 6.9%(+12.7)#68 | 8.3%(+11.3)#1,547 |
| 3. | 92105 | 12.4% | 6.9%(+5.50)#163 | 8.3%(+4.10)#3,355 |
| 4. | 92113 | 10.5% | 6.9%(+3.60)#209 | 8.3%(+2.20)#4,445 |
| 5. | 92115 | 9.8% | 6.9%(+2.90)#239 | 8.3%(+1.50)#5,003 |
| 6. | 92110 | 9.0% | 6.9%(+2.10)#277 | 8.3%(+0.700)#5,736 |
| 7. | 92122 | 8.7% | 6.9%(+1.80)#297 | 8.3%(+0.400)#6,054 |
| 8. | 92103 | 8.2% | 6.9%(+1.30)#340 | 8.3%(-0.100)#6,649 |
| 9. | 92102 | 7.8% | 6.9%(+0.900)#379 | 8.3%(-0.500)#7,215 |
| 10. | 92104 | 6.5% | 6.9%(-0.400)#517 | 8.3%(-1.80)#9,359 |
| 11. | 92116 | 5.8% | 6.9%(-1.10)#638 | 8.3%(-2.50)#10,897 |
| 12. | 92111 | 5.3% | 6.9%(-1.60)#703 | 8.3%(-3.00)#12,060 |
| 13. | 92114 | 5.0% | 6.9%(-1.90)#737 | 8.3%(-3.30)#12,824 |
| 14. | 92119 | 4.9% | 6.9%(-2.00)#756 | 8.3%(-3.40)#13,125 |
| 15. | 92154 | 4.8% | 6.9%(-2.10)#762 | 8.3%(-3.50)#13,314 |
| 16. | 92107 | 4.8% | 6.9%(-2.10)#770 | 8.3%(-3.50)#13,360 |
| 17. | 92126 | 4.4% | 6.9%(-2.50)#827 | 8.3%(-3.90)#14,448 |
| 18. | 92109 | 4.4% | 6.9%(-2.50)#834 | 8.3%(-3.90)#14,468 |
| 19. | 92108 | 4.2% | 6.9%(-2.70)#885 | 8.3%(-4.10)#15,136 |
| 20. | 92117 | 3.6% | 6.9%(-3.30)#1,006 | 8.3%(-4.70)#16,961 |
| 21. | 92120 | 3.4% | 6.9%(-3.50)#1,048 | 8.3%(-4.90)#17,636 |
| 22. | 92106 | 3.2% | 6.9%(-3.70)#1,091 | 8.3%(-5.10)#18,384 |
| 23. | 92127 | 3.1% | 6.9%(-3.80)#1,100 | 8.3%(-5.20)#18,680 |
| 24. | 92139 | 3.1% | 6.9%(-3.80)#1,106 | 8.3%(-5.20)#18,711 |
| 25. | 92123 | 3.0% | 6.9%(-3.90)#1,123 | 8.3%(-5.30)#19,060 |
| 26. | 92128 | 2.9% | 6.9%(-4.00)#1,137 | 8.3%(-5.40)#19,362 |
| 27. | 92129 | 2.3% | 6.9%(-4.60)#1,244 | 8.3%(-6.00)#21,352 |
| 28. | 92131 | 2.3% | 6.9%(-4.60)#1,248 | 8.3%(-6.00)#21,369 |
| 29. | 92130 | 2.1% | 6.9%(-4.80)#1,277 | 8.3%(-6.20)#22,033 |
| 30. | 92121 | 1.9% | 6.9%(-5.00)#1,323 | 8.3%(-6.40)#22,894 |
| 31. | 92124 | 0.90% | 6.9%(-6.00)#1,442 | 8.3%(-7.40)#25,856 |
1
Common Questions
What are the Top 10 Zip Codes with the Highest Percentage of Households Without a Vehicle in San Diego, CA?
Top 10 Zip Codes with the Highest Percentage of Households Without a Vehicle in San Diego, CA are:
What zip code has the Highest Percentage of Households Without a Vehicle in San Diego, CA?
92136 has the Highest Percentage of Households Without a Vehicle in San Diego, CA with 100.0%.
What is the Percentage of Households Without a Vehicle in San Diego, CA?
Percentage of Households Without a Vehicle in San Diego is 6.2%.
What is the Percentage of Households Without a Vehicle in California?
Percentage of Households Without a Vehicle in California is 6.9%.
What is the Percentage of Households Without a Vehicle in the United States?
Percentage of Households Without a Vehicle in the United States is 8.3%.