Cities with the Highest Percentage of Households Without a Vehicle in Connecticut
RELATED REPORTS & OPTIONS
Households without a Cars
Connecticut
Compare Cities
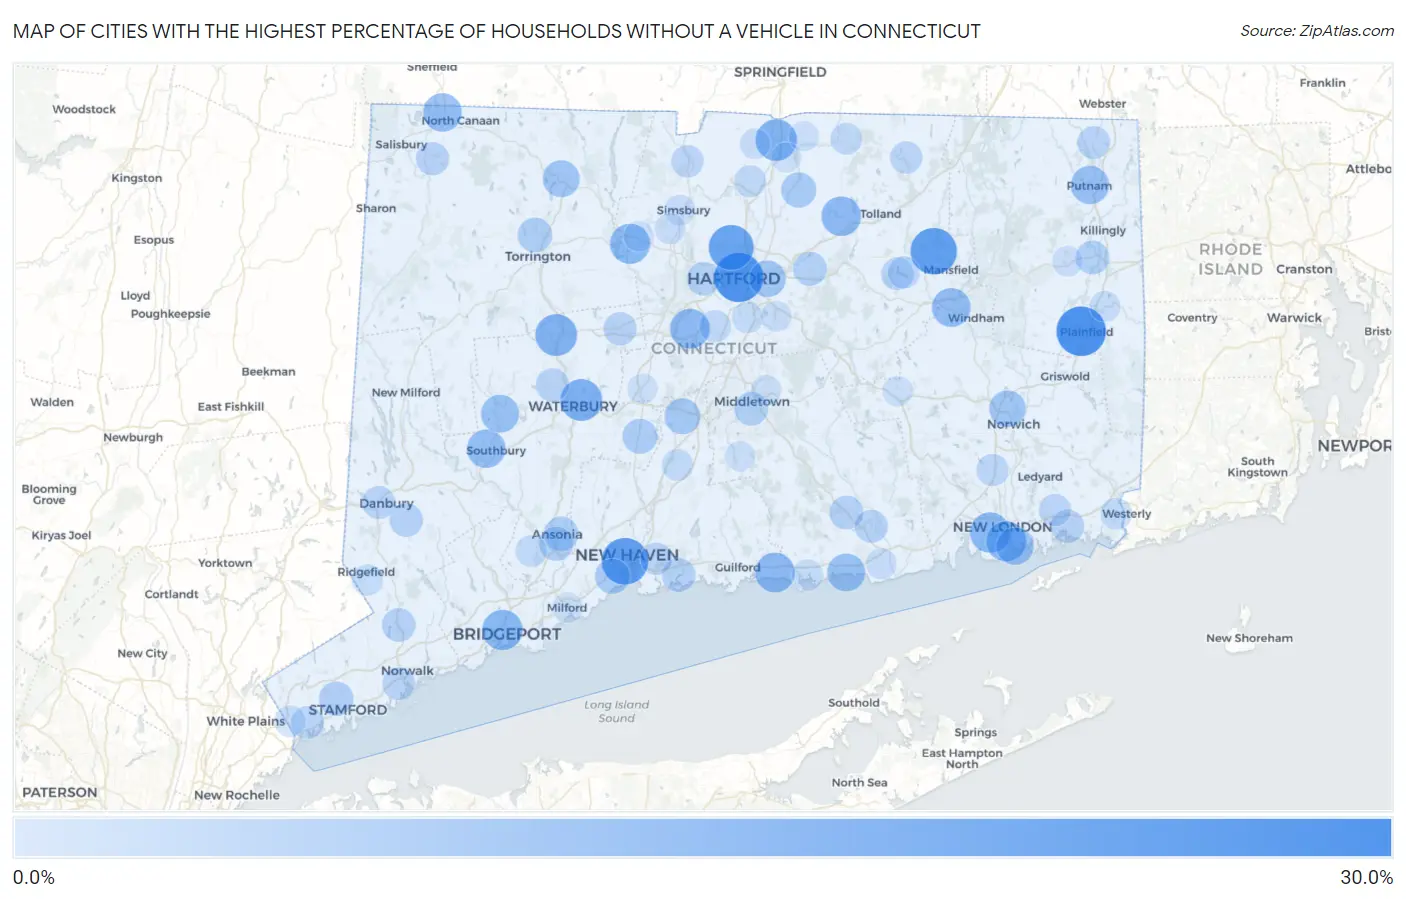
Map of Cities with the Highest Percentage of Households Without a Vehicle in Connecticut
0.0%
30.0%
Cities with the Highest Percentage of Households Without a Vehicle in Connecticut
| City | Housholds Without a Car | vs State | vs National | |
| 1. | Plainfield Village | 29.6% | 8.5%(+21.1)#1 | 8.3%(+21.3)#608 |
| 2. | Dodgingtown | 29.1% | 8.5%(+20.6)#2 | 8.3%(+20.8)#634 |
| 3. | Hartford | 29.0% | 8.5%(+20.5)#3 | 8.3%(+20.7)#635 |
| 4. | New Haven | 25.7% | 8.5%(+17.2)#4 | 8.3%(+17.4)#803 |
| 5. | Storrs | 25.4% | 8.5%(+16.9)#5 | 8.3%(+17.1)#821 |
| 6. | Blue Hills | 23.5% | 8.5%(+15.0)#6 | 8.3%(+15.2)#966 |
| 7. | Route 7 Gateway | 19.8% | 8.5%(+11.3)#7 | 8.3%(+11.5)#1,447 |
| 8. | Waterbury | 19.3% | 8.5%(+10.8)#8 | 8.3%(+11.0)#1,527 |
| 9. | Thomaston | 19.2% | 8.5%(+10.7)#9 | 8.3%(+10.9)#1,552 |
| 10. | Thompsonville | 18.8% | 8.5%(+10.3)#10 | 8.3%(+10.5)#1,611 |
| 11. | Mamanasco Lake | 17.7% | 8.5%(+9.20)#11 | 8.3%(+9.40)#1,856 |
| 12. | Bridgeport | 17.2% | 8.5%(+8.70)#12 | 8.3%(+8.90)#1,967 |
| 13. | Waterford | 17.2% | 8.5%(+8.70)#13 | 8.3%(+8.90)#1,972 |
| 14. | New London | 17.0% | 8.5%(+8.50)#14 | 8.3%(+8.70)#2,014 |
| 15. | Collinsville | 17.0% | 8.5%(+8.50)#15 | 8.3%(+8.70)#2,019 |
| 16. | New Britain | 16.5% | 8.5%(+8.00)#16 | 8.3%(+8.20)#2,152 |
| 17. | Madison Center | 16.5% | 8.5%(+8.00)#17 | 8.3%(+8.20)#2,167 |
| 18. | Rockville | 16.3% | 8.5%(+7.80)#18 | 8.3%(+8.00)#2,223 |
| 19. | Willimantic | 15.2% | 8.5%(+6.70)#19 | 8.3%(+6.90)#2,606 |
| 20. | Canaan | 15.0% | 8.5%(+6.50)#20 | 8.3%(+6.70)#2,692 |
| 21. | Heritage Village | 14.9% | 8.5%(+6.40)#21 | 8.3%(+6.60)#2,716 |
| 22. | Putnam | 14.4% | 8.5%(+5.90)#22 | 8.3%(+6.10)#2,922 |
| 23. | Westbrook Center | 14.1% | 8.5%(+5.60)#23 | 8.3%(+5.80)#3,061 |
| 24. | Woodbury Center | 14.1% | 8.5%(+5.60)#24 | 8.3%(+5.80)#3,069 |
| 25. | Groton | 13.5% | 8.5%(+5.00)#25 | 8.3%(+5.20)#3,314 |
| 26. | Winsted | 12.8% | 8.5%(+4.30)#26 | 8.3%(+4.50)#3,641 |
| 27. | East Hartford | 12.4% | 8.5%(+3.90)#27 | 8.3%(+4.10)#3,864 |
| 28. | Norwich | 12.4% | 8.5%(+3.90)#28 | 8.3%(+4.10)#3,865 |
| 29. | Jewett City Borough | 12.4% | 8.5%(+3.90)#29 | 8.3%(+4.10)#3,889 |
| 30. | Meriden | 11.4% | 8.5%(+2.90)#30 | 8.3%(+3.10)#4,520 |
| 31. | Broad Brook | 10.6% | 8.5%(+2.10)#31 | 8.3%(+2.30)#5,133 |
| 32. | West Haven | 10.5% | 8.5%(+2.00)#32 | 8.3%(+2.20)#5,200 |
| 33. | Cheshire Village | 10.3% | 8.5%(+1.80)#33 | 8.3%(+2.00)#5,386 |
| 34. | Torrington | 9.9% | 8.5%(+1.40)#34 | 8.3%(+1.60)#5,728 |
| 35. | Bantam Borough | 9.9% | 8.5%(+1.40)#35 | 8.3%(+1.60)#5,795 |
| 36. | Ansonia | 9.7% | 8.5%(+1.20)#36 | 8.3%(+1.40)#5,907 |
| 37. | Stamford | 9.4% | 8.5%(+0.900)#37 | 8.3%(+1.10)#6,188 |
| 38. | Derby | 9.4% | 8.5%(+0.900)#38 | 8.3%(+1.10)#6,205 |
| 39. | Manchester | 9.0% | 8.5%(+0.500)#39 | 8.3%(+0.700)#6,638 |
| 40. | Danielson Borough | 9.0% | 8.5%(+0.500)#40 | 8.3%(+0.700)#6,676 |
| 41. | East Brooklyn | 8.8% | 8.5%(+0.300)#41 | 8.3%(+0.500)#6,920 |
| 42. | Middletown | 8.7% | 8.5%(+0.200)#42 | 8.3%(+0.400)#6,993 |
| 43. | Branford Center | 8.6% | 8.5%(+0.100)#43 | 8.3%(+0.300)#7,132 |
| 44. | Deep River Center | 8.6% | 8.5%(+0.100)#44 | 8.3%(+0.300)#7,148 |
| 45. | Wilton Center | 8.6% | 8.5%(+0.100)#45 | 8.3%(+0.300)#7,161 |
| 46. | West Hartford | 8.5% | 8.5%(=0.000)#46 | 8.3%(+0.200)#7,220 |
| 47. | Bethel | 8.5% | 8.5%(=0.000)#47 | 8.3%(+0.200)#7,236 |
| 48. | Lordship | 8.5% | 8.5%(=0.000)#48 | 8.3%(+0.200)#7,256 |
| 49. | Mystic | 8.2% | 8.5%(-0.300)#49 | 8.3%(-0.100)#7,623 |
| 50. | Bristol | 8.1% | 8.5%(-0.400)#50 | 8.3%(-0.200)#7,710 |
| 51. | Oakville | 8.0% | 8.5%(-0.500)#51 | 8.3%(-0.300)#7,871 |
| 52. | Falls Village | 7.9% | 8.5%(-0.600)#52 | 8.3%(-0.400)#8,069 |
| 53. | Essex Village | 7.8% | 8.5%(-0.700)#53 | 8.3%(-0.500)#8,160 |
| 54. | Danbury | 7.7% | 8.5%(-0.800)#54 | 8.3%(-0.600)#8,233 |
| 55. | North Grosvenor Dale | 7.5% | 8.5%(-1.00)#55 | 8.3%(-0.800)#8,591 |
| 56. | Norwalk | 7.4% | 8.5%(-1.10)#56 | 8.3%(-0.900)#8,650 |
| 57. | Greenwich | 7.3% | 8.5%(-1.20)#57 | 8.3%(-1.00)#8,841 |
| 58. | Coventry Lake | 7.3% | 8.5%(-1.20)#58 | 8.3%(-1.00)#8,889 |
| 59. | Ridgebury | 7.2% | 8.5%(-1.30)#59 | 8.3%(-1.10)#9,034 |
| 60. | Stafford Springs | 6.9% | 8.5%(-1.60)#60 | 8.3%(-1.40)#9,468 |
| 61. | Salmon Brook | 6.9% | 8.5%(-1.60)#61 | 8.3%(-1.40)#9,492 |
| 62. | East Haven | 6.8% | 8.5%(-1.70)#62 | 8.3%(-1.50)#9,583 |
| 63. | Old Mystic | 6.7% | 8.5%(-1.80)#63 | 8.3%(-1.60)#9,801 |
| 64. | Oxoboxo River | 6.6% | 8.5%(-1.90)#64 | 8.3%(-1.70)#9,967 |
| 65. | South Coventry | 6.6% | 8.5%(-1.90)#65 | 8.3%(-1.70)#9,987 |
| 66. | Indian Field | 6.6% | 8.5%(-1.90)#66 | 8.3%(-1.70)#10,024 |
| 67. | Newington | 6.4% | 8.5%(-2.10)#67 | 8.3%(-1.90)#10,237 |
| 68. | Branchville | 6.3% | 8.5%(-2.20)#68 | 8.3%(-2.00)#10,576 |
| 69. | Naugatuck Borough | 6.2% | 8.5%(-2.30)#69 | 8.3%(-2.10)#10,596 |
| 70. | Windsor Locks | 6.2% | 8.5%(-2.30)#70 | 8.3%(-2.10)#10,617 |
| 71. | Somers | 6.2% | 8.5%(-2.30)#71 | 8.3%(-2.10)#10,670 |
| 72. | Trumbull Center | 6.1% | 8.5%(-2.40)#72 | 8.3%(-2.20)#10,795 |
| 73. | Pawcatuck | 6.0% | 8.5%(-2.50)#73 | 8.3%(-2.30)#10,992 |
| 74. | Stepney | 6.0% | 8.5%(-2.50)#74 | 8.3%(-2.30)#11,011 |
| 75. | Shelton | 5.9% | 8.5%(-2.60)#75 | 8.3%(-2.40)#11,145 |
| 76. | Wallingford Center | 5.9% | 8.5%(-2.60)#76 | 8.3%(-2.40)#11,157 |
| 77. | Candlewood Shores | 5.8% | 8.5%(-2.70)#77 | 8.3%(-2.50)#11,452 |
| 78. | Glenville | 5.6% | 8.5%(-2.90)#78 | 8.3%(-2.70)#11,802 |
| 79. | Poplar Plains | 5.5% | 8.5%(-3.00)#79 | 8.3%(-2.80)#12,043 |
| 80. | Wethersfield | 5.4% | 8.5%(-3.10)#80 | 8.3%(-2.90)#12,131 |
| 81. | Ridgefield | 5.4% | 8.5%(-3.10)#81 | 8.3%(-2.90)#12,157 |
| 82. | Clinton | 5.4% | 8.5%(-3.10)#82 | 8.3%(-2.90)#12,197 |
| 83. | Moosup | 4.9% | 8.5%(-3.60)#83 | 8.3%(-3.40)#13,158 |
| 84. | Old Saybrook Center | 4.9% | 8.5%(-3.60)#84 | 8.3%(-3.40)#13,176 |
| 85. | Glastonbury Center | 4.8% | 8.5%(-3.70)#85 | 8.3%(-3.50)#13,348 |
| 86. | Simsbury Center | 4.8% | 8.5%(-3.70)#86 | 8.3%(-3.50)#13,357 |
| 87. | Weatogue | 4.7% | 8.5%(-3.80)#87 | 8.3%(-3.60)#13,630 |
| 88. | Suffield Depot | 4.6% | 8.5%(-3.90)#88 | 8.3%(-3.70)#13,848 |
| 89. | Brooklyn | 4.6% | 8.5%(-3.90)#89 | 8.3%(-3.70)#13,876 |
| 90. | Colchester | 4.4% | 8.5%(-4.10)#90 | 8.3%(-3.90)#14,220 |
| 91. | Oronoque | 4.4% | 8.5%(-4.10)#91 | 8.3%(-3.90)#14,228 |
| 92. | Tashua | 4.4% | 8.5%(-4.10)#92 | 8.3%(-3.90)#14,231 |
| 93. | Canton Valley | 4.4% | 8.5%(-4.10)#93 | 8.3%(-3.90)#14,263 |
| 94. | Milford City Balance | 4.3% | 8.5%(-4.20)#94 | 8.3%(-4.00)#14,361 |
| 95. | Portland | 4.3% | 8.5%(-4.20)#95 | 8.3%(-4.00)#14,407 |
| 96. | Daniels Farm | 4.3% | 8.5%(-4.20)#96 | 8.3%(-4.00)#14,412 |
| 97. | Southwood Acres | 4.2% | 8.5%(-4.30)#97 | 8.3%(-4.10)#14,647 |
| 98. | Hazardville | 4.2% | 8.5%(-4.30)#98 | 8.3%(-4.10)#14,654 |
| 99. | Durham | 4.2% | 8.5%(-4.30)#99 | 8.3%(-4.10)#14,680 |
| 100. | Plantsville | 4.2% | 8.5%(-4.30)#100 | 8.3%(-4.10)#14,707 |
Common Questions
What are the Top 10 Cities with the Highest Percentage of Households Without a Vehicle in Connecticut?
Top 10 Cities with the Highest Percentage of Households Without a Vehicle in Connecticut are:
#1
29.6%
#2
29.0%
#3
25.7%
#4
25.4%
#5
23.5%
#6
19.3%
#7
19.2%
#8
18.8%
#9
17.2%
#10
17.2%
What city has the Highest Percentage of Households Without a Vehicle in Connecticut?
Plainfield Village has the Highest Percentage of Households Without a Vehicle in Connecticut with 29.6%.
What is the Percentage of Households Without a Vehicle in the State of Connecticut?
Percentage of Households Without a Vehicle in Connecticut is 8.5%.
What is the Percentage of Households Without a Vehicle in the United States?
Percentage of Households Without a Vehicle in the United States is 8.3%.