Cities with the Highest Percentage of Households Without a Vehicle in Vermont
RELATED REPORTS & OPTIONS
Households without a Cars
Vermont
Compare Cities
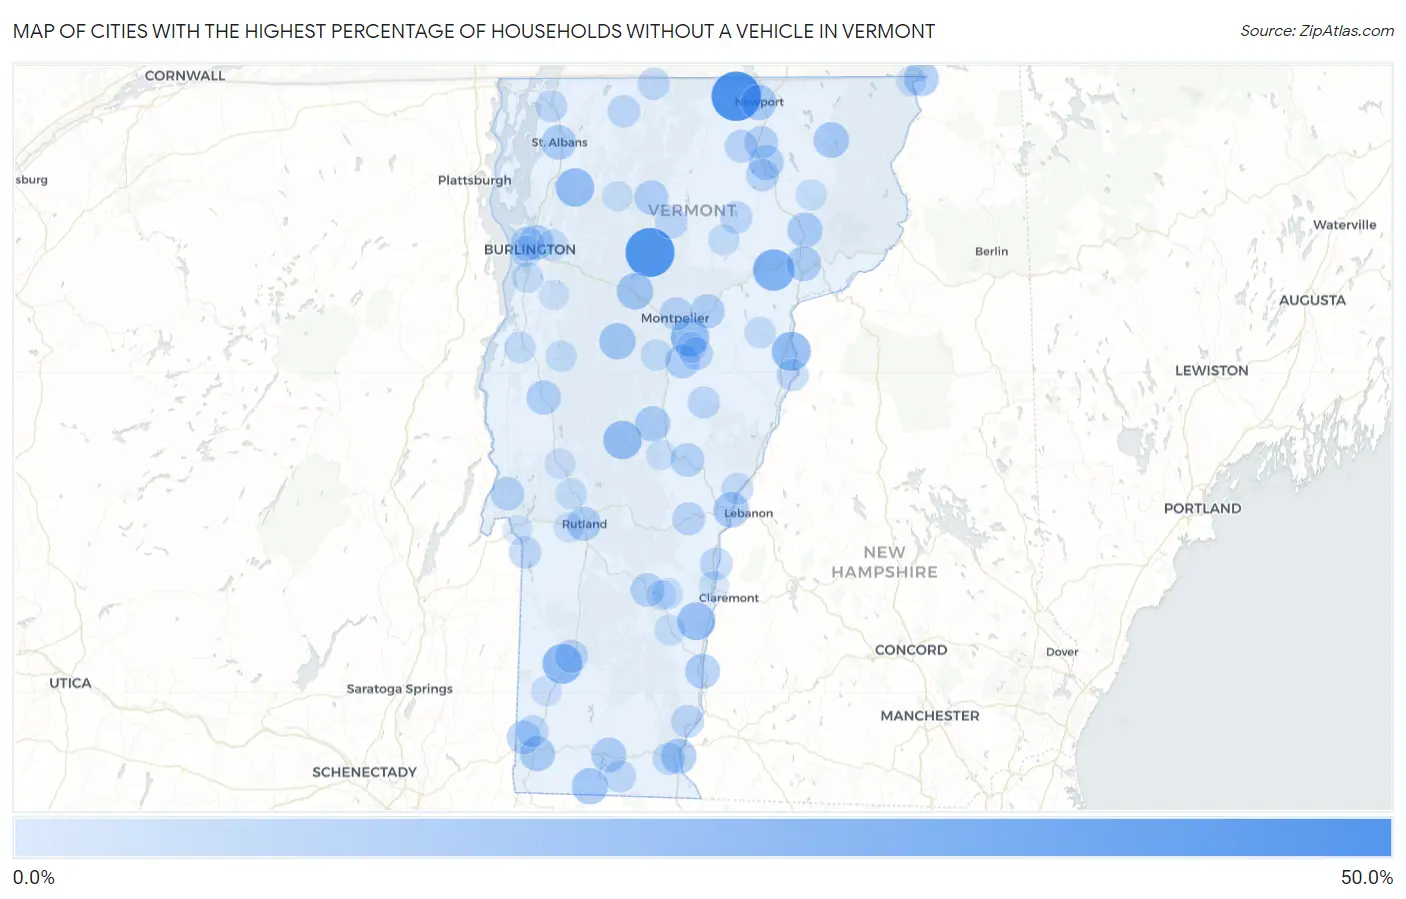
Map of Cities with the Highest Percentage of Households Without a Vehicle in Vermont
0.0%
50.0%
Cities with the Highest Percentage of Households Without a Vehicle in Vermont
| City | Housholds Without a Car | vs State | vs National | |
| 1. | Newport Center | 47.2% | 6.4%(+40.8)#1 | 8.3%(+38.9)#257 |
| 2. | Stowe | 46.0% | 6.4%(+39.6)#2 | 8.3%(+37.7)#272 |
| 3. | Lyndon | 41.0% | 6.4%(+34.6)#3 | 8.3%(+32.7)#334 |
| 4. | Townshend | 34.5% | 6.4%(+28.1)#4 | 8.3%(+26.2)#447 |
| 5. | Hartford | 32.5% | 6.4%(+26.1)#5 | 8.3%(+24.2)#511 |
| 6. | Danville | 28.7% | 6.4%(+22.3)#6 | 8.3%(+20.4)#649 |
| 7. | Manchester | 24.9% | 6.4%(+18.5)#7 | 8.3%(+16.6)#865 |
| 8. | Wells River | 23.3% | 6.4%(+16.9)#8 | 8.3%(+15.0)#988 |
| 9. | Fairfax | 22.2% | 6.4%(+15.8)#9 | 8.3%(+13.9)#1,094 |
| 10. | Barre | 22.0% | 6.4%(+15.6)#10 | 8.3%(+13.7)#1,116 |
| 11. | Rochester | 21.9% | 6.4%(+15.5)#11 | 8.3%(+13.6)#1,139 |
| 12. | Springfield | 20.4% | 6.4%(+14.0)#12 | 8.3%(+12.1)#1,342 |
| 13. | Algiers | 19.5% | 6.4%(+13.1)#13 | 8.3%(+11.2)#1,506 |
| 14. | Waterbury | 17.7% | 6.4%(+11.3)#14 | 8.3%(+9.40)#1,851 |
| 15. | Waitsfield | 17.5% | 6.4%(+11.1)#15 | 8.3%(+9.20)#1,915 |
| 16. | Readsboro | 17.2% | 6.4%(+10.8)#16 | 8.3%(+8.90)#1,985 |
| 17. | Peacham | 17.2% | 6.4%(+10.8)#17 | 8.3%(+8.90)#1,987 |
| 18. | Newport | 15.8% | 6.4%(+9.40)#18 | 8.3%(+7.50)#2,379 |
| 19. | White River Junction | 15.7% | 6.4%(+9.30)#19 | 8.3%(+7.40)#2,428 |
| 20. | North Clarendon | 15.6% | 6.4%(+9.20)#20 | 8.3%(+7.30)#2,481 |
| 21. | Island Pond | 15.5% | 6.4%(+9.10)#21 | 8.3%(+7.20)#2,515 |
| 22. | Brattleboro | 14.9% | 6.4%(+8.50)#22 | 8.3%(+6.60)#2,711 |
| 23. | Randolph | 14.9% | 6.4%(+8.50)#23 | 8.3%(+6.60)#2,724 |
| 24. | Bennington | 14.6% | 6.4%(+8.20)#24 | 8.3%(+6.30)#2,824 |
| 25. | Lyndonville | 14.5% | 6.4%(+8.10)#25 | 8.3%(+6.20)#2,893 |
| 26. | Beecher Falls | 14.5% | 6.4%(+8.10)#26 | 8.3%(+6.20)#2,910 |
| 27. | St Johnsbury | 14.2% | 6.4%(+7.80)#27 | 8.3%(+5.90)#3,017 |
| 28. | Winooski | 14.1% | 6.4%(+7.70)#28 | 8.3%(+5.80)#3,051 |
| 29. | Bellows Falls | 14.1% | 6.4%(+7.70)#29 | 8.3%(+5.80)#3,058 |
| 30. | Barton | 14.1% | 6.4%(+7.70)#30 | 8.3%(+5.80)#3,079 |
| 31. | Wilmington | 14.1% | 6.4%(+7.70)#31 | 8.3%(+5.80)#3,082 |
| 32. | St Albans | 13.8% | 6.4%(+7.40)#32 | 8.3%(+5.50)#3,183 |
| 33. | Williamstown | 13.3% | 6.4%(+6.90)#33 | 8.3%(+5.00)#3,416 |
| 34. | Wolcott | 13.2% | 6.4%(+6.80)#34 | 8.3%(+4.90)#3,489 |
| 35. | Rutland | 13.0% | 6.4%(+6.60)#35 | 8.3%(+4.70)#3,535 |
| 36. | Burlington | 12.9% | 6.4%(+6.50)#36 | 8.3%(+4.60)#3,579 |
| 37. | Johnson | 12.9% | 6.4%(+6.50)#37 | 8.3%(+4.60)#3,603 |
| 38. | Plainfield | 12.9% | 6.4%(+6.50)#38 | 8.3%(+4.60)#3,617 |
| 39. | Middlebury | 12.8% | 6.4%(+6.40)#39 | 8.3%(+4.50)#3,640 |
| 40. | Harmonyville | 12.5% | 6.4%(+6.10)#40 | 8.3%(+4.20)#3,846 |
| 41. | South Royalton | 12.0% | 6.4%(+5.60)#41 | 8.3%(+3.70)#4,154 |
| 42. | North Bennington | 11.8% | 6.4%(+5.40)#42 | 8.3%(+3.50)#4,277 |
| 43. | Ludlow | 11.8% | 6.4%(+5.40)#43 | 8.3%(+3.50)#4,292 |
| 44. | Orleans | 11.1% | 6.4%(+4.70)#44 | 8.3%(+2.80)#4,745 |
| 45. | Lunenburg | 11.0% | 6.4%(+4.60)#45 | 8.3%(+2.70)#4,864 |
| 46. | Castleton Four Corners | 10.9% | 6.4%(+4.50)#46 | 8.3%(+2.60)#4,931 |
| 47. | Benson | 10.9% | 6.4%(+4.50)#47 | 8.3%(+2.60)#4,953 |
| 48. | Montpelier | 10.7% | 6.4%(+4.30)#48 | 8.3%(+2.40)#5,053 |
| 49. | Whitingham | 10.5% | 6.4%(+4.10)#49 | 8.3%(+2.20)#5,286 |
| 50. | Manchester Center | 10.4% | 6.4%(+4.00)#50 | 8.3%(+2.10)#5,326 |
| 51. | Graniteville | 10.4% | 6.4%(+4.00)#51 | 8.3%(+2.10)#5,352 |
| 52. | Woodstock | 10.2% | 6.4%(+3.80)#52 | 8.3%(+1.90)#5,527 |
| 53. | Putney | 9.7% | 6.4%(+3.30)#53 | 8.3%(+1.40)#5,983 |
| 54. | Glover | 9.7% | 6.4%(+3.30)#54 | 8.3%(+1.40)#5,992 |
| 55. | Sheffield | 9.7% | 6.4%(+3.30)#55 | 8.3%(+1.40)#5,994 |
| 56. | Irasburg | 9.7% | 6.4%(+3.30)#56 | 8.3%(+1.40)#5,996 |
| 57. | Enosburg Falls | 9.2% | 6.4%(+2.80)#57 | 8.3%(+0.900)#6,472 |
| 58. | Windsor | 9.1% | 6.4%(+2.70)#58 | 8.3%(+0.800)#6,564 |
| 59. | West Brattleboro | 9.0% | 6.4%(+2.60)#59 | 8.3%(+0.700)#6,689 |
| 60. | Morrisville | 9.0% | 6.4%(+2.60)#60 | 8.3%(+0.700)#6,694 |
| 61. | Poultney | 9.0% | 6.4%(+2.60)#61 | 8.3%(+0.700)#6,716 |
| 62. | Greensboro | 8.9% | 6.4%(+2.50)#62 | 8.3%(+0.600)#6,865 |
| 63. | Chelsea | 8.5% | 6.4%(+2.10)#63 | 8.3%(+0.200)#7,309 |
| 64. | Jacksonville | 8.5% | 6.4%(+2.10)#64 | 8.3%(+0.200)#7,324 |
| 65. | Newbury | 8.4% | 6.4%(+2.00)#65 | 8.3%(+0.100)#7,433 |
| 66. | Richford | 8.3% | 6.4%(+1.90)#66 | 8.3%(=0.000)#7,506 |
| 67. | South Shaftsbury | 8.2% | 6.4%(+1.80)#67 | 8.3%(-0.100)#7,680 |
| 68. | Swanton | 8.1% | 6.4%(+1.70)#68 | 8.3%(-0.200)#7,757 |
| 69. | Norwich | 7.8% | 6.4%(+1.40)#69 | 8.3%(-0.500)#8,199 |
| 70. | West Pawlet | 7.4% | 6.4%(+1.00)#70 | 8.3%(-0.900)#8,788 |
| 71. | Vergennes | 7.0% | 6.4%(+0.600)#71 | 8.3%(-1.30)#9,330 |
| 72. | East Dorset | 7.0% | 6.4%(+0.600)#72 | 8.3%(-1.30)#9,402 |
| 73. | South Burlington | 6.9% | 6.4%(+0.500)#73 | 8.3%(-1.40)#9,432 |
| 74. | Essex Junction | 6.9% | 6.4%(+0.500)#74 | 8.3%(-1.40)#9,450 |
| 75. | Hardwick | 6.9% | 6.4%(+0.500)#75 | 8.3%(-1.40)#9,513 |
| 76. | Northfield | 6.8% | 6.4%(+0.400)#76 | 8.3%(-1.50)#9,623 |
| 77. | Pittsford | 6.8% | 6.4%(+0.400)#77 | 8.3%(-1.50)#9,694 |
| 78. | Groton | 6.8% | 6.4%(+0.400)#78 | 8.3%(-1.50)#9,695 |
| 79. | Bristol | 6.7% | 6.4%(+0.300)#79 | 8.3%(-1.60)#9,817 |
| 80. | Cavendish | 6.2% | 6.4%(-0.200)#80 | 8.3%(-2.10)#10,740 |
| 81. | West Burke | 6.2% | 6.4%(-0.200)#81 | 8.3%(-2.10)#10,742 |
| 82. | Chester | 6.1% | 6.4%(-0.300)#82 | 8.3%(-2.20)#10,866 |
| 83. | South Barre | 6.0% | 6.4%(-0.400)#83 | 8.3%(-2.30)#11,048 |
| 84. | Shelburne | 5.8% | 6.4%(-0.600)#84 | 8.3%(-2.50)#11,376 |
| 85. | Proctor | 5.8% | 6.4%(-0.600)#85 | 8.3%(-2.50)#11,418 |
| 86. | Brandon | 5.6% | 6.4%(-0.800)#86 | 8.3%(-2.70)#11,828 |
| 87. | Danby | 5.3% | 6.4%(-1.10)#87 | 8.3%(-3.00)#12,499 |
| 88. | Pownal Center | 5.2% | 6.4%(-1.20)#88 | 8.3%(-3.10)#12,660 |
| 89. | West Woodstock | 5.2% | 6.4%(-1.20)#89 | 8.3%(-3.10)#12,667 |
| 90. | Jeffersonville | 5.1% | 6.4%(-1.30)#90 | 8.3%(-3.20)#12,833 |
| 91. | Canaan | 5.1% | 6.4%(-1.30)#91 | 8.3%(-3.20)#12,863 |
| 92. | Ascutney | 5.0% | 6.4%(-1.40)#92 | 8.3%(-3.30)#13,051 |
| 93. | Arlington | 4.9% | 6.4%(-1.50)#93 | 8.3%(-3.40)#13,181 |
| 94. | Huntington | 4.9% | 6.4%(-1.50)#94 | 8.3%(-3.40)#13,248 |
| 95. | Bethel | 4.5% | 6.4%(-1.90)#95 | 8.3%(-3.80)#14,084 |
| 96. | West Rutland | 4.4% | 6.4%(-2.00)#96 | 8.3%(-3.90)#14,247 |
| 97. | Proctorsville | 4.3% | 6.4%(-2.10)#97 | 8.3%(-4.00)#14,557 |
| 98. | Hinesburg | 4.2% | 6.4%(-2.20)#98 | 8.3%(-4.10)#14,748 |
| 99. | New Haven | 4.0% | 6.4%(-2.40)#99 | 8.3%(-4.30)#15,270 |
| 100. | Fair Haven | 3.9% | 6.4%(-2.50)#100 | 8.3%(-4.40)#15,386 |
1
2Common Questions
What are the Top 10 Cities with the Highest Percentage of Households Without a Vehicle in Vermont?
Top 10 Cities with the Highest Percentage of Households Without a Vehicle in Vermont are:
#1
47.2%
#2
46.0%
#3
28.7%
#4
24.9%
#5
23.3%
#6
22.2%
#7
22.0%
#8
21.9%
#9
20.4%
#10
17.7%
What city has the Highest Percentage of Households Without a Vehicle in Vermont?
Newport Center has the Highest Percentage of Households Without a Vehicle in Vermont with 47.2%.
What is the Percentage of Households Without a Vehicle in the State of Vermont?
Percentage of Households Without a Vehicle in Vermont is 6.4%.
What is the Percentage of Households Without a Vehicle in the United States?
Percentage of Households Without a Vehicle in the United States is 8.3%.