Fort Bragg, CA Map & Demographics
Fort Bragg Map
Fort Bragg Overview
$30,761
PER CAPITA INCOME
$62,017
AVG FAMILY INCOME
$47,662
AVG HOUSEHOLD INCOME
12.2%
WAGE / INCOME GAP [ % ]
87.8¢/ $1
WAGE / INCOME GAP [ $ ]
0.48
INEQUALITY / GINI INDEX
7,007
TOTAL POPULATION
3,099
MALE POPULATION
3,908
FEMALE POPULATION
79.30
MALES / 100 FEMALES
126.11
FEMALES / 100 MALES
46.8
MEDIAN AGE
3.4
AVG FAMILY SIZE
2.2
AVG HOUSEHOLD SIZE
2,550
LABOR FORCE [ PEOPLE ]
47.2%
PERCENT IN LABOR FORCE
6.7%
UNEMPLOYMENT RATE
Fort Bragg Zip Codes
Fort Bragg Area Codes
Income in Fort Bragg
Income Overview in Fort Bragg
Per Capita Income in Fort Bragg is $30,761, while median incomes of families and households are $62,017 and $47,662 respectively.
| Characteristic | Number | Measure |
| Per Capita Income | 7,007 | $30,761 |
| Median Family Income | 1,336 | $62,017 |
| Mean Family Income | 1,336 | $81,924 |
| Median Household Income | 3,059 | $47,662 |
| Mean Household Income | 3,059 | $68,198 |
| Income Deficit | 1,336 | $0 |
| Wage / Income Gap (%) | 7,007 | 12.19% |
| Wage / Income Gap ($) | 7,007 | 87.81¢ per $1 |
| Gini / Inequality Index | 7,007 | 0.48 |
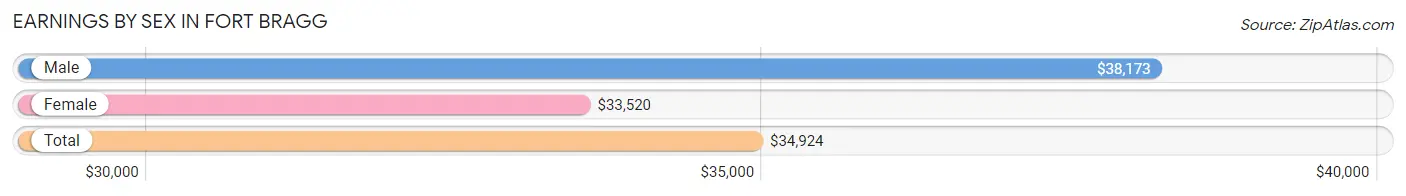
Earnings by Sex in Fort Bragg
Average Earnings in Fort Bragg are $34,924, $38,173 for men and $33,520 for women, a difference of 12.2%.
| Sex | Number | Average Earnings |
| Male | 1,258 (44.2%) | $38,173 |
| Female | 1,587 (55.8%) | $33,520 |
| Total | 2,845 (100.0%) | $34,924 |
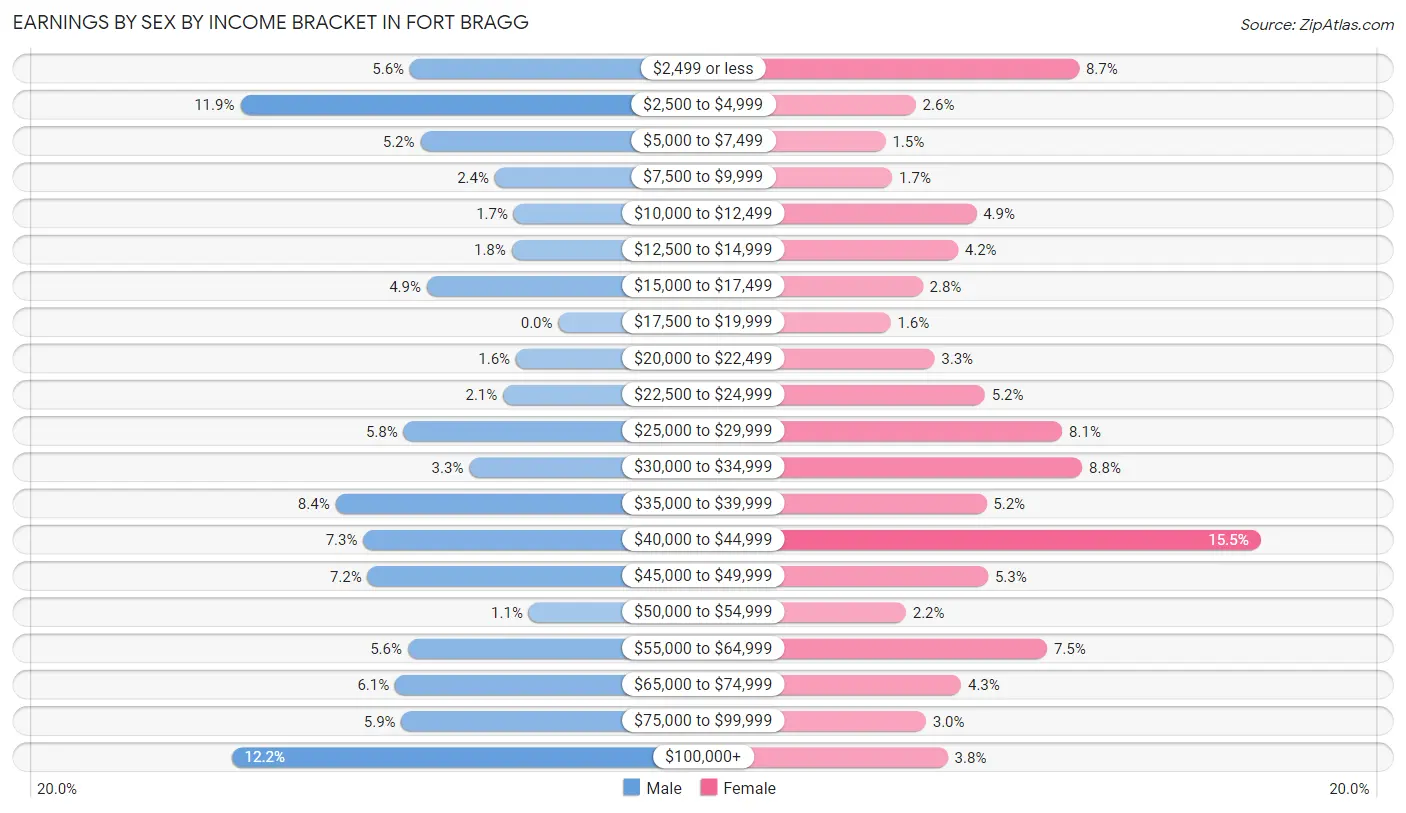
Earnings by Sex by Income Bracket in Fort Bragg
The most common earnings brackets in Fort Bragg are $100,000+ for men (154 | 12.2%) and $40,000 to $44,999 for women (246 | 15.5%).
| Income | Male | Female |
| $2,499 or less | 70 (5.6%) | 138 (8.7%) |
| $2,500 to $4,999 | 150 (11.9%) | 41 (2.6%) |
| $5,000 to $7,499 | 65 (5.2%) | 23 (1.5%) |
| $7,500 to $9,999 | 30 (2.4%) | 27 (1.7%) |
| $10,000 to $12,499 | 21 (1.7%) | 77 (4.9%) |
| $12,500 to $14,999 | 22 (1.8%) | 66 (4.2%) |
| $15,000 to $17,499 | 62 (4.9%) | 45 (2.8%) |
| $17,500 to $19,999 | 0 (0.0%) | 26 (1.6%) |
| $20,000 to $22,499 | 20 (1.6%) | 52 (3.3%) |
| $22,500 to $24,999 | 26 (2.1%) | 82 (5.2%) |
| $25,000 to $29,999 | 73 (5.8%) | 128 (8.1%) |
| $30,000 to $34,999 | 42 (3.3%) | 140 (8.8%) |
| $35,000 to $39,999 | 105 (8.4%) | 83 (5.2%) |
| $40,000 to $44,999 | 92 (7.3%) | 246 (15.5%) |
| $45,000 to $49,999 | 90 (7.1%) | 84 (5.3%) |
| $50,000 to $54,999 | 14 (1.1%) | 35 (2.2%) |
| $55,000 to $64,999 | 71 (5.6%) | 119 (7.5%) |
| $65,000 to $74,999 | 77 (6.1%) | 68 (4.3%) |
| $75,000 to $99,999 | 74 (5.9%) | 47 (3.0%) |
| $100,000+ | 154 (12.2%) | 60 (3.8%) |
| Total | 1,258 (100.0%) | 1,587 (100.0%) |
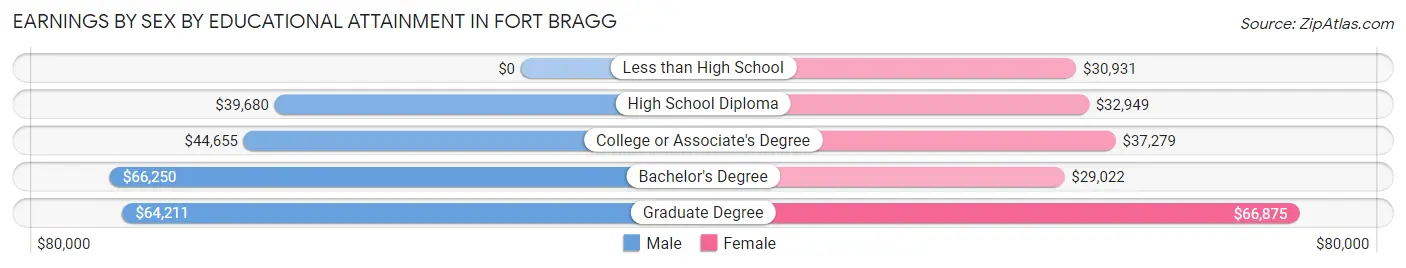
Earnings by Sex by Educational Attainment in Fort Bragg
Average earnings in Fort Bragg are $40,192 for men and $35,075 for women, a difference of 12.7%. Men with an educational attainment of bachelor's degree enjoy the highest average annual earnings of $66,250, while those with high school diploma education earn the least with $39,680. Women with an educational attainment of graduate degree earn the most with the average annual earnings of $66,875, while those with bachelor's degree education have the smallest earnings of $29,022.
| Educational Attainment | Male Income | Female Income |
| Less than High School | - | - |
| High School Diploma | $39,680 | $32,949 |
| College or Associate's Degree | $44,655 | $37,279 |
| Bachelor's Degree | $66,250 | $29,022 |
| Graduate Degree | $64,211 | $66,875 |
| Total | $40,192 | $35,075 |
Family Income in Fort Bragg
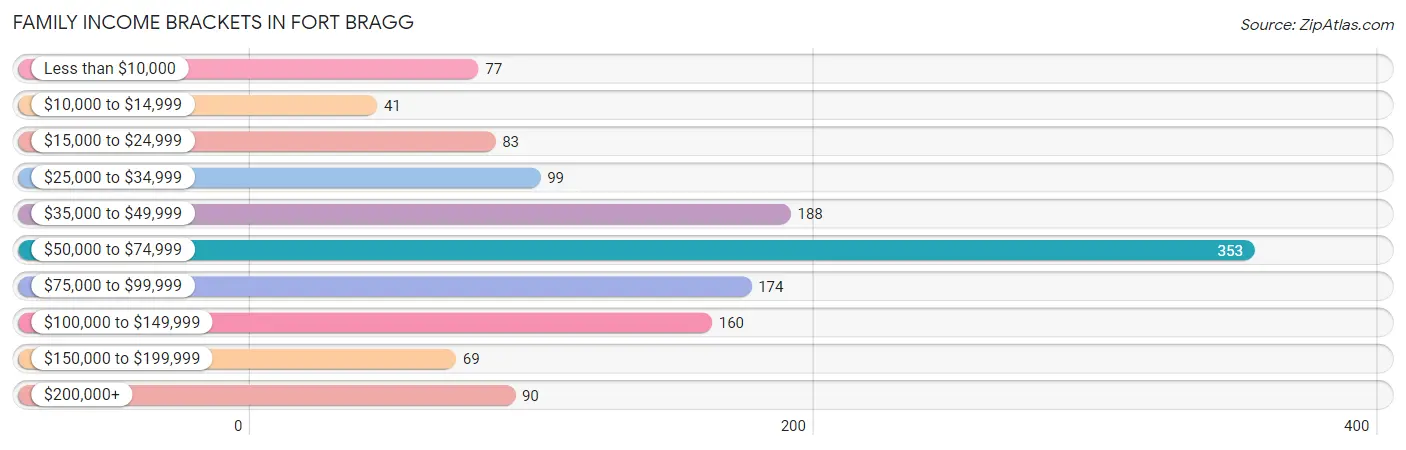
Family Income Brackets in Fort Bragg
According to the Fort Bragg family income data, there are 353 families falling into the $50,000 to $74,999 income range, which is the most common income bracket and makes up 26.4% of all families. Conversely, the $10,000 to $14,999 income bracket is the least frequent group with only 41 families (3.1%) belonging to this category.
| Income Bracket | # Families | % Families |
| Less than $10,000 | 77 | 5.8% |
| $10,000 to $14,999 | 41 | 3.1% |
| $15,000 to $24,999 | 83 | 6.2% |
| $25,000 to $34,999 | 99 | 7.4% |
| $35,000 to $49,999 | 188 | 14.1% |
| $50,000 to $74,999 | 353 | 26.4% |
| $75,000 to $99,999 | 174 | 13.0% |
| $100,000 to $149,999 | 160 | 12.0% |
| $150,000 to $199,999 | 69 | 5.2% |
| $200,000+ | 90 | 6.7% |
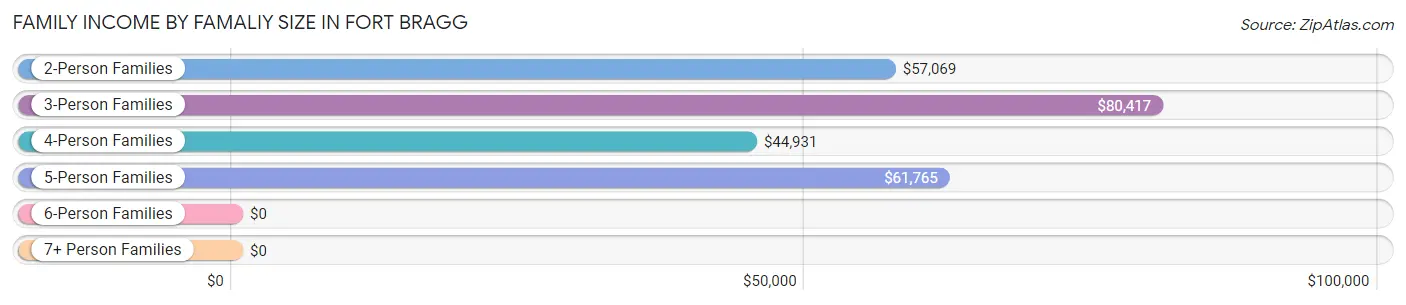
Family Income by Famaliy Size in Fort Bragg
3-person families (197 | 14.7%) account for the highest median family income in Fort Bragg with $80,417 per family, while 2-person families (726 | 54.3%) have the highest median income of $28,534 per family member.
| Income Bracket | # Families | Median Income |
| 2-Person Families | 726 (54.3%) | $57,069 |
| 3-Person Families | 197 (14.7%) | $80,417 |
| 4-Person Families | 250 (18.7%) | $44,931 |
| 5-Person Families | 72 (5.4%) | $61,765 |
| 6-Person Families | 24 (1.8%) | $0 |
| 7+ Person Families | 67 (5.0%) | $0 |
| Total | 1,336 (100.0%) | $62,017 |
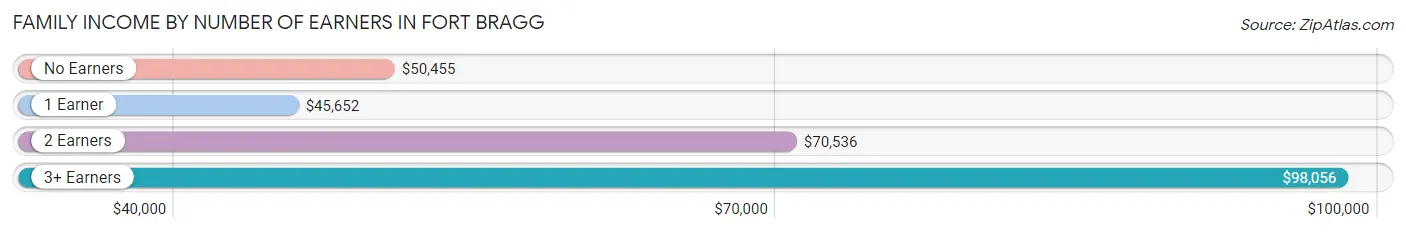
Family Income by Number of Earners in Fort Bragg
The median family income in Fort Bragg is $62,017, with families comprising 3+ earners (104) having the highest median family income of $98,056, while families with 1 earner (442) have the lowest median family income of $45,652, accounting for 7.8% and 33.1% of families, respectively.
| Number of Earners | # Families | Median Income |
| No Earners | 292 (21.9%) | $50,455 |
| 1 Earner | 442 (33.1%) | $45,652 |
| 2 Earners | 498 (37.3%) | $70,536 |
| 3+ Earners | 104 (7.8%) | $98,056 |
| Total | 1,336 (100.0%) | $62,017 |
Household Income in Fort Bragg
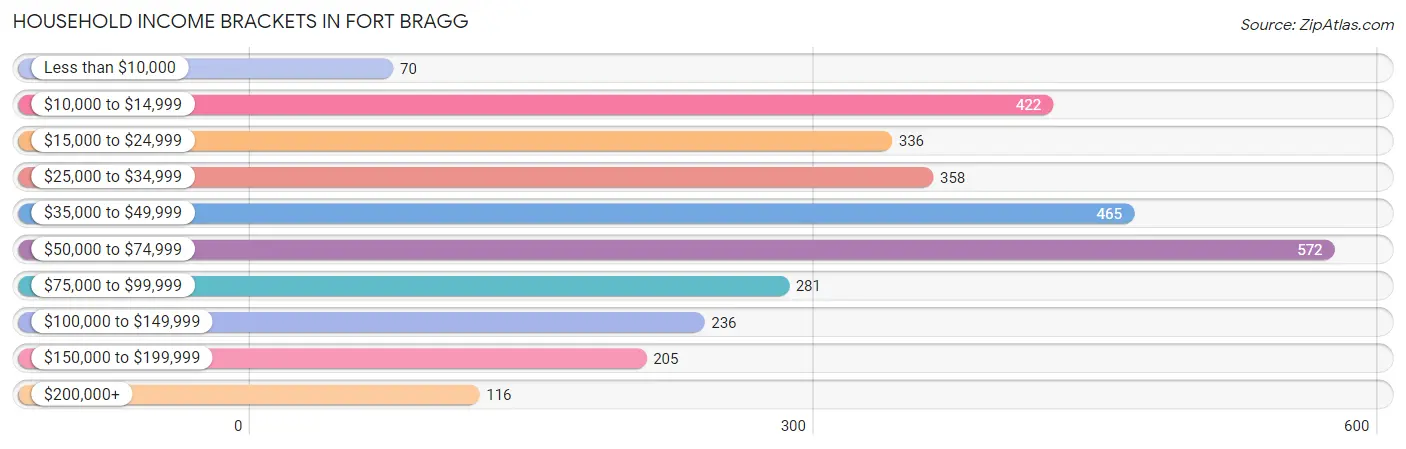
Household Income Brackets in Fort Bragg
With 572 households falling in the category, the $50,000 to $74,999 income range is the most frequent in Fort Bragg, accounting for 18.7% of all households. In contrast, only 70 households (2.3%) fall into the less than $10,000 income bracket, making it the least populous group.
| Income Bracket | # Households | % Households |
| Less than $10,000 | 70 | 2.3% |
| $10,000 to $14,999 | 422 | 13.8% |
| $15,000 to $24,999 | 336 | 11.0% |
| $25,000 to $34,999 | 358 | 11.7% |
| $35,000 to $49,999 | 465 | 15.2% |
| $50,000 to $74,999 | 572 | 18.7% |
| $75,000 to $99,999 | 281 | 9.2% |
| $100,000 to $149,999 | 236 | 7.7% |
| $150,000 to $199,999 | 205 | 6.7% |
| $200,000+ | 116 | 3.8% |
Household Income by Householder Age in Fort Bragg
The median household income in Fort Bragg is $47,662, with the highest median household income of $59,688 found in the 25 to 44 years age bracket for the primary householder. A total of 669 households (21.9%) fall into this category. Meanwhile, the 15 to 24 years age bracket for the primary householder has the lowest median household income of $0, with 36 households (1.2%) in this group.
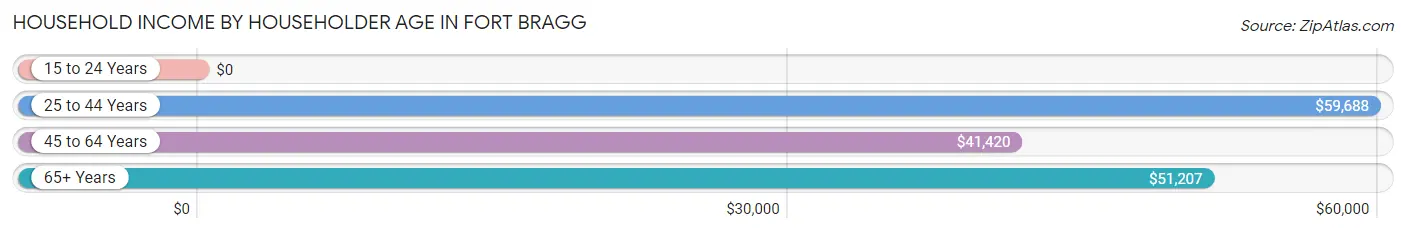
| Income Bracket | # Households | Median Income |
| 15 to 24 Years | 36 (1.2%) | $0 |
| 25 to 44 Years | 669 (21.9%) | $59,688 |
| 45 to 64 Years | 1,316 (43.0%) | $41,420 |
| 65+ Years | 1,038 (33.9%) | $51,207 |
| Total | 3,059 (100.0%) | $47,662 |
Poverty in Fort Bragg
Income Below Poverty by Sex and Age in Fort Bragg
With 21.1% poverty level for males and 23.7% for females among the residents of Fort Bragg, 6 to 11 year old males and 18 to 24 year old females are the most vulnerable to poverty, with 89 males (49.2%) and 76 females (62.8%) in their respective age groups living below the poverty level.
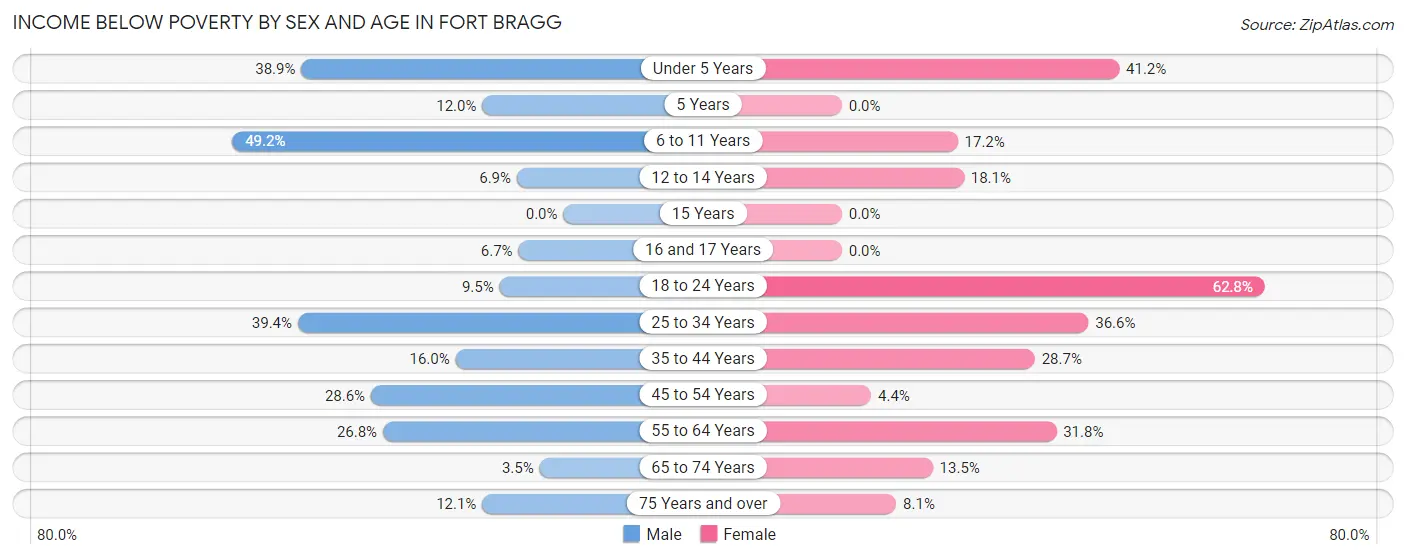
| Age Bracket | Male | Female |
| Under 5 Years | 107 (38.9%) | 133 (41.2%) |
| 5 Years | 13 (12.0%) | 0 (0.0%) |
| 6 to 11 Years | 89 (49.2%) | 65 (17.2%) |
| 12 to 14 Years | 8 (6.9%) | 29 (18.1%) |
| 15 Years | 0 (0.0%) | 0 (0.0%) |
| 16 and 17 Years | 7 (6.7%) | 0 (0.0%) |
| 18 to 24 Years | 16 (9.5%) | 76 (62.8%) |
| 25 to 34 Years | 82 (39.4%) | 157 (36.6%) |
| 35 to 44 Years | 57 (16.0%) | 98 (28.6%) |
| 45 to 54 Years | 86 (28.6%) | 16 (4.3%) |
| 55 to 64 Years | 127 (26.8%) | 234 (31.8%) |
| 65 to 74 Years | 15 (3.5%) | 78 (13.5%) |
| 75 Years and over | 40 (12.0%) | 28 (8.1%) |
| Total | 647 (21.1%) | 914 (23.7%) |
Income Above Poverty by Sex and Age in Fort Bragg
According to the poverty statistics in Fort Bragg, males aged 15 years and females aged 15 years are the age groups that are most secure financially, with 100.0% of males and 100.0% of females in these age groups living above the poverty line.
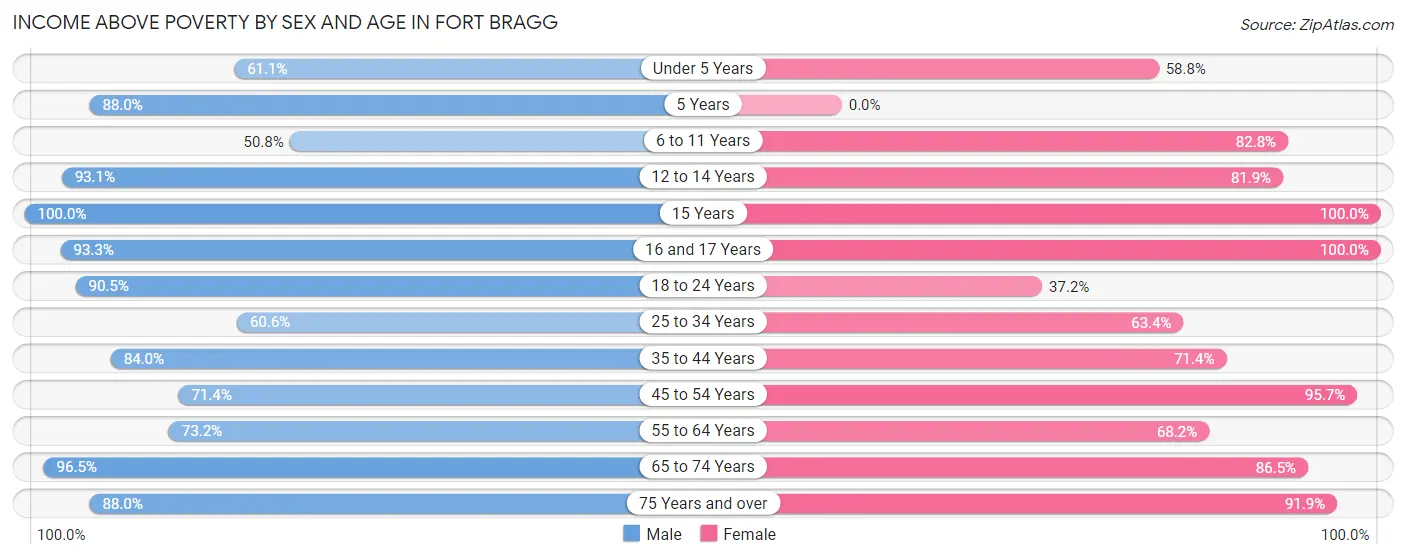
| Age Bracket | Male | Female |
| Under 5 Years | 168 (61.1%) | 190 (58.8%) |
| 5 Years | 95 (88.0%) | 0 (0.0%) |
| 6 to 11 Years | 92 (50.8%) | 313 (82.8%) |
| 12 to 14 Years | 108 (93.1%) | 131 (81.9%) |
| 15 Years | 12 (100.0%) | 25 (100.0%) |
| 16 and 17 Years | 98 (93.3%) | 44 (100.0%) |
| 18 to 24 Years | 153 (90.5%) | 45 (37.2%) |
| 25 to 34 Years | 126 (60.6%) | 272 (63.4%) |
| 35 to 44 Years | 299 (84.0%) | 244 (71.4%) |
| 45 to 54 Years | 215 (71.4%) | 352 (95.7%) |
| 55 to 64 Years | 347 (73.2%) | 501 (68.2%) |
| 65 to 74 Years | 409 (96.5%) | 500 (86.5%) |
| 75 Years and over | 292 (87.9%) | 319 (91.9%) |
| Total | 2,414 (78.9%) | 2,936 (76.3%) |
Income Below Poverty Among Married-Couple Families in Fort Bragg
The poverty statistics for married-couple families in Fort Bragg show that 11.8% or 100 of the total 848 families live below the poverty line. Families with 5 or more children have the highest poverty rate of 100.0%, comprising of 17 families. On the other hand, families with 3 or 4 children have the lowest poverty rate of 0.0%, which includes 0 families.
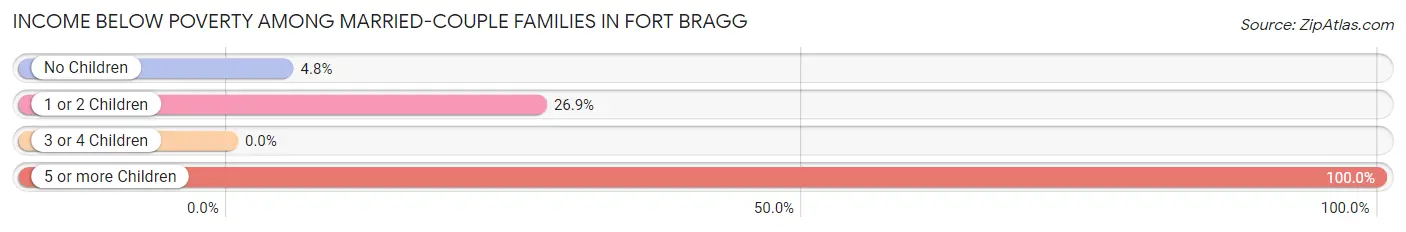
| Children | Above Poverty | Below Poverty |
| No Children | 511 (95.2%) | 26 (4.8%) |
| 1 or 2 Children | 155 (73.1%) | 57 (26.9%) |
| 3 or 4 Children | 82 (100.0%) | 0 (0.0%) |
| 5 or more Children | 0 (0.0%) | 17 (100.0%) |
| Total | 748 (88.2%) | 100 (11.8%) |
Income Below Poverty Among Single-Parent Households in Fort Bragg
According to the poverty data in Fort Bragg, 24.6% or 32 single-father households and 20.1% or 72 single-mother households are living below the poverty line. Among single-father households, those with 1 or 2 children have the highest poverty rate, with 32 households (29.9%) experiencing poverty. Likewise, among single-mother households, those with no children have the highest poverty rate, with 20 households (24.1%) falling below the poverty line.
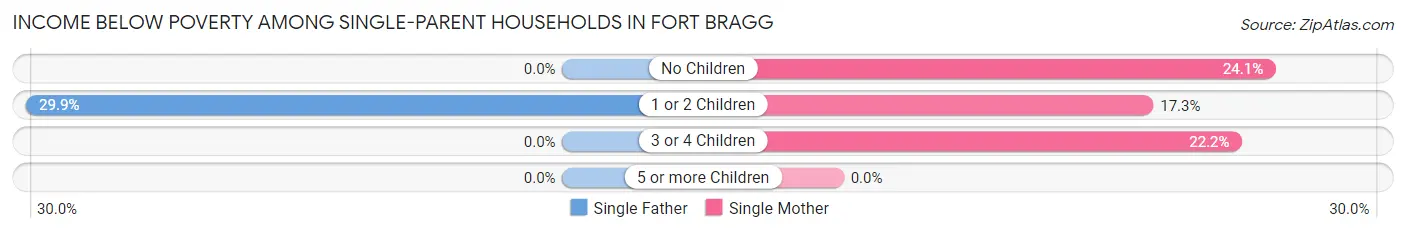
| Children | Single Father | Single Mother |
| No Children | 0 (0.0%) | 20 (24.1%) |
| 1 or 2 Children | 32 (29.9%) | 32 (17.3%) |
| 3 or 4 Children | 0 (0.0%) | 20 (22.2%) |
| 5 or more Children | 0 (0.0%) | 0 (0.0%) |
| Total | 32 (24.6%) | 72 (20.1%) |
Income Below Poverty Among Married-Couple vs Single-Parent Households in Fort Bragg
The poverty data for Fort Bragg shows that 100 of the married-couple family households (11.8%) and 104 of the single-parent households (21.3%) are living below the poverty level. Within the married-couple family households, those with 5 or more children have the highest poverty rate, with 17 households (100.0%) falling below the poverty line. Among the single-parent households, those with 1 or 2 children have the highest poverty rate, with 64 household (21.9%) living below poverty.
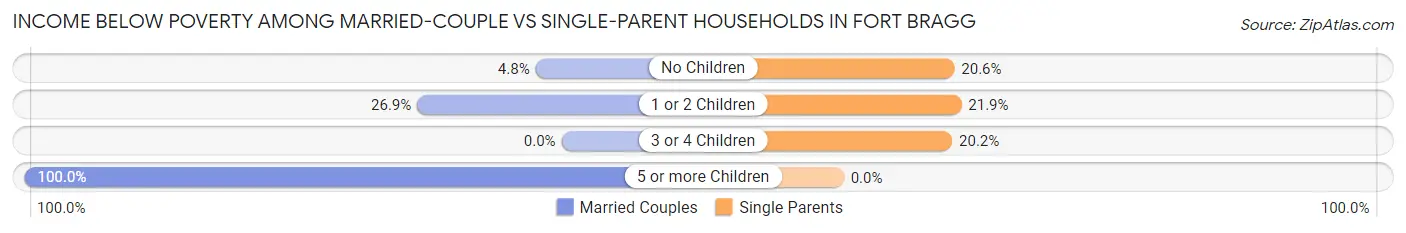
| Children | Married-Couple Families | Single-Parent Households |
| No Children | 26 (4.8%) | 20 (20.6%) |
| 1 or 2 Children | 57 (26.9%) | 64 (21.9%) |
| 3 or 4 Children | 0 (0.0%) | 20 (20.2%) |
| 5 or more Children | 17 (100.0%) | 0 (0.0%) |
| Total | 100 (11.8%) | 104 (21.3%) |
Race in Fort Bragg
The most populous races in Fort Bragg are White / Caucasian (5,132 | 73.2%), Hispanic or Latino (2,328 | 33.2%), and Two or more Races (964 | 13.8%).
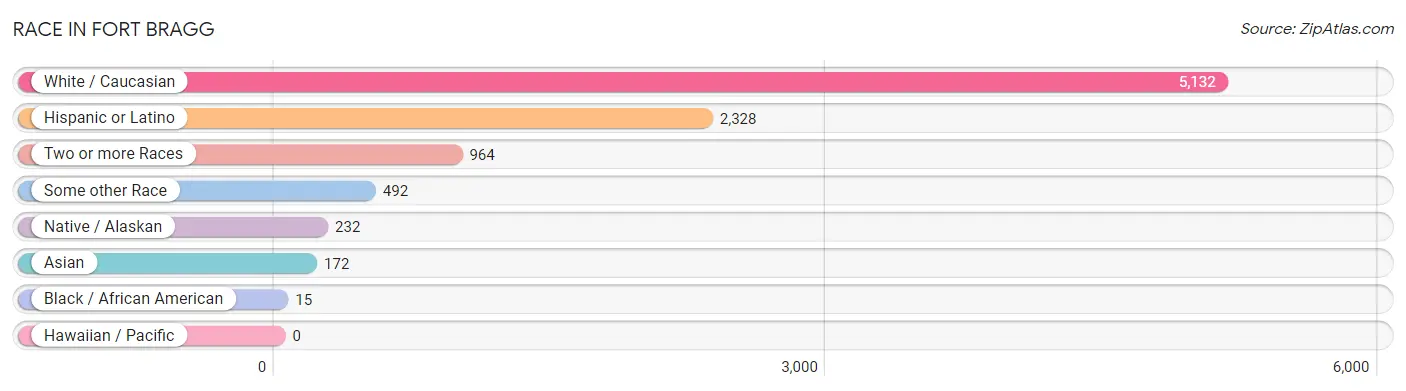
| Race | # Population | % Population |
| Asian | 172 | 2.5% |
| Black / African American | 15 | 0.2% |
| Hawaiian / Pacific | 0 | 0.0% |
| Hispanic or Latino | 2,328 | 33.2% |
| Native / Alaskan | 232 | 3.3% |
| White / Caucasian | 5,132 | 73.2% |
| Two or more Races | 964 | 13.8% |
| Some other Race | 492 | 7.0% |
| Total | 7,007 | 100.0% |
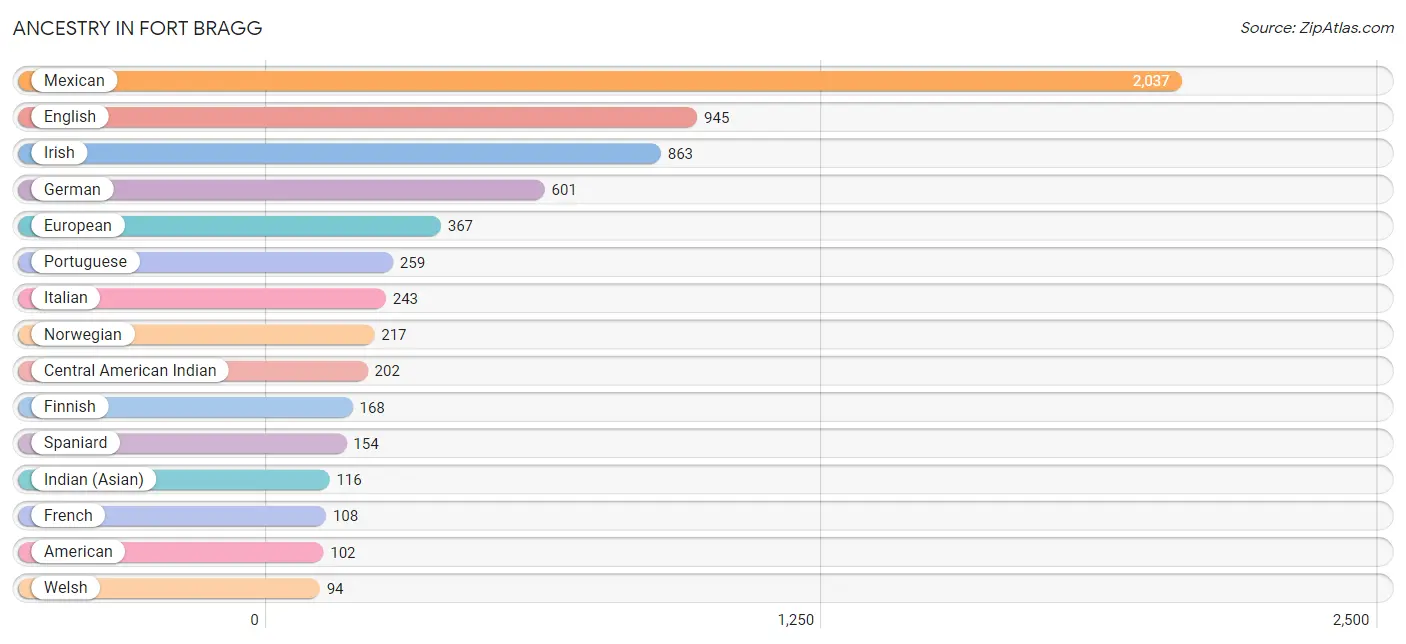
Ancestry in Fort Bragg
The most populous ancestries reported in Fort Bragg are Mexican (2,037 | 29.1%), English (945 | 13.5%), Irish (863 | 12.3%), German (601 | 8.6%), and European (367 | 5.2%), together accounting for 68.7% of all Fort Bragg residents.
| Ancestry | # Population | % Population |
| African | 9 | 0.1% |
| American | 102 | 1.5% |
| Apache | 15 | 0.2% |
| Arab | 21 | 0.3% |
| Austrian | 9 | 0.1% |
| Bhutanese | 13 | 0.2% |
| Blackfeet | 9 | 0.1% |
| British | 27 | 0.4% |
| Central American | 42 | 0.6% |
| Central American Indian | 202 | 2.9% |
| Cherokee | 4 | 0.1% |
| Chippewa | 14 | 0.2% |
| Choctaw | 12 | 0.2% |
| Colombian | 17 | 0.2% |
| Czech | 5 | 0.1% |
| Danish | 36 | 0.5% |
| Dutch | 79 | 1.1% |
| Eastern European | 36 | 0.5% |
| Ecuadorian | 10 | 0.1% |
| English | 945 | 13.5% |
| European | 367 | 5.2% |
| Finnish | 168 | 2.4% |
| French | 108 | 1.5% |
| French Canadian | 6 | 0.1% |
| German | 601 | 8.6% |
| Greek | 4 | 0.1% |
| Guatemalan | 7 | 0.1% |
| Honduran | 20 | 0.3% |
| Hungarian | 14 | 0.2% |
| Indian (Asian) | 116 | 1.7% |
| Irish | 863 | 12.3% |
| Italian | 243 | 3.5% |
| Korean | 4 | 0.1% |
| Lebanese | 21 | 0.3% |
| Lithuanian | 6 | 0.1% |
| Malaysian | 43 | 0.6% |
| Mexican | 2,037 | 29.1% |
| Mexican American Indian | 11 | 0.2% |
| Northern European | 33 | 0.5% |
| Norwegian | 217 | 3.1% |
| Pakistani | 63 | 0.9% |
| Polish | 27 | 0.4% |
| Portuguese | 259 | 3.7% |
| Puerto Rican | 48 | 0.7% |
| Romanian | 52 | 0.7% |
| Russian | 22 | 0.3% |
| Salvadoran | 15 | 0.2% |
| Scandinavian | 34 | 0.5% |
| Scotch-Irish | 50 | 0.7% |
| Scottish | 74 | 1.1% |
| South American | 27 | 0.4% |
| Spaniard | 154 | 2.2% |
| Subsaharan African | 9 | 0.1% |
| Swedish | 71 | 1.0% |
| Ukrainian | 5 | 0.1% |
| Welsh | 94 | 1.3% |
| Yaqui | 36 | 0.5% | View All 57 Rows |
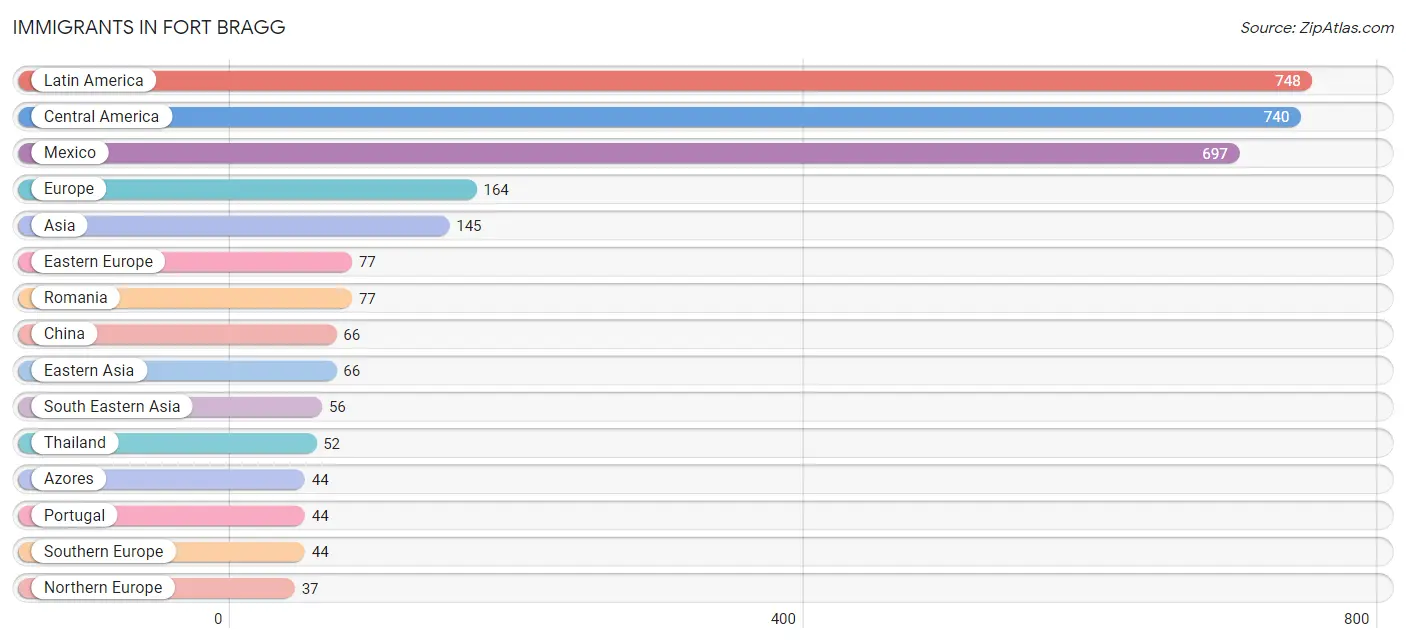
Immigrants in Fort Bragg
The most numerous immigrant groups reported in Fort Bragg came from Latin America (748 | 10.7%), Central America (740 | 10.6%), Mexico (697 | 10.0%), Europe (164 | 2.3%), and Asia (145 | 2.1%), together accounting for 35.6% of all Fort Bragg residents.
| Immigration Origin | # Population | % Population |
| Asia | 145 | 2.1% |
| Azores | 44 | 0.6% |
| Canada | 6 | 0.1% |
| Central America | 740 | 10.6% |
| China | 66 | 0.9% |
| Colombia | 8 | 0.1% |
| Eastern Asia | 66 | 0.9% |
| Eastern Europe | 77 | 1.1% |
| El Salvador | 15 | 0.2% |
| England | 28 | 0.4% |
| Europe | 164 | 2.3% |
| Guatemala | 8 | 0.1% |
| Honduras | 20 | 0.3% |
| India | 23 | 0.3% |
| Latin America | 748 | 10.7% |
| Mexico | 697 | 10.0% |
| Northern Europe | 37 | 0.5% |
| Philippines | 4 | 0.1% |
| Portugal | 44 | 0.6% |
| Romania | 77 | 1.1% |
| South America | 8 | 0.1% |
| South Central Asia | 23 | 0.3% |
| South Eastern Asia | 56 | 0.8% |
| Southern Europe | 44 | 0.6% |
| Sweden | 9 | 0.1% |
| Thailand | 52 | 0.7% | View All 26 Rows |
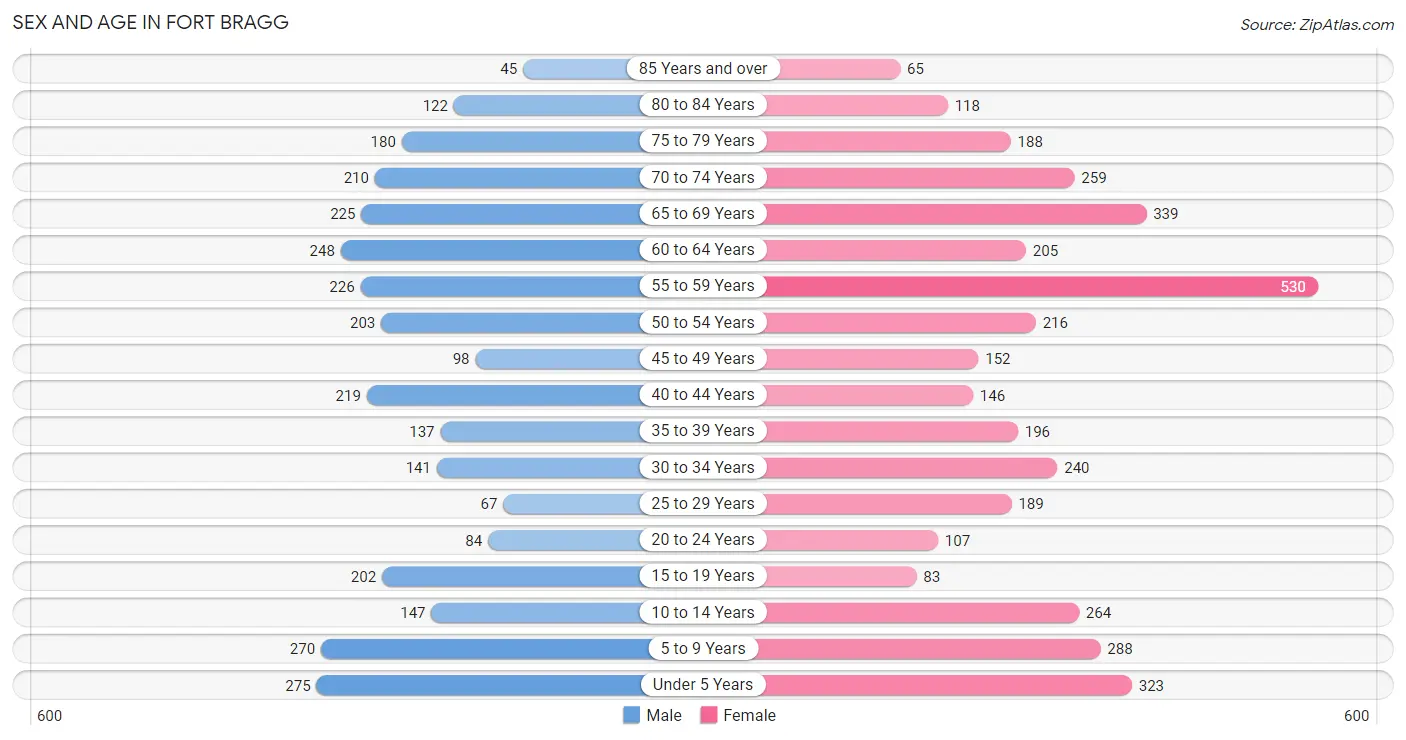
Sex and Age in Fort Bragg
Sex and Age in Fort Bragg
The most populous age groups in Fort Bragg are Under 5 Years (275 | 8.9%) for men and 55 to 59 Years (530 | 13.6%) for women.
| Age Bracket | Male | Female |
| Under 5 Years | 275 (8.9%) | 323 (8.3%) |
| 5 to 9 Years | 270 (8.7%) | 288 (7.4%) |
| 10 to 14 Years | 147 (4.7%) | 264 (6.8%) |
| 15 to 19 Years | 202 (6.5%) | 83 (2.1%) |
| 20 to 24 Years | 84 (2.7%) | 107 (2.7%) |
| 25 to 29 Years | 67 (2.2%) | 189 (4.8%) |
| 30 to 34 Years | 141 (4.5%) | 240 (6.1%) |
| 35 to 39 Years | 137 (4.4%) | 196 (5.0%) |
| 40 to 44 Years | 219 (7.1%) | 146 (3.7%) |
| 45 to 49 Years | 98 (3.2%) | 152 (3.9%) |
| 50 to 54 Years | 203 (6.6%) | 216 (5.5%) |
| 55 to 59 Years | 226 (7.3%) | 530 (13.6%) |
| 60 to 64 Years | 248 (8.0%) | 205 (5.2%) |
| 65 to 69 Years | 225 (7.3%) | 339 (8.7%) |
| 70 to 74 Years | 210 (6.8%) | 259 (6.6%) |
| 75 to 79 Years | 180 (5.8%) | 188 (4.8%) |
| 80 to 84 Years | 122 (3.9%) | 118 (3.0%) |
| 85 Years and over | 45 (1.5%) | 65 (1.7%) |
| Total | 3,099 (100.0%) | 3,908 (100.0%) |
Families and Households in Fort Bragg
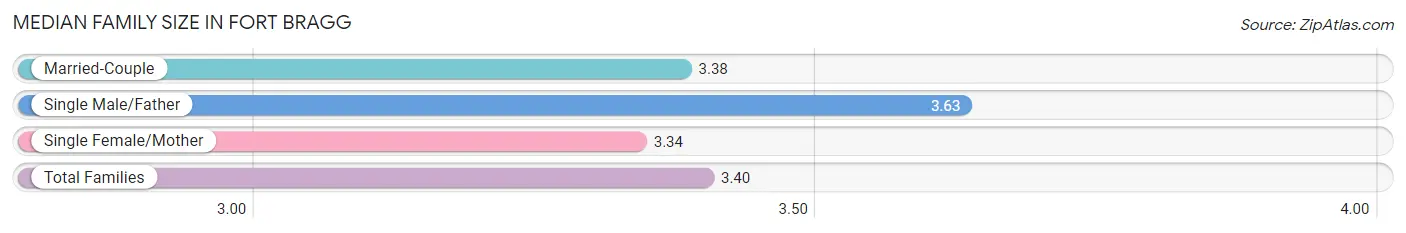
Median Family Size in Fort Bragg
The median family size in Fort Bragg is 3.40 persons per family, with single male/father families (130 | 9.7%) accounting for the largest median family size of 3.63 persons per family. On the other hand, single female/mother families (358 | 26.8%) represent the smallest median family size with 3.34 persons per family.
| Family Type | # Families | Family Size |
| Married-Couple | 848 (63.5%) | 3.38 |
| Single Male/Father | 130 (9.7%) | 3.63 |
| Single Female/Mother | 358 (26.8%) | 3.34 |
| Total Families | 1,336 (100.0%) | 3.40 |
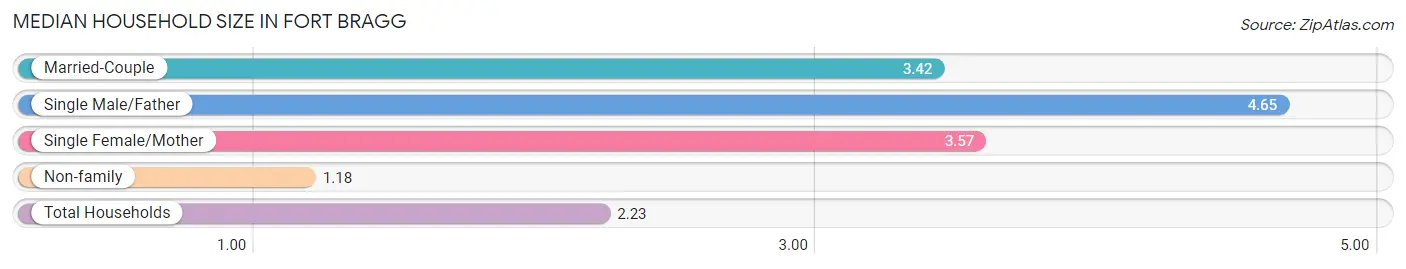
Median Household Size in Fort Bragg
The median household size in Fort Bragg is 2.23 persons per household, with single male/father households (130 | 4.3%) accounting for the largest median household size of 4.65 persons per household. non-family households (1,723 | 56.3%) represent the smallest median household size with 1.18 persons per household.
| Household Type | # Households | Household Size |
| Married-Couple | 848 (27.7%) | 3.42 |
| Single Male/Father | 130 (4.3%) | 4.65 |
| Single Female/Mother | 358 (11.7%) | 3.57 |
| Non-family | 1,723 (56.3%) | 1.18 |
| Total Households | 3,059 (100.0%) | 2.23 |
Household Size by Marriage Status in Fort Bragg
Out of a total of 3,059 households in Fort Bragg, 1,336 (43.7%) are family households, while 1,723 (56.3%) are nonfamily households. The most numerous type of family households are 2-person households, comprising 636, and the most common type of nonfamily households are 1-person households, comprising 1,491.
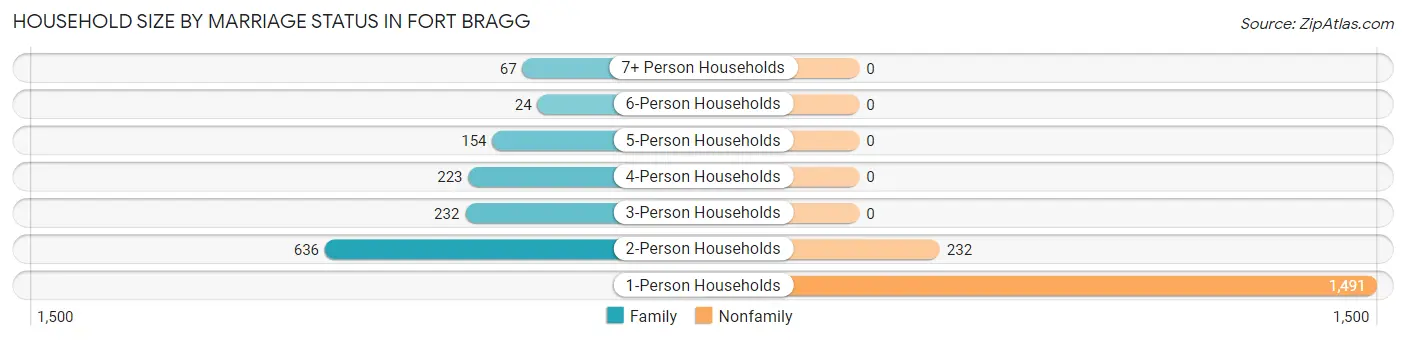
| Household Size | Family Households | Nonfamily Households |
| 1-Person Households | - | 1,491 (48.7%) |
| 2-Person Households | 636 (20.8%) | 232 (7.6%) |
| 3-Person Households | 232 (7.6%) | 0 (0.0%) |
| 4-Person Households | 223 (7.3%) | 0 (0.0%) |
| 5-Person Households | 154 (5.0%) | 0 (0.0%) |
| 6-Person Households | 24 (0.8%) | 0 (0.0%) |
| 7+ Person Households | 67 (2.2%) | 0 (0.0%) |
| Total | 1,336 (43.7%) | 1,723 (56.3%) |
Female Fertility in Fort Bragg
Fertility by Age in Fort Bragg
Average fertility rate in Fort Bragg is 73.0 births per 1,000 women. Women in the age bracket of 20 to 34 years have the highest fertility rate with 157.0 births per 1,000 women. Women in the age bracket of 20 to 34 years acount for 100.0% of all women with births.
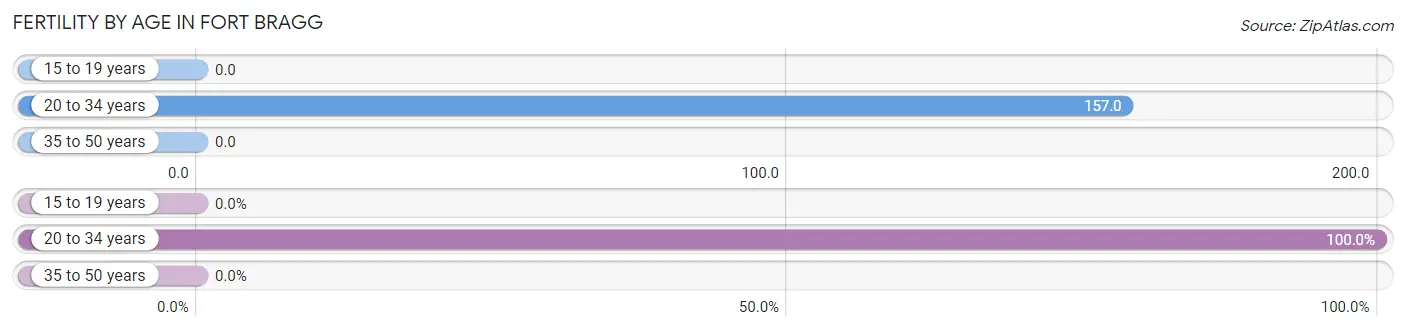
| Age Bracket | Women with Births | Births / 1,000 Women |
| 15 to 19 years | 0 (0.0%) | 0.0 |
| 20 to 34 years | 84 (100.0%) | 157.0 |
| 35 to 50 years | 0 (0.0%) | 0.0 |
| Total | 84 (100.0%) | 73.0 |
Fertility by Age by Marriage Status in Fort Bragg
38.1% of women with births (84) in Fort Bragg are married. The highest percentage of unmarried women with births falls into 20 to 34 years age bracket with 61.9% of them unmarried at the time of birth, while the lowest percentage of unmarried women with births belong to 20 to 34 years age bracket with 61.9% of them unmarried.
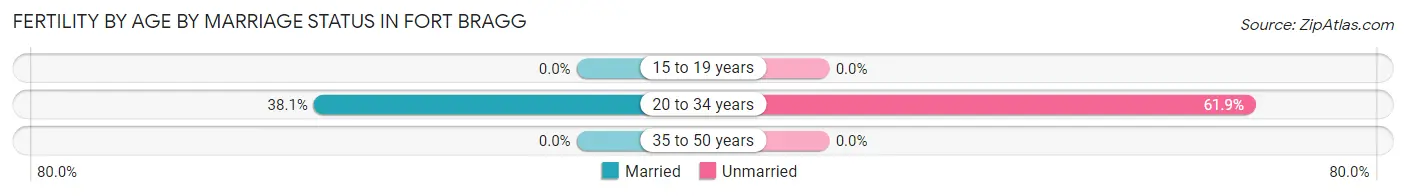
| Age Bracket | Married | Unmarried |
| 15 to 19 years | 0 (0.0%) | 0 (0.0%) |
| 20 to 34 years | 32 (38.1%) | 52 (61.9%) |
| 35 to 50 years | 0 (0.0%) | 0 (0.0%) |
| Total | 32 (38.1%) | 52 (61.9%) |
Fertility by Education in Fort Bragg
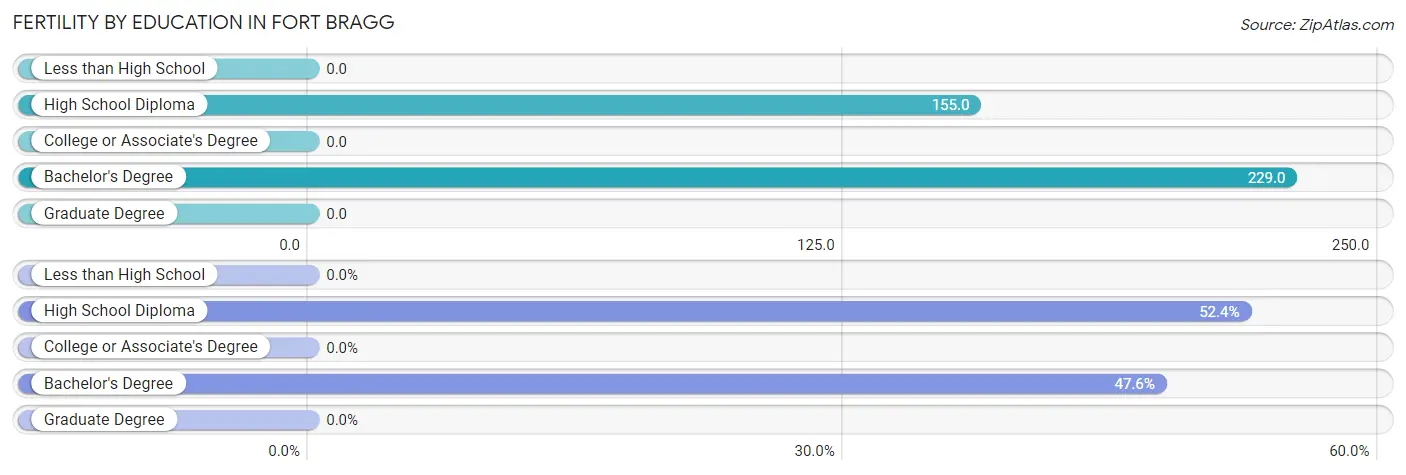
| Educational Attainment | Women with Births | Births / 1,000 Women |
| Less than High School | 0 (0.0%) | 0.0 |
| High School Diploma | 44 (52.4%) | 155.0 |
| College or Associate's Degree | 0 (0.0%) | 0.0 |
| Bachelor's Degree | 40 (47.6%) | 229.0 |
| Graduate Degree | 0 (0.0%) | 0.0 |
| Total | 84 (100.0%) | 73.0 |
Fertility by Education by Marriage Status in Fort Bragg
61.9% of women with births in Fort Bragg are unmarried. Women with the educational attainment of bachelor's degree are most likely to be married with 80.0% of them married at childbirth, while women with the educational attainment of high school diploma are least likely to be married with 100.0% of them unmarried at childbirth.
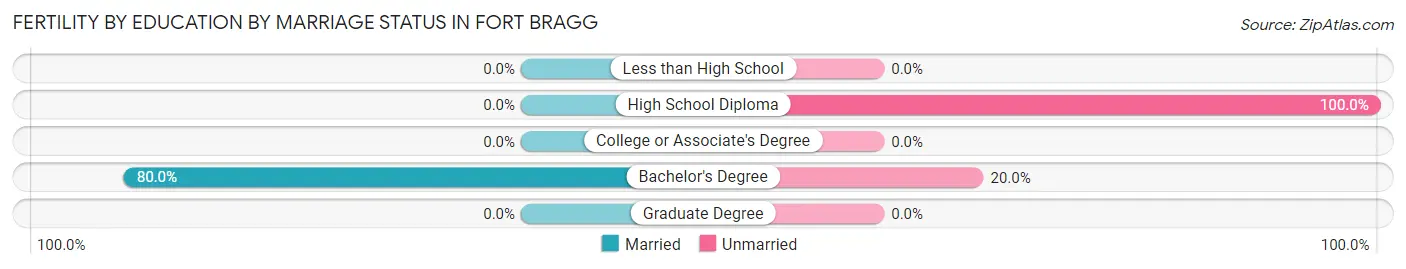
| Educational Attainment | Married | Unmarried |
| Less than High School | 0 (0.0%) | 0 (0.0%) |
| High School Diploma | 0 (0.0%) | 44 (100.0%) |
| College or Associate's Degree | 0 (0.0%) | 0 (0.0%) |
| Bachelor's Degree | 32 (80.0%) | 8 (20.0%) |
| Graduate Degree | 0 (0.0%) | 0 (0.0%) |
| Total | 32 (38.1%) | 52 (61.9%) |
Employment Characteristics in Fort Bragg
Employment by Class of Employer in Fort Bragg
Among the 2,320 employed individuals in Fort Bragg, private company employees (1,219 | 52.5%), self-employed (not incorporated) (364 | 15.7%), and not-for-profit organizations (341 | 14.7%) make up the most common classes of employment.
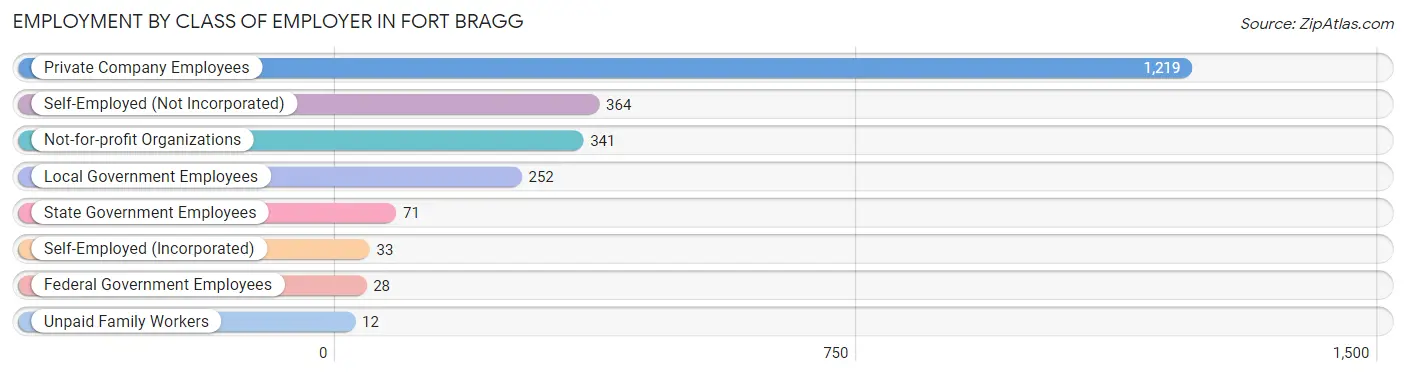
| Employer Class | # Employees | % Employees |
| Private Company Employees | 1,219 | 52.5% |
| Self-Employed (Incorporated) | 33 | 1.4% |
| Self-Employed (Not Incorporated) | 364 | 15.7% |
| Not-for-profit Organizations | 341 | 14.7% |
| Local Government Employees | 252 | 10.9% |
| State Government Employees | 71 | 3.1% |
| Federal Government Employees | 28 | 1.2% |
| Unpaid Family Workers | 12 | 0.5% |
| Total | 2,320 | 100.0% |
Employment Status by Age in Fort Bragg
According to the labor force statistics for Fort Bragg, out of the total population over 16 years of age (5,403), 47.2% or 2,550 individuals are in the labor force, with 6.7% or 171 of them unemployed. The age group with the highest labor force participation rate is 20 to 24 years, with 92.7% or 177 individuals in the labor force. Within the labor force, the 25 to 29 years age range has the highest percentage of unemployed individuals, with 21.9% or 39 of them being unemployed.
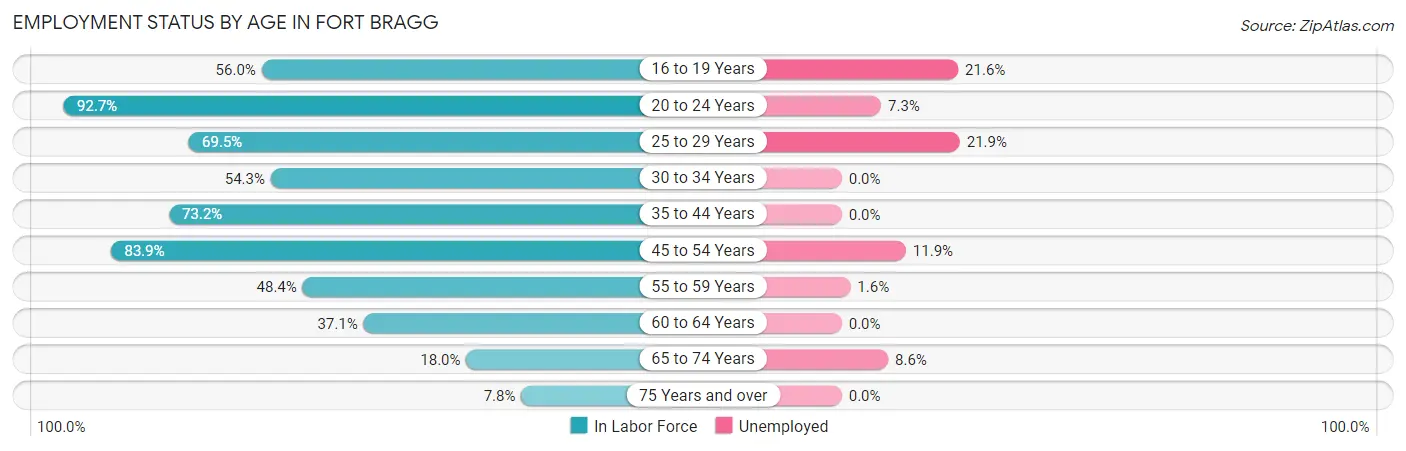
| Age Bracket | In Labor Force | Unemployed |
| 16 to 19 Years | 139 (56.0%) | 30 (21.6%) |
| 20 to 24 Years | 177 (92.7%) | 13 (7.3%) |
| 25 to 29 Years | 178 (69.5%) | 39 (21.9%) |
| 30 to 34 Years | 207 (54.3%) | 0 (0.0%) |
| 35 to 44 Years | 511 (73.2%) | 0 (0.0%) |
| 45 to 54 Years | 561 (83.9%) | 67 (11.9%) |
| 55 to 59 Years | 366 (48.4%) | 6 (1.6%) |
| 60 to 64 Years | 168 (37.1%) | 0 (0.0%) |
| 65 to 74 Years | 186 (18.0%) | 16 (8.6%) |
| 75 Years and over | 56 (7.8%) | 0 (0.0%) |
| Total | 2,550 (47.2%) | 171 (6.7%) |
Employment Status by Educational Attainment in Fort Bragg
According to labor force statistics for Fort Bragg, 62.0% of individuals (1,992) out of the total population between 25 and 64 years of age (3,213) are in the labor force, with 5.7% or 114 of them being unemployed. The group with the highest labor force participation rate are those with the educational attainment of less than high school, with 77.4% or 319 individuals in the labor force. Within the labor force, individuals with less than high school education have the highest percentage of unemployment, with 17.9% or 57 of them being unemployed.
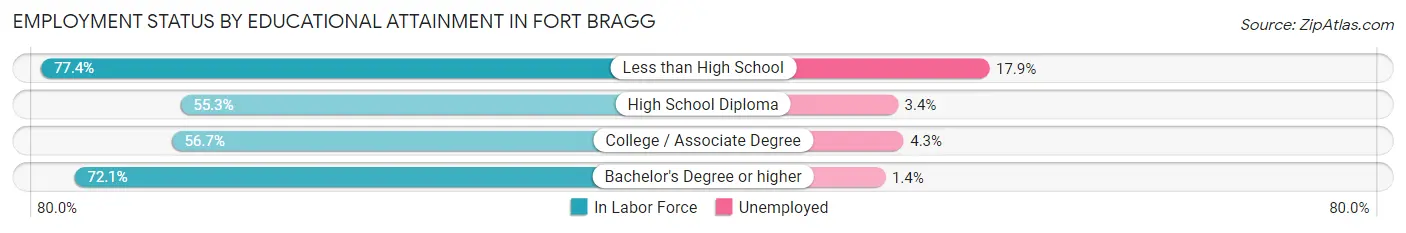
| Educational Attainment | In Labor Force | Unemployed |
| Less than High School | 319 (77.4%) | 74 (17.9%) |
| High School Diploma | 466 (55.3%) | 29 (3.4%) |
| College / Associate Degree | 763 (56.7%) | 58 (4.3%) |
| Bachelor's Degree or higher | 443 (72.1%) | 9 (1.4%) |
| Total | 1,992 (62.0%) | 183 (5.7%) |
Employment Occupations by Sex in Fort Bragg
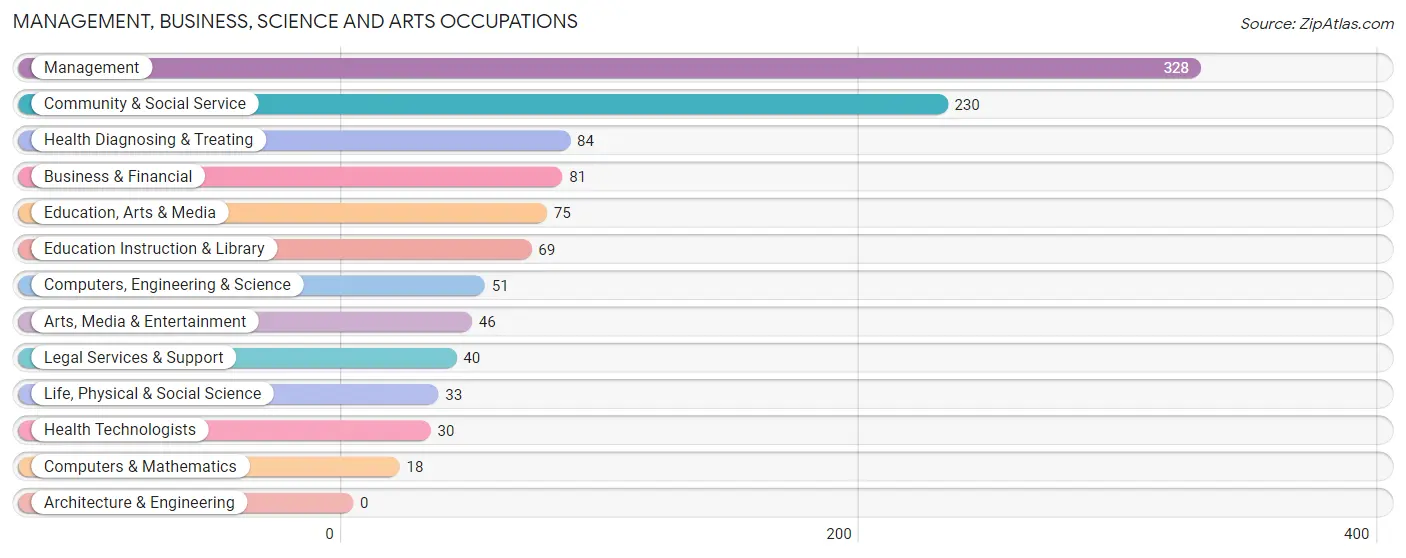
Management, Business, Science and Arts Occupations
The most common Management, Business, Science and Arts occupations in Fort Bragg are Management (328 | 13.9%), Community & Social Service (230 | 9.7%), Health Diagnosing & Treating (84 | 3.5%), Business & Financial (81 | 3.4%), and Education, Arts & Media (75 | 3.2%).
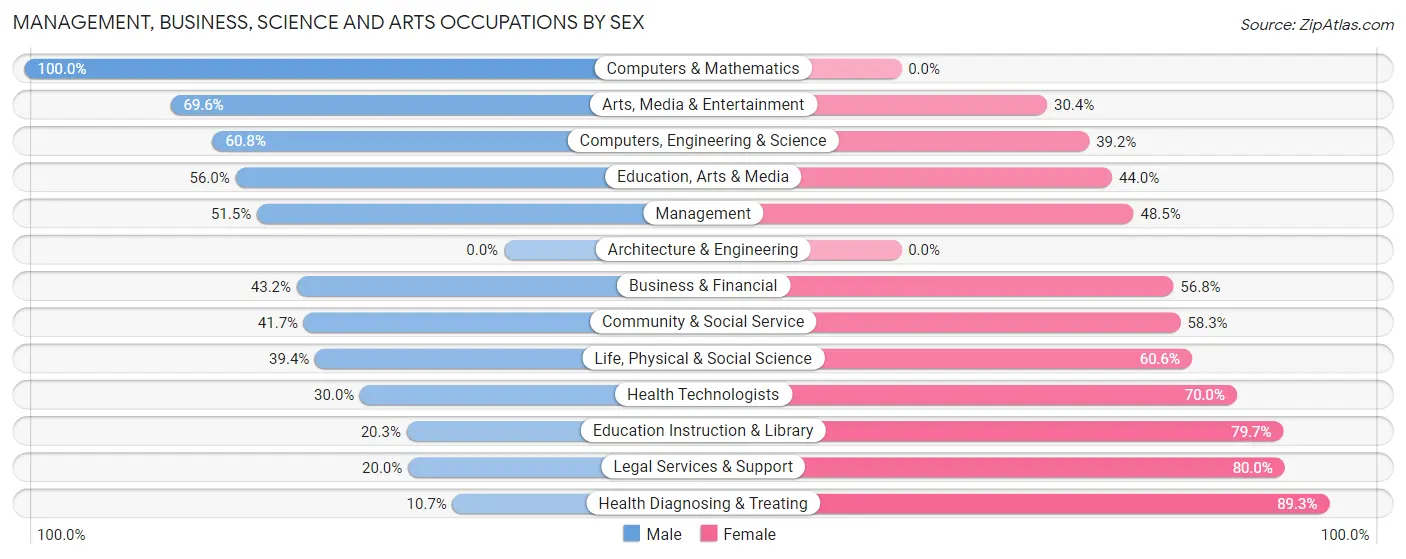
Management, Business, Science and Arts Occupations by Sex
Within the Management, Business, Science and Arts occupations in Fort Bragg, the most male-oriented occupations are Computers & Mathematics (100.0%), Arts, Media & Entertainment (69.6%), and Computers, Engineering & Science (60.8%), while the most female-oriented occupations are Health Diagnosing & Treating (89.3%), Legal Services & Support (80.0%), and Education Instruction & Library (79.7%).
| Occupation | Male | Female |
| Management | 169 (51.5%) | 159 (48.5%) |
| Business & Financial | 35 (43.2%) | 46 (56.8%) |
| Computers, Engineering & Science | 31 (60.8%) | 20 (39.2%) |
| Computers & Mathematics | 18 (100.0%) | 0 (0.0%) |
| Architecture & Engineering | 0 (0.0%) | 0 (0.0%) |
| Life, Physical & Social Science | 13 (39.4%) | 20 (60.6%) |
| Community & Social Service | 96 (41.7%) | 134 (58.3%) |
| Education, Arts & Media | 42 (56.0%) | 33 (44.0%) |
| Legal Services & Support | 8 (20.0%) | 32 (80.0%) |
| Education Instruction & Library | 14 (20.3%) | 55 (79.7%) |
| Arts, Media & Entertainment | 32 (69.6%) | 14 (30.4%) |
| Health Diagnosing & Treating | 9 (10.7%) | 75 (89.3%) |
| Health Technologists | 9 (30.0%) | 21 (70.0%) |
| Total (Category) | 340 (43.9%) | 434 (56.1%) |
| Total (Overall) | 1,004 (42.4%) | 1,364 (57.6%) |
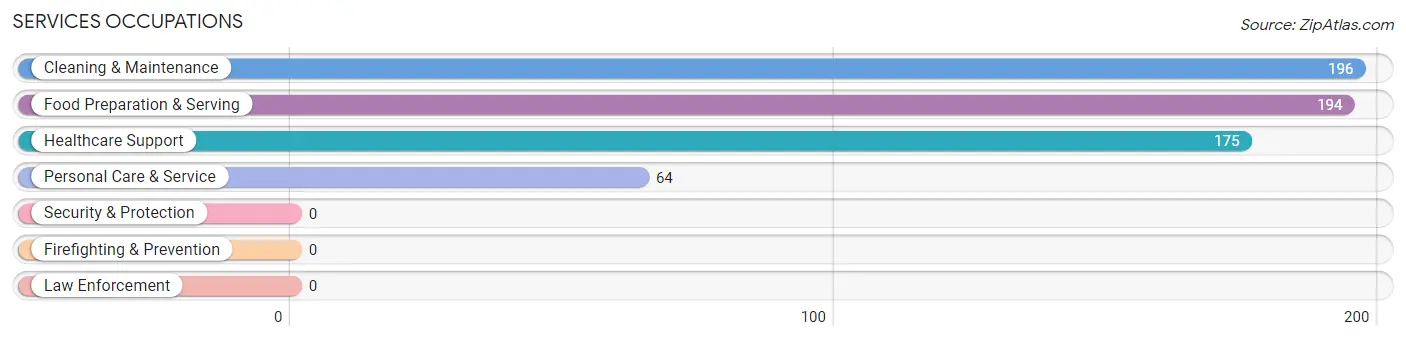
Services Occupations
The most common Services occupations in Fort Bragg are Cleaning & Maintenance (196 | 8.3%), Food Preparation & Serving (194 | 8.2%), Healthcare Support (175 | 7.4%), and Personal Care & Service (64 | 2.7%).
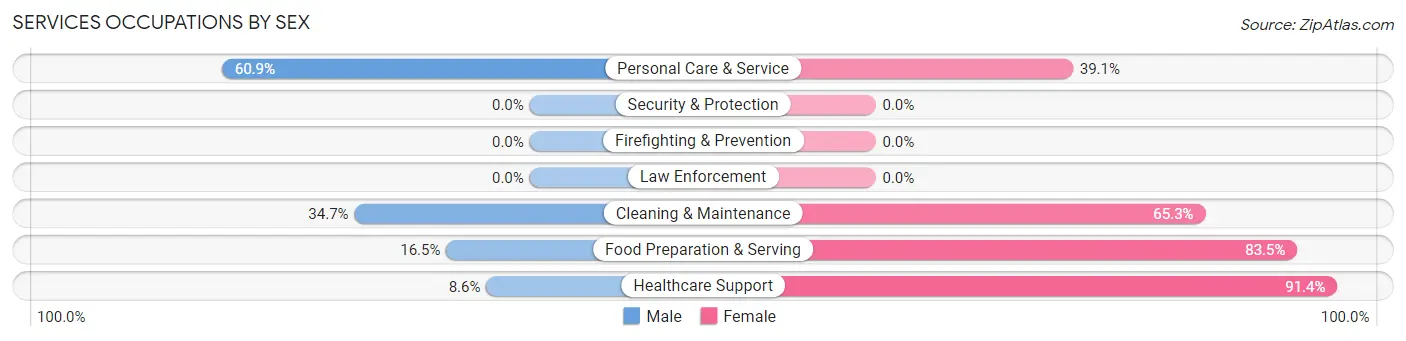
Services Occupations by Sex
Within the Services occupations in Fort Bragg, the most male-oriented occupations are Personal Care & Service (60.9%), Cleaning & Maintenance (34.7%), and Food Preparation & Serving (16.5%), while the most female-oriented occupations are Healthcare Support (91.4%), Food Preparation & Serving (83.5%), and Cleaning & Maintenance (65.3%).
| Occupation | Male | Female |
| Healthcare Support | 15 (8.6%) | 160 (91.4%) |
| Security & Protection | 0 (0.0%) | 0 (0.0%) |
| Firefighting & Prevention | 0 (0.0%) | 0 (0.0%) |
| Law Enforcement | 0 (0.0%) | 0 (0.0%) |
| Food Preparation & Serving | 32 (16.5%) | 162 (83.5%) |
| Cleaning & Maintenance | 68 (34.7%) | 128 (65.3%) |
| Personal Care & Service | 39 (60.9%) | 25 (39.1%) |
| Total (Category) | 154 (24.5%) | 475 (75.5%) |
| Total (Overall) | 1,004 (42.4%) | 1,364 (57.6%) |
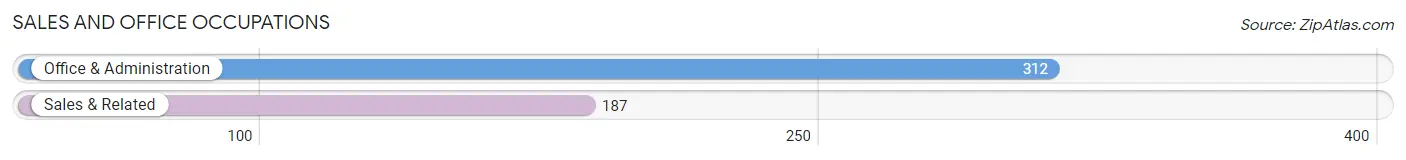
Sales and Office Occupations
The most common Sales and Office occupations in Fort Bragg are Office & Administration (312 | 13.2%), and Sales & Related (187 | 7.9%).
Sales and Office Occupations by Sex
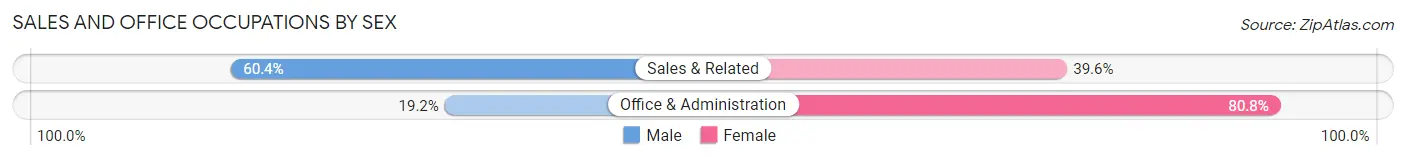
| Occupation | Male | Female |
| Sales & Related | 113 (60.4%) | 74 (39.6%) |
| Office & Administration | 60 (19.2%) | 252 (80.8%) |
| Total (Category) | 173 (34.7%) | 326 (65.3%) |
| Total (Overall) | 1,004 (42.4%) | 1,364 (57.6%) |
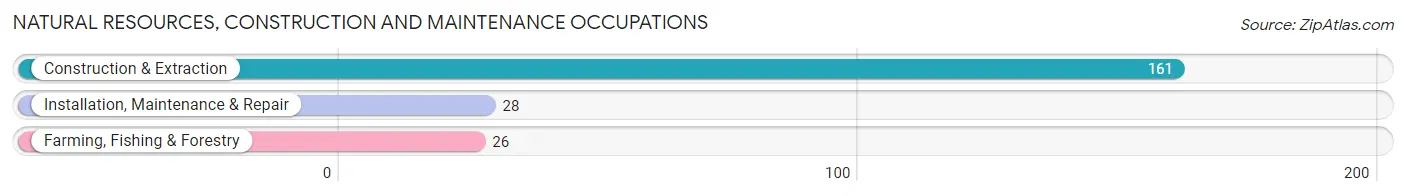
Natural Resources, Construction and Maintenance Occupations
The most common Natural Resources, Construction and Maintenance occupations in Fort Bragg are Construction & Extraction (161 | 6.8%), Installation, Maintenance & Repair (28 | 1.2%), and Farming, Fishing & Forestry (26 | 1.1%).
Natural Resources, Construction and Maintenance Occupations by Sex
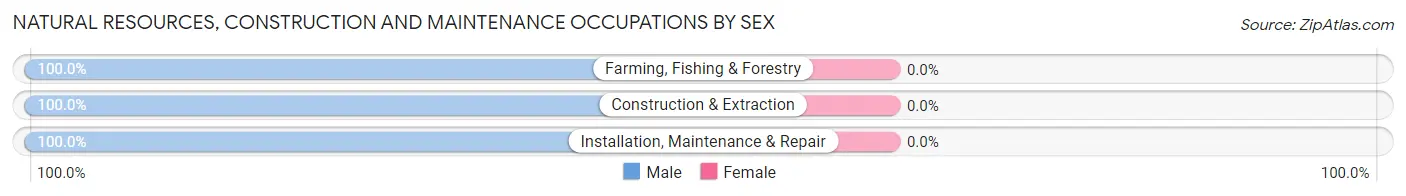
| Occupation | Male | Female |
| Farming, Fishing & Forestry | 26 (100.0%) | 0 (0.0%) |
| Construction & Extraction | 161 (100.0%) | 0 (0.0%) |
| Installation, Maintenance & Repair | 28 (100.0%) | 0 (0.0%) |
| Total (Category) | 215 (100.0%) | 0 (0.0%) |
| Total (Overall) | 1,004 (42.4%) | 1,364 (57.6%) |
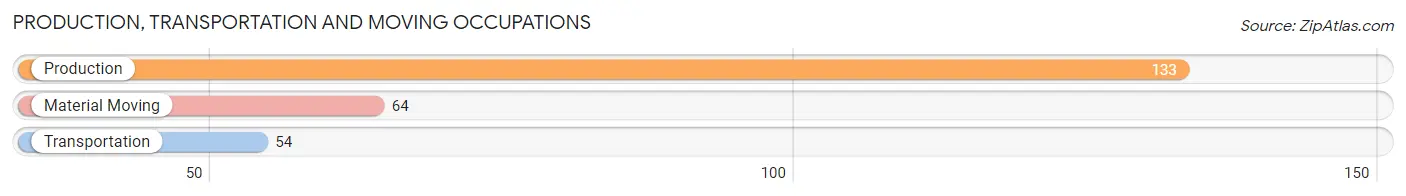
Production, Transportation and Moving Occupations
The most common Production, Transportation and Moving occupations in Fort Bragg are Production (133 | 5.6%), Material Moving (64 | 2.7%), and Transportation (54 | 2.3%).
Production, Transportation and Moving Occupations by Sex
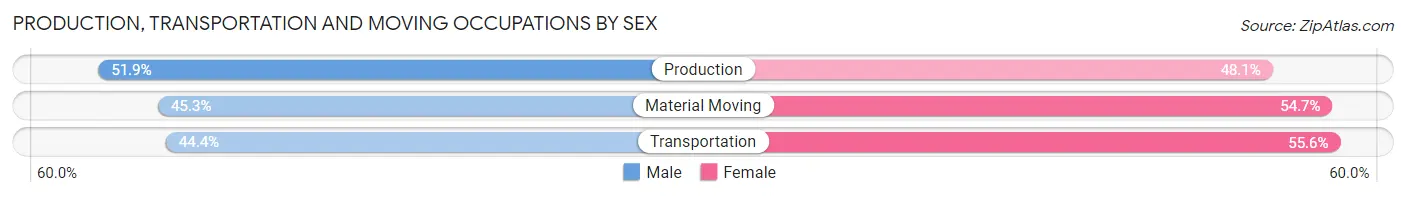
| Occupation | Male | Female |
| Production | 69 (51.9%) | 64 (48.1%) |
| Transportation | 24 (44.4%) | 30 (55.6%) |
| Material Moving | 29 (45.3%) | 35 (54.7%) |
| Total (Category) | 122 (48.6%) | 129 (51.4%) |
| Total (Overall) | 1,004 (42.4%) | 1,364 (57.6%) |
Employment Industries by Sex in Fort Bragg
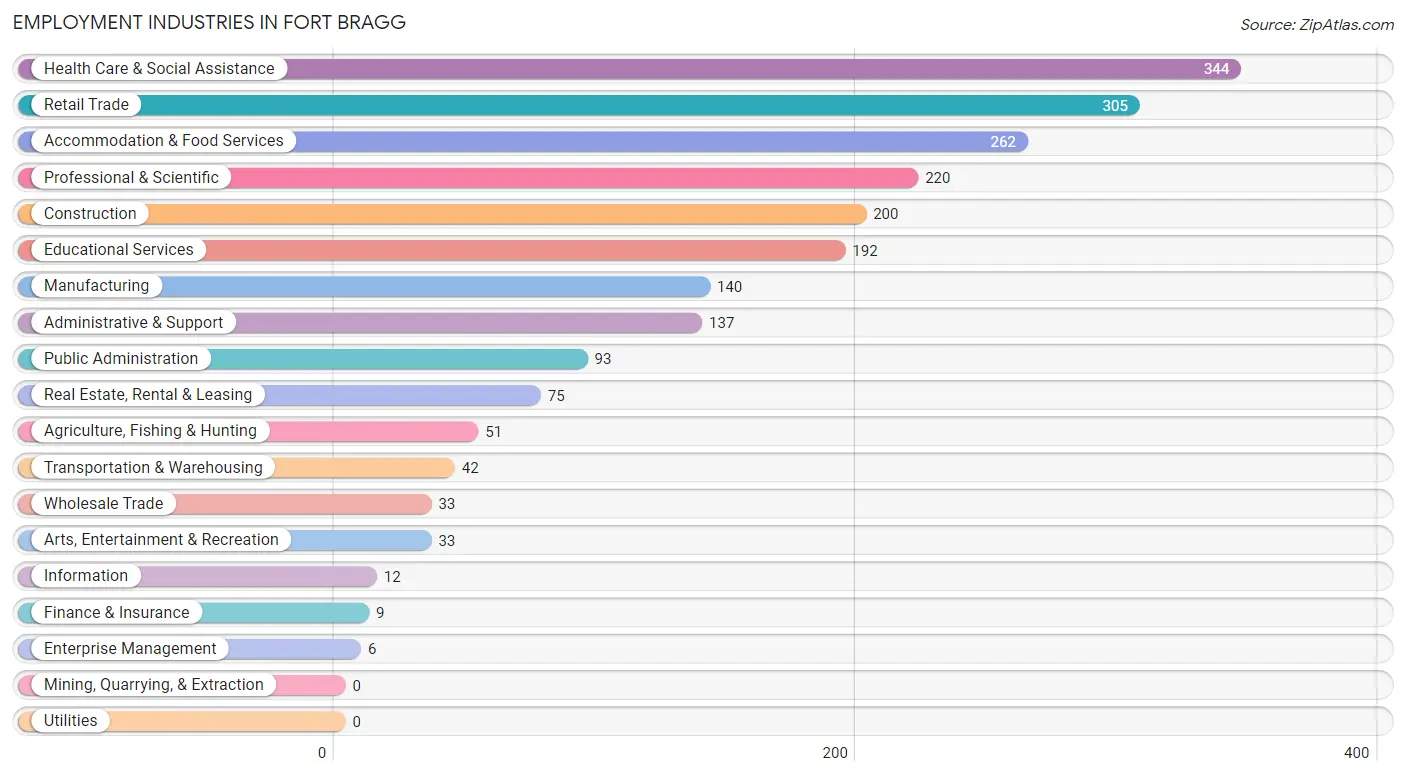
Employment Industries in Fort Bragg
The major employment industries in Fort Bragg include Health Care & Social Assistance (344 | 14.5%), Retail Trade (305 | 12.9%), Accommodation & Food Services (262 | 11.1%), Professional & Scientific (220 | 9.3%), and Construction (200 | 8.5%).
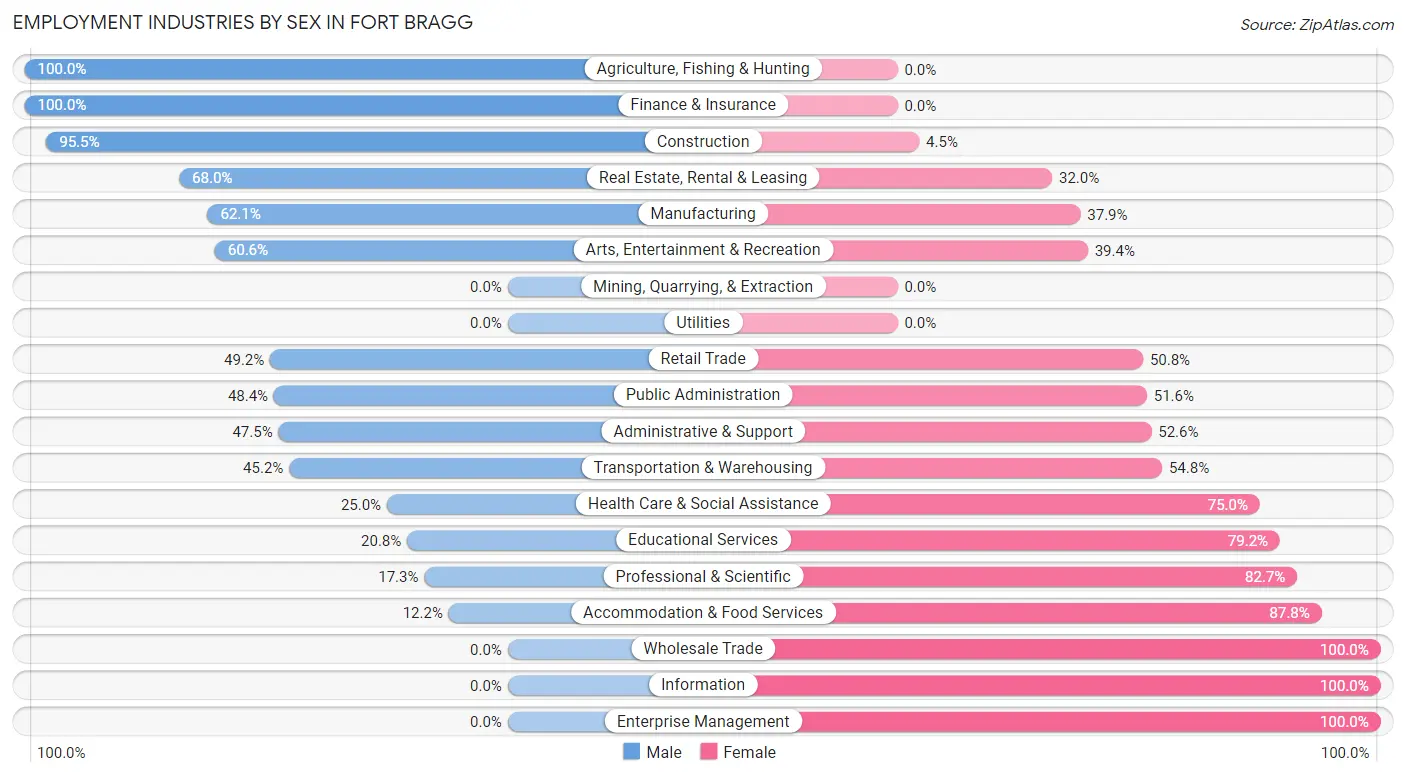
Employment Industries by Sex in Fort Bragg
The Fort Bragg industries that see more men than women are Agriculture, Fishing & Hunting (100.0%), Finance & Insurance (100.0%), and Construction (95.5%), whereas the industries that tend to have a higher number of women are Wholesale Trade (100.0%), Information (100.0%), and Enterprise Management (100.0%).
| Industry | Male | Female |
| Agriculture, Fishing & Hunting | 51 (100.0%) | 0 (0.0%) |
| Mining, Quarrying, & Extraction | 0 (0.0%) | 0 (0.0%) |
| Construction | 191 (95.5%) | 9 (4.5%) |
| Manufacturing | 87 (62.1%) | 53 (37.9%) |
| Wholesale Trade | 0 (0.0%) | 33 (100.0%) |
| Retail Trade | 150 (49.2%) | 155 (50.8%) |
| Transportation & Warehousing | 19 (45.2%) | 23 (54.8%) |
| Utilities | 0 (0.0%) | 0 (0.0%) |
| Information | 0 (0.0%) | 12 (100.0%) |
| Finance & Insurance | 9 (100.0%) | 0 (0.0%) |
| Real Estate, Rental & Leasing | 51 (68.0%) | 24 (32.0%) |
| Professional & Scientific | 38 (17.3%) | 182 (82.7%) |
| Enterprise Management | 0 (0.0%) | 6 (100.0%) |
| Administrative & Support | 65 (47.4%) | 72 (52.5%) |
| Educational Services | 40 (20.8%) | 152 (79.2%) |
| Health Care & Social Assistance | 86 (25.0%) | 258 (75.0%) |
| Arts, Entertainment & Recreation | 20 (60.6%) | 13 (39.4%) |
| Accommodation & Food Services | 32 (12.2%) | 230 (87.8%) |
| Public Administration | 45 (48.4%) | 48 (51.6%) |
| Total | 1,004 (42.4%) | 1,364 (57.6%) |
Education in Fort Bragg
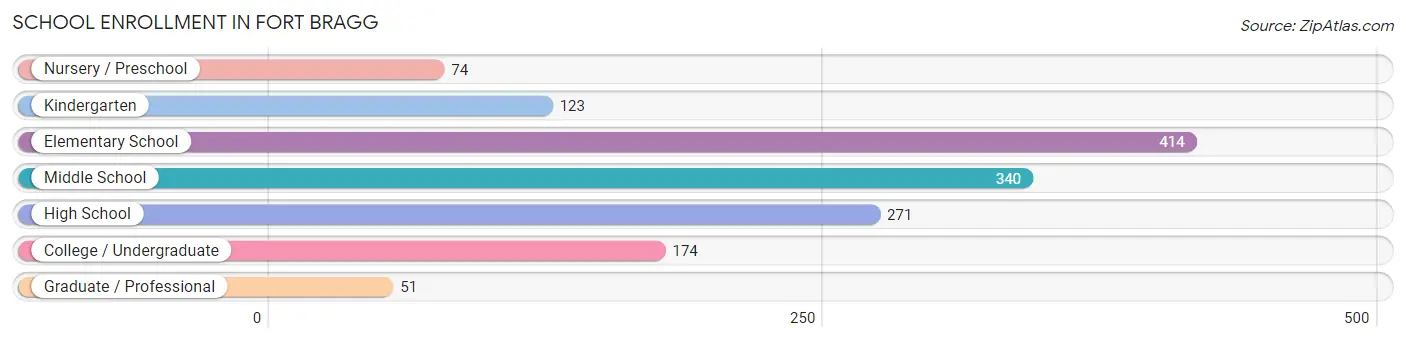
School Enrollment in Fort Bragg
The most common levels of schooling among the 1,447 students in Fort Bragg are elementary school (414 | 28.6%), middle school (340 | 23.5%), and high school (271 | 18.7%).
| School Level | # Students | % Students |
| Nursery / Preschool | 74 | 5.1% |
| Kindergarten | 123 | 8.5% |
| Elementary School | 414 | 28.6% |
| Middle School | 340 | 23.5% |
| High School | 271 | 18.7% |
| College / Undergraduate | 174 | 12.0% |
| Graduate / Professional | 51 | 3.5% |
| Total | 1,447 | 100.0% |
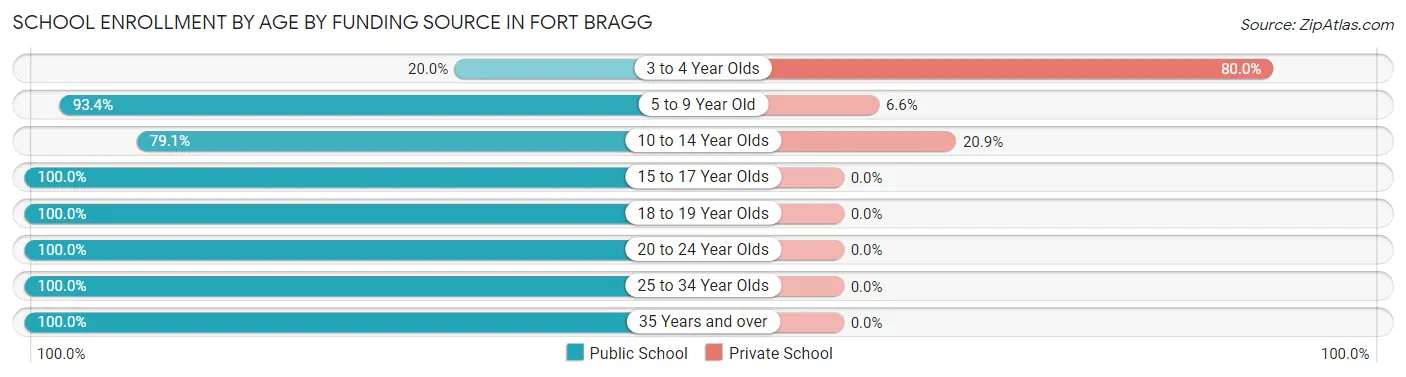
School Enrollment by Age by Funding Source in Fort Bragg
Out of a total of 1,447 students who are enrolled in schools in Fort Bragg, 165 (11.4%) attend a private institution, while the remaining 1,282 (88.6%) are enrolled in public schools. The age group of 3 to 4 year olds has the highest likelihood of being enrolled in private schools, with 44 (80.0% in the age bracket) enrolled. Conversely, the age group of 15 to 17 year olds has the lowest likelihood of being enrolled in a private school, with 186 (100.0% in the age bracket) attending a public institution.
| Age Bracket | Public School | Private School |
| 3 to 4 Year Olds | 11 (20.0%) | 44 (80.0%) |
| 5 to 9 Year Old | 498 (93.4%) | 35 (6.6%) |
| 10 to 14 Year Olds | 325 (79.1%) | 86 (20.9%) |
| 15 to 17 Year Olds | 186 (100.0%) | 0 (0.0%) |
| 18 to 19 Year Olds | 44 (100.0%) | 0 (0.0%) |
| 20 to 24 Year Olds | 65 (100.0%) | 0 (0.0%) |
| 25 to 34 Year Olds | 39 (100.0%) | 0 (0.0%) |
| 35 Years and over | 114 (100.0%) | 0 (0.0%) |
| Total | 1,282 (88.6%) | 165 (11.4%) |
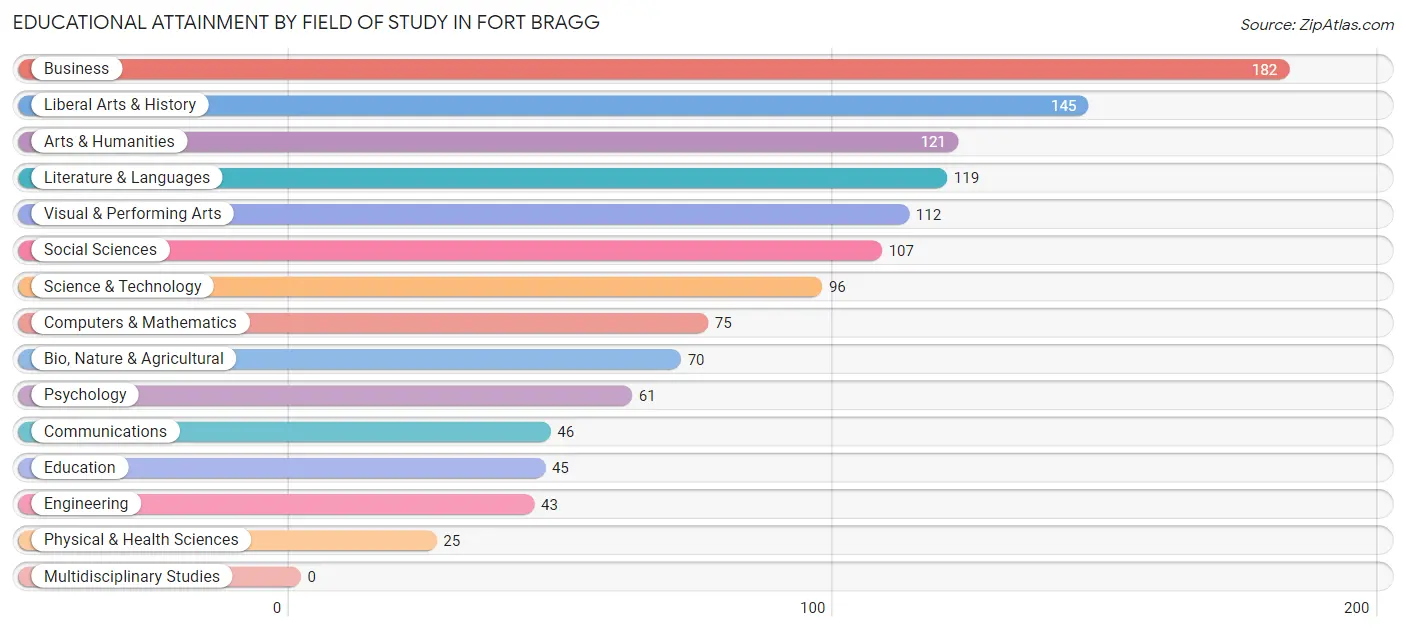
Educational Attainment by Field of Study in Fort Bragg
Business (182 | 14.6%), liberal arts & history (145 | 11.6%), arts & humanities (121 | 9.7%), literature & languages (119 | 9.5%), and visual & performing arts (112 | 9.0%) are the most common fields of study among 1,247 individuals in Fort Bragg who have obtained a bachelor's degree or higher.
| Field of Study | # Graduates | % Graduates |
| Computers & Mathematics | 75 | 6.0% |
| Bio, Nature & Agricultural | 70 | 5.6% |
| Physical & Health Sciences | 25 | 2.0% |
| Psychology | 61 | 4.9% |
| Social Sciences | 107 | 8.6% |
| Engineering | 43 | 3.5% |
| Multidisciplinary Studies | 0 | 0.0% |
| Science & Technology | 96 | 7.7% |
| Business | 182 | 14.6% |
| Education | 45 | 3.6% |
| Literature & Languages | 119 | 9.5% |
| Liberal Arts & History | 145 | 11.6% |
| Visual & Performing Arts | 112 | 9.0% |
| Communications | 46 | 3.7% |
| Arts & Humanities | 121 | 9.7% |
| Total | 1,247 | 100.0% |
Transportation & Commute in Fort Bragg
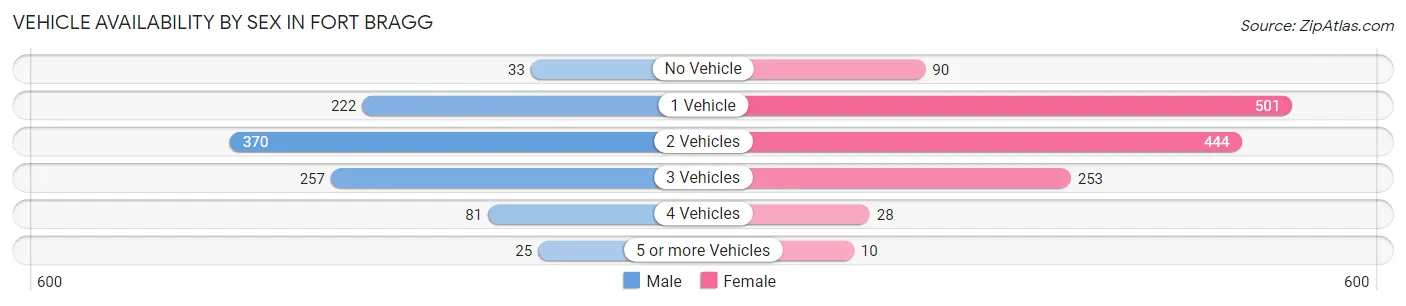
Vehicle Availability by Sex in Fort Bragg
The most prevalent vehicle ownership categories in Fort Bragg are males with 2 vehicles (370, accounting for 37.4%) and females with 2 vehicles (444, making up 27.9%).
| Vehicles Available | Male | Female |
| No Vehicle | 33 (3.3%) | 90 (6.8%) |
| 1 Vehicle | 222 (22.5%) | 501 (37.8%) |
| 2 Vehicles | 370 (37.4%) | 444 (33.5%) |
| 3 Vehicles | 257 (26.0%) | 253 (19.1%) |
| 4 Vehicles | 81 (8.2%) | 28 (2.1%) |
| 5 or more Vehicles | 25 (2.5%) | 10 (0.7%) |
| Total | 988 (100.0%) | 1,326 (100.0%) |
Commute Time in Fort Bragg
The most frequently occuring commute durations in Fort Bragg are 5 to 9 minutes (526 commuters, 24.1%), less than 5 minutes (438 commuters, 20.1%), and 10 to 14 minutes (404 commuters, 18.5%).
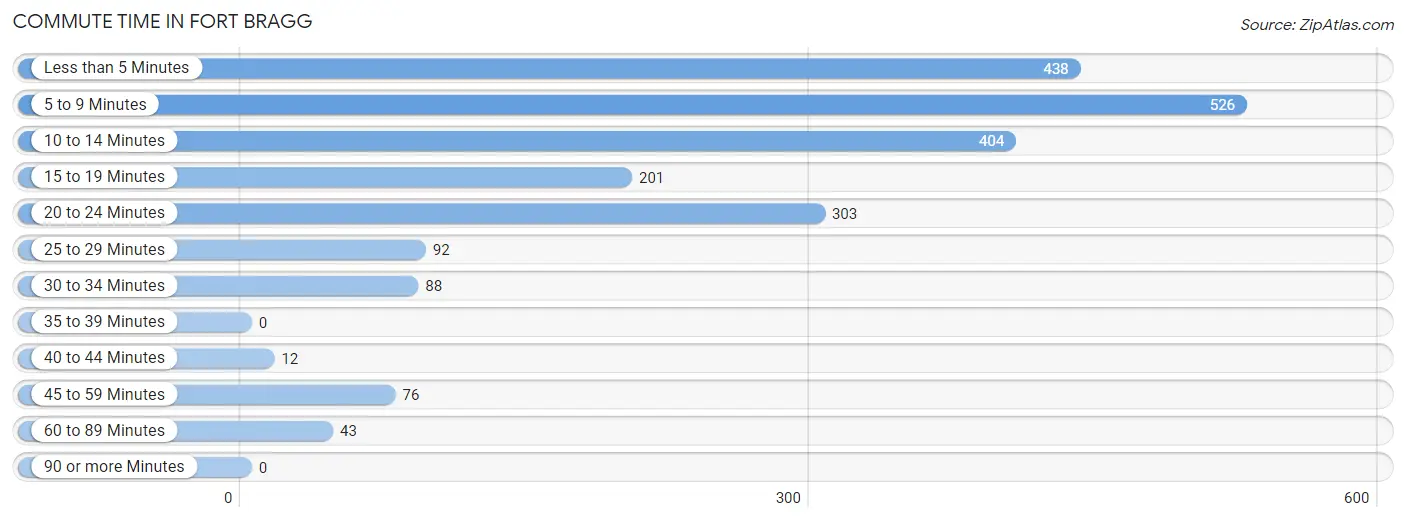
| Commute Time | # Commuters | % Commuters |
| Less than 5 Minutes | 438 | 20.1% |
| 5 to 9 Minutes | 526 | 24.1% |
| 10 to 14 Minutes | 404 | 18.5% |
| 15 to 19 Minutes | 201 | 9.2% |
| 20 to 24 Minutes | 303 | 13.9% |
| 25 to 29 Minutes | 92 | 4.2% |
| 30 to 34 Minutes | 88 | 4.0% |
| 35 to 39 Minutes | 0 | 0.0% |
| 40 to 44 Minutes | 12 | 0.5% |
| 45 to 59 Minutes | 76 | 3.5% |
| 60 to 89 Minutes | 43 | 2.0% |
| 90 or more Minutes | 0 | 0.0% |
Commute Time by Sex in Fort Bragg
The most common commute times in Fort Bragg are 5 to 9 minutes (220 commuters, 23.6%) for males and less than 5 minutes (325 commuters, 26.0%) for females.
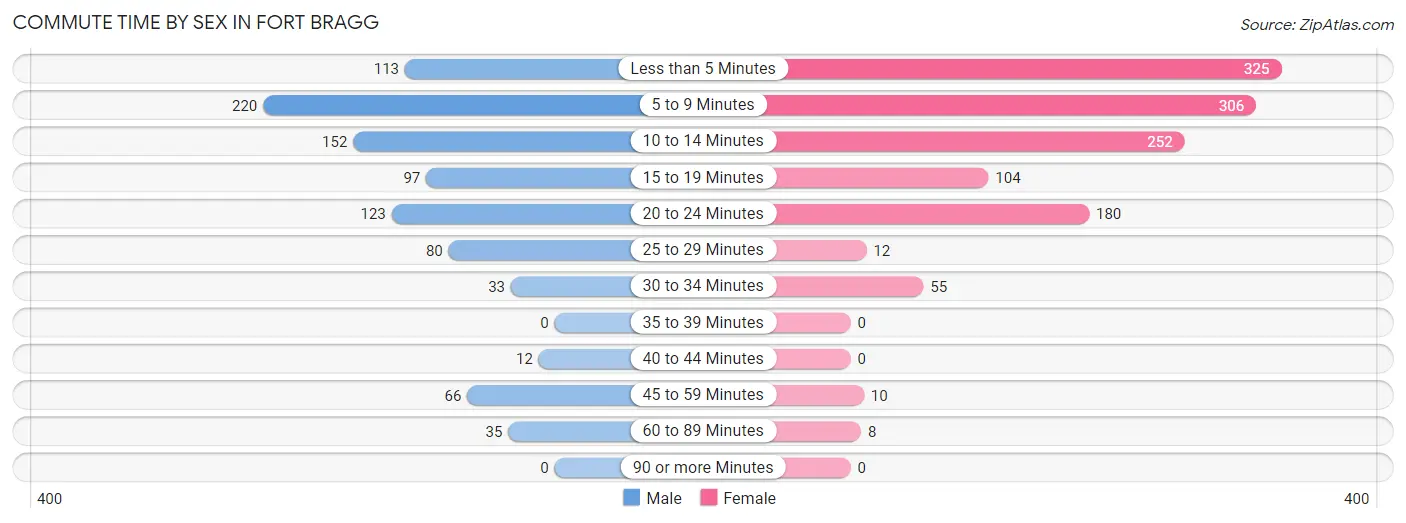
| Commute Time | Male | Female |
| Less than 5 Minutes | 113 (12.1%) | 325 (26.0%) |
| 5 to 9 Minutes | 220 (23.6%) | 306 (24.4%) |
| 10 to 14 Minutes | 152 (16.3%) | 252 (20.1%) |
| 15 to 19 Minutes | 97 (10.4%) | 104 (8.3%) |
| 20 to 24 Minutes | 123 (13.2%) | 180 (14.4%) |
| 25 to 29 Minutes | 80 (8.6%) | 12 (1.0%) |
| 30 to 34 Minutes | 33 (3.5%) | 55 (4.4%) |
| 35 to 39 Minutes | 0 (0.0%) | 0 (0.0%) |
| 40 to 44 Minutes | 12 (1.3%) | 0 (0.0%) |
| 45 to 59 Minutes | 66 (7.1%) | 10 (0.8%) |
| 60 to 89 Minutes | 35 (3.8%) | 8 (0.6%) |
| 90 or more Minutes | 0 (0.0%) | 0 (0.0%) |
Time of Departure to Work by Sex in Fort Bragg
The most frequent times of departure to work in Fort Bragg are 7:30 AM to 7:59 AM (200, 21.5%) for males and 8:00 AM to 8:29 AM (213, 17.0%) for females.
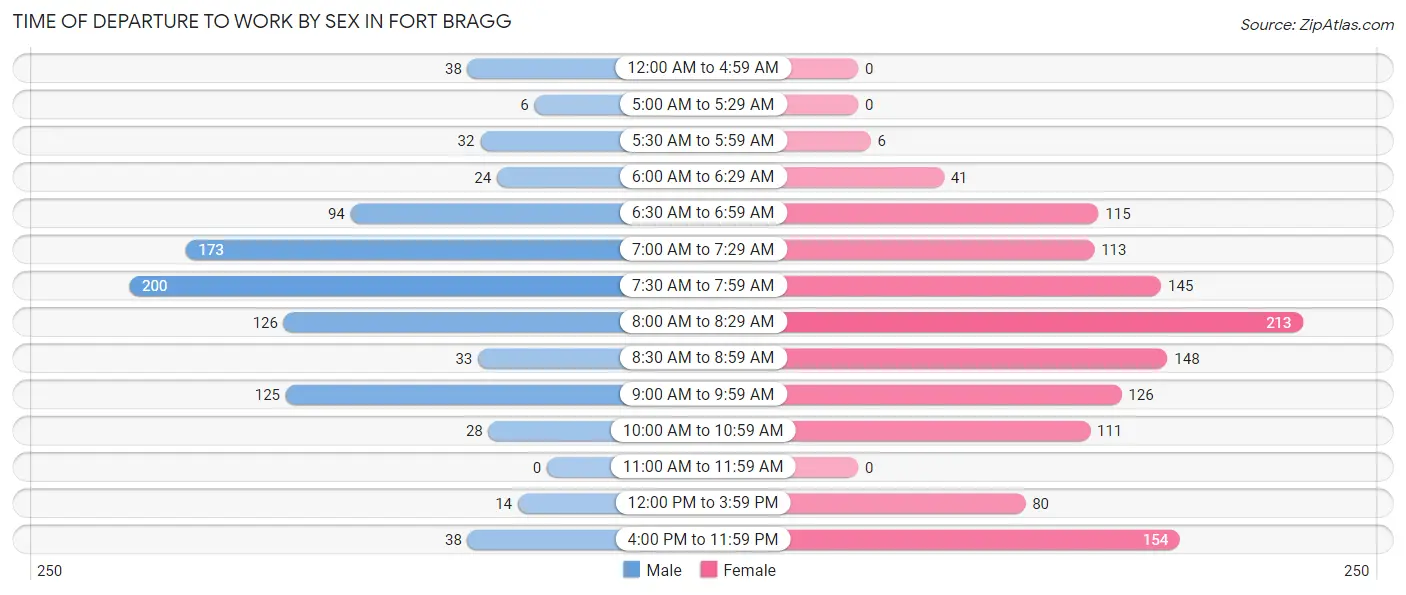
| Time of Departure | Male | Female |
| 12:00 AM to 4:59 AM | 38 (4.1%) | 0 (0.0%) |
| 5:00 AM to 5:29 AM | 6 (0.6%) | 0 (0.0%) |
| 5:30 AM to 5:59 AM | 32 (3.4%) | 6 (0.5%) |
| 6:00 AM to 6:29 AM | 24 (2.6%) | 41 (3.3%) |
| 6:30 AM to 6:59 AM | 94 (10.1%) | 115 (9.2%) |
| 7:00 AM to 7:29 AM | 173 (18.6%) | 113 (9.0%) |
| 7:30 AM to 7:59 AM | 200 (21.5%) | 145 (11.6%) |
| 8:00 AM to 8:29 AM | 126 (13.5%) | 213 (17.0%) |
| 8:30 AM to 8:59 AM | 33 (3.5%) | 148 (11.8%) |
| 9:00 AM to 9:59 AM | 125 (13.4%) | 126 (10.1%) |
| 10:00 AM to 10:59 AM | 28 (3.0%) | 111 (8.9%) |
| 11:00 AM to 11:59 AM | 0 (0.0%) | 0 (0.0%) |
| 12:00 PM to 3:59 PM | 14 (1.5%) | 80 (6.4%) |
| 4:00 PM to 11:59 PM | 38 (4.1%) | 154 (12.3%) |
| Total | 931 (100.0%) | 1,252 (100.0%) |
Housing Occupancy in Fort Bragg
Occupancy by Ownership in Fort Bragg
Of the total 3,059 dwellings in Fort Bragg, owner-occupied units account for 1,144 (37.4%), while renter-occupied units make up 1,915 (62.6%).
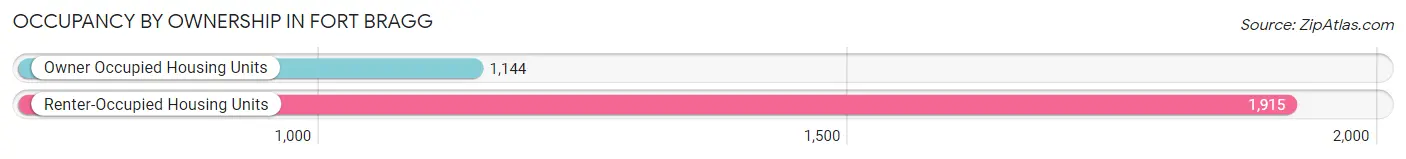
| Occupancy | # Housing Units | % Housing Units |
| Owner Occupied Housing Units | 1,144 | 37.4% |
| Renter-Occupied Housing Units | 1,915 | 62.6% |
| Total Occupied Housing Units | 3,059 | 100.0% |
Occupancy by Household Size in Fort Bragg
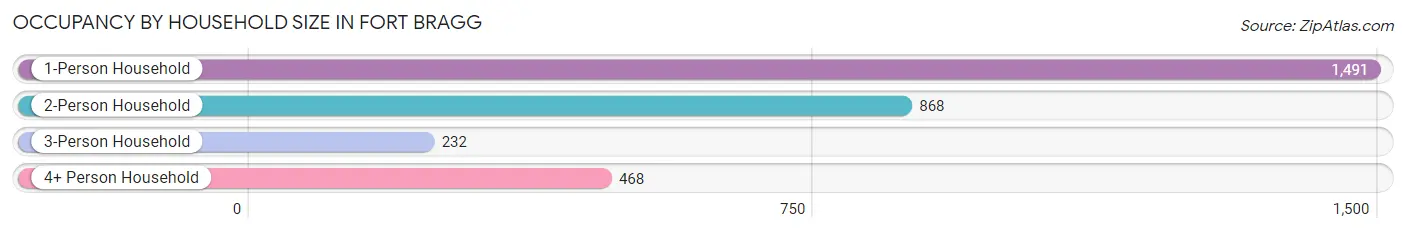
| Household Size | # Housing Units | % Housing Units |
| 1-Person Household | 1,491 | 48.7% |
| 2-Person Household | 868 | 28.4% |
| 3-Person Household | 232 | 7.6% |
| 4+ Person Household | 468 | 15.3% |
| Total Housing Units | 3,059 | 100.0% |
Occupancy by Ownership by Household Size in Fort Bragg
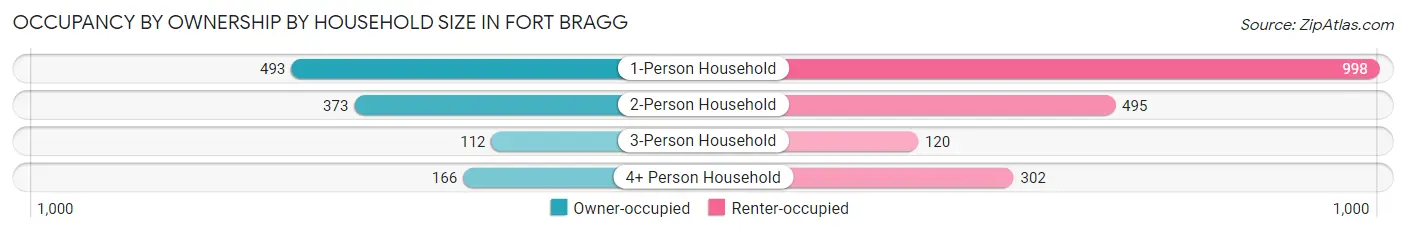
| Household Size | Owner-occupied | Renter-occupied |
| 1-Person Household | 493 (33.1%) | 998 (66.9%) |
| 2-Person Household | 373 (43.0%) | 495 (57.0%) |
| 3-Person Household | 112 (48.3%) | 120 (51.7%) |
| 4+ Person Household | 166 (35.5%) | 302 (64.5%) |
| Total Housing Units | 1,144 (37.4%) | 1,915 (62.6%) |
Occupancy by Educational Attainment in Fort Bragg
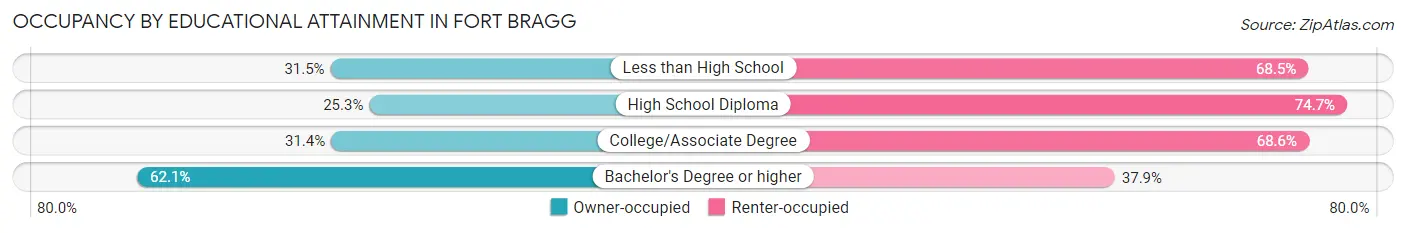
| Household Size | Owner-occupied | Renter-occupied |
| Less than High School | 91 (31.5%) | 198 (68.5%) |
| High School Diploma | 170 (25.3%) | 501 (74.7%) |
| College/Associate Degree | 430 (31.4%) | 940 (68.6%) |
| Bachelor's Degree or higher | 453 (62.1%) | 276 (37.9%) |
Occupancy by Age of Householder in Fort Bragg
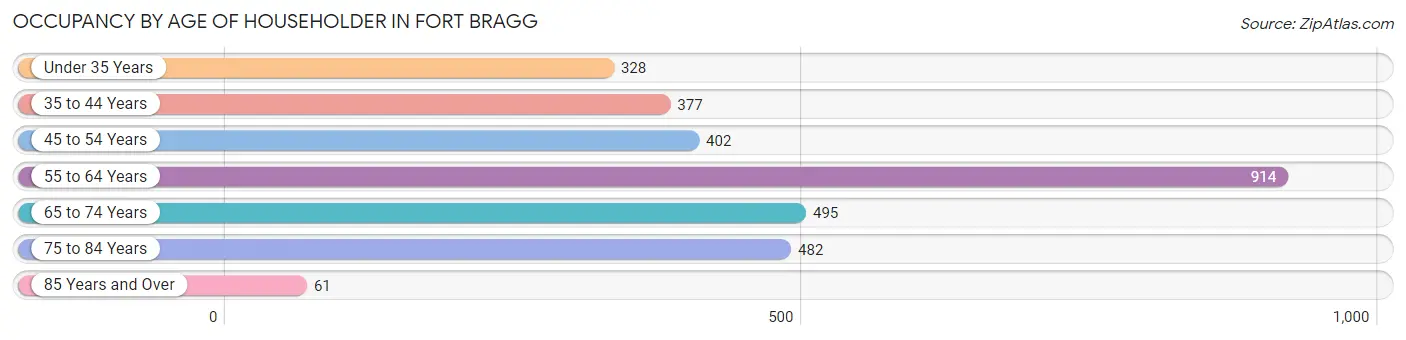
| Age Bracket | # Households | % Households |
| Under 35 Years | 328 | 10.7% |
| 35 to 44 Years | 377 | 12.3% |
| 45 to 54 Years | 402 | 13.1% |
| 55 to 64 Years | 914 | 29.9% |
| 65 to 74 Years | 495 | 16.2% |
| 75 to 84 Years | 482 | 15.8% |
| 85 Years and Over | 61 | 2.0% |
| Total | 3,059 | 100.0% |
Housing Finances in Fort Bragg
Median Income by Occupancy in Fort Bragg
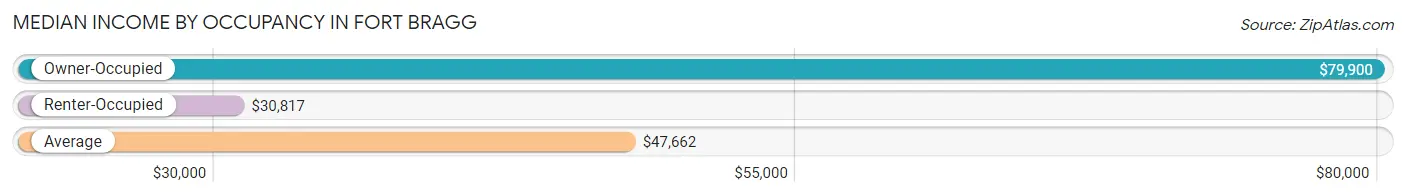
| Occupancy Type | # Households | Median Income |
| Owner-Occupied | 1,144 (37.4%) | $79,900 |
| Renter-Occupied | 1,915 (62.6%) | $30,817 |
| Average | 3,059 (100.0%) | $47,662 |
Occupancy by Householder Income Bracket in Fort Bragg
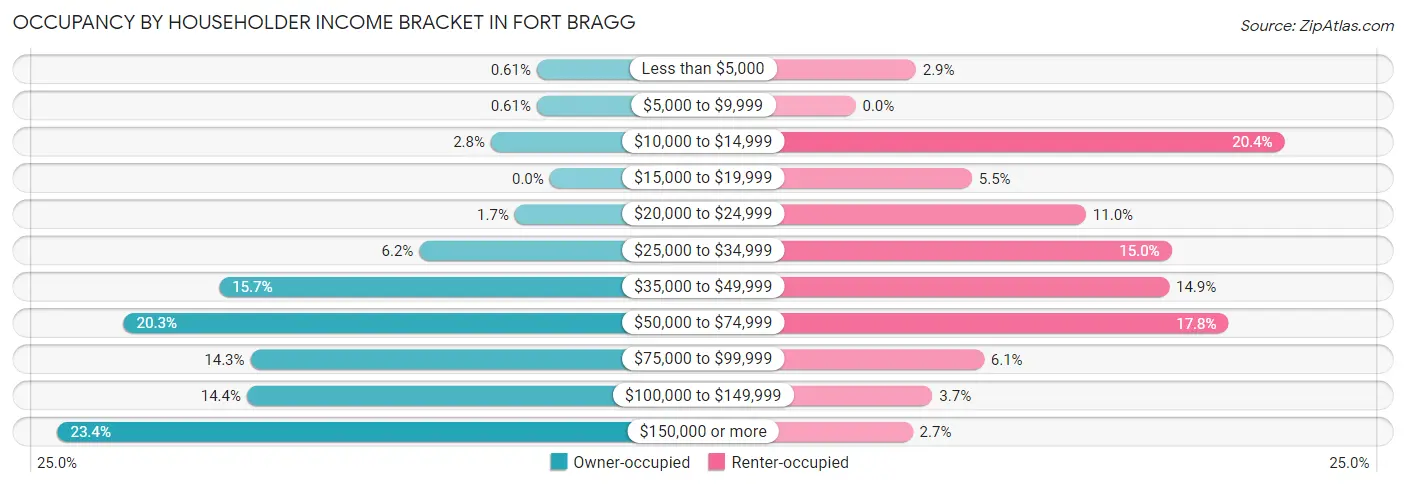
| Income Bracket | Owner-occupied | Renter-occupied |
| Less than $5,000 | 7 (0.6%) | 55 (2.9%) |
| $5,000 to $9,999 | 7 (0.6%) | 0 (0.0%) |
| $10,000 to $14,999 | 32 (2.8%) | 391 (20.4%) |
| $15,000 to $19,999 | 0 (0.0%) | 106 (5.5%) |
| $20,000 to $24,999 | 19 (1.7%) | 210 (11.0%) |
| $25,000 to $34,999 | 71 (6.2%) | 288 (15.0%) |
| $35,000 to $49,999 | 180 (15.7%) | 286 (14.9%) |
| $50,000 to $74,999 | 232 (20.3%) | 340 (17.7%) |
| $75,000 to $99,999 | 163 (14.2%) | 117 (6.1%) |
| $100,000 to $149,999 | 165 (14.4%) | 70 (3.7%) |
| $150,000 or more | 268 (23.4%) | 52 (2.7%) |
| Total | 1,144 (100.0%) | 1,915 (100.0%) |
Monthly Housing Cost Tiers in Fort Bragg
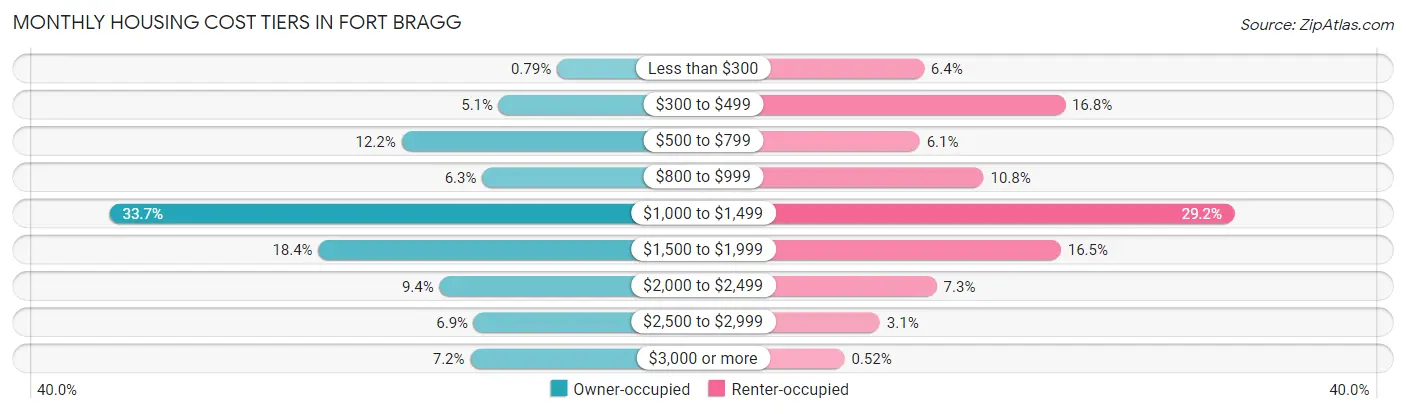
| Monthly Cost | Owner-occupied | Renter-occupied |
| Less than $300 | 9 (0.8%) | 122 (6.4%) |
| $300 to $499 | 58 (5.1%) | 321 (16.8%) |
| $500 to $799 | 140 (12.2%) | 116 (6.1%) |
| $800 to $999 | 72 (6.3%) | 206 (10.8%) |
| $1,000 to $1,499 | 386 (33.7%) | 559 (29.2%) |
| $1,500 to $1,999 | 210 (18.4%) | 315 (16.5%) |
| $2,000 to $2,499 | 108 (9.4%) | 140 (7.3%) |
| $2,500 to $2,999 | 79 (6.9%) | 60 (3.1%) |
| $3,000 or more | 82 (7.2%) | 10 (0.5%) |
| Total | 1,144 (100.0%) | 1,915 (100.0%) |
Physical Housing Characteristics in Fort Bragg
Housing Structures in Fort Bragg
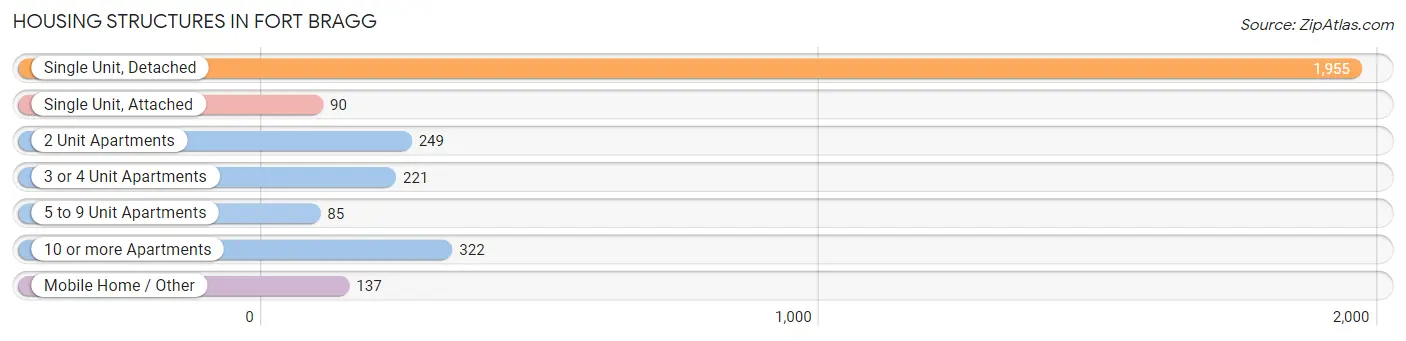
| Structure Type | # Housing Units | % Housing Units |
| Single Unit, Detached | 1,955 | 63.9% |
| Single Unit, Attached | 90 | 2.9% |
| 2 Unit Apartments | 249 | 8.1% |
| 3 or 4 Unit Apartments | 221 | 7.2% |
| 5 to 9 Unit Apartments | 85 | 2.8% |
| 10 or more Apartments | 322 | 10.5% |
| Mobile Home / Other | 137 | 4.5% |
| Total | 3,059 | 100.0% |
Housing Structures by Occupancy in Fort Bragg
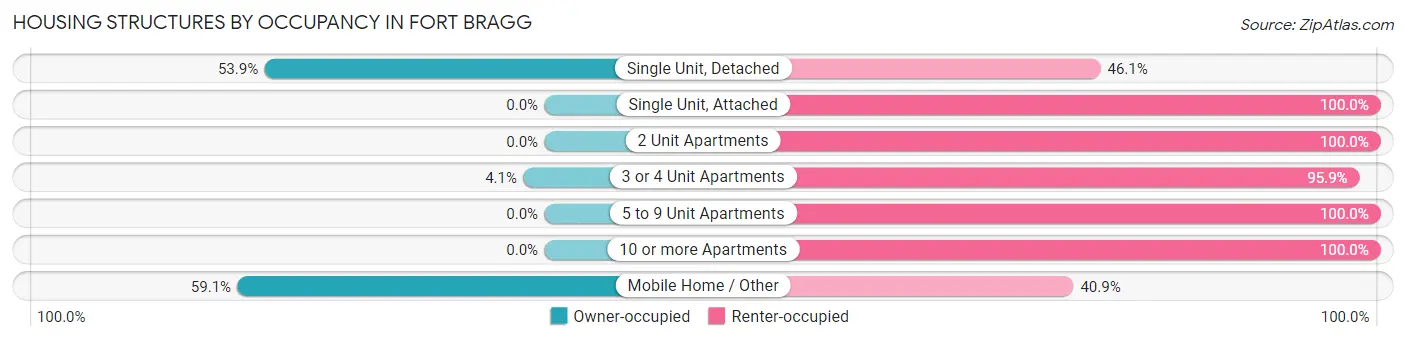
| Structure Type | Owner-occupied | Renter-occupied |
| Single Unit, Detached | 1,054 (53.9%) | 901 (46.1%) |
| Single Unit, Attached | 0 (0.0%) | 90 (100.0%) |
| 2 Unit Apartments | 0 (0.0%) | 249 (100.0%) |
| 3 or 4 Unit Apartments | 9 (4.1%) | 212 (95.9%) |
| 5 to 9 Unit Apartments | 0 (0.0%) | 85 (100.0%) |
| 10 or more Apartments | 0 (0.0%) | 322 (100.0%) |
| Mobile Home / Other | 81 (59.1%) | 56 (40.9%) |
| Total | 1,144 (37.4%) | 1,915 (62.6%) |
Housing Structures by Number of Rooms in Fort Bragg
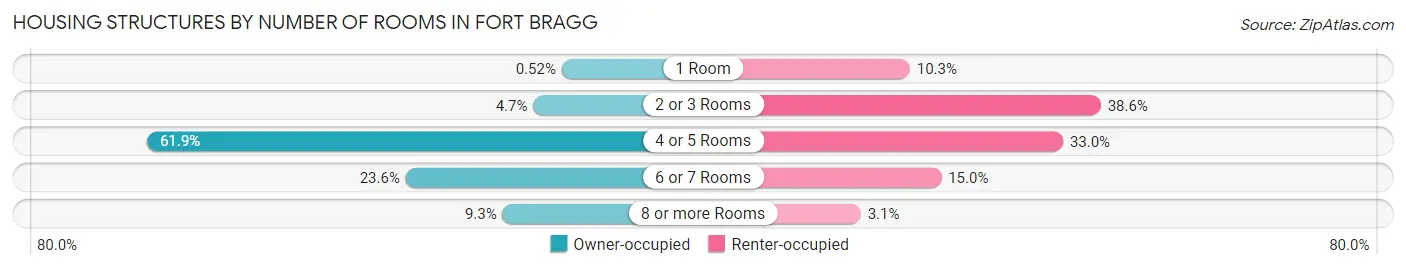
| Number of Rooms | Owner-occupied | Renter-occupied |
| 1 Room | 6 (0.5%) | 198 (10.3%) |
| 2 or 3 Rooms | 54 (4.7%) | 739 (38.6%) |
| 4 or 5 Rooms | 708 (61.9%) | 632 (33.0%) |
| 6 or 7 Rooms | 270 (23.6%) | 287 (15.0%) |
| 8 or more Rooms | 106 (9.3%) | 59 (3.1%) |
| Total | 1,144 (100.0%) | 1,915 (100.0%) |
Housing Structure by Heating Type in Fort Bragg
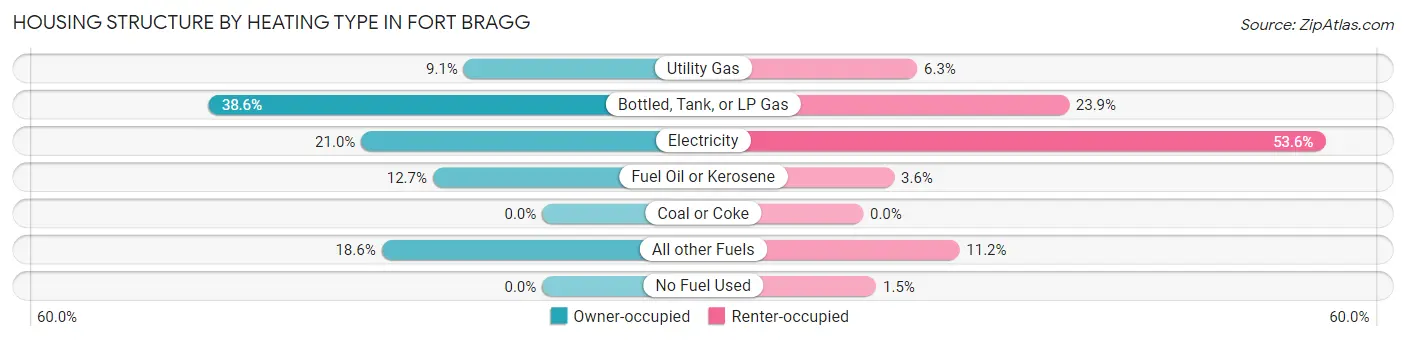
| Heating Type | Owner-occupied | Renter-occupied |
| Utility Gas | 104 (9.1%) | 120 (6.3%) |
| Bottled, Tank, or LP Gas | 442 (38.6%) | 457 (23.9%) |
| Electricity | 240 (21.0%) | 1,026 (53.6%) |
| Fuel Oil or Kerosene | 145 (12.7%) | 69 (3.6%) |
| Coal or Coke | 0 (0.0%) | 0 (0.0%) |
| All other Fuels | 213 (18.6%) | 214 (11.2%) |
| No Fuel Used | 0 (0.0%) | 29 (1.5%) |
| Total | 1,144 (100.0%) | 1,915 (100.0%) |
Household Vehicle Usage in Fort Bragg
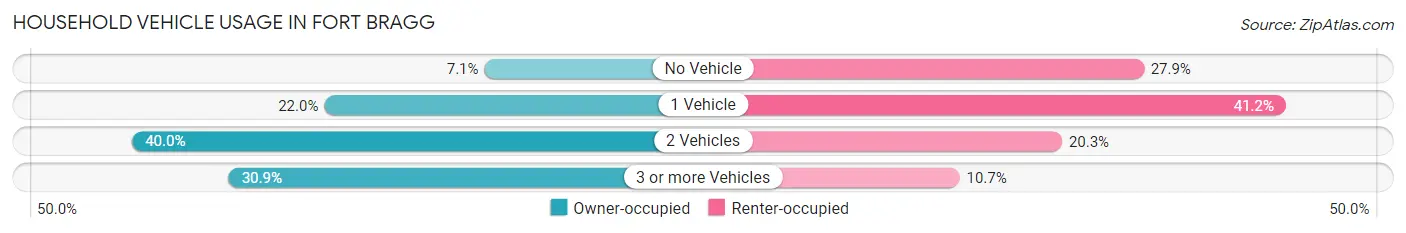
| Vehicles per Household | Owner-occupied | Renter-occupied |
| No Vehicle | 81 (7.1%) | 534 (27.9%) |
| 1 Vehicle | 252 (22.0%) | 788 (41.1%) |
| 2 Vehicles | 457 (40.0%) | 388 (20.3%) |
| 3 or more Vehicles | 354 (30.9%) | 205 (10.7%) |
| Total | 1,144 (100.0%) | 1,915 (100.0%) |
Real Estate & Mortgages in Fort Bragg
Real Estate and Mortgage Overview in Fort Bragg
| Characteristic | Without Mortgage | With Mortgage |
| Housing Units | 468 | 676 |
| Median Property Value | $490,200 | $442,100 |
| Median Household Income | $96,600 | $137 |
| Monthly Housing Costs | $844 | $82 |
| Real Estate Taxes | $2,898 | $0 |
Property Value by Mortgage Status in Fort Bragg
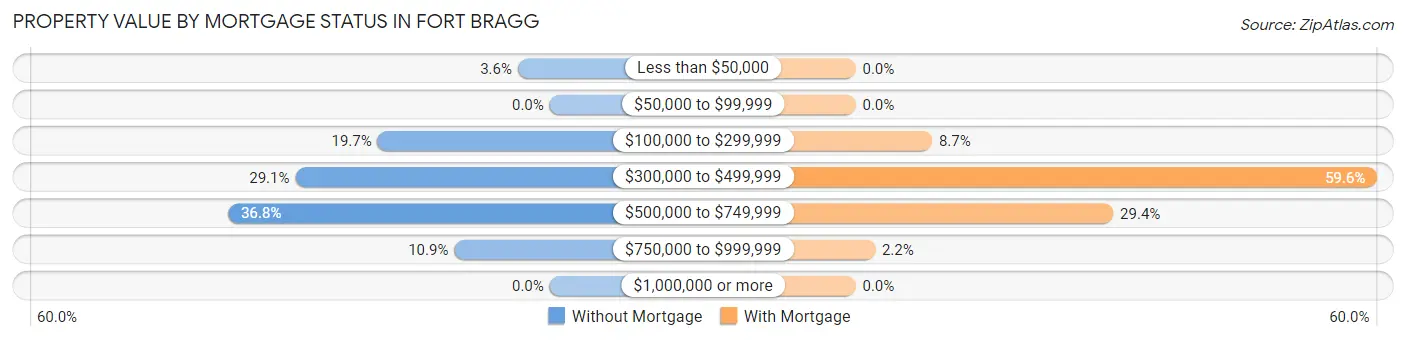
| Property Value | Without Mortgage | With Mortgage |
| Less than $50,000 | 17 (3.6%) | 0 (0.0%) |
| $50,000 to $99,999 | 0 (0.0%) | 0 (0.0%) |
| $100,000 to $299,999 | 92 (19.7%) | 59 (8.7%) |
| $300,000 to $499,999 | 136 (29.1%) | 403 (59.6%) |
| $500,000 to $749,999 | 172 (36.7%) | 199 (29.4%) |
| $750,000 to $999,999 | 51 (10.9%) | 15 (2.2%) |
| $1,000,000 or more | 0 (0.0%) | 0 (0.0%) |
| Total | 468 (100.0%) | 676 (100.0%) |
Household Income by Mortgage Status in Fort Bragg
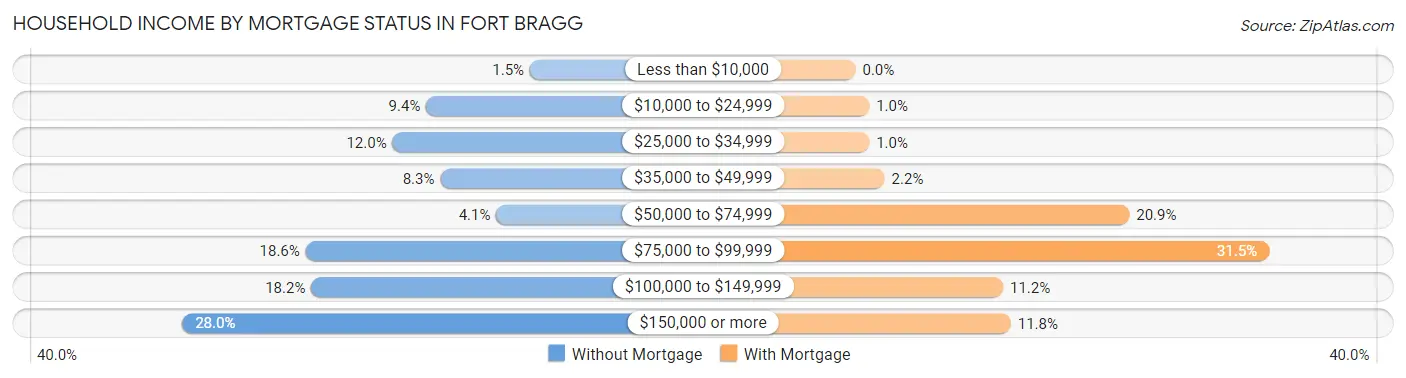
| Household Income | Without Mortgage | With Mortgage |
| Less than $10,000 | 7 (1.5%) | 0 (0.0%) |
| $10,000 to $24,999 | 44 (9.4%) | 7 (1.0%) |
| $25,000 to $34,999 | 56 (12.0%) | 7 (1.0%) |
| $35,000 to $49,999 | 39 (8.3%) | 15 (2.2%) |
| $50,000 to $74,999 | 19 (4.1%) | 141 (20.9%) |
| $75,000 to $99,999 | 87 (18.6%) | 213 (31.5%) |
| $100,000 to $149,999 | 85 (18.2%) | 76 (11.2%) |
| $150,000 or more | 131 (28.0%) | 80 (11.8%) |
| Total | 468 (100.0%) | 676 (100.0%) |
Property Value to Household Income Ratio in Fort Bragg
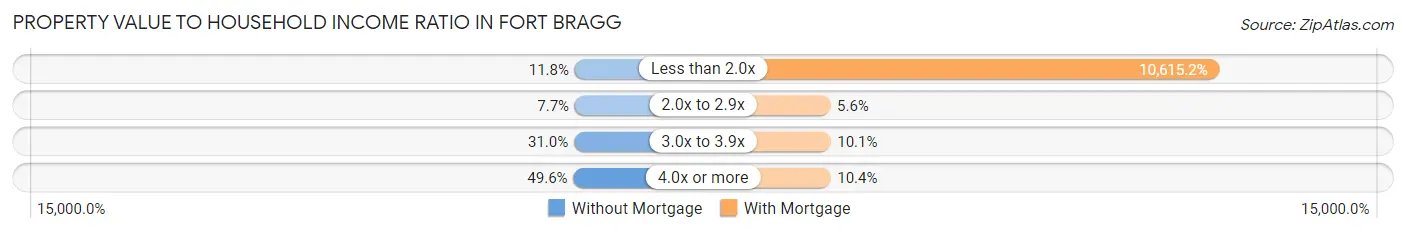
| Value-to-Income Ratio | Without Mortgage | With Mortgage |
| Less than 2.0x | 55 (11.7%) | 71,759 (10,615.2%) |
| 2.0x to 2.9x | 36 (7.7%) | 38 (5.6%) |
| 3.0x to 3.9x | 145 (31.0%) | 68 (10.1%) |
| 4.0x or more | 232 (49.6%) | 70 (10.4%) |
| Total | 468 (100.0%) | 676 (100.0%) |
Real Estate Taxes by Mortgage Status in Fort Bragg
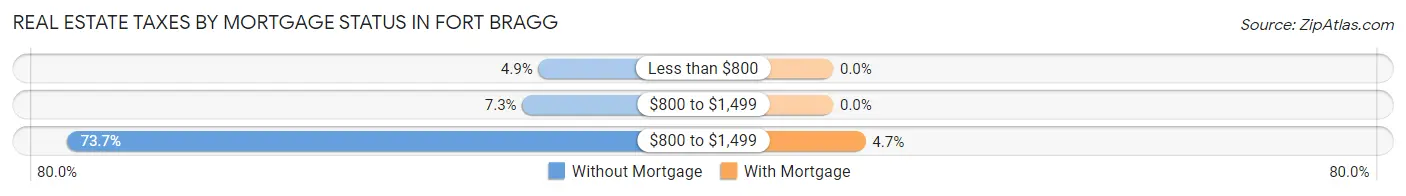
| Property Taxes | Without Mortgage | With Mortgage |
| Less than $800 | 23 (4.9%) | 0 (0.0%) |
| $800 to $1,499 | 34 (7.3%) | 0 (0.0%) |
| $800 to $1,499 | 345 (73.7%) | 32 (4.7%) |
| Total | 468 (100.0%) | 676 (100.0%) |
Health & Disability in Fort Bragg
Health Insurance Coverage by Age in Fort Bragg
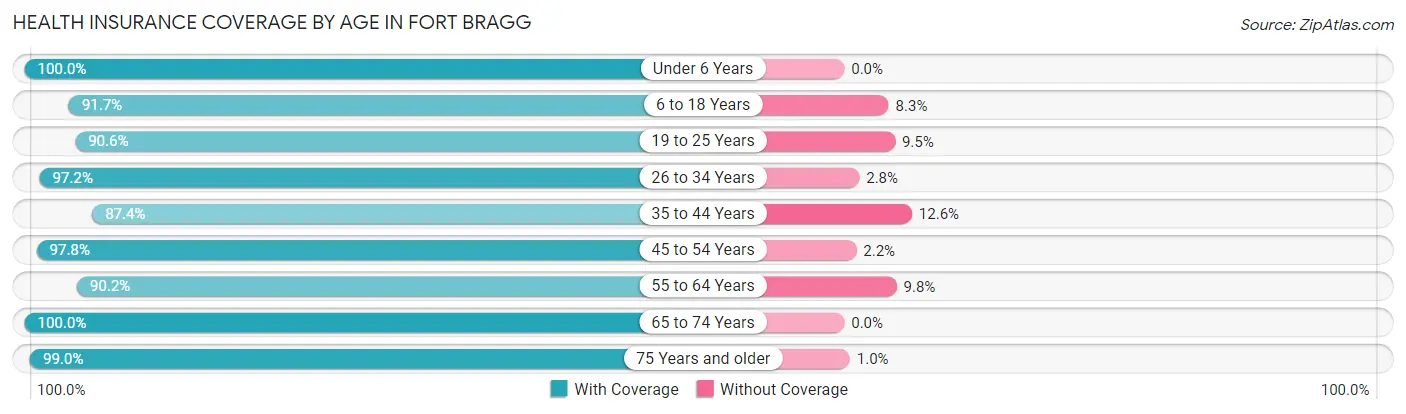
| Age Bracket | With Coverage | Without Coverage |
| Under 6 Years | 706 (100.0%) | 0 (0.0%) |
| 6 to 18 Years | 1,010 (91.7%) | 91 (8.3%) |
| 19 to 25 Years | 297 (90.5%) | 31 (9.5%) |
| 26 to 34 Years | 520 (97.2%) | 15 (2.8%) |
| 35 to 44 Years | 610 (87.4%) | 88 (12.6%) |
| 45 to 54 Years | 654 (97.8%) | 15 (2.2%) |
| 55 to 64 Years | 1,091 (90.2%) | 118 (9.8%) |
| 65 to 74 Years | 1,002 (100.0%) | 0 (0.0%) |
| 75 Years and older | 672 (99.0%) | 7 (1.0%) |
| Total | 6,562 (94.7%) | 365 (5.3%) |
Health Insurance Coverage by Citizenship Status in Fort Bragg
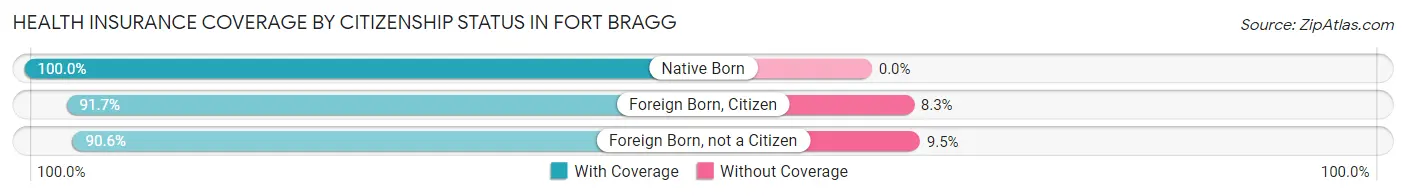
| Citizenship Status | With Coverage | Without Coverage |
| Native Born | 706 (100.0%) | 0 (0.0%) |
| Foreign Born, Citizen | 1,010 (91.7%) | 91 (8.3%) |
| Foreign Born, not a Citizen | 297 (90.5%) | 31 (9.5%) |
Health Insurance Coverage by Household Income in Fort Bragg
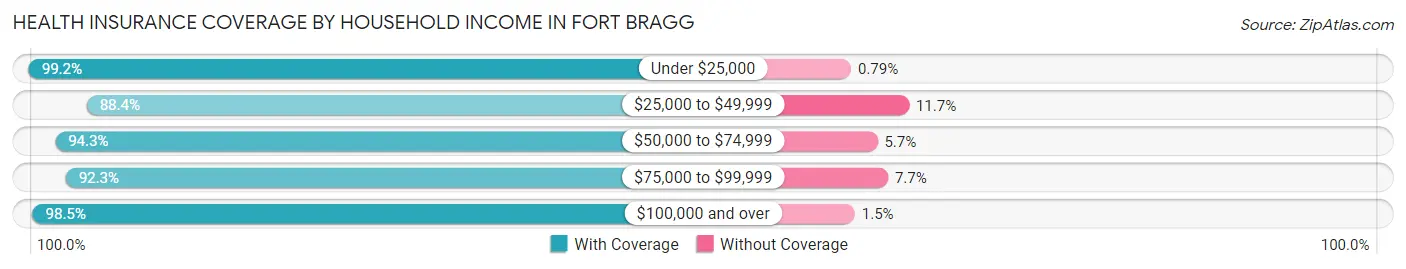
| Household Income | With Coverage | Without Coverage |
| Under $25,000 | 1,390 (99.2%) | 11 (0.8%) |
| $25,000 to $49,999 | 1,312 (88.3%) | 173 (11.7%) |
| $50,000 to $74,999 | 1,691 (94.3%) | 103 (5.7%) |
| $75,000 to $99,999 | 682 (92.3%) | 57 (7.7%) |
| $100,000 and over | 1,366 (98.5%) | 21 (1.5%) |
Public vs Private Health Insurance Coverage by Age in Fort Bragg
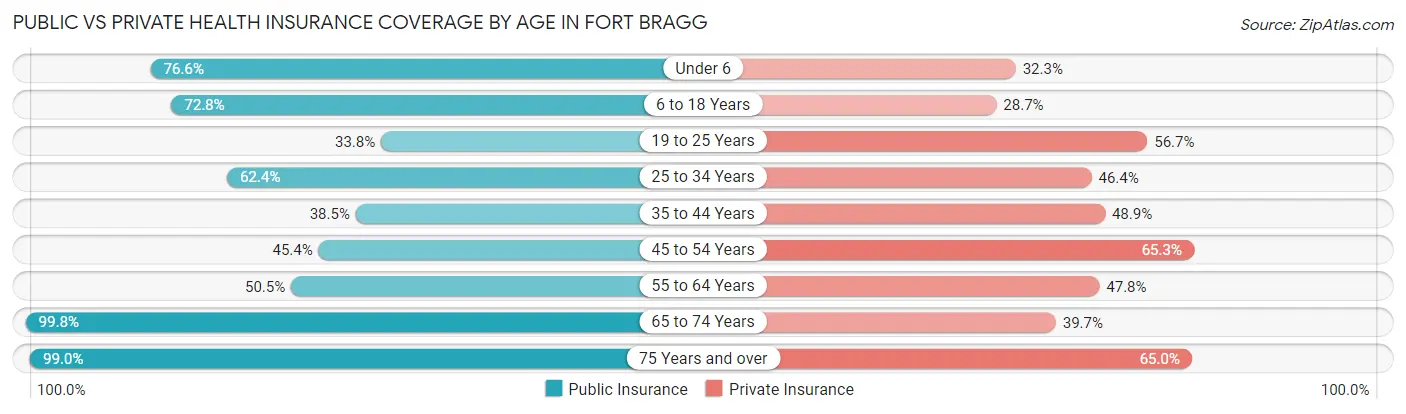
| Age Bracket | Public Insurance | Private Insurance |
| Under 6 | 541 (76.6%) | 228 (32.3%) |
| 6 to 18 Years | 801 (72.8%) | 316 (28.7%) |
| 19 to 25 Years | 111 (33.8%) | 186 (56.7%) |
| 25 to 34 Years | 334 (62.4%) | 248 (46.4%) |
| 35 to 44 Years | 269 (38.5%) | 341 (48.8%) |
| 45 to 54 Years | 304 (45.4%) | 437 (65.3%) |
| 55 to 64 Years | 611 (50.5%) | 578 (47.8%) |
| 65 to 74 Years | 1,000 (99.8%) | 398 (39.7%) |
| 75 Years and over | 672 (99.0%) | 441 (64.9%) |
| Total | 4,643 (67.0%) | 3,173 (45.8%) |
Disability Status by Sex by Age in Fort Bragg
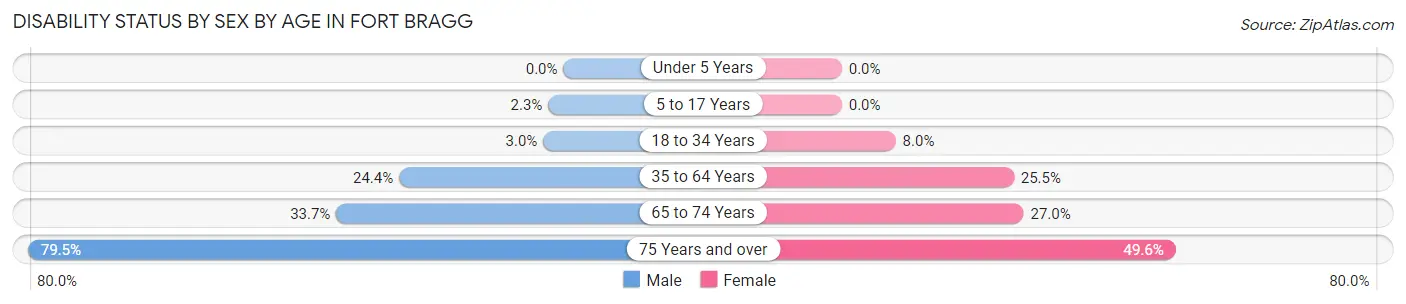
| Age Bracket | Male | Female |
| Under 5 Years | 0 (0.0%) | 0 (0.0%) |
| 5 to 17 Years | 12 (2.2%) | 0 (0.0%) |
| 18 to 34 Years | 11 (3.0%) | 44 (8.0%) |
| 35 to 64 Years | 276 (24.4%) | 369 (25.5%) |
| 65 to 74 Years | 143 (33.7%) | 156 (27.0%) |
| 75 Years and over | 264 (79.5%) | 172 (49.6%) |
Disability Class by Sex by Age in Fort Bragg
Disability Class: Hearing Difficulty
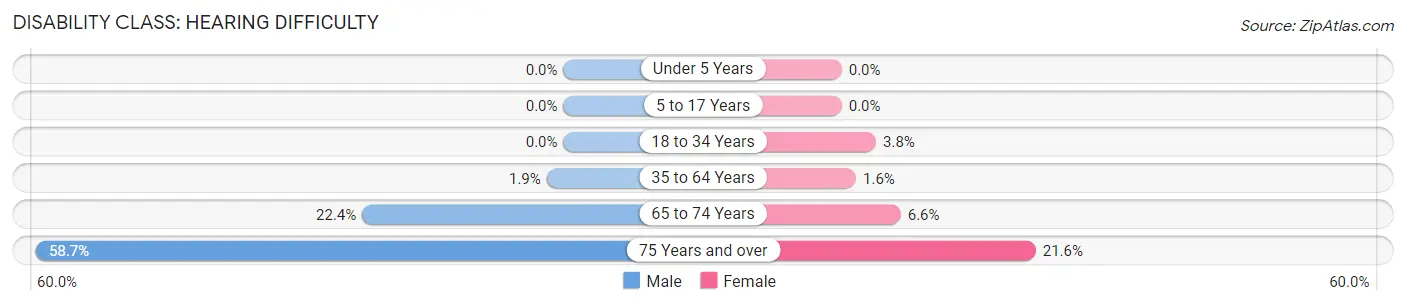
| Age Bracket | Male | Female |
| Under 5 Years | 0 (0.0%) | 0 (0.0%) |
| 5 to 17 Years | 0 (0.0%) | 0 (0.0%) |
| 18 to 34 Years | 0 (0.0%) | 21 (3.8%) |
| 35 to 64 Years | 21 (1.9%) | 23 (1.6%) |
| 65 to 74 Years | 95 (22.4%) | 38 (6.6%) |
| 75 Years and over | 195 (58.7%) | 75 (21.6%) |
Disability Class: Vision Difficulty
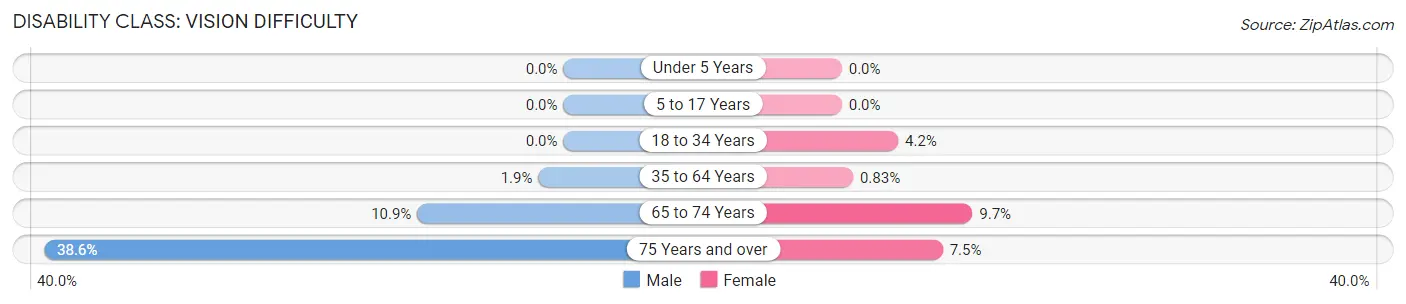
| Age Bracket | Male | Female |
| Under 5 Years | 0 (0.0%) | 0 (0.0%) |
| 5 to 17 Years | 0 (0.0%) | 0 (0.0%) |
| 18 to 34 Years | 0 (0.0%) | 23 (4.2%) |
| 35 to 64 Years | 21 (1.9%) | 12 (0.8%) |
| 65 to 74 Years | 46 (10.8%) | 56 (9.7%) |
| 75 Years and over | 128 (38.6%) | 26 (7.5%) |
Disability Class: Cognitive Difficulty
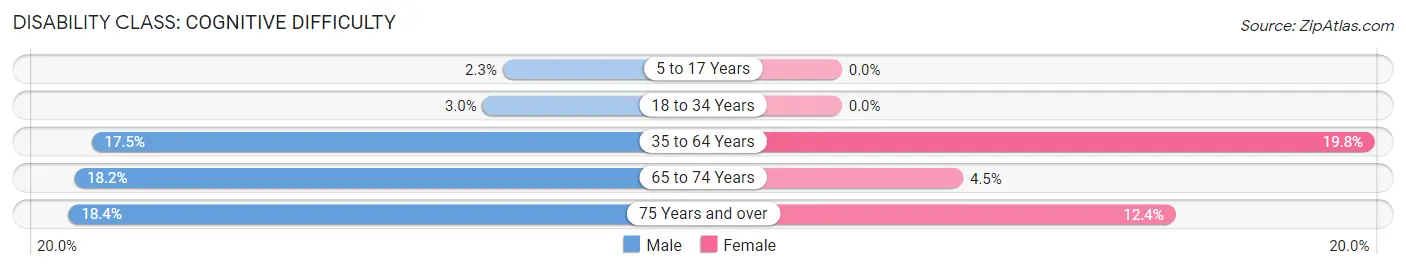
| Age Bracket | Male | Female |
| 5 to 17 Years | 12 (2.2%) | 0 (0.0%) |
| 18 to 34 Years | 11 (3.0%) | 0 (0.0%) |
| 35 to 64 Years | 198 (17.5%) | 286 (19.8%) |
| 65 to 74 Years | 77 (18.2%) | 26 (4.5%) |
| 75 Years and over | 61 (18.4%) | 43 (12.4%) |
Disability Class: Ambulatory Difficulty
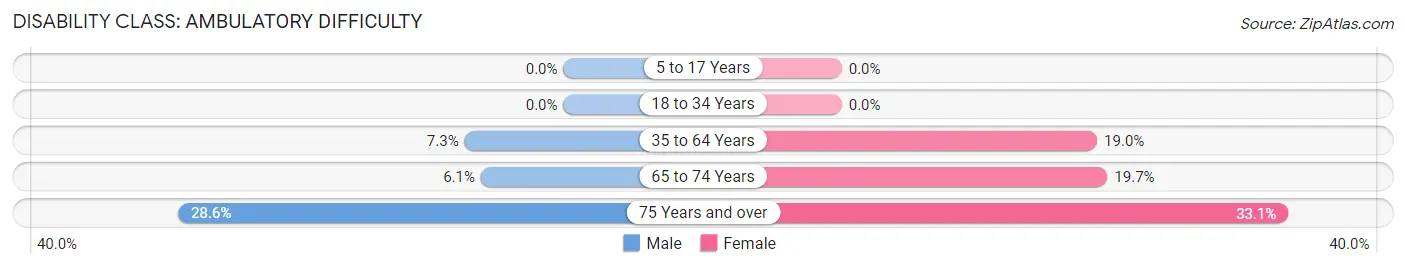
| Age Bracket | Male | Female |
| 5 to 17 Years | 0 (0.0%) | 0 (0.0%) |
| 18 to 34 Years | 0 (0.0%) | 0 (0.0%) |
| 35 to 64 Years | 83 (7.3%) | 274 (19.0%) |
| 65 to 74 Years | 26 (6.1%) | 114 (19.7%) |
| 75 Years and over | 95 (28.6%) | 115 (33.1%) |
Disability Class: Self-Care Difficulty
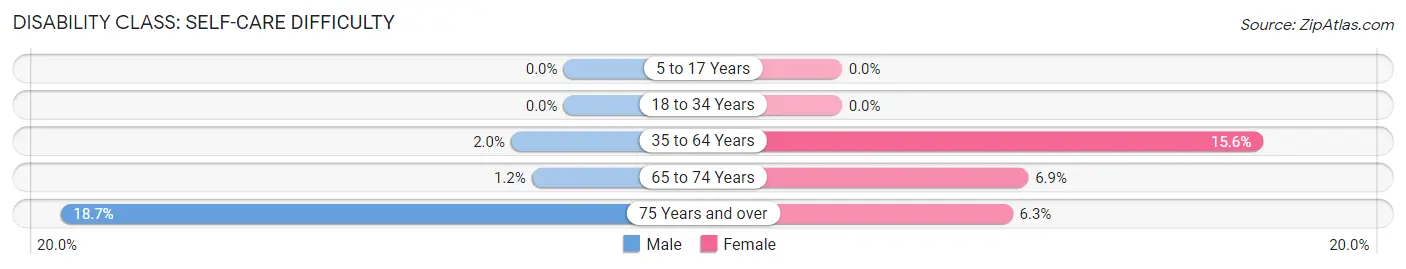
| Age Bracket | Male | Female |
| 5 to 17 Years | 0 (0.0%) | 0 (0.0%) |
| 18 to 34 Years | 0 (0.0%) | 0 (0.0%) |
| 35 to 64 Years | 22 (1.9%) | 226 (15.6%) |
| 65 to 74 Years | 5 (1.2%) | 40 (6.9%) |
| 75 Years and over | 62 (18.7%) | 22 (6.3%) |
Technology Access in Fort Bragg
Computing Device Access in Fort Bragg
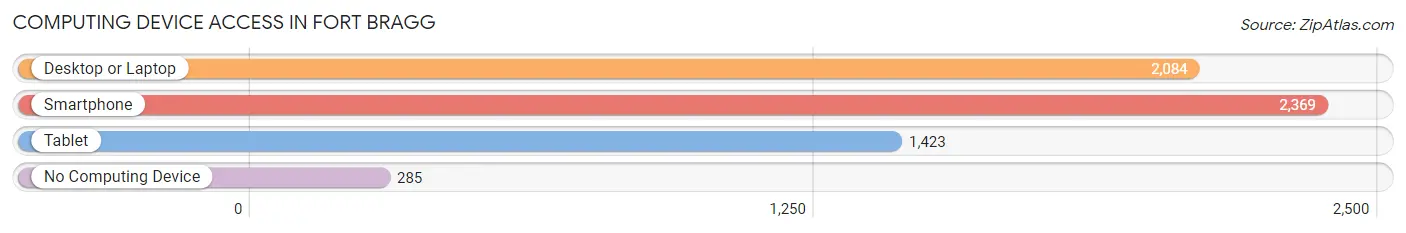
| Device Type | # Households | % Households |
| Desktop or Laptop | 2,084 | 68.1% |
| Smartphone | 2,369 | 77.4% |
| Tablet | 1,423 | 46.5% |
| No Computing Device | 285 | 9.3% |
| Total | 3,059 | 100.0% |
Internet Access in Fort Bragg
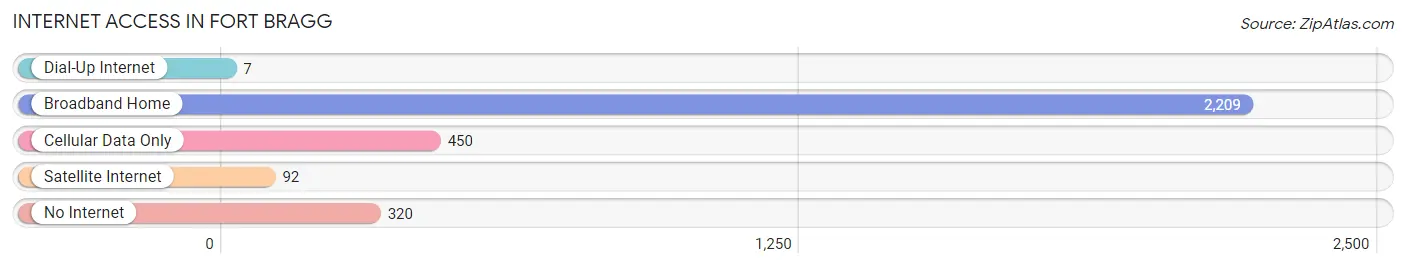
| Internet Type | # Households | % Households |
| Dial-Up Internet | 7 | 0.2% |
| Broadband Home | 2,209 | 72.2% |
| Cellular Data Only | 450 | 14.7% |
| Satellite Internet | 92 | 3.0% |
| No Internet | 320 | 10.5% |
| Total | 3,059 | 100.0% |
Fort Bragg Summary
Fort Bragg is a coastal city located in Mendocino County, California. It is situated on the Pacific Coast, approximately 120 miles north of San Francisco. The city has a population of 7,273 as of the 2010 census.
History
Fort Bragg was originally established in 1857 as a military post by the United States Army. The post was named after Braxton Bragg, a Confederate general in the American Civil War. The post was used to protect the area from Native American attacks. In 1867, the post was abandoned and the land was sold to settlers.
The city of Fort Bragg was officially incorporated in 1889. The city was initially a logging and fishing town, but it soon became a popular tourist destination. The city was known for its scenic beauty and its rugged coastline.
In the early 20th century, Fort Bragg was a popular destination for Hollywood filmmakers. Many films were shot in the area, including The Sea Hawk (1940) and The Treasure of the Sierra Madre (1948).
Geography
Fort Bragg is located on the Pacific Coast, approximately 120 miles north of San Francisco. The city is situated on a coastal plain between the Pacific Ocean and the Noyo River. The city has a total area of 4.2 square miles, of which 0.2 square miles is water.
The city has a mild, Mediterranean climate with cool, wet winters and warm, dry summers. The average annual temperature is 57°F. The average annual precipitation is 33 inches.
Economy
The economy of Fort Bragg is largely based on tourism and fishing. The city is a popular destination for tourists, who come to enjoy the city’s scenic beauty and rugged coastline. The city is also home to a number of fishing fleets, which provide fresh seafood to local restaurants and markets.
The city is also home to a number of businesses, including retail stores, restaurants, and hotels. The city is also home to a number of manufacturing companies, including a paper mill and a lumber mill.
Demographics
As of the 2010 census, the population of Fort Bragg was 7,273. The racial makeup of the city was 79.3% White, 0.7% African American, 1.2% Native American, 0.7% Asian, 0.1% Pacific Islander, 15.2% from other races, and 3.0% from two or more races. Hispanic or Latino of any race were 24.3% of the population.
The median income for a household in the city was $37,917, and the median income for a family was $45,944. The per capita income for the city was $20,945. About 17.2% of families and 21.3% of the population were below the poverty line, including 28.2% of those under age 18 and 8.2% of those age 65 or over.
Common Questions
What is Per Capita Income in Fort Bragg?
Per Capita income in Fort Bragg is $30,761.
What is the Median Family Income in Fort Bragg?
Median Family Income in Fort Bragg is $62,017.
What is the Median Household income in Fort Bragg?
Median Household Income in Fort Bragg is $47,662.
What is Income or Wage Gap in Fort Bragg?
Income or Wage Gap in Fort Bragg is 12.2%.
Women in Fort Bragg earn 87.8 cents for every dollar earned by a man.
What is Inequality or Gini Index in Fort Bragg?
Inequality or Gini Index in Fort Bragg is 0.48.
What is the Total Population of Fort Bragg?
Total Population of Fort Bragg is 7,007.
What is the Total Male Population of Fort Bragg?
Total Male Population of Fort Bragg is 3,099.
What is the Total Female Population of Fort Bragg?
Total Female Population of Fort Bragg is 3,908.
What is the Ratio of Males per 100 Females in Fort Bragg?
There are 79.30 Males per 100 Females in Fort Bragg.
What is the Ratio of Females per 100 Males in Fort Bragg?
There are 126.11 Females per 100 Males in Fort Bragg.
What is the Median Population Age in Fort Bragg?
Median Population Age in Fort Bragg is 46.8 Years.
What is the Average Family Size in Fort Bragg
Average Family Size in Fort Bragg is 3.4 People.
What is the Average Household Size in Fort Bragg
Average Household Size in Fort Bragg is 2.2 People.
How Large is the Labor Force in Fort Bragg?
There are 2,550 People in the Labor Forcein in Fort Bragg.
What is the Percentage of People in the Labor Force in Fort Bragg?
47.2% of People are in the Labor Force in Fort Bragg.
What is the Unemployment Rate in Fort Bragg?
Unemployment Rate in Fort Bragg is 6.7%.