Zip Codes with the Highest Percentage of Households Without a Vehicle in San Francisco, CA
RELATED REPORTS & OPTIONS
Households without a Cars
San Francisco
Compare Zip Codes
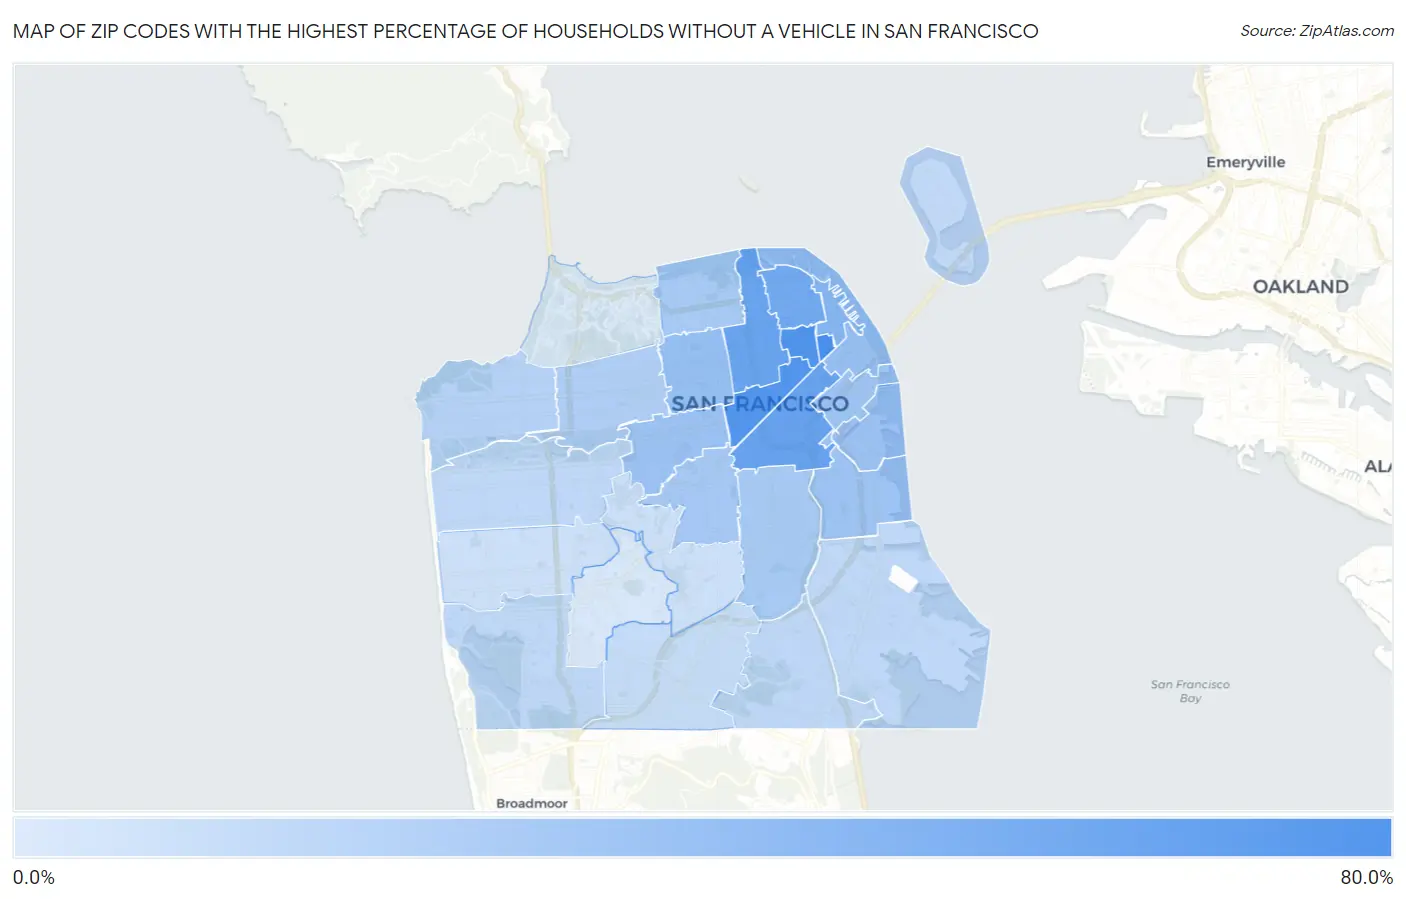
Map of Zip Codes with the Highest Percentage of Households Without a Vehicle in San Francisco
4.2%
74.2%
Zip Codes with the Highest Percentage of Households Without a Vehicle in San Francisco, CA
| Zip Code | Housholds Without a Car | vs State | vs National | |
| 1. | 94104 | 74.2% | 6.9%(+67.3)#5 | 8.3%(+65.9)#167 |
| 2. | 94108 | 68.6% | 6.9%(+61.7)#6 | 8.3%(+60.3)#207 |
| 3. | 94102 | 67.4% | 6.9%(+60.5)#7 | 8.3%(+59.1)#214 |
| 4. | 94103 | 56.0% | 6.9%(+49.1)#8 | 8.3%(+47.7)#300 |
| 5. | 94109 | 55.1% | 6.9%(+48.2)#9 | 8.3%(+46.8)#306 |
| 6. | 94133 | 49.7% | 6.9%(+42.8)#15 | 8.3%(+41.4)#350 |
| 7. | 94111 | 40.2% | 6.9%(+33.3)#23 | 8.3%(+31.9)#507 |
| 8. | 94115 | 33.1% | 6.9%(+26.2)#25 | 8.3%(+24.8)#693 |
| 9. | 94105 | 31.6% | 6.9%(+24.7)#27 | 8.3%(+23.3)#740 |
| 10. | 94117 | 29.9% | 6.9%(+23.0)#30 | 8.3%(+21.6)#805 |
| 11. | 94158 | 29.9% | 6.9%(+23.0)#31 | 8.3%(+21.6)#807 |
| 12. | 94107 | 28.6% | 6.9%(+21.7)#34 | 8.3%(+20.3)#864 |
| 13. | 94114 | 25.9% | 6.9%(+19.0)#40 | 8.3%(+17.6)#1,006 |
| 14. | 94110 | 25.2% | 6.9%(+18.3)#41 | 8.3%(+16.9)#1,051 |
| 15. | 94123 | 25.1% | 6.9%(+18.2)#42 | 8.3%(+16.8)#1,059 |
| 16. | 94118 | 22.3% | 6.9%(+15.4)#55 | 8.3%(+14.0)#1,271 |
| 17. | 94121 | 18.9% | 6.9%(+12.0)#72 | 8.3%(+10.6)#1,645 |
| 18. | 94122 | 15.8% | 6.9%(+8.90)#95 | 8.3%(+7.50)#2,195 |
| 19. | 94134 | 15.3% | 6.9%(+8.40)#103 | 8.3%(+7.00)#2,295 |
| 20. | 94124 | 15.2% | 6.9%(+8.30)#105 | 8.3%(+6.90)#2,324 |
| 21. | 94132 | 15.2% | 6.9%(+8.30)#106 | 8.3%(+6.90)#2,326 |
| 22. | 94130 | 15.0% | 6.9%(+8.10)#113 | 8.3%(+6.70)#2,393 |
| 23. | 94112 | 12.9% | 6.9%(+6.00)#155 | 8.3%(+4.60)#3,127 |
| 24. | 94116 | 10.5% | 6.9%(+3.60)#210 | 8.3%(+2.20)#4,446 |
| 25. | 94131 | 10.4% | 6.9%(+3.50)#217 | 8.3%(+2.10)#4,528 |
| 26. | 94127 | 5.9% | 6.9%(-1.00)#624 | 8.3%(-2.40)#10,701 |
| 27. | 94129 | 4.2% | 6.9%(-2.70)#892 | 8.3%(-4.10)#15,223 |
1
Common Questions
What are the Top 10 Zip Codes with the Highest Percentage of Households Without a Vehicle in San Francisco, CA?
Top 10 Zip Codes with the Highest Percentage of Households Without a Vehicle in San Francisco, CA are:
What zip code has the Highest Percentage of Households Without a Vehicle in San Francisco, CA?
94104 has the Highest Percentage of Households Without a Vehicle in San Francisco, CA with 74.2%.
What is the Percentage of Households Without a Vehicle in San Francisco, CA?
Percentage of Households Without a Vehicle in San Francisco is 29.9%.
What is the Percentage of Households Without a Vehicle in California?
Percentage of Households Without a Vehicle in California is 6.9%.
What is the Percentage of Households Without a Vehicle in the United States?
Percentage of Households Without a Vehicle in the United States is 8.3%.