Cities with the Highest Percentage of Households Without a Vehicle in Iowa
RELATED REPORTS & OPTIONS
Households without a Cars
Iowa
Compare Cities
Map of Cities with the Highest Percentage of Households Without a Vehicle in Iowa
0.0%
60.0%
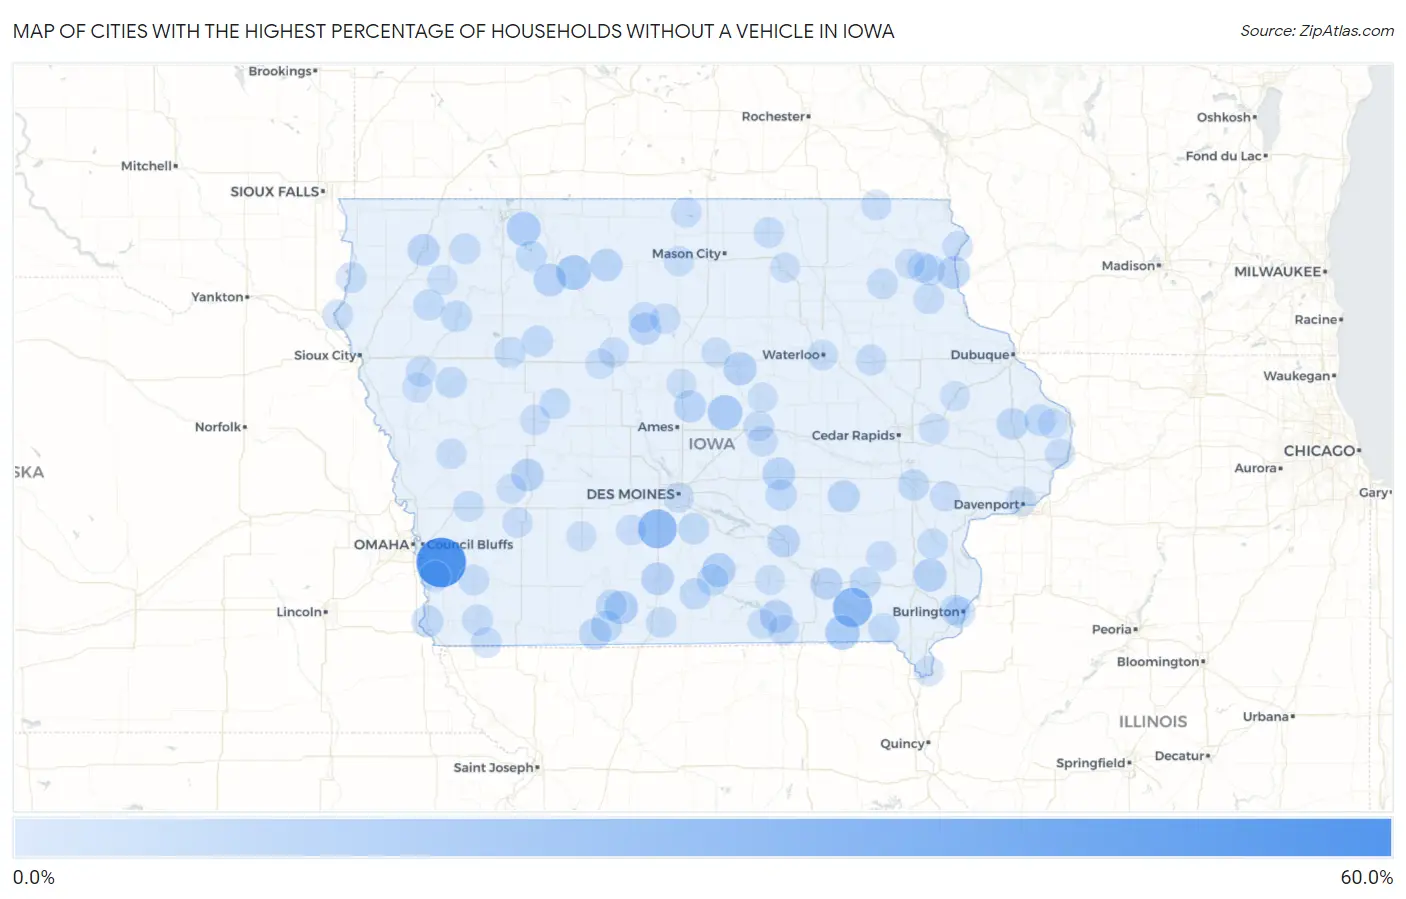
Cities with the Highest Percentage of Households Without a Vehicle in Iowa
| City | Housholds Without a Car | vs State | vs National | |
| 1. | Mineola | 57.9% | 5.6% (+52.3)#1 | 8.3% (+49.6)#192 |
| 2. | Douds | 31.2% | 5.6% (+25.6)#2 | 8.3% (+22.9)#541 |
| 3. | Bevington | 30.0% | 5.6% (+24.4)#3 | 8.3% (+21.7)#591 |
| 4. | St Anthony | 20.0% | 5.6% (+14.4)#4 | 8.3% (+11.7)#1,411 |
| 5. | Rodman | 20.0% | 5.6% (+14.4)#5 | 8.3% (+11.7)#1,420 |
| 6. | Milton | 19.4% | 5.6% (+13.8)#6 | 8.3% (+11.1)#1,522 |
| 7. | Terril | 18.1% | 5.6% (+12.5)#7 | 8.3% (+9.80)#1,760 |
| 8. | Williamson | 17.0% | 5.6% (+11.4)#8 | 8.3% (+8.70)#2,038 |
| 9. | Ellston | 16.7% | 5.6% (+11.1)#9 | 8.3% (+8.40)#2,129 |
| 10. | Steamboat Rock | 16.2% | 5.6% (+10.6)#10 | 8.3% (+7.90)#2,275 |
| 11. | Mount Union | 15.7% | 5.6% (+10.1)#11 | 8.3% (+7.40)#2,450 |
| 12. | Udell | 15.4% | 5.6% (+9.80)#12 | 8.3% (+7.10)#2,561 |
| 13. | Curlew | 15.0% | 5.6% (+9.40)#13 | 8.3% (+6.70)#2,707 |
| 14. | Osceola | 14.9% | 5.6% (+9.30)#14 | 8.3% (+6.60)#2,713 |
| 15. | Mcgregor | 14.9% | 5.6% (+9.30)#15 | 8.3% (+6.60)#2,735 |
| 16. | Audubon | 14.8% | 5.6% (+9.20)#16 | 8.3% (+6.50)#2,760 |
| 17. | Grinnell | 14.7% | 5.6% (+9.10)#17 | 8.3% (+6.40)#2,788 |
| 18. | Beacon | 14.4% | 5.6% (+8.80)#18 | 8.3% (+6.10)#2,953 |
| 19. | Algona | 14.1% | 5.6% (+8.50)#19 | 8.3% (+5.80)#3,054 |
| 20. | Millersburg | 13.8% | 5.6% (+8.20)#20 | 8.3% (+5.50)#3,213 |
| 21. | Sheldon | 13.5% | 5.6% (+7.90)#21 | 8.3% (+5.20)#3,319 |
| 22. | Eagle Grove | 13.3% | 5.6% (+7.70)#22 | 8.3% (+5.00)#3,406 |
| 23. | Roland | 13.3% | 5.6% (+7.70)#23 | 8.3% (+5.00)#3,417 |
| 24. | Agency | 13.2% | 5.6% (+7.60)#24 | 8.3% (+4.90)#3,479 |
| 25. | Percival | 13.0% | 5.6% (+7.40)#25 | 8.3% (+4.70)#3,576 |
| 26. | Maquoketa | 12.6% | 5.6% (+7.00)#26 | 8.3% (+4.30)#3,746 |
| 27. | Delphos | 12.5% | 5.6% (+6.90)#27 | 8.3% (+4.20)#3,858 |
| 28. | Fairfield | 12.2% | 5.6% (+6.60)#28 | 8.3% (+3.90)#3,990 |
| 29. | Spragueville | 12.2% | 5.6% (+6.60)#29 | 8.3% (+3.90)#4,042 |
| 30. | Chariton | 12.1% | 5.6% (+6.50)#30 | 8.3% (+3.80)#4,055 |
| 31. | Searsboro | 12.1% | 5.6% (+6.50)#31 | 8.3% (+3.80)#4,100 |
| 32. | Cherokee | 11.8% | 5.6% (+6.20)#32 | 8.3% (+3.50)#4,255 |
| 33. | Mooar | 11.8% | 5.6% (+6.20)#33 | 8.3% (+3.50)#4,299 |
| 34. | Ackworth | 11.8% | 5.6% (+6.20)#34 | 8.3% (+3.50)#4,308 |
| 35. | Mount Ayr | 11.6% | 5.6% (+6.00)#35 | 8.3% (+3.30)#4,398 |
| 36. | Battle Creek | 11.6% | 5.6% (+6.00)#36 | 8.3% (+3.30)#4,414 |
| 37. | Fonda | 11.6% | 5.6% (+6.00)#37 | 8.3% (+3.30)#4,420 |
| 38. | Iowa City | 11.5% | 5.6% (+5.90)#38 | 8.3% (+3.20)#4,439 |
| 39. | Derby | 11.4% | 5.6% (+5.80)#39 | 8.3% (+3.10)#4,569 |
| 40. | Nemaha | 11.4% | 5.6% (+5.80)#40 | 8.3% (+3.10)#4,570 |
| 41. | Marcus | 11.3% | 5.6% (+5.70)#41 | 8.3% (+3.00)#4,608 |
| 42. | Ruthven | 11.3% | 5.6% (+5.70)#42 | 8.3% (+3.00)#4,620 |
| 43. | Bonaparte | 11.0% | 5.6% (+5.40)#43 | 8.3% (+2.70)#4,860 |
| 44. | Glenwood | 10.9% | 5.6% (+5.30)#44 | 8.3% (+2.60)#4,894 |
| 45. | Tingley | 10.9% | 5.6% (+5.30)#45 | 8.3% (+2.60)#4,962 |
| 46. | Monona | 10.8% | 5.6% (+5.20)#46 | 8.3% (+2.50)#5,005 |
| 47. | Lanesboro | 10.8% | 5.6% (+5.20)#47 | 8.3% (+2.50)#5,031 |
| 48. | Burlington | 10.7% | 5.6% (+5.10)#48 | 8.3% (+2.40)#5,041 |
| 49. | Shenandoah | 10.6% | 5.6% (+5.00)#49 | 8.3% (+2.30)#5,128 |
| 50. | Hartley | 10.6% | 5.6% (+5.00)#50 | 8.3% (+2.30)#5,159 |
| 51. | Independence | 10.5% | 5.6% (+4.90)#51 | 8.3% (+2.20)#5,224 |
| 52. | Shelby | 10.5% | 5.6% (+4.90)#52 | 8.3% (+2.20)#5,265 |
| 53. | Emerson | 10.5% | 5.6% (+4.90)#53 | 8.3% (+2.20)#5,272 |
| 54. | Elkader | 10.4% | 5.6% (+4.80)#54 | 8.3% (+2.10)#5,332 |
| 55. | Anthon | 10.4% | 5.6% (+4.80)#55 | 8.3% (+2.10)#5,349 |
| 56. | Hawarden | 10.3% | 5.6% (+4.70)#56 | 8.3% (+2.00)#5,399 |
| 57. | West Union | 10.3% | 5.6% (+4.70)#57 | 8.3% (+2.00)#5,402 |
| 58. | Leon | 10.3% | 5.6% (+4.70)#58 | 8.3% (+2.00)#5,408 |
| 59. | Moulton | 10.3% | 5.6% (+4.70)#59 | 8.3% (+2.00)#5,427 |
| 60. | Luana | 10.3% | 5.6% (+4.70)#60 | 8.3% (+2.00)#5,442 |
| 61. | Osage | 10.1% | 5.6% (+4.50)#61 | 8.3% (+1.80)#5,588 |
| 62. | Goldfield | 10.1% | 5.6% (+4.50)#62 | 8.3% (+1.80)#5,619 |
| 63. | Westfield | 10.1% | 5.6% (+4.50)#63 | 8.3% (+1.80)#5,635 |
| 64. | Columbus City | 10.0% | 5.6% (+4.40)#64 | 8.3% (+1.70)#5,705 |
| 65. | Ferguson | 10.0% | 5.6% (+4.40)#65 | 8.3% (+1.70)#5,713 |
| 66. | Northboro | 10.0% | 5.6% (+4.40)#66 | 8.3% (+1.70)#5,714 |
| 67. | Waterloo | 9.8% | 5.6% (+4.20)#67 | 8.3% (+1.50)#5,811 |
| 68. | Winterset | 9.7% | 5.6% (+4.10)#68 | 8.3% (+1.40)#5,928 |
| 69. | Clarion | 9.7% | 5.6% (+4.10)#69 | 8.3% (+1.40)#5,938 |
| 70. | Brighton | 9.7% | 5.6% (+4.10)#70 | 8.3% (+1.40)#5,970 |
| 71. | Marshalltown | 9.6% | 5.6% (+4.00)#71 | 8.3% (+1.30)#6,010 |
| 72. | Carroll | 9.6% | 5.6% (+4.00)#72 | 8.3% (+1.30)#6,017 |
| 73. | Dunlap | 9.6% | 5.6% (+4.00)#73 | 8.3% (+1.30)#6,054 |
| 74. | Atlantic | 9.5% | 5.6% (+3.90)#74 | 8.3% (+1.20)#6,121 |
| 75. | Clinton | 9.4% | 5.6% (+3.80)#75 | 8.3% (+1.10)#6,195 |
| 76. | West Liberty | 9.4% | 5.6% (+3.80)#76 | 8.3% (+1.10)#6,227 |
| 77. | Lake Mills | 9.4% | 5.6% (+3.80)#77 | 8.3% (+1.10)#6,240 |
| 78. | Harpers Ferry | 9.4% | 5.6% (+3.80)#78 | 8.3% (+1.10)#6,295 |
| 79. | Fort Dodge | 9.3% | 5.6% (+3.70)#79 | 8.3% (+1.00)#6,318 |
| 80. | Keokuk | 9.2% | 5.6% (+3.60)#80 | 8.3% (+0.900)#6,430 |
| 81. | Des Moines | 9.1% | 5.6% (+3.50)#81 | 8.3% (+0.800)#6,511 |
| 82. | West Burlington | 9.1% | 5.6% (+3.50)#82 | 8.3% (+0.800)#6,551 |
| 83. | Garner | 9.1% | 5.6% (+3.50)#83 | 8.3% (+0.800)#6,552 |
| 84. | Burr Oak | 9.1% | 5.6% (+3.50)#84 | 8.3% (+0.800)#6,609 |
| 85. | Davenport | 9.0% | 5.6% (+3.40)#85 | 8.3% (+0.700)#6,633 |
| 86. | Kimballton | 9.0% | 5.6% (+3.40)#86 | 8.3% (+0.700)#6,744 |
| 87. | Centerville | 8.9% | 5.6% (+3.30)#87 | 8.3% (+0.600)#6,787 |
| 88. | Monticello | 8.9% | 5.6% (+3.30)#88 | 8.3% (+0.600)#6,796 |
| 89. | Albia | 8.9% | 5.6% (+3.30)#89 | 8.3% (+0.600)#6,798 |
| 90. | Oto | 8.9% | 5.6% (+3.30)#90 | 8.3% (+0.600)#6,866 |
| 91. | Iowa Falls | 8.8% | 5.6% (+3.20)#91 | 8.3% (+0.500)#6,900 |
| 92. | Postville | 8.8% | 5.6% (+3.20)#92 | 8.3% (+0.500)#6,913 |
| 93. | Greenfield | 8.8% | 5.6% (+3.20)#93 | 8.3% (+0.500)#6,924 |
| 94. | Moorland | 8.8% | 5.6% (+3.20)#94 | 8.3% (+0.500)#6,980 |
| 95. | Paullina | 8.7% | 5.6% (+3.10)#95 | 8.3% (+0.400)#7,068 |
| 96. | Miles | 8.7% | 5.6% (+3.10)#96 | 8.3% (+0.400)#7,080 |
| 97. | Charles City | 8.6% | 5.6% (+3.00)#97 | 8.3% (+0.300)#7,130 |
| 98. | Conrad | 8.6% | 5.6% (+3.00)#98 | 8.3% (+0.300)#7,168 |
| 99. | Ellsworth | 8.6% | 5.6% (+3.00)#99 | 8.3% (+0.300)#7,187 |
| 100. | Martelle | 8.6% | 5.6% (+3.00)#100 | 8.3% (+0.300)#7,189 |
Common Questions
What are the Top 10 Cities with the Highest Percentage of Households Without a Vehicle in Iowa?
Top 10 Cities with the Highest Percentage of Households Without a Vehicle in Iowa are:
#1
57.9%
#2
31.2%
#3
30.0%
#4
20.0%
#5
20.0%
#6
19.4%
#7
18.1%
#8
17.0%
#9
16.7%
#10
16.2%
What city has the Highest Percentage of Households Without a Vehicle in Iowa?
Mineola has the Highest Percentage of Households Without a Vehicle in Iowa with 57.9%.
What is the Percentage of Households Without a Vehicle in the State of Iowa?
Percentage of Households Without a Vehicle in Iowa is 5.6%.
What is the Percentage of Households Without a Vehicle in the United States?
Percentage of Households Without a Vehicle in the United States is 8.3%.