Westmont, CA Map & Demographics
Westmont Map
Westmont Overview
$21,086
PER CAPITA INCOME
$59,439
AVG FAMILY INCOME
$49,958
AVG HOUSEHOLD INCOME
22.4%
WAGE / INCOME GAP [ % ]
77.6¢/ $1
WAGE / INCOME GAP [ $ ]
$9,710
FAMILY INCOME DEFICIT
0.47
INEQUALITY / GINI INDEX
35,345
TOTAL POPULATION
16,912
MALE POPULATION
18,433
FEMALE POPULATION
91.75
MALES / 100 FEMALES
108.99
FEMALES / 100 MALES
32.1
MEDIAN AGE
4.0
AVG FAMILY SIZE
3.3
AVG HOUSEHOLD SIZE
15,852
LABOR FORCE [ PEOPLE ]
60.6%
PERCENT IN LABOR FORCE
11.0%
UNEMPLOYMENT RATE
Income in Westmont
Income Overview in Westmont
Per Capita Income in Westmont is $21,086, while median incomes of families and households are $59,439 and $49,958 respectively.
| Characteristic | Number | Measure |
| Per Capita Income | 35,345 | $21,086 |
| Median Family Income | 7,542 | $59,439 |
| Mean Family Income | 7,542 | $71,837 |
| Median Household Income | 10,551 | $49,958 |
| Mean Household Income | 10,551 | $66,748 |
| Income Deficit | 7,542 | $9,710 |
| Wage / Income Gap (%) | 35,345 | 22.36% |
| Wage / Income Gap ($) | 35,345 | 77.64¢ per $1 |
| Gini / Inequality Index | 35,345 | 0.47 |
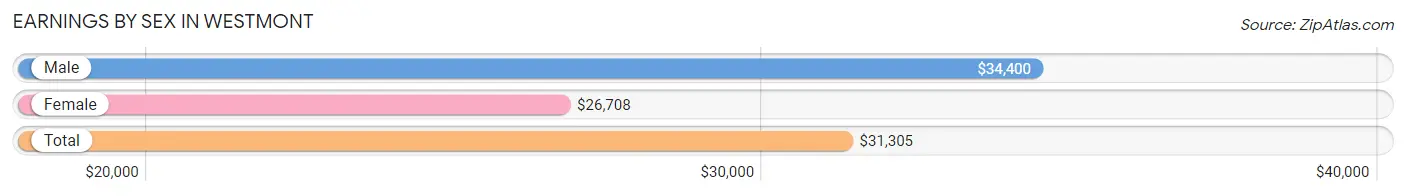
Earnings by Sex in Westmont
Average Earnings in Westmont are $31,305, $34,400 for men and $26,708 for women, a difference of 22.4%.
| Sex | Number | Average Earnings |
| Male | 7,590 (49.5%) | $34,400 |
| Female | 7,741 (50.5%) | $26,708 |
| Total | 15,331 (100.0%) | $31,305 |
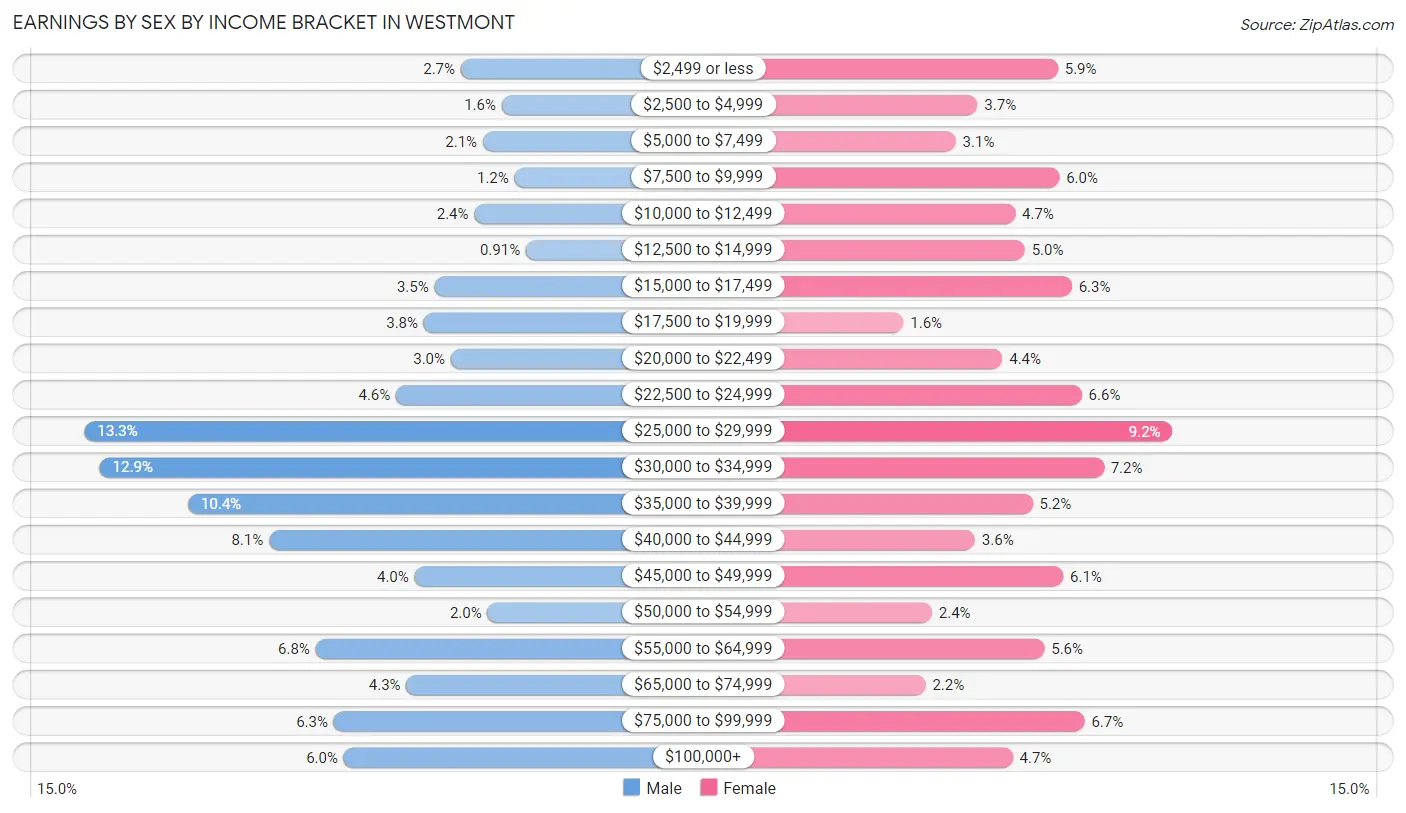
Earnings by Sex by Income Bracket in Westmont
The most common earnings brackets in Westmont are $25,000 to $29,999 for men (1,011 | 13.3%) and $25,000 to $29,999 for women (708 | 9.1%).
| Income | Male | Female |
| $2,499 or less | 208 (2.7%) | 459 (5.9%) |
| $2,500 to $4,999 | 121 (1.6%) | 284 (3.7%) |
| $5,000 to $7,499 | 161 (2.1%) | 237 (3.1%) |
| $7,500 to $9,999 | 93 (1.2%) | 462 (6.0%) |
| $10,000 to $12,499 | 179 (2.4%) | 366 (4.7%) |
| $12,500 to $14,999 | 69 (0.9%) | 387 (5.0%) |
| $15,000 to $17,499 | 264 (3.5%) | 489 (6.3%) |
| $17,500 to $19,999 | 287 (3.8%) | 123 (1.6%) |
| $20,000 to $22,499 | 229 (3.0%) | 338 (4.4%) |
| $22,500 to $24,999 | 346 (4.6%) | 511 (6.6%) |
| $25,000 to $29,999 | 1,011 (13.3%) | 708 (9.1%) |
| $30,000 to $34,999 | 978 (12.9%) | 559 (7.2%) |
| $35,000 to $39,999 | 790 (10.4%) | 404 (5.2%) |
| $40,000 to $44,999 | 617 (8.1%) | 279 (3.6%) |
| $45,000 to $49,999 | 307 (4.0%) | 471 (6.1%) |
| $50,000 to $54,999 | 151 (2.0%) | 185 (2.4%) |
| $55,000 to $64,999 | 518 (6.8%) | 430 (5.6%) |
| $65,000 to $74,999 | 324 (4.3%) | 171 (2.2%) |
| $75,000 to $99,999 | 479 (6.3%) | 517 (6.7%) |
| $100,000+ | 458 (6.0%) | 361 (4.7%) |
| Total | 7,590 (100.0%) | 7,741 (100.0%) |
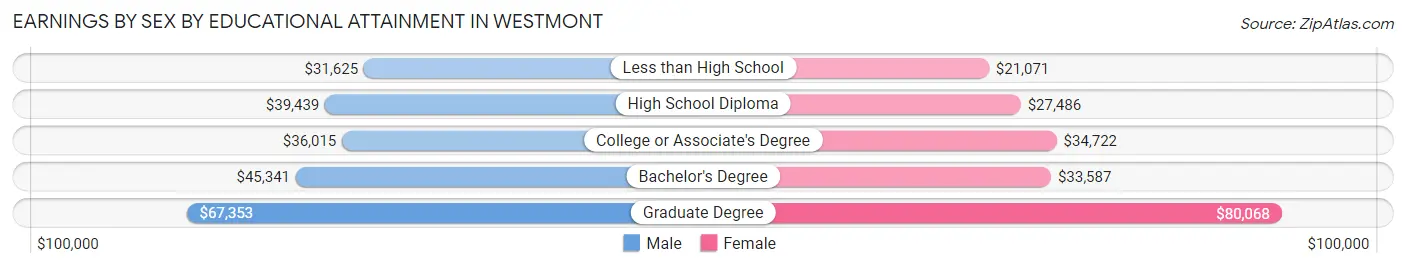
Earnings by Sex by Educational Attainment in Westmont
Average earnings in Westmont are $36,702 for men and $29,038 for women, a difference of 20.9%. Men with an educational attainment of graduate degree enjoy the highest average annual earnings of $67,353, while those with less than high school education earn the least with $31,625. Women with an educational attainment of graduate degree earn the most with the average annual earnings of $80,068, while those with less than high school education have the smallest earnings of $21,071.
| Educational Attainment | Male Income | Female Income |
| Less than High School | $31,625 | $21,071 |
| High School Diploma | $39,439 | $27,486 |
| College or Associate's Degree | $36,015 | $34,722 |
| Bachelor's Degree | $45,341 | $33,587 |
| Graduate Degree | $67,353 | $80,068 |
| Total | $36,702 | $29,038 |
Family Income in Westmont
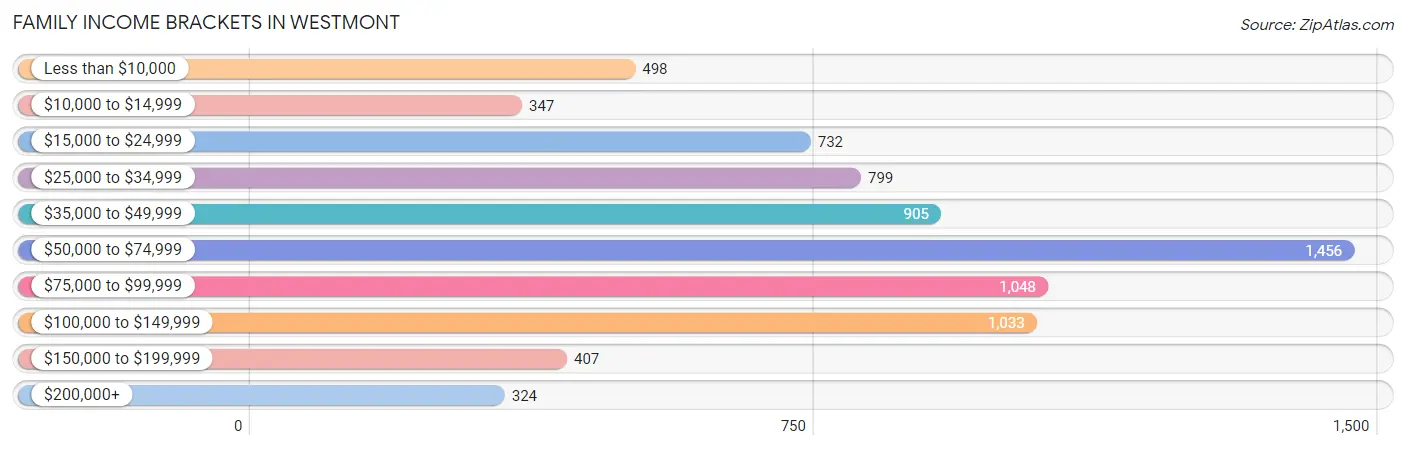
Family Income Brackets in Westmont
According to the Westmont family income data, there are 1,456 families falling into the $50,000 to $74,999 income range, which is the most common income bracket and makes up 19.3% of all families. Conversely, the $200,000+ income bracket is the least frequent group with only 324 families (4.3%) belonging to this category.
| Income Bracket | # Families | % Families |
| Less than $10,000 | 498 | 6.6% |
| $10,000 to $14,999 | 347 | 4.6% |
| $15,000 to $24,999 | 732 | 9.7% |
| $25,000 to $34,999 | 799 | 10.6% |
| $35,000 to $49,999 | 905 | 12.0% |
| $50,000 to $74,999 | 1,456 | 19.3% |
| $75,000 to $99,999 | 1,048 | 13.9% |
| $100,000 to $149,999 | 1,033 | 13.7% |
| $150,000 to $199,999 | 407 | 5.4% |
| $200,000+ | 324 | 4.3% |
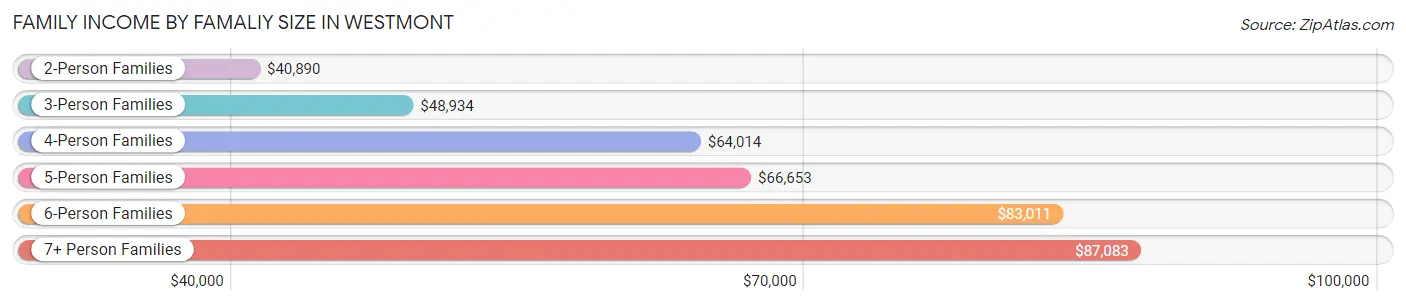
Family Income by Famaliy Size in Westmont
7+ person families (438 | 5.8%) account for the highest median family income in Westmont with $87,083 per family, while 2-person families (2,112 | 28.0%) have the highest median income of $20,445 per family member.
| Income Bracket | # Families | Median Income |
| 2-Person Families | 2,112 (28.0%) | $40,890 |
| 3-Person Families | 1,769 (23.5%) | $48,934 |
| 4-Person Families | 1,624 (21.5%) | $64,014 |
| 5-Person Families | 1,065 (14.1%) | $66,653 |
| 6-Person Families | 534 (7.1%) | $83,011 |
| 7+ Person Families | 438 (5.8%) | $87,083 |
| Total | 7,542 (100.0%) | $59,439 |
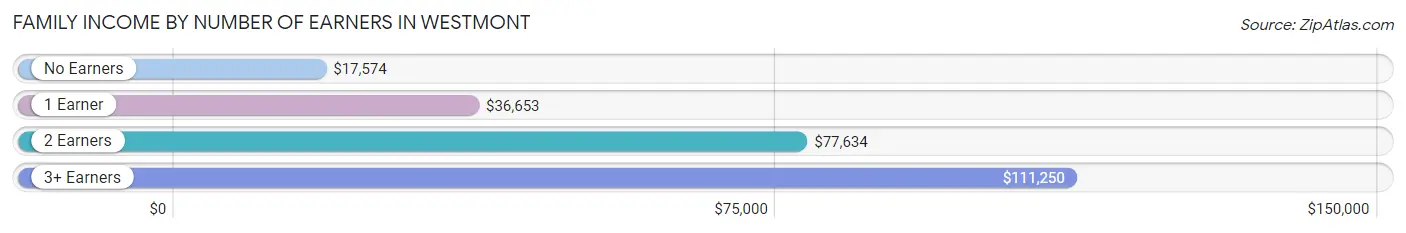
Family Income by Number of Earners in Westmont
The median family income in Westmont is $59,439, with families comprising 3+ earners (1,243) having the highest median family income of $111,250, while families with no earners (992) have the lowest median family income of $17,574, accounting for 16.5% and 13.2% of families, respectively.
| Number of Earners | # Families | Median Income |
| No Earners | 992 (13.2%) | $17,574 |
| 1 Earner | 2,708 (35.9%) | $36,653 |
| 2 Earners | 2,599 (34.5%) | $77,634 |
| 3+ Earners | 1,243 (16.5%) | $111,250 |
| Total | 7,542 (100.0%) | $59,439 |
Household Income in Westmont
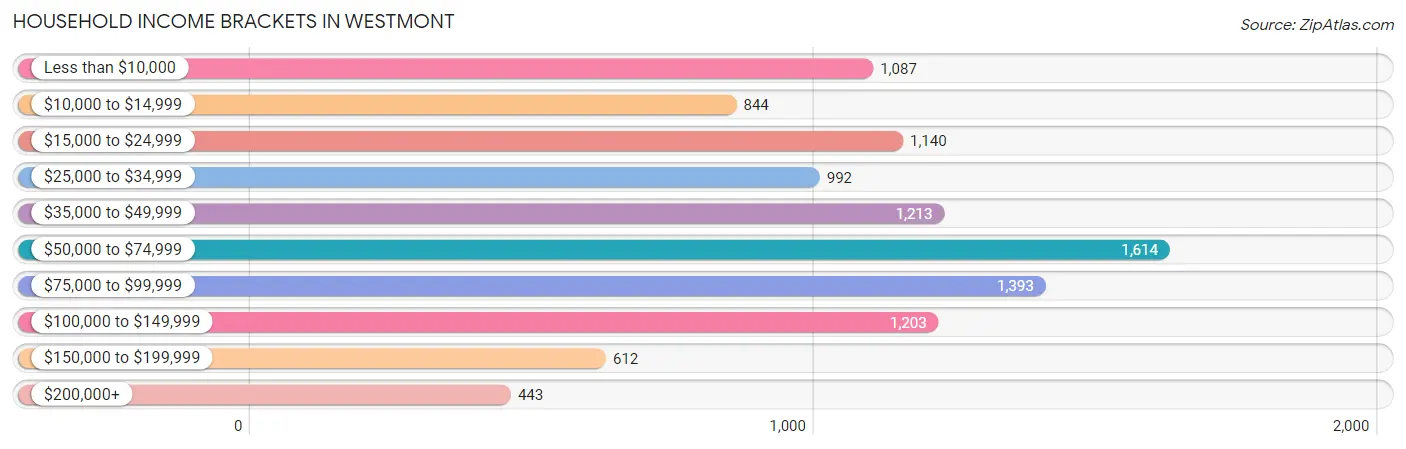
Household Income Brackets in Westmont
With 1,614 households falling in the category, the $50,000 to $74,999 income range is the most frequent in Westmont, accounting for 15.3% of all households. In contrast, only 443 households (4.2%) fall into the $200,000+ income bracket, making it the least populous group.
| Income Bracket | # Households | % Households |
| Less than $10,000 | 1,087 | 10.3% |
| $10,000 to $14,999 | 844 | 8.0% |
| $15,000 to $24,999 | 1,140 | 10.8% |
| $25,000 to $34,999 | 992 | 9.4% |
| $35,000 to $49,999 | 1,213 | 11.5% |
| $50,000 to $74,999 | 1,614 | 15.3% |
| $75,000 to $99,999 | 1,393 | 13.2% |
| $100,000 to $149,999 | 1,203 | 11.4% |
| $150,000 to $199,999 | 612 | 5.8% |
| $200,000+ | 443 | 4.2% |
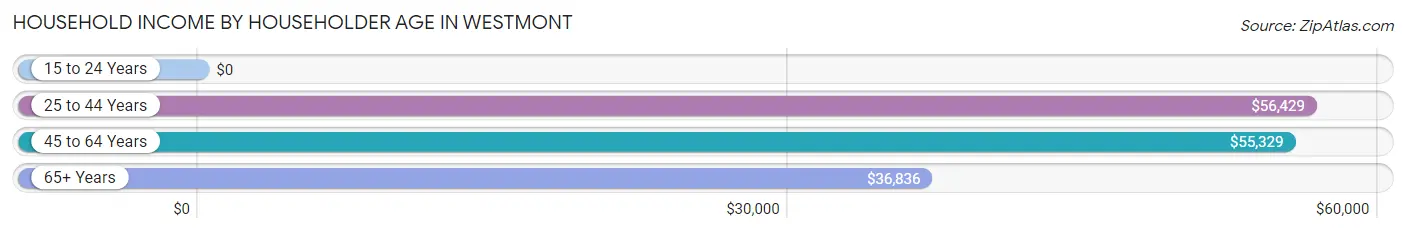
Household Income by Householder Age in Westmont
The median household income in Westmont is $49,958, with the highest median household income of $56,429 found in the 25 to 44 years age bracket for the primary householder. A total of 3,972 households (37.7%) fall into this category. Meanwhile, the 15 to 24 years age bracket for the primary householder has the lowest median household income of $0, with 142 households (1.3%) in this group.
| Income Bracket | # Households | Median Income |
| 15 to 24 Years | 142 (1.3%) | $0 |
| 25 to 44 Years | 3,972 (37.7%) | $56,429 |
| 45 to 64 Years | 4,382 (41.5%) | $55,329 |
| 65+ Years | 2,055 (19.5%) | $36,836 |
| Total | 10,551 (100.0%) | $49,958 |
Poverty in Westmont
Income Below Poverty by Sex and Age in Westmont
With 19.6% poverty level for males and 25.8% for females among the residents of Westmont, 15 year old males and 45 to 54 year old females are the most vulnerable to poverty, with 213 males (55.2%) and 805 females (34.4%) in their respective age groups living below the poverty level.
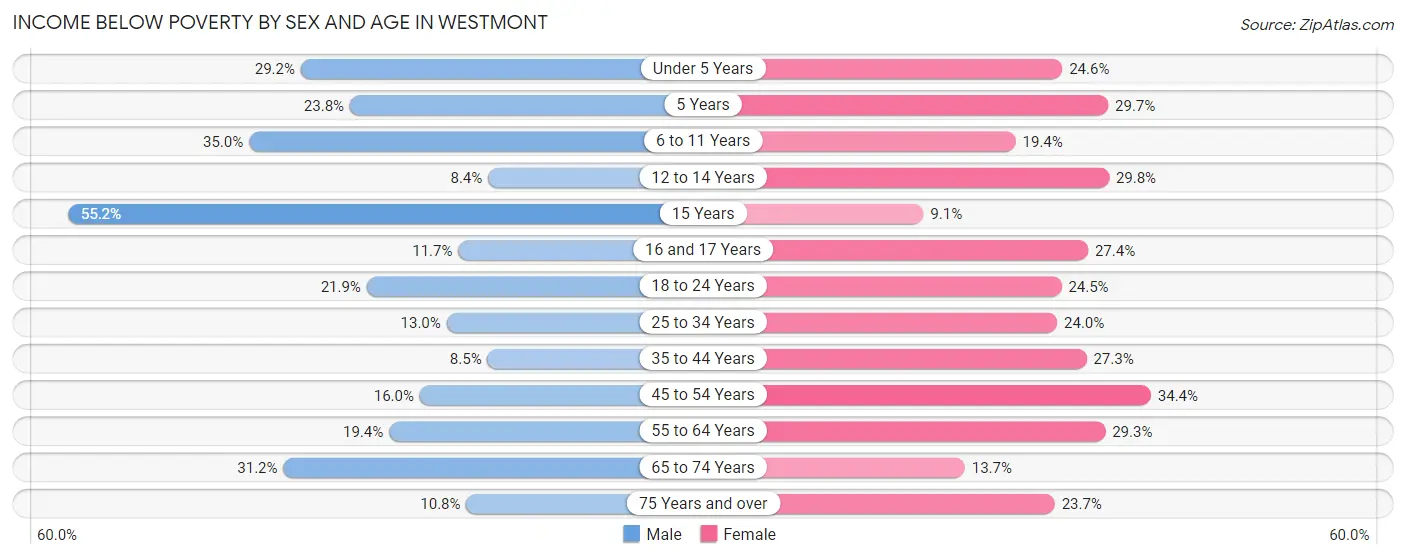
| Age Bracket | Male | Female |
| Under 5 Years | 398 (29.2%) | 285 (24.5%) |
| 5 Years | 77 (23.8%) | 97 (29.7%) |
| 6 to 11 Years | 616 (35.0%) | 255 (19.4%) |
| 12 to 14 Years | 100 (8.4%) | 263 (29.7%) |
| 15 Years | 213 (55.2%) | 23 (9.1%) |
| 16 and 17 Years | 68 (11.7%) | 153 (27.4%) |
| 18 to 24 Years | 398 (21.9%) | 430 (24.5%) |
| 25 to 34 Years | 323 (13.0%) | 668 (24.0%) |
| 35 to 44 Years | 177 (8.5%) | 822 (27.3%) |
| 45 to 54 Years | 321 (16.0%) | 805 (34.4%) |
| 55 to 64 Years | 270 (19.4%) | 522 (29.3%) |
| 65 to 74 Years | 270 (31.2%) | 151 (13.7%) |
| 75 Years and over | 57 (10.8%) | 238 (23.7%) |
| Total | 3,288 (19.6%) | 4,712 (25.8%) |
Income Above Poverty by Sex and Age in Westmont
According to the poverty statistics in Westmont, males aged 12 to 14 years and females aged 15 years are the age groups that are most secure financially, with 91.6% of males and 90.9% of females in these age groups living above the poverty line.
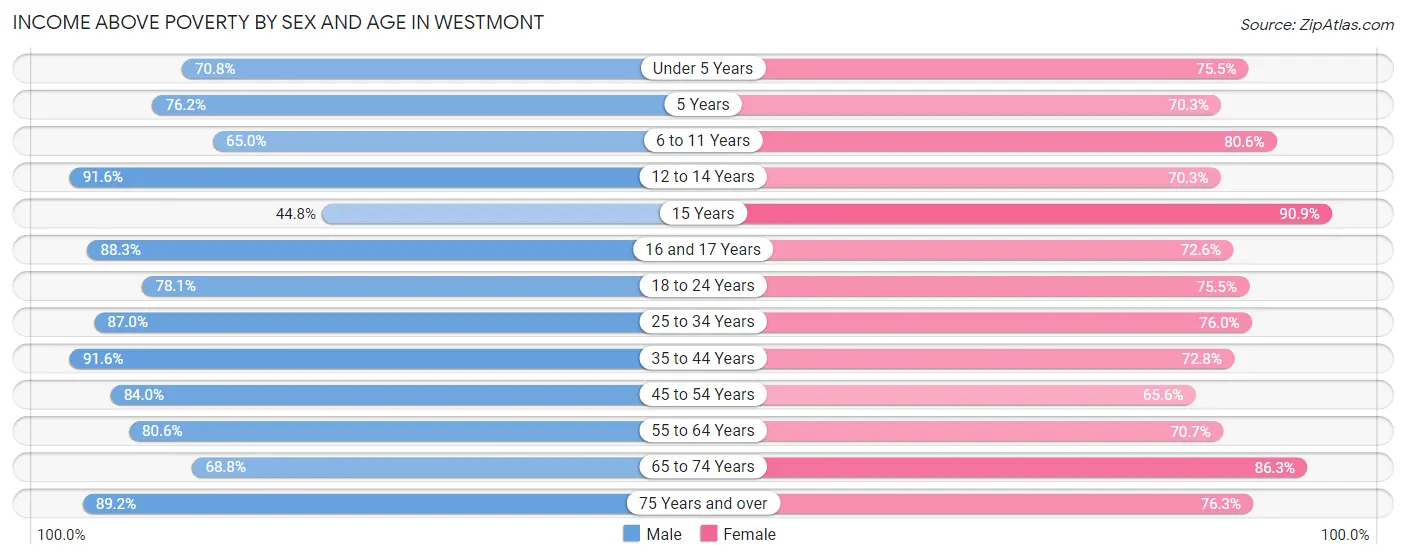
| Age Bracket | Male | Female |
| Under 5 Years | 963 (70.8%) | 876 (75.4%) |
| 5 Years | 247 (76.2%) | 230 (70.3%) |
| 6 to 11 Years | 1,144 (65.0%) | 1,062 (80.6%) |
| 12 to 14 Years | 1,094 (91.6%) | 621 (70.3%) |
| 15 Years | 173 (44.8%) | 230 (90.9%) |
| 16 and 17 Years | 513 (88.3%) | 405 (72.6%) |
| 18 to 24 Years | 1,419 (78.1%) | 1,328 (75.5%) |
| 25 to 34 Years | 2,162 (87.0%) | 2,118 (76.0%) |
| 35 to 44 Years | 1,918 (91.5%) | 2,194 (72.8%) |
| 45 to 54 Years | 1,686 (84.0%) | 1,534 (65.6%) |
| 55 to 64 Years | 1,121 (80.6%) | 1,257 (70.7%) |
| 65 to 74 Years | 596 (68.8%) | 951 (86.3%) |
| 75 Years and over | 471 (89.2%) | 766 (76.3%) |
| Total | 13,507 (80.4%) | 13,572 (74.2%) |
Income Below Poverty Among Married-Couple Families in Westmont
The poverty statistics for married-couple families in Westmont show that 14.6% or 439 of the total 3,016 families live below the poverty line. Families with 3 or 4 children have the highest poverty rate of 19.2%, comprising of 106 families. On the other hand, families with 5 or more children have the lowest poverty rate of 0.0%, which includes 0 families.
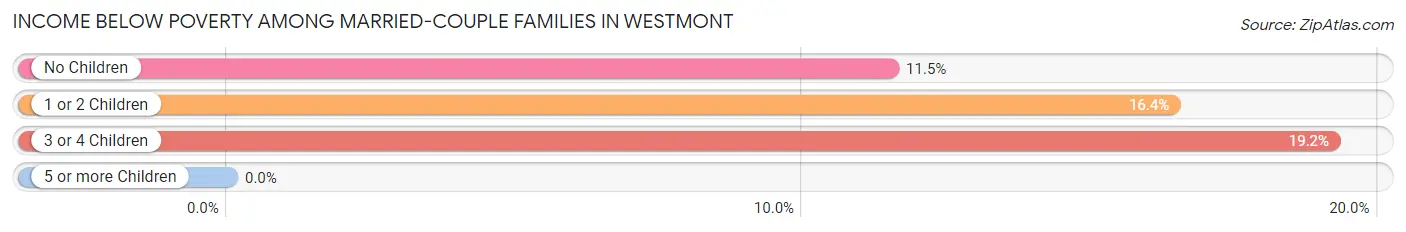
| Children | Above Poverty | Below Poverty |
| No Children | 1,092 (88.5%) | 142 (11.5%) |
| 1 or 2 Children | 972 (83.6%) | 191 (16.4%) |
| 3 or 4 Children | 446 (80.8%) | 106 (19.2%) |
| 5 or more Children | 67 (100.0%) | 0 (0.0%) |
| Total | 2,577 (85.4%) | 439 (14.6%) |
Income Below Poverty Among Single-Parent Households in Westmont
According to the poverty data in Westmont, 13.6% or 160 single-father households and 30.6% or 1,027 single-mother households are living below the poverty line. Among single-father households, those with 1 or 2 children have the highest poverty rate, with 110 households (21.1%) experiencing poverty. Likewise, among single-mother households, those with 1 or 2 children have the highest poverty rate, with 769 households (44.3%) falling below the poverty line.
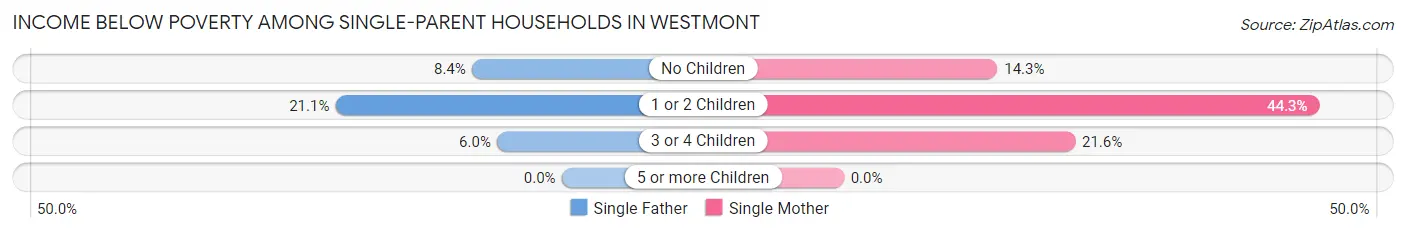
| Children | Single Father | Single Mother |
| No Children | 38 (8.4%) | 166 (14.3%) |
| 1 or 2 Children | 110 (21.1%) | 769 (44.3%) |
| 3 or 4 Children | 12 (6.0%) | 92 (21.5%) |
| 5 or more Children | 0 (0.0%) | 0 (0.0%) |
| Total | 160 (13.6%) | 1,027 (30.6%) |
Income Below Poverty Among Married-Couple vs Single-Parent Households in Westmont
The poverty data for Westmont shows that 439 of the married-couple family households (14.6%) and 1,187 of the single-parent households (26.2%) are living below the poverty level. Within the married-couple family households, those with 3 or 4 children have the highest poverty rate, with 106 households (19.2%) falling below the poverty line. Among the single-parent households, those with 1 or 2 children have the highest poverty rate, with 879 household (38.9%) living below poverty.
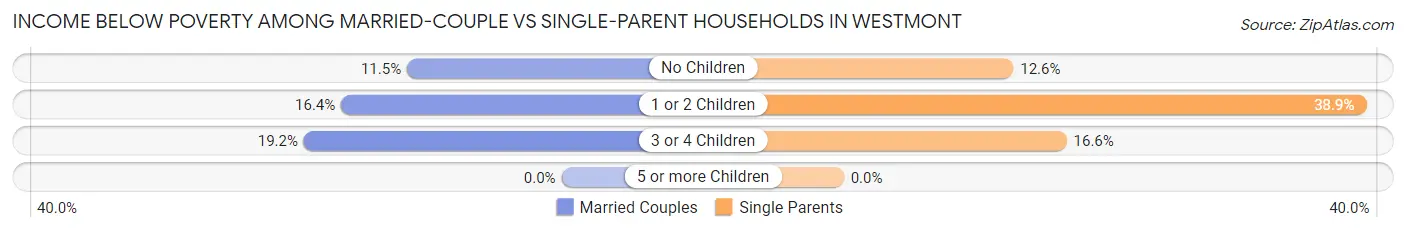
| Children | Married-Couple Families | Single-Parent Households |
| No Children | 142 (11.5%) | 204 (12.6%) |
| 1 or 2 Children | 191 (16.4%) | 879 (38.9%) |
| 3 or 4 Children | 106 (19.2%) | 104 (16.6%) |
| 5 or more Children | 0 (0.0%) | 0 (0.0%) |
| Total | 439 (14.6%) | 1,187 (26.2%) |
Race in Westmont
The most populous races in Westmont are Hispanic or Latino (20,767 | 58.8%), Black / African American (12,882 | 36.4%), and Some other Race (8,135 | 23.0%).
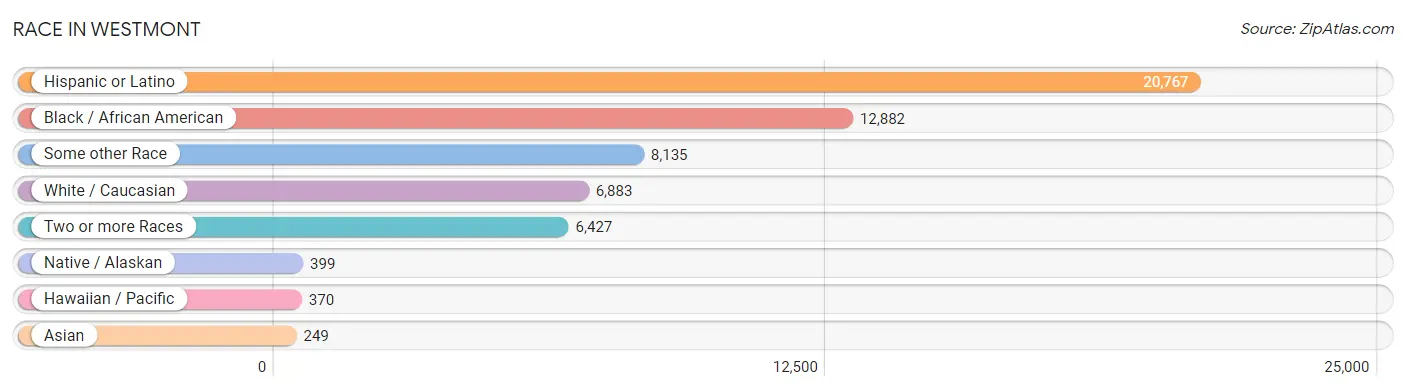
| Race | # Population | % Population |
| Asian | 249 | 0.7% |
| Black / African American | 12,882 | 36.4% |
| Hawaiian / Pacific | 370 | 1.1% |
| Hispanic or Latino | 20,767 | 58.8% |
| Native / Alaskan | 399 | 1.1% |
| White / Caucasian | 6,883 | 19.5% |
| Two or more Races | 6,427 | 18.2% |
| Some other Race | 8,135 | 23.0% |
| Total | 35,345 | 100.0% |
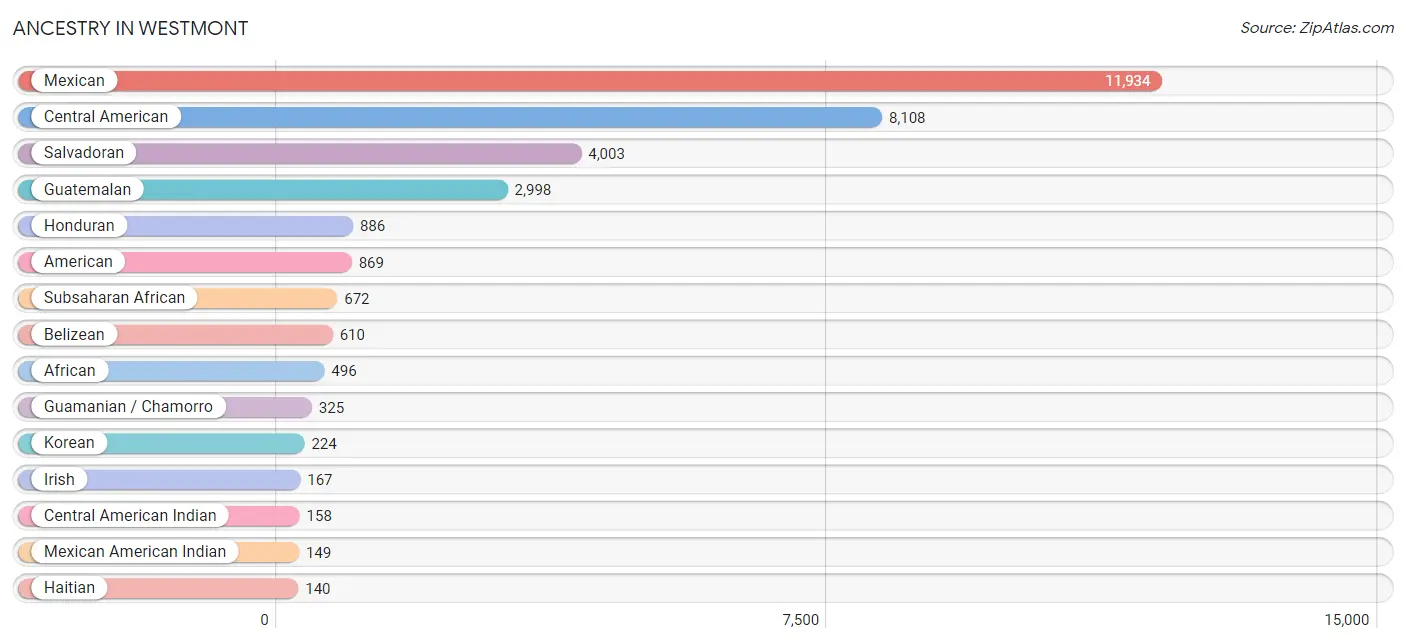
Ancestry in Westmont
The most populous ancestries reported in Westmont are Mexican (11,934 | 33.8%), Central American (8,108 | 22.9%), Salvadoran (4,003 | 11.3%), Guatemalan (2,998 | 8.5%), and Honduran (886 | 2.5%), together accounting for 79.0% of all Westmont residents.
| Ancestry | # Population | % Population |
| African | 496 | 1.4% |
| American | 869 | 2.5% |
| Arab | 21 | 0.1% |
| Armenian | 2 | 0.0% |
| Belizean | 610 | 1.7% |
| Bhutanese | 1 | 0.0% |
| Blackfeet | 12 | 0.0% |
| British West Indian | 11 | 0.0% |
| Central American | 8,108 | 22.9% |
| Central American Indian | 158 | 0.4% |
| Choctaw | 22 | 0.1% |
| Croatian | 15 | 0.0% |
| Cuban | 39 | 0.1% |
| Ecuadorian | 25 | 0.1% |
| English | 13 | 0.0% |
| Ethiopian | 44 | 0.1% |
| European | 75 | 0.2% |
| French | 113 | 0.3% |
| French American Indian | 125 | 0.4% |
| German | 107 | 0.3% |
| Guamanian / Chamorro | 325 | 0.9% |
| Guatemalan | 2,998 | 8.5% |
| Haitian | 140 | 0.4% |
| Honduran | 886 | 2.5% |
| Indian (Asian) | 83 | 0.2% |
| Iranian | 9 | 0.0% |
| Irish | 167 | 0.5% |
| Italian | 50 | 0.1% |
| Jamaican | 89 | 0.3% |
| Korean | 224 | 0.6% |
| Mexican | 11,934 | 33.8% |
| Mexican American Indian | 149 | 0.4% |
| Moroccan | 1 | 0.0% |
| Nicaraguan | 122 | 0.4% |
| Nigerian | 52 | 0.2% |
| Pakistani | 1 | 0.0% |
| Panamanian | 35 | 0.1% |
| Peruvian | 18 | 0.1% |
| Polish | 15 | 0.0% |
| Puerto Rican | 77 | 0.2% |
| Salvadoran | 4,003 | 11.3% |
| Samoan | 124 | 0.4% |
| Sioux | 25 | 0.1% |
| South American | 43 | 0.1% |
| Spaniard | 22 | 0.1% |
| Sri Lankan | 20 | 0.1% |
| Subsaharan African | 672 | 1.9% |
| Thai | 20 | 0.1% |
| Tongan | 4 | 0.0% |
| Welsh | 10 | 0.0% | View All 50 Rows |
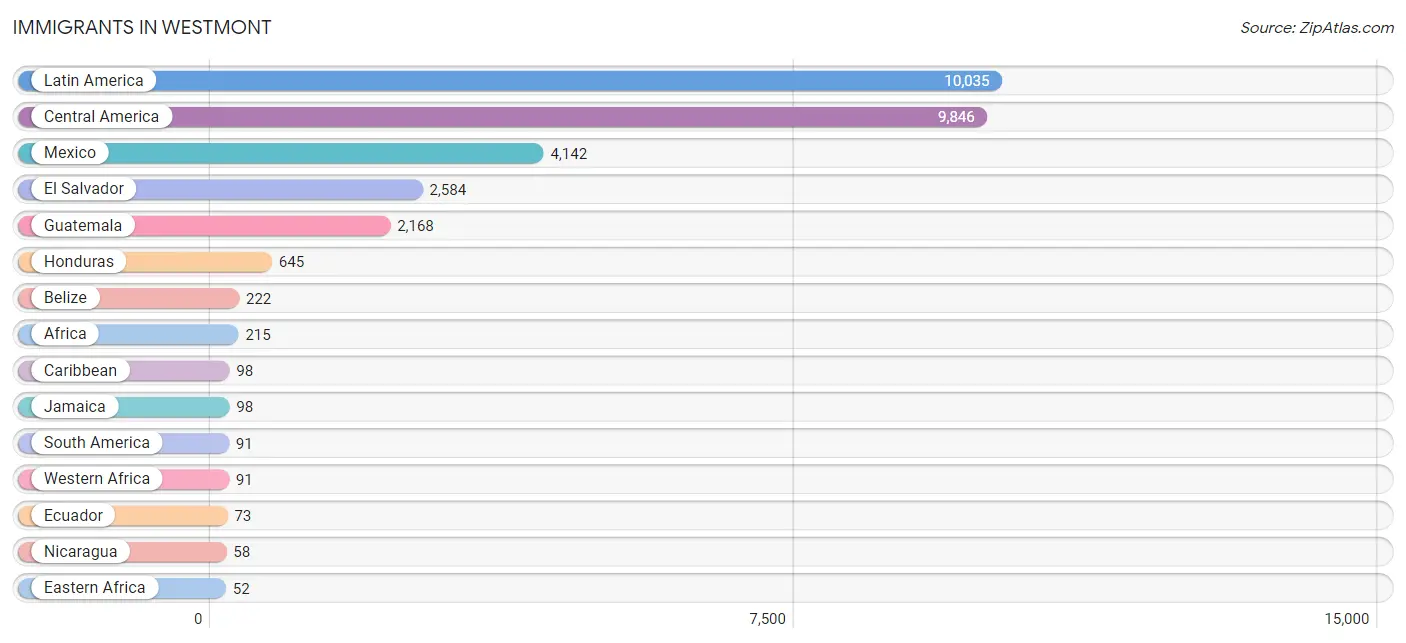
Immigrants in Westmont
The most numerous immigrant groups reported in Westmont came from Latin America (10,035 | 28.4%), Central America (9,846 | 27.9%), Mexico (4,142 | 11.7%), El Salvador (2,584 | 7.3%), and Guatemala (2,168 | 6.1%), together accounting for 81.4% of all Westmont residents.
| Immigration Origin | # Population | % Population |
| Africa | 215 | 0.6% |
| Asia | 44 | 0.1% |
| Belize | 222 | 0.6% |
| Cameroon | 50 | 0.1% |
| Canada | 11 | 0.0% |
| Caribbean | 98 | 0.3% |
| Central America | 9,846 | 27.9% |
| Eastern Africa | 52 | 0.2% |
| Eastern Asia | 1 | 0.0% |
| Ecuador | 73 | 0.2% |
| El Salvador | 2,584 | 7.3% |
| Ethiopia | 52 | 0.2% |
| Europe | 9 | 0.0% |
| Germany | 9 | 0.0% |
| Guatemala | 2,168 | 6.1% |
| Honduras | 645 | 1.8% |
| Iran | 9 | 0.0% |
| Jamaica | 98 | 0.3% |
| Japan | 1 | 0.0% |
| Latin America | 10,035 | 28.4% |
| Liberia | 44 | 0.1% |
| Mexico | 4,142 | 11.7% |
| Middle Africa | 50 | 0.1% |
| Morocco | 1 | 0.0% |
| Nicaragua | 58 | 0.2% |
| Nigeria | 47 | 0.1% |
| Northern Africa | 1 | 0.0% |
| Oceania | 24 | 0.1% |
| Panama | 27 | 0.1% |
| Peru | 18 | 0.1% |
| Philippines | 13 | 0.0% |
| South America | 91 | 0.3% |
| South Central Asia | 9 | 0.0% |
| South Eastern Asia | 34 | 0.1% |
| Thailand | 1 | 0.0% |
| Vietnam | 20 | 0.1% |
| Western Africa | 91 | 0.3% |
| Western Europe | 9 | 0.0% | View All 38 Rows |
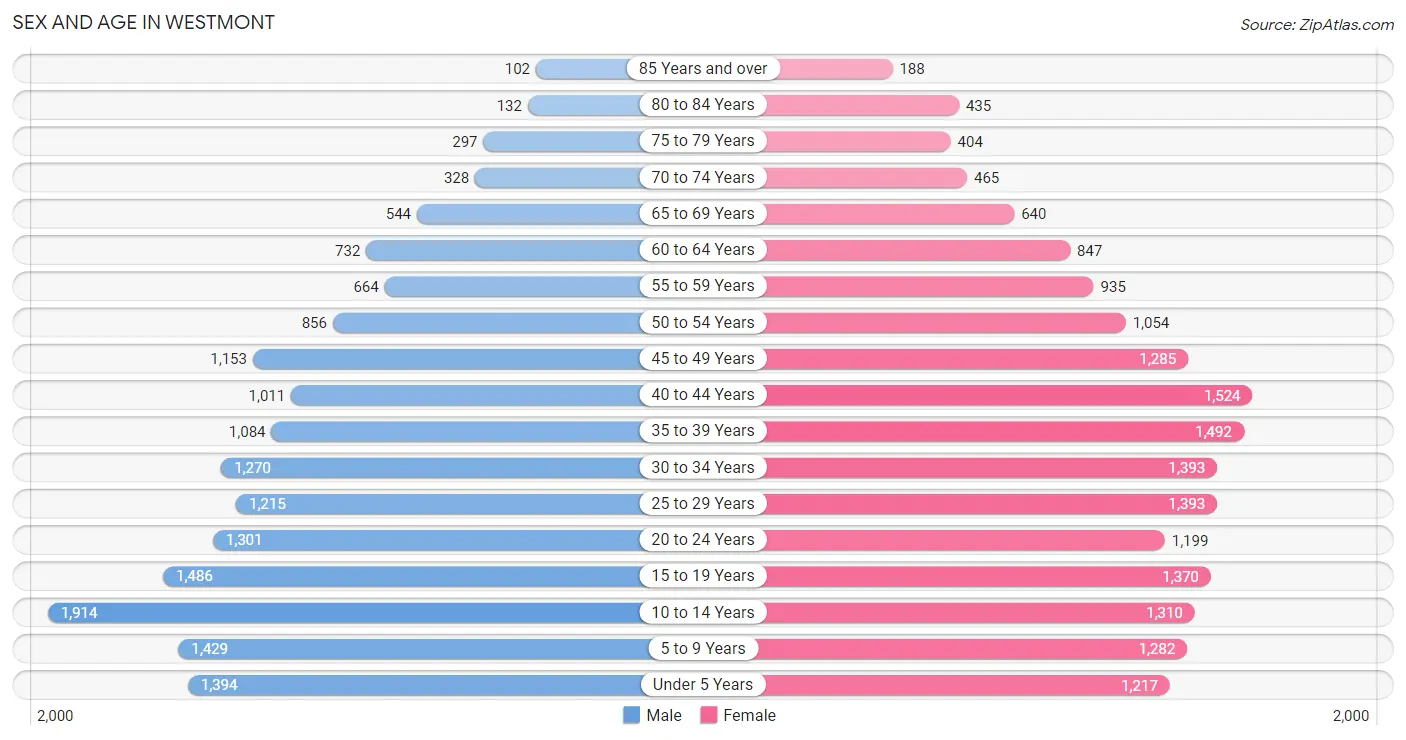
Sex and Age in Westmont
Sex and Age in Westmont
The most populous age groups in Westmont are 10 to 14 Years (1,914 | 11.3%) for men and 40 to 44 Years (1,524 | 8.3%) for women.
| Age Bracket | Male | Female |
| Under 5 Years | 1,394 (8.2%) | 1,217 (6.6%) |
| 5 to 9 Years | 1,429 (8.5%) | 1,282 (7.0%) |
| 10 to 14 Years | 1,914 (11.3%) | 1,310 (7.1%) |
| 15 to 19 Years | 1,486 (8.8%) | 1,370 (7.4%) |
| 20 to 24 Years | 1,301 (7.7%) | 1,199 (6.5%) |
| 25 to 29 Years | 1,215 (7.2%) | 1,393 (7.6%) |
| 30 to 34 Years | 1,270 (7.5%) | 1,393 (7.6%) |
| 35 to 39 Years | 1,084 (6.4%) | 1,492 (8.1%) |
| 40 to 44 Years | 1,011 (6.0%) | 1,524 (8.3%) |
| 45 to 49 Years | 1,153 (6.8%) | 1,285 (7.0%) |
| 50 to 54 Years | 856 (5.1%) | 1,054 (5.7%) |
| 55 to 59 Years | 664 (3.9%) | 935 (5.1%) |
| 60 to 64 Years | 732 (4.3%) | 847 (4.6%) |
| 65 to 69 Years | 544 (3.2%) | 640 (3.5%) |
| 70 to 74 Years | 328 (1.9%) | 465 (2.5%) |
| 75 to 79 Years | 297 (1.8%) | 404 (2.2%) |
| 80 to 84 Years | 132 (0.8%) | 435 (2.4%) |
| 85 Years and over | 102 (0.6%) | 188 (1.0%) |
| Total | 16,912 (100.0%) | 18,433 (100.0%) |
Families and Households in Westmont
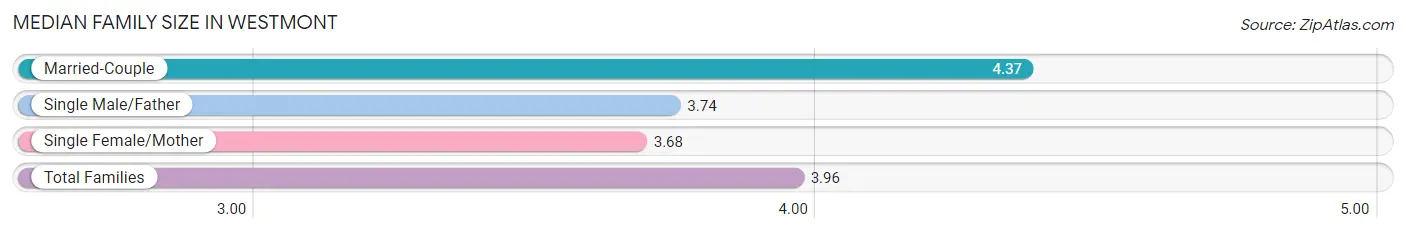
Median Family Size in Westmont
The median family size in Westmont is 3.96 persons per family, with married-couple families (3,016 | 40.0%) accounting for the largest median family size of 4.37 persons per family. On the other hand, single female/mother families (3,351 | 44.4%) represent the smallest median family size with 3.68 persons per family.
| Family Type | # Families | Family Size |
| Married-Couple | 3,016 (40.0%) | 4.37 |
| Single Male/Father | 1,175 (15.6%) | 3.74 |
| Single Female/Mother | 3,351 (44.4%) | 3.68 |
| Total Families | 7,542 (100.0%) | 3.96 |
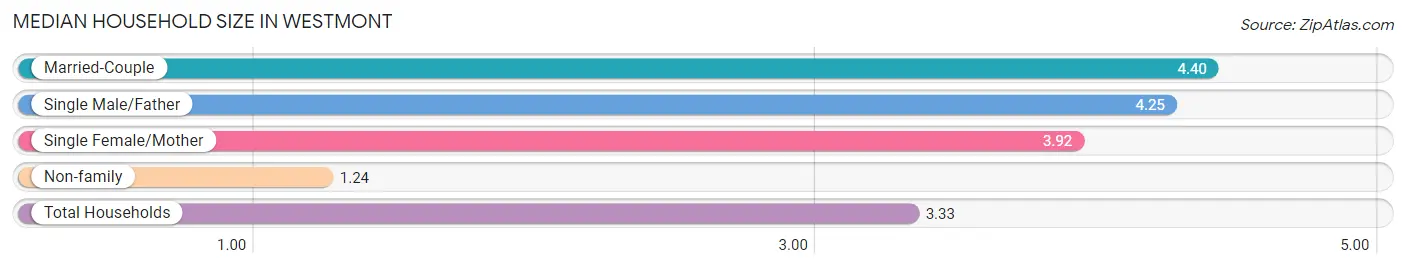
Median Household Size in Westmont
The median household size in Westmont is 3.33 persons per household, with married-couple households (3,016 | 28.6%) accounting for the largest median household size of 4.4 persons per household. non-family households (3,009 | 28.5%) represent the smallest median household size with 1.24 persons per household.
| Household Type | # Households | Household Size |
| Married-Couple | 3,016 (28.6%) | 4.40 |
| Single Male/Father | 1,175 (11.1%) | 4.25 |
| Single Female/Mother | 3,351 (31.8%) | 3.92 |
| Non-family | 3,009 (28.5%) | 1.24 |
| Total Households | 10,551 (100.0%) | 3.33 |
Household Size by Marriage Status in Westmont
Out of a total of 10,551 households in Westmont, 7,542 (71.5%) are family households, while 3,009 (28.5%) are nonfamily households. The most numerous type of family households are 2-person households, comprising 1,831, and the most common type of nonfamily households are 1-person households, comprising 2,602.
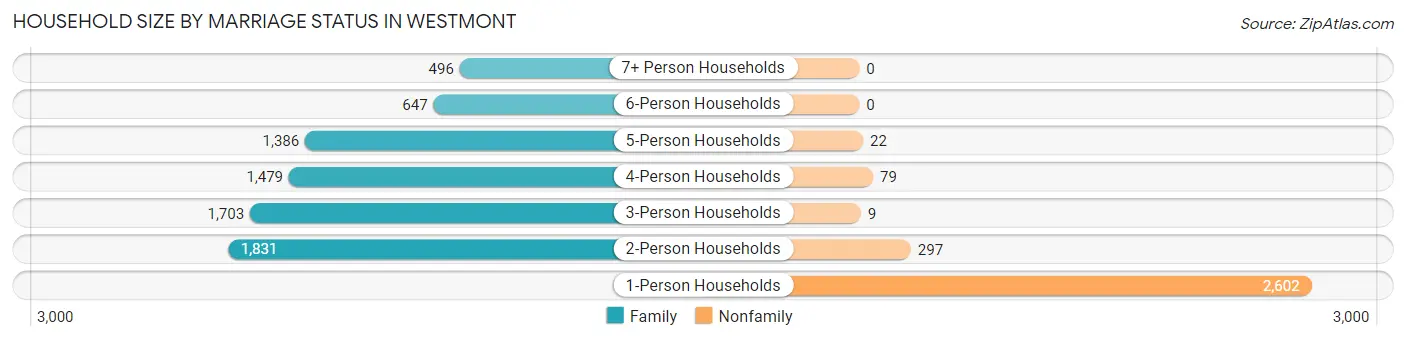
| Household Size | Family Households | Nonfamily Households |
| 1-Person Households | - | 2,602 (24.7%) |
| 2-Person Households | 1,831 (17.3%) | 297 (2.8%) |
| 3-Person Households | 1,703 (16.1%) | 9 (0.1%) |
| 4-Person Households | 1,479 (14.0%) | 79 (0.7%) |
| 5-Person Households | 1,386 (13.1%) | 22 (0.2%) |
| 6-Person Households | 647 (6.1%) | 0 (0.0%) |
| 7+ Person Households | 496 (4.7%) | 0 (0.0%) |
| Total | 7,542 (71.5%) | 3,009 (28.5%) |
Female Fertility in Westmont
Fertility by Age in Westmont
Average fertility rate in Westmont is 63.0 births per 1,000 women. Women in the age bracket of 20 to 34 years have the highest fertility rate with 113.0 births per 1,000 women. Women in the age bracket of 20 to 34 years acount for 73.0% of all women with births.
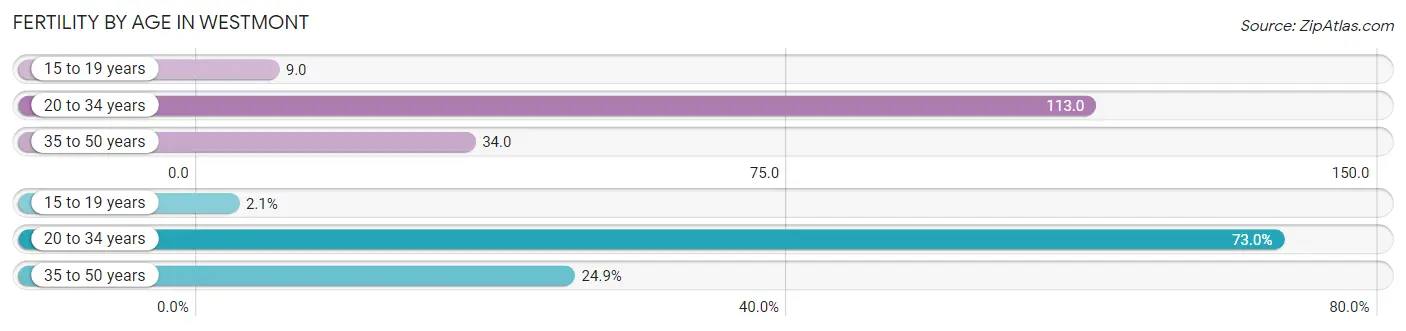
| Age Bracket | Women with Births | Births / 1,000 Women |
| 15 to 19 years | 13 (2.1%) | 9.0 |
| 20 to 34 years | 452 (73.0%) | 113.0 |
| 35 to 50 years | 154 (24.9%) | 34.0 |
| Total | 619 (100.0%) | 63.0 |
Fertility by Age by Marriage Status in Westmont
42.8% of women with births (619) in Westmont are married. The highest percentage of unmarried women with births falls into 15 to 19 years age bracket with 100.0% of them unmarried at the time of birth, while the lowest percentage of unmarried women with births belong to 35 to 50 years age bracket with 37.7% of them unmarried.
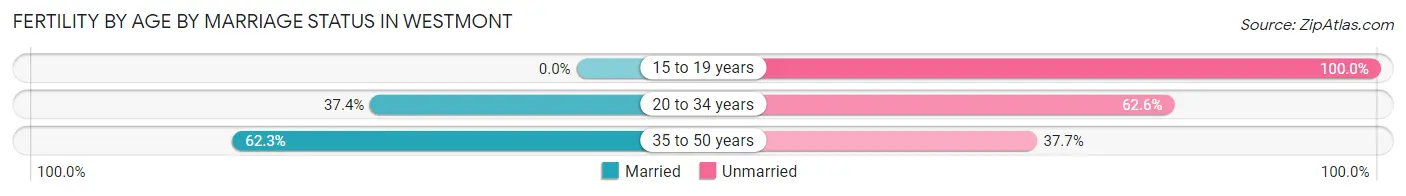
| Age Bracket | Married | Unmarried |
| 15 to 19 years | 0 (0.0%) | 13 (100.0%) |
| 20 to 34 years | 169 (37.4%) | 283 (62.6%) |
| 35 to 50 years | 96 (62.3%) | 58 (37.7%) |
| Total | 265 (42.8%) | 354 (57.2%) |
Fertility by Education in Westmont
Average fertility rate in Westmont is 63.0 births per 1,000 women. Women with the education attainment of high school diploma have the highest fertility rate of 106.0 births per 1,000 women, while women with the education attainment of graduate degree have the lowest fertility at 27.0 births per 1,000 women. Women with the education attainment of high school diploma represent 49.3% of all women with births.
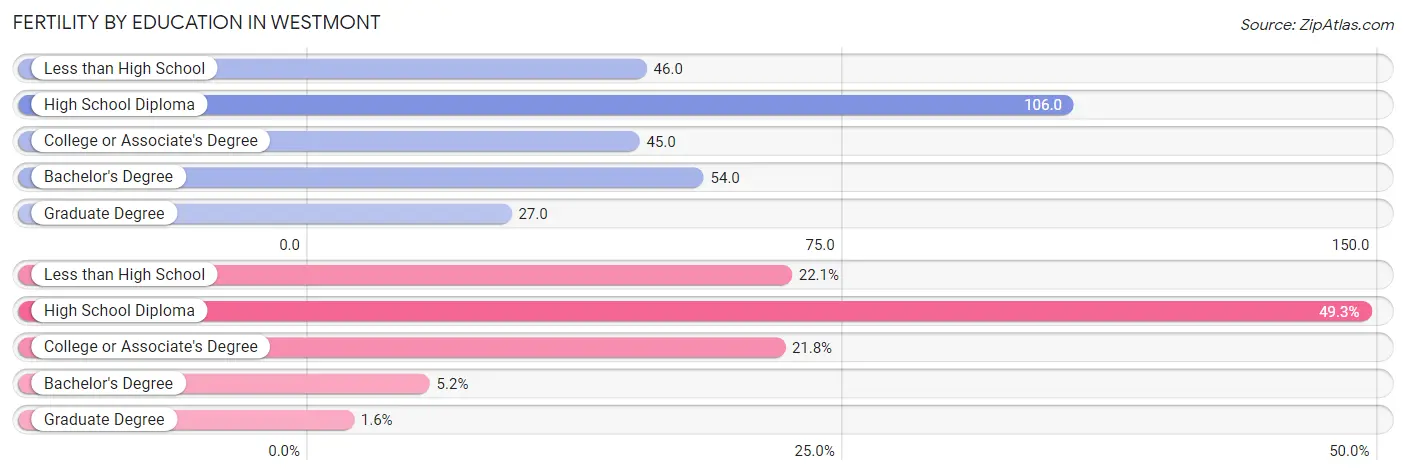
| Educational Attainment | Women with Births | Births / 1,000 Women |
| Less than High School | 137 (22.1%) | 46.0 |
| High School Diploma | 305 (49.3%) | 106.0 |
| College or Associate's Degree | 135 (21.8%) | 45.0 |
| Bachelor's Degree | 32 (5.2%) | 54.0 |
| Graduate Degree | 10 (1.6%) | 27.0 |
| Total | 619 (100.0%) | 63.0 |
Fertility by Education by Marriage Status in Westmont
57.2% of women with births in Westmont are unmarried. Women with the educational attainment of bachelor's degree are most likely to be married with 100.0% of them married at childbirth, while women with the educational attainment of less than high school are least likely to be married with 68.6% of them unmarried at childbirth.
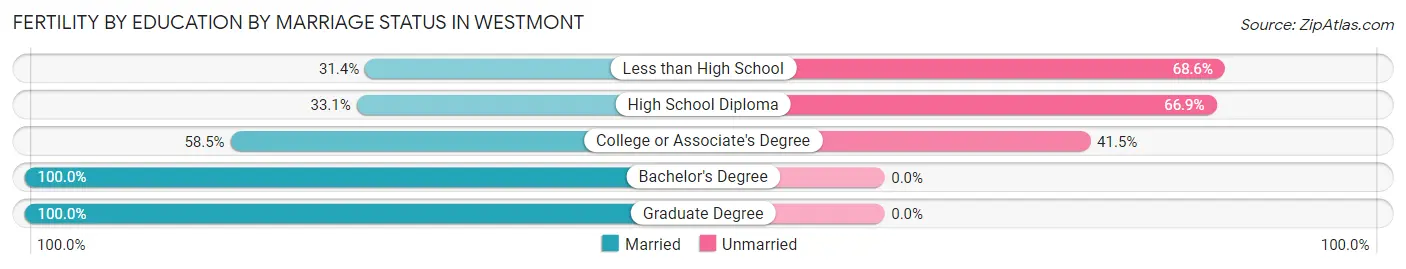
| Educational Attainment | Married | Unmarried |
| Less than High School | 43 (31.4%) | 94 (68.6%) |
| High School Diploma | 101 (33.1%) | 204 (66.9%) |
| College or Associate's Degree | 79 (58.5%) | 56 (41.5%) |
| Bachelor's Degree | 32 (100.0%) | 0 (0.0%) |
| Graduate Degree | 10 (100.0%) | 0 (0.0%) |
| Total | 265 (42.8%) | 354 (57.2%) |
Employment Characteristics in Westmont
Employment by Class of Employer in Westmont
Among the 13,504 employed individuals in Westmont, private company employees (9,674 | 71.6%), local government employees (1,284 | 9.5%), and self-employed (not incorporated) (1,091 | 8.1%) make up the most common classes of employment.
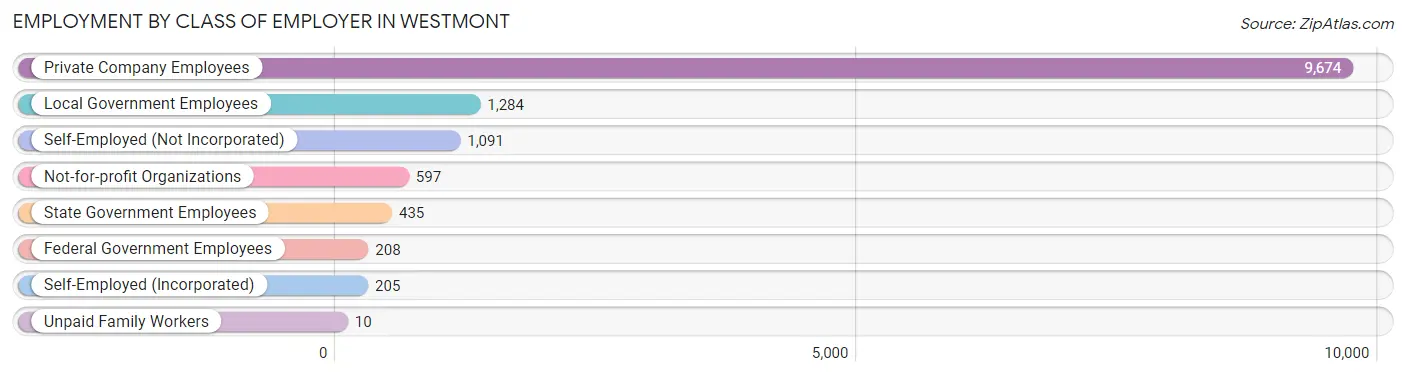
| Employer Class | # Employees | % Employees |
| Private Company Employees | 9,674 | 71.6% |
| Self-Employed (Incorporated) | 205 | 1.5% |
| Self-Employed (Not Incorporated) | 1,091 | 8.1% |
| Not-for-profit Organizations | 597 | 4.4% |
| Local Government Employees | 1,284 | 9.5% |
| State Government Employees | 435 | 3.2% |
| Federal Government Employees | 208 | 1.5% |
| Unpaid Family Workers | 10 | 0.1% |
| Total | 13,504 | 100.0% |
Employment Status by Age in Westmont
According to the labor force statistics for Westmont, out of the total population over 16 years of age (26,158), 60.6% or 15,852 individuals are in the labor force, with 11.0% or 1,744 of them unemployed. The age group with the highest labor force participation rate is 30 to 34 years, with 80.4% or 2,141 individuals in the labor force. Within the labor force, the 16 to 19 years age range has the highest percentage of unemployed individuals, with 56.8% or 300 of them being unemployed.
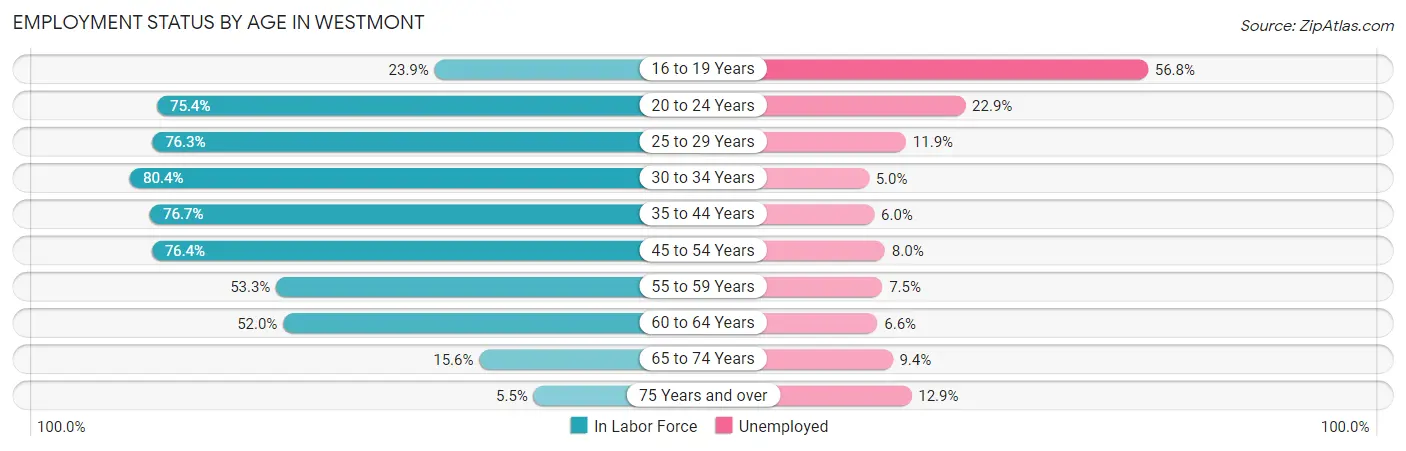
| Age Bracket | In Labor Force | Unemployed |
| 16 to 19 Years | 529 (23.9%) | 300 (56.8%) |
| 20 to 24 Years | 1,885 (75.4%) | 432 (22.9%) |
| 25 to 29 Years | 1,990 (76.3%) | 237 (11.9%) |
| 30 to 34 Years | 2,141 (80.4%) | 107 (5.0%) |
| 35 to 44 Years | 3,920 (76.7%) | 235 (6.0%) |
| 45 to 54 Years | 3,322 (76.4%) | 266 (8.0%) |
| 55 to 59 Years | 852 (53.3%) | 64 (7.5%) |
| 60 to 64 Years | 821 (52.0%) | 54 (6.6%) |
| 65 to 74 Years | 308 (15.6%) | 29 (9.4%) |
| 75 Years and over | 86 (5.5%) | 11 (12.9%) |
| Total | 15,852 (60.6%) | 1,744 (11.0%) |
Employment Status by Educational Attainment in Westmont
According to labor force statistics for Westmont, 72.9% of individuals (13,055) out of the total population between 25 and 64 years of age (17,908) are in the labor force, with 7.4% or 966 of them being unemployed. The group with the highest labor force participation rate are those with the educational attainment of high school diploma, with 76.0% or 4,109 individuals in the labor force. Within the labor force, individuals with bachelor's degree or higher education have the highest percentage of unemployment, with 10.3% or 154 of them being unemployed.
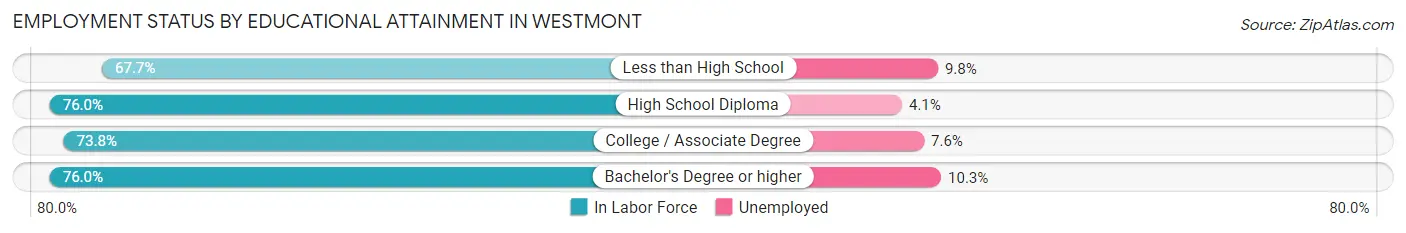
| Educational Attainment | In Labor Force | Unemployed |
| Less than High School | 3,701 (67.7%) | 536 (9.8%) |
| High School Diploma | 4,109 (76.0%) | 222 (4.1%) |
| College / Associate Degree | 3,736 (73.8%) | 385 (7.6%) |
| Bachelor's Degree or higher | 1,499 (76.0%) | 203 (10.3%) |
| Total | 13,055 (72.9%) | 1,325 (7.4%) |
Employment Occupations by Sex in Westmont
Management, Business, Science and Arts Occupations
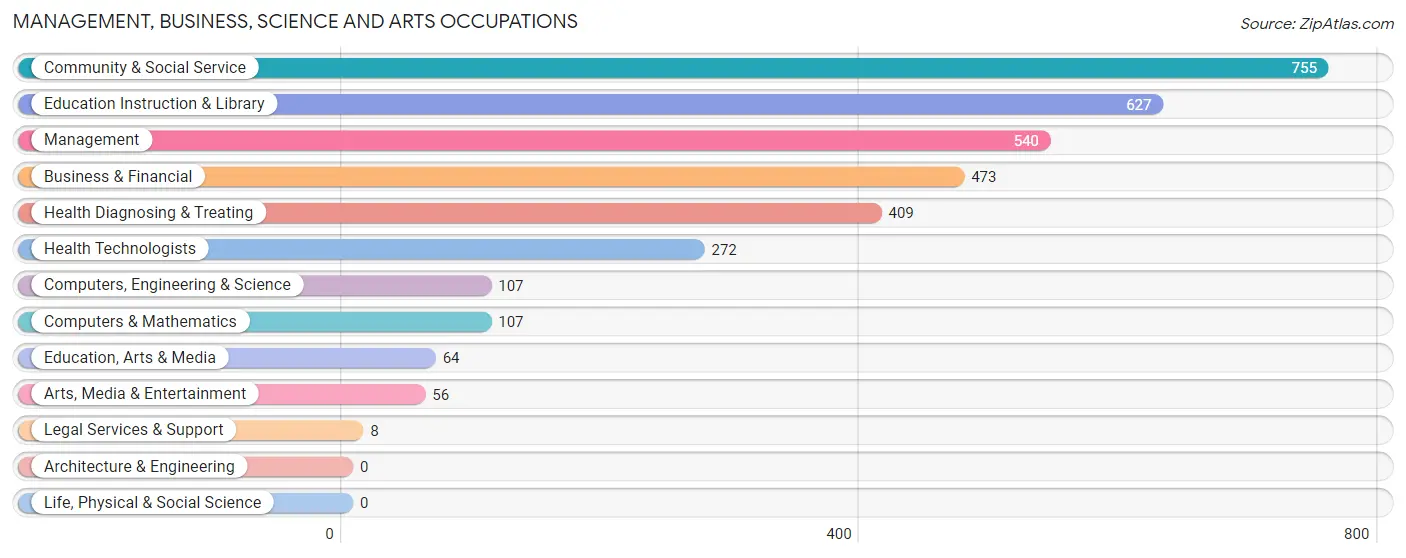
The most common Management, Business, Science and Arts occupations in Westmont are Community & Social Service (755 | 5.3%), Education Instruction & Library (627 | 4.4%), Management (540 | 3.8%), Business & Financial (473 | 3.4%), and Health Diagnosing & Treating (409 | 2.9%).
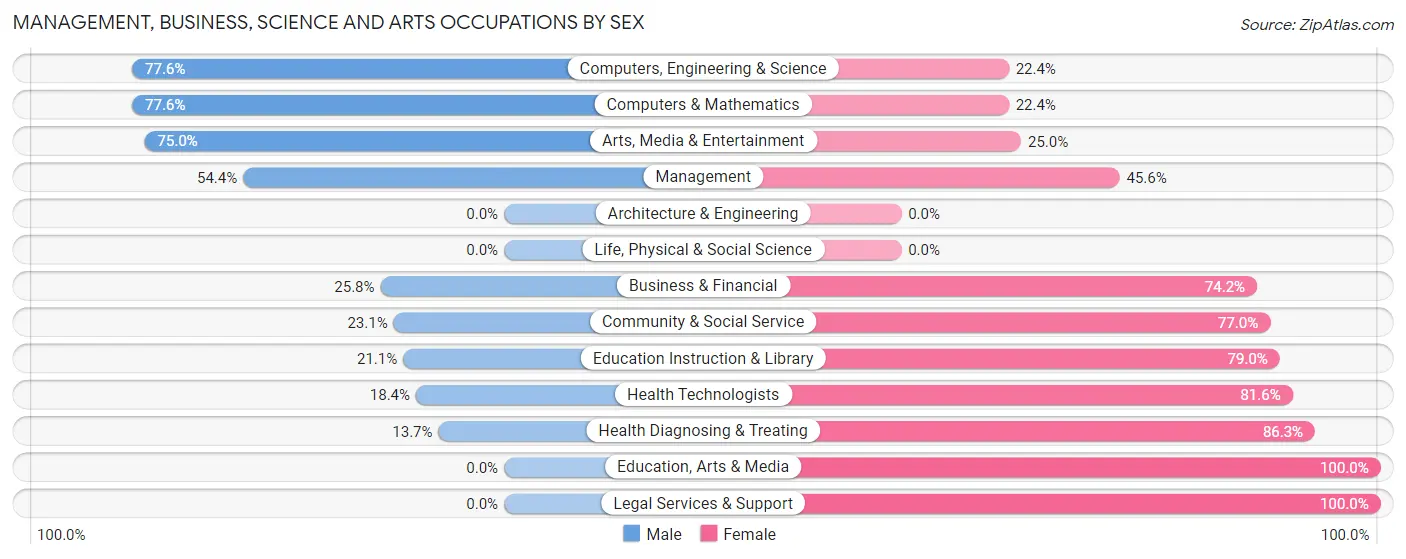
Management, Business, Science and Arts Occupations by Sex
Within the Management, Business, Science and Arts occupations in Westmont, the most male-oriented occupations are Computers, Engineering & Science (77.6%), Computers & Mathematics (77.6%), and Arts, Media & Entertainment (75.0%), while the most female-oriented occupations are Education, Arts & Media (100.0%), Legal Services & Support (100.0%), and Health Diagnosing & Treating (86.3%).
| Occupation | Male | Female |
| Management | 294 (54.4%) | 246 (45.6%) |
| Business & Financial | 122 (25.8%) | 351 (74.2%) |
| Computers, Engineering & Science | 83 (77.6%) | 24 (22.4%) |
| Computers & Mathematics | 83 (77.6%) | 24 (22.4%) |
| Architecture & Engineering | 0 (0.0%) | 0 (0.0%) |
| Life, Physical & Social Science | 0 (0.0%) | 0 (0.0%) |
| Community & Social Service | 174 (23.1%) | 581 (76.9%) |
| Education, Arts & Media | 0 (0.0%) | 64 (100.0%) |
| Legal Services & Support | 0 (0.0%) | 8 (100.0%) |
| Education Instruction & Library | 132 (21.0%) | 495 (78.9%) |
| Arts, Media & Entertainment | 42 (75.0%) | 14 (25.0%) |
| Health Diagnosing & Treating | 56 (13.7%) | 353 (86.3%) |
| Health Technologists | 50 (18.4%) | 222 (81.6%) |
| Total (Category) | 729 (31.9%) | 1,555 (68.1%) |
| Total (Overall) | 7,139 (50.6%) | 6,978 (49.4%) |
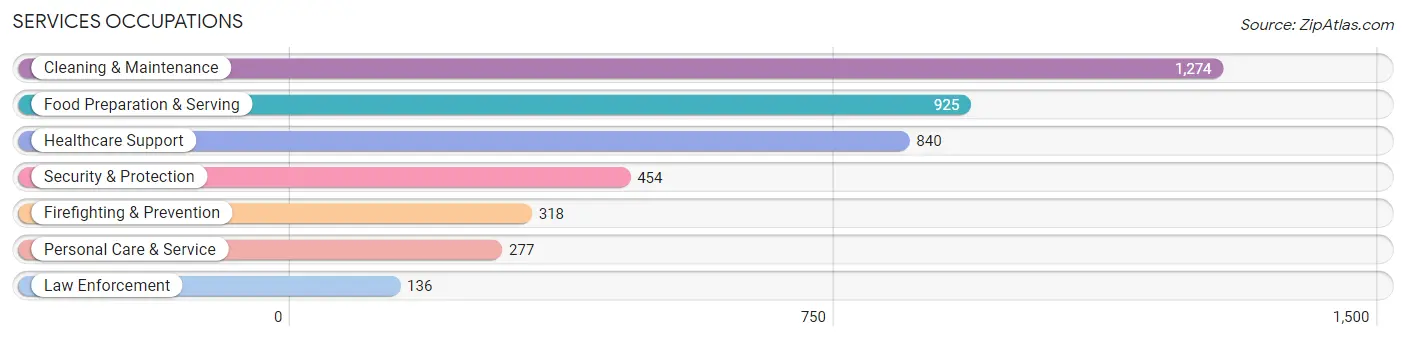
Services Occupations
The most common Services occupations in Westmont are Cleaning & Maintenance (1,274 | 9.0%), Food Preparation & Serving (925 | 6.6%), Healthcare Support (840 | 5.9%), Security & Protection (454 | 3.2%), and Firefighting & Prevention (318 | 2.2%).
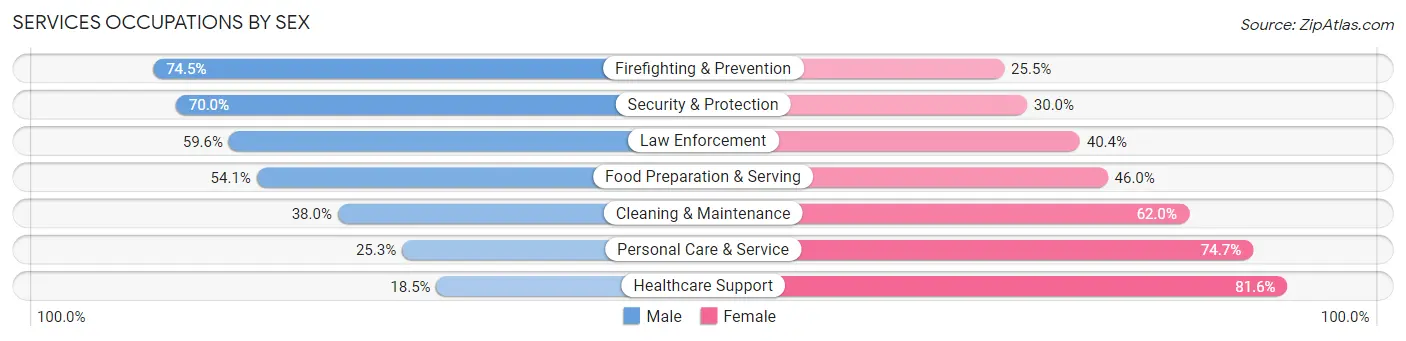
Services Occupations by Sex
Within the Services occupations in Westmont, the most male-oriented occupations are Firefighting & Prevention (74.5%), Security & Protection (70.0%), and Law Enforcement (59.6%), while the most female-oriented occupations are Healthcare Support (81.6%), Personal Care & Service (74.7%), and Cleaning & Maintenance (62.0%).
| Occupation | Male | Female |
| Healthcare Support | 155 (18.4%) | 685 (81.6%) |
| Security & Protection | 318 (70.0%) | 136 (30.0%) |
| Firefighting & Prevention | 237 (74.5%) | 81 (25.5%) |
| Law Enforcement | 81 (59.6%) | 55 (40.4%) |
| Food Preparation & Serving | 500 (54.0%) | 425 (46.0%) |
| Cleaning & Maintenance | 484 (38.0%) | 790 (62.0%) |
| Personal Care & Service | 70 (25.3%) | 207 (74.7%) |
| Total (Category) | 1,527 (40.5%) | 2,243 (59.5%) |
| Total (Overall) | 7,139 (50.6%) | 6,978 (49.4%) |
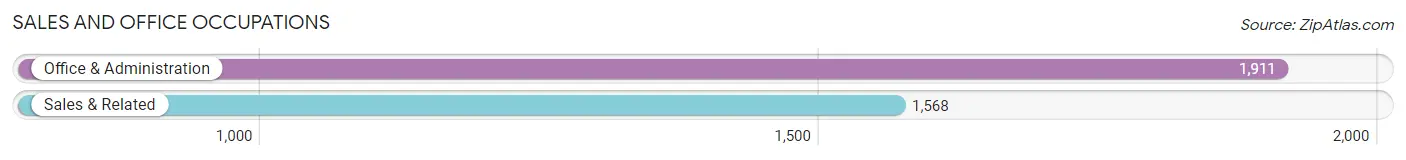
Sales and Office Occupations
The most common Sales and Office occupations in Westmont are Office & Administration (1,911 | 13.5%), and Sales & Related (1,568 | 11.1%).
Sales and Office Occupations by Sex
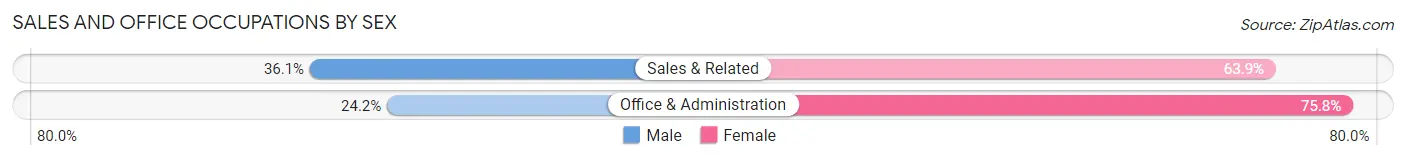
| Occupation | Male | Female |
| Sales & Related | 566 (36.1%) | 1,002 (63.9%) |
| Office & Administration | 463 (24.2%) | 1,448 (75.8%) |
| Total (Category) | 1,029 (29.6%) | 2,450 (70.4%) |
| Total (Overall) | 7,139 (50.6%) | 6,978 (49.4%) |
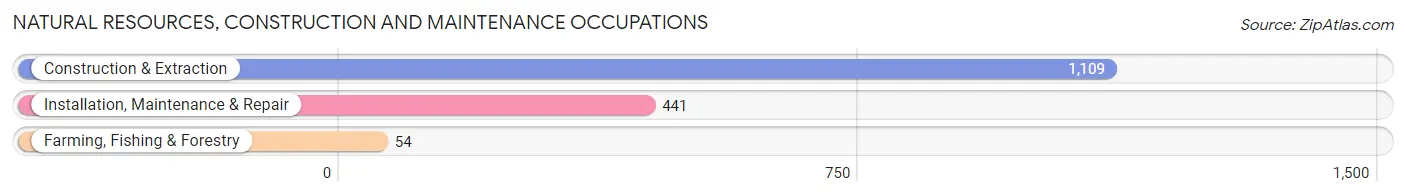
Natural Resources, Construction and Maintenance Occupations
The most common Natural Resources, Construction and Maintenance occupations in Westmont are Construction & Extraction (1,109 | 7.9%), Installation, Maintenance & Repair (441 | 3.1%), and Farming, Fishing & Forestry (54 | 0.4%).
Natural Resources, Construction and Maintenance Occupations by Sex
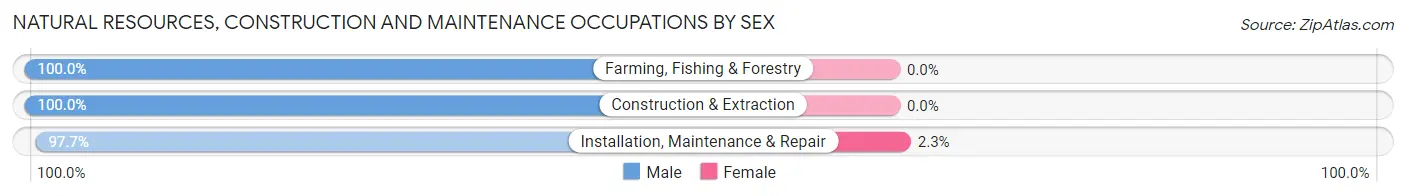
| Occupation | Male | Female |
| Farming, Fishing & Forestry | 54 (100.0%) | 0 (0.0%) |
| Construction & Extraction | 1,109 (100.0%) | 0 (0.0%) |
| Installation, Maintenance & Repair | 431 (97.7%) | 10 (2.3%) |
| Total (Category) | 1,594 (99.4%) | 10 (0.6%) |
| Total (Overall) | 7,139 (50.6%) | 6,978 (49.4%) |
Production, Transportation and Moving Occupations
The most common Production, Transportation and Moving occupations in Westmont are Transportation (1,187 | 8.4%), Material Moving (900 | 6.4%), and Production (893 | 6.3%).
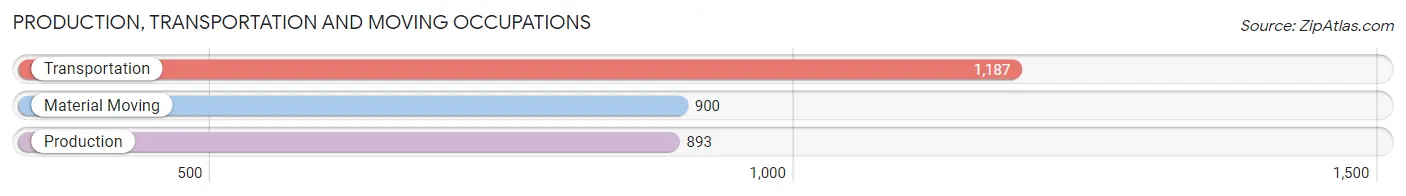
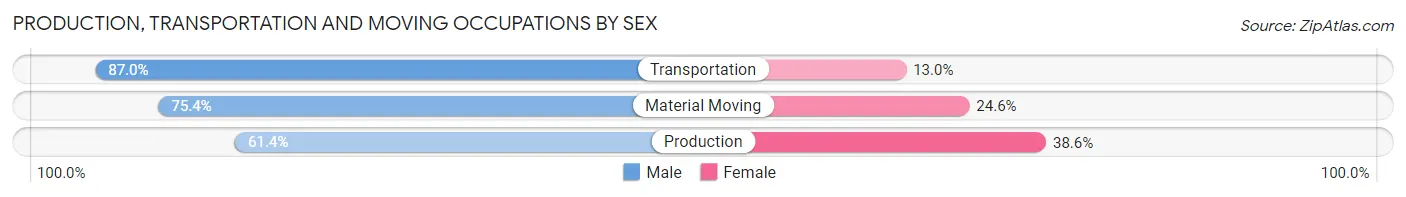
Production, Transportation and Moving Occupations by Sex
| Occupation | Male | Female |
| Production | 548 (61.4%) | 345 (38.6%) |
| Transportation | 1,033 (87.0%) | 154 (13.0%) |
| Material Moving | 679 (75.4%) | 221 (24.6%) |
| Total (Category) | 2,260 (75.8%) | 720 (24.2%) |
| Total (Overall) | 7,139 (50.6%) | 6,978 (49.4%) |
Employment Industries by Sex in Westmont
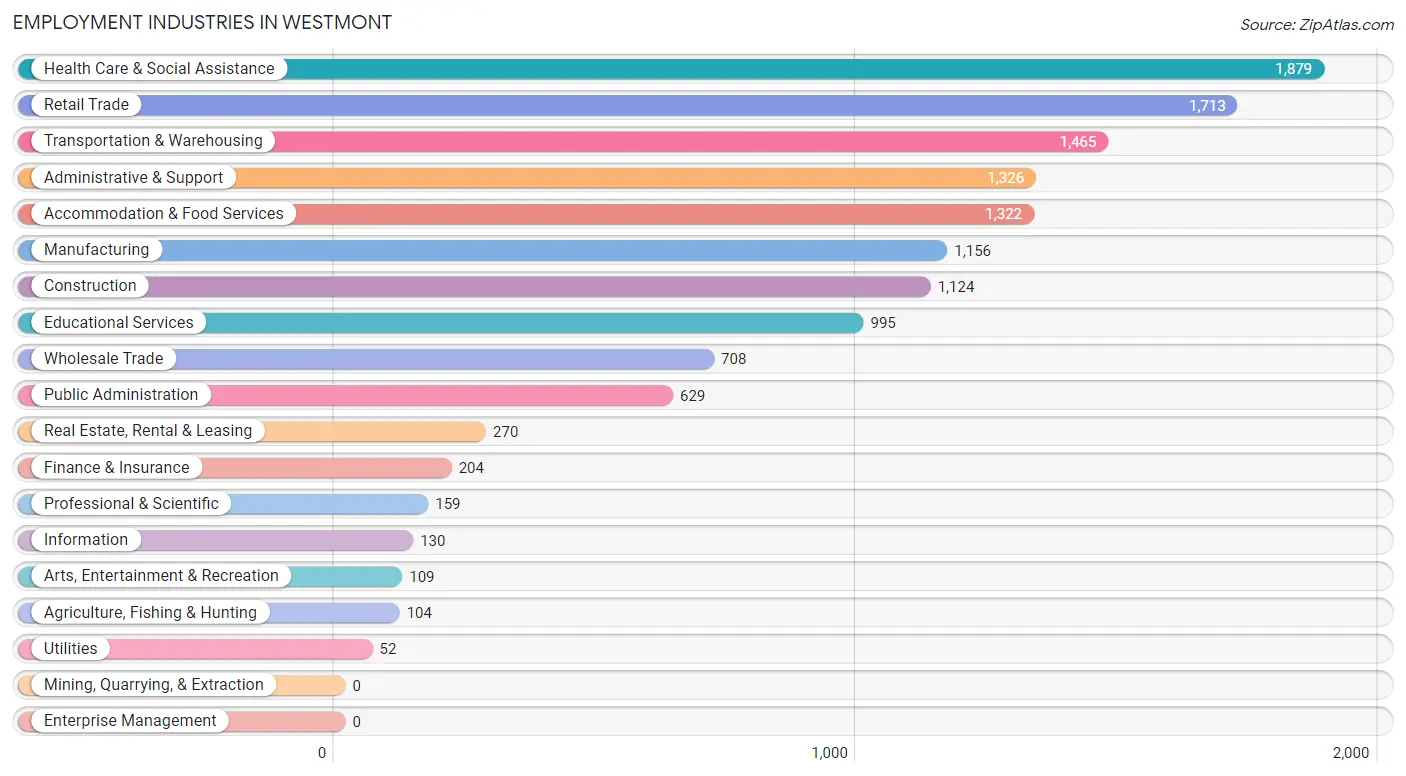
Employment Industries in Westmont
The major employment industries in Westmont include Health Care & Social Assistance (1,879 | 13.3%), Retail Trade (1,713 | 12.1%), Transportation & Warehousing (1,465 | 10.4%), Administrative & Support (1,326 | 9.4%), and Accommodation & Food Services (1,322 | 9.4%).
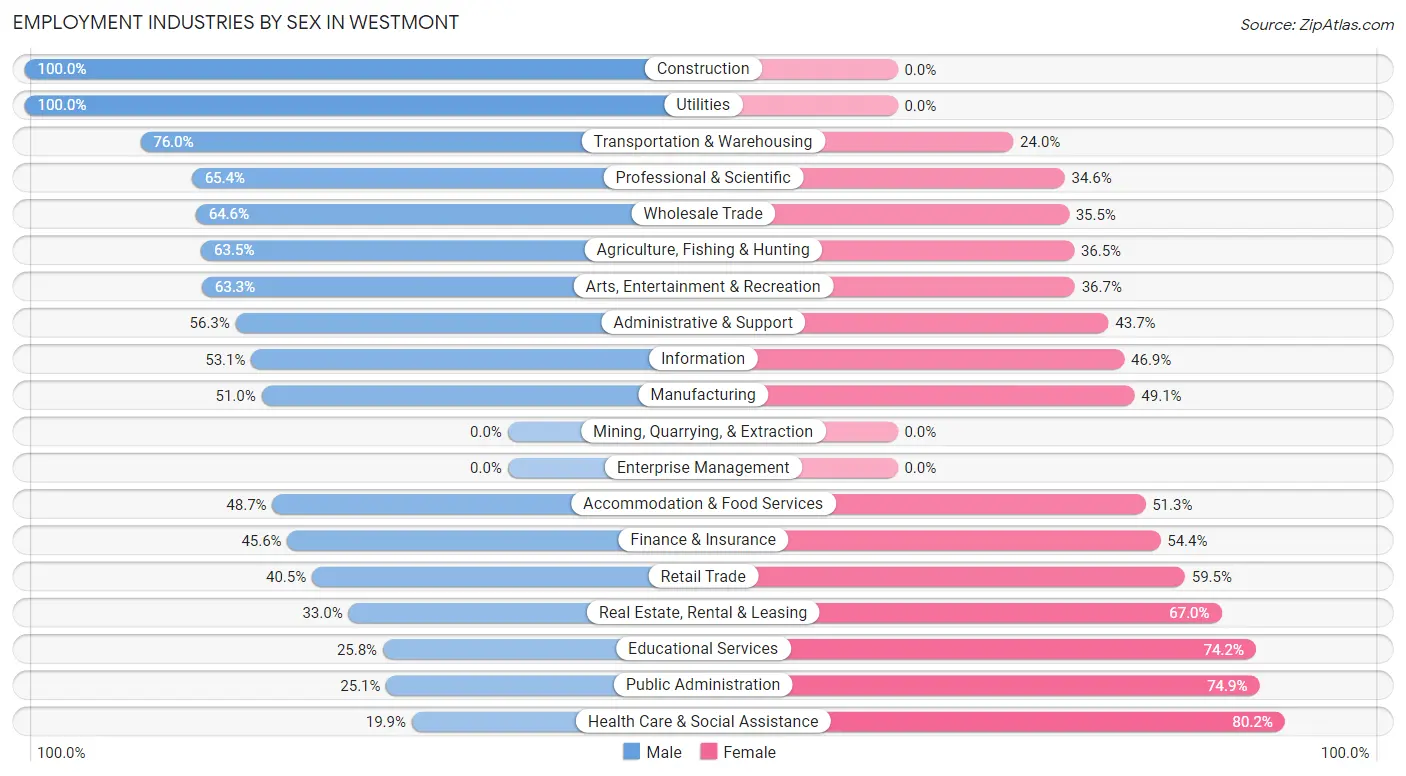
Employment Industries by Sex in Westmont
The Westmont industries that see more men than women are Construction (100.0%), Utilities (100.0%), and Transportation & Warehousing (76.0%), whereas the industries that tend to have a higher number of women are Health Care & Social Assistance (80.1%), Public Administration (74.9%), and Educational Services (74.2%).
| Industry | Male | Female |
| Agriculture, Fishing & Hunting | 66 (63.5%) | 38 (36.5%) |
| Mining, Quarrying, & Extraction | 0 (0.0%) | 0 (0.0%) |
| Construction | 1,124 (100.0%) | 0 (0.0%) |
| Manufacturing | 589 (50.9%) | 567 (49.0%) |
| Wholesale Trade | 457 (64.5%) | 251 (35.4%) |
| Retail Trade | 694 (40.5%) | 1,019 (59.5%) |
| Transportation & Warehousing | 1,114 (76.0%) | 351 (24.0%) |
| Utilities | 52 (100.0%) | 0 (0.0%) |
| Information | 69 (53.1%) | 61 (46.9%) |
| Finance & Insurance | 93 (45.6%) | 111 (54.4%) |
| Real Estate, Rental & Leasing | 89 (33.0%) | 181 (67.0%) |
| Professional & Scientific | 104 (65.4%) | 55 (34.6%) |
| Enterprise Management | 0 (0.0%) | 0 (0.0%) |
| Administrative & Support | 747 (56.3%) | 579 (43.7%) |
| Educational Services | 257 (25.8%) | 738 (74.2%) |
| Health Care & Social Assistance | 373 (19.9%) | 1,506 (80.1%) |
| Arts, Entertainment & Recreation | 69 (63.3%) | 40 (36.7%) |
| Accommodation & Food Services | 644 (48.7%) | 678 (51.3%) |
| Public Administration | 158 (25.1%) | 471 (74.9%) |
| Total | 7,139 (50.6%) | 6,978 (49.4%) |
Education in Westmont
School Enrollment in Westmont
The most common levels of schooling among the 10,371 students in Westmont are middle school (2,495 | 24.1%), high school (2,487 | 24.0%), and college / undergraduate (2,177 | 21.0%).
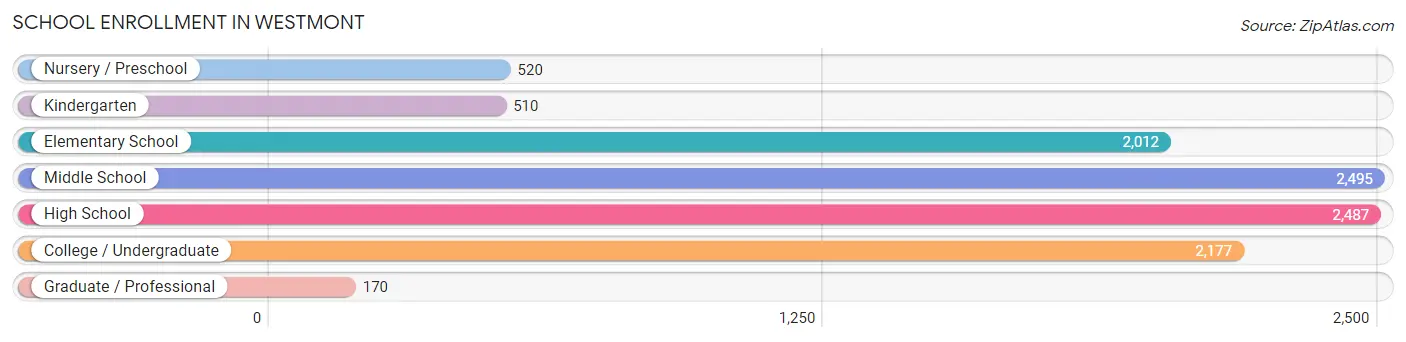
| School Level | # Students | % Students |
| Nursery / Preschool | 520 | 5.0% |
| Kindergarten | 510 | 4.9% |
| Elementary School | 2,012 | 19.4% |
| Middle School | 2,495 | 24.1% |
| High School | 2,487 | 24.0% |
| College / Undergraduate | 2,177 | 21.0% |
| Graduate / Professional | 170 | 1.6% |
| Total | 10,371 | 100.0% |
School Enrollment by Age by Funding Source in Westmont
Out of a total of 10,371 students who are enrolled in schools in Westmont, 1,110 (10.7%) attend a private institution, while the remaining 9,261 (89.3%) are enrolled in public schools. The age group of 25 to 34 year olds has the highest likelihood of being enrolled in private schools, with 228 (32.9% in the age bracket) enrolled. Conversely, the age group of 5 to 9 year old has the lowest likelihood of being enrolled in a private school, with 2,351 (95.5% in the age bracket) attending a public institution.
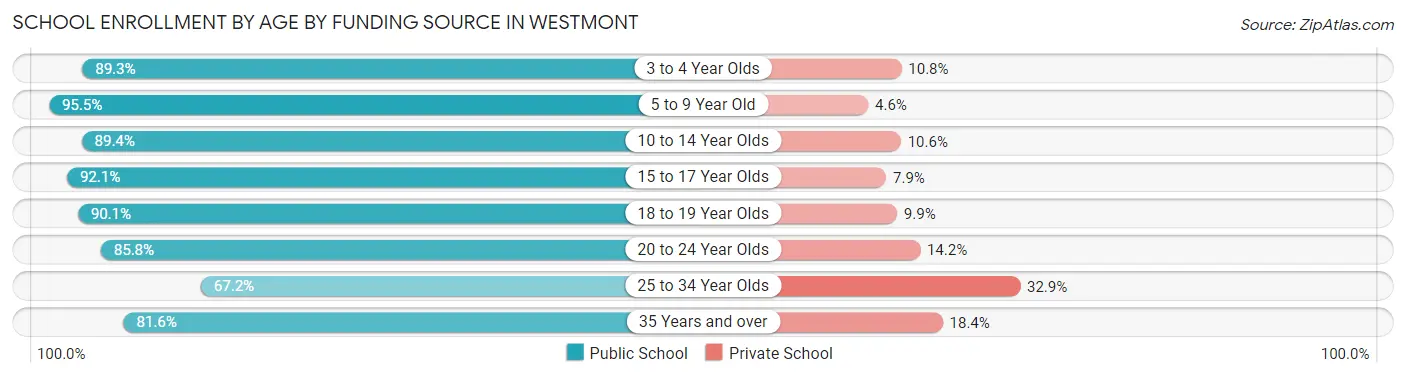
| Age Bracket | Public School | Private School |
| 3 to 4 Year Olds | 357 (89.2%) | 43 (10.7%) |
| 5 to 9 Year Old | 2,351 (95.5%) | 112 (4.5%) |
| 10 to 14 Year Olds | 2,790 (89.4%) | 332 (10.6%) |
| 15 to 17 Year Olds | 1,585 (92.1%) | 136 (7.9%) |
| 18 to 19 Year Olds | 672 (90.1%) | 74 (9.9%) |
| 20 to 24 Year Olds | 767 (85.8%) | 127 (14.2%) |
| 25 to 34 Year Olds | 466 (67.1%) | 228 (32.9%) |
| 35 Years and over | 270 (81.6%) | 61 (18.4%) |
| Total | 9,261 (89.3%) | 1,110 (10.7%) |
Educational Attainment by Field of Study in Westmont
Business (622 | 25.1%), social sciences (332 | 13.4%), arts & humanities (294 | 11.8%), visual & performing arts (219 | 8.8%), and science & technology (168 | 6.8%) are the most common fields of study among 2,483 individuals in Westmont who have obtained a bachelor's degree or higher.
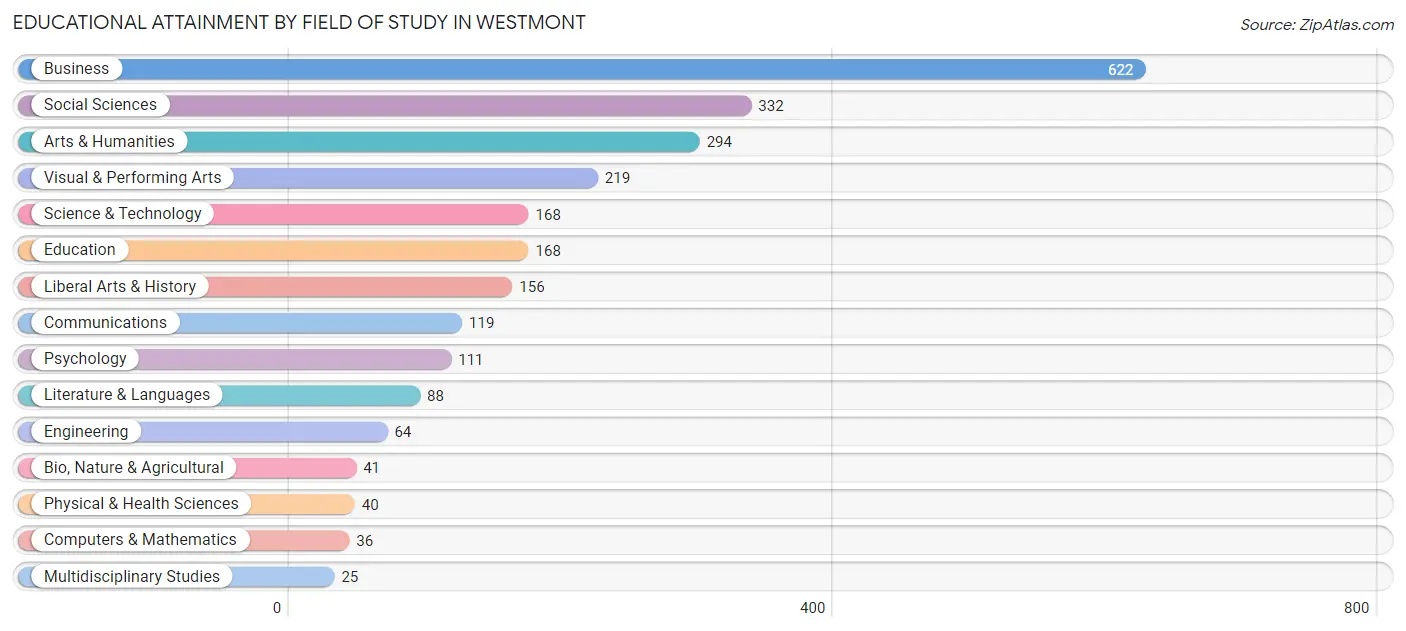
| Field of Study | # Graduates | % Graduates |
| Computers & Mathematics | 36 | 1.5% |
| Bio, Nature & Agricultural | 41 | 1.7% |
| Physical & Health Sciences | 40 | 1.6% |
| Psychology | 111 | 4.5% |
| Social Sciences | 332 | 13.4% |
| Engineering | 64 | 2.6% |
| Multidisciplinary Studies | 25 | 1.0% |
| Science & Technology | 168 | 6.8% |
| Business | 622 | 25.1% |
| Education | 168 | 6.8% |
| Literature & Languages | 88 | 3.5% |
| Liberal Arts & History | 156 | 6.3% |
| Visual & Performing Arts | 219 | 8.8% |
| Communications | 119 | 4.8% |
| Arts & Humanities | 294 | 11.8% |
| Total | 2,483 | 100.0% |
Transportation & Commute in Westmont
Vehicle Availability by Sex in Westmont
The most prevalent vehicle ownership categories in Westmont are males with 2 vehicles (2,264, accounting for 32.7%) and females with 2 vehicles (1,917, making up 34.5%).
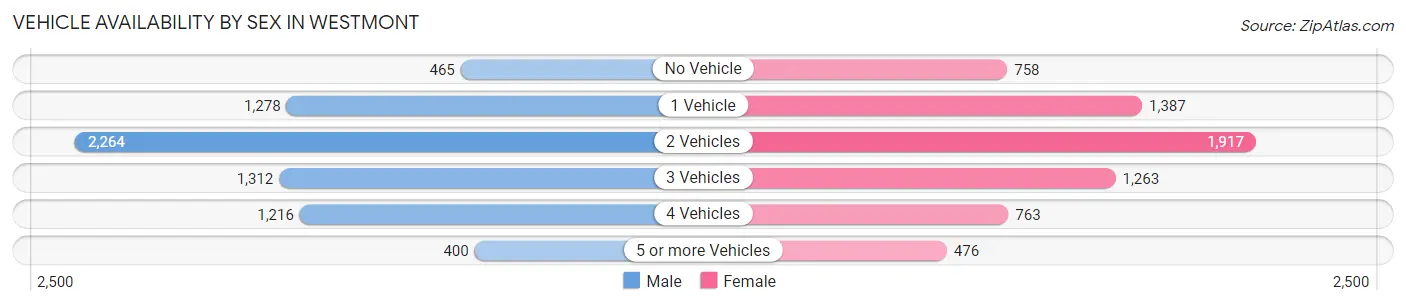
| Vehicles Available | Male | Female |
| No Vehicle | 465 (6.7%) | 758 (11.6%) |
| 1 Vehicle | 1,278 (18.4%) | 1,387 (21.1%) |
| 2 Vehicles | 2,264 (32.7%) | 1,917 (29.2%) |
| 3 Vehicles | 1,312 (18.9%) | 1,263 (19.2%) |
| 4 Vehicles | 1,216 (17.5%) | 763 (11.6%) |
| 5 or more Vehicles | 400 (5.8%) | 476 (7.2%) |
| Total | 6,935 (100.0%) | 6,564 (100.0%) |
Commute Time in Westmont
The most frequently occuring commute durations in Westmont are 30 to 34 minutes (2,978 commuters, 23.3%), 45 to 59 minutes (1,775 commuters, 13.9%), and 20 to 24 minutes (1,605 commuters, 12.6%).
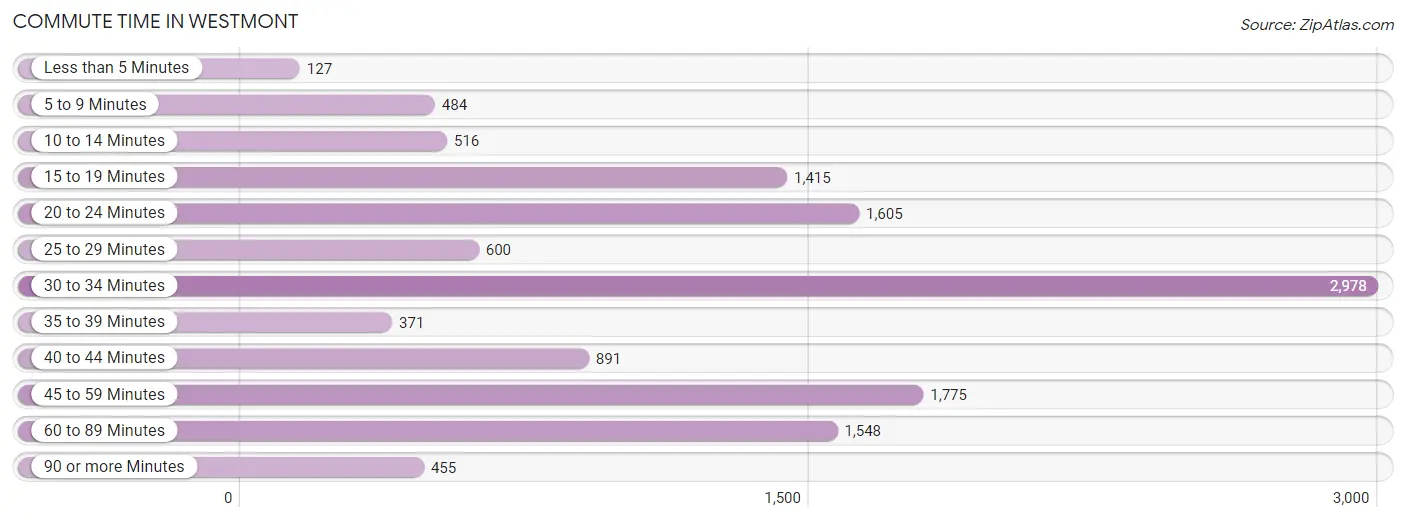
| Commute Time | # Commuters | % Commuters |
| Less than 5 Minutes | 127 | 1.0% |
| 5 to 9 Minutes | 484 | 3.8% |
| 10 to 14 Minutes | 516 | 4.0% |
| 15 to 19 Minutes | 1,415 | 11.1% |
| 20 to 24 Minutes | 1,605 | 12.6% |
| 25 to 29 Minutes | 600 | 4.7% |
| 30 to 34 Minutes | 2,978 | 23.3% |
| 35 to 39 Minutes | 371 | 2.9% |
| 40 to 44 Minutes | 891 | 7.0% |
| 45 to 59 Minutes | 1,775 | 13.9% |
| 60 to 89 Minutes | 1,548 | 12.1% |
| 90 or more Minutes | 455 | 3.6% |
Commute Time by Sex in Westmont
The most common commute times in Westmont are 30 to 34 minutes (1,749 commuters, 26.1%) for males and 30 to 34 minutes (1,229 commuters, 20.3%) for females.
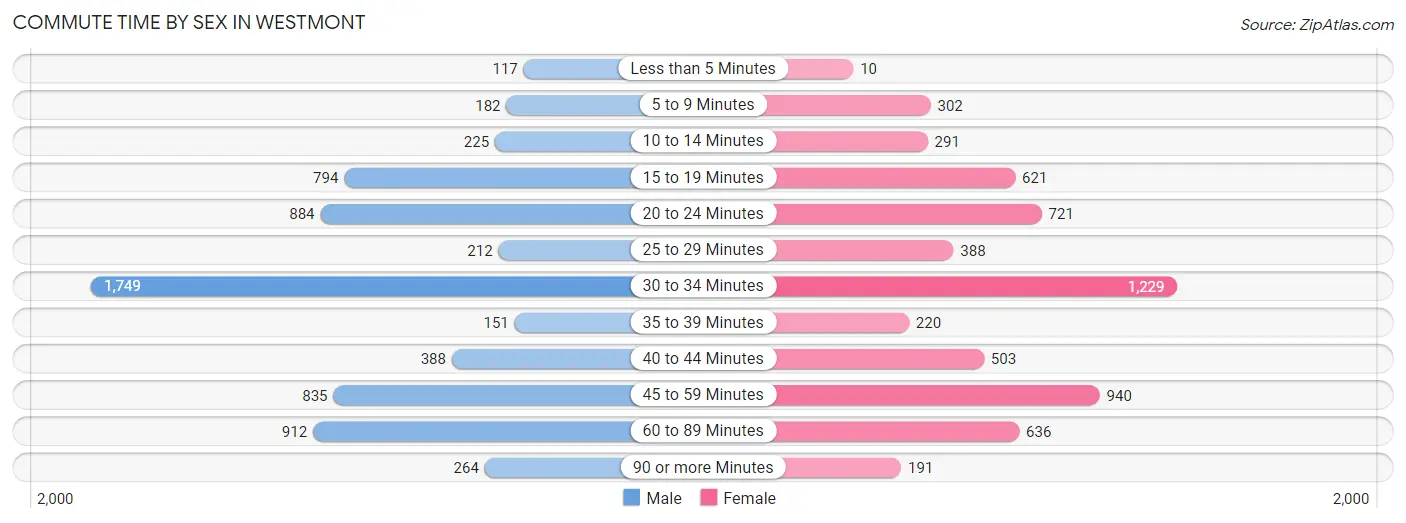
| Commute Time | Male | Female |
| Less than 5 Minutes | 117 (1.7%) | 10 (0.2%) |
| 5 to 9 Minutes | 182 (2.7%) | 302 (5.0%) |
| 10 to 14 Minutes | 225 (3.4%) | 291 (4.8%) |
| 15 to 19 Minutes | 794 (11.8%) | 621 (10.3%) |
| 20 to 24 Minutes | 884 (13.2%) | 721 (11.9%) |
| 25 to 29 Minutes | 212 (3.2%) | 388 (6.4%) |
| 30 to 34 Minutes | 1,749 (26.1%) | 1,229 (20.3%) |
| 35 to 39 Minutes | 151 (2.2%) | 220 (3.6%) |
| 40 to 44 Minutes | 388 (5.8%) | 503 (8.3%) |
| 45 to 59 Minutes | 835 (12.4%) | 940 (15.5%) |
| 60 to 89 Minutes | 912 (13.6%) | 636 (10.5%) |
| 90 or more Minutes | 264 (3.9%) | 191 (3.2%) |
Time of Departure to Work by Sex in Westmont
The most frequent times of departure to work in Westmont are 7:00 AM to 7:29 AM (881, 13.1%) for males and 7:00 AM to 7:29 AM (939, 15.5%) for females.
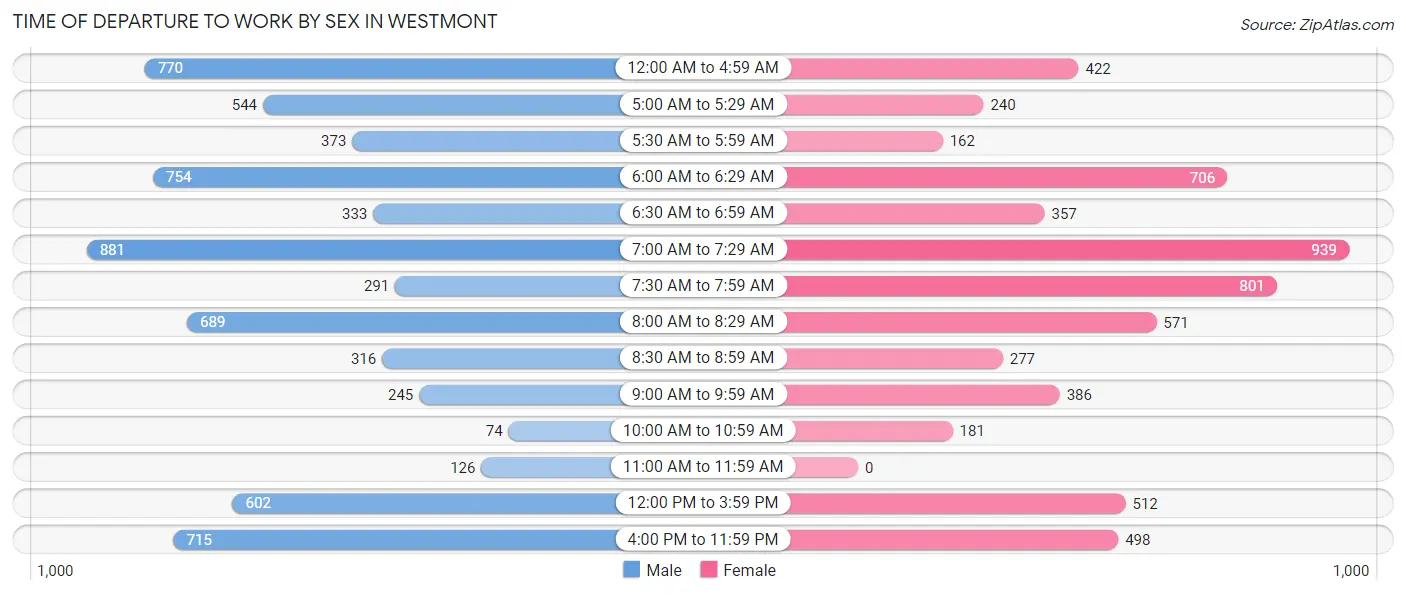
| Time of Departure | Male | Female |
| 12:00 AM to 4:59 AM | 770 (11.5%) | 422 (7.0%) |
| 5:00 AM to 5:29 AM | 544 (8.1%) | 240 (4.0%) |
| 5:30 AM to 5:59 AM | 373 (5.6%) | 162 (2.7%) |
| 6:00 AM to 6:29 AM | 754 (11.2%) | 706 (11.7%) |
| 6:30 AM to 6:59 AM | 333 (5.0%) | 357 (5.9%) |
| 7:00 AM to 7:29 AM | 881 (13.1%) | 939 (15.5%) |
| 7:30 AM to 7:59 AM | 291 (4.3%) | 801 (13.2%) |
| 8:00 AM to 8:29 AM | 689 (10.3%) | 571 (9.4%) |
| 8:30 AM to 8:59 AM | 316 (4.7%) | 277 (4.6%) |
| 9:00 AM to 9:59 AM | 245 (3.6%) | 386 (6.4%) |
| 10:00 AM to 10:59 AM | 74 (1.1%) | 181 (3.0%) |
| 11:00 AM to 11:59 AM | 126 (1.9%) | 0 (0.0%) |
| 12:00 PM to 3:59 PM | 602 (9.0%) | 512 (8.5%) |
| 4:00 PM to 11:59 PM | 715 (10.6%) | 498 (8.2%) |
| Total | 6,713 (100.0%) | 6,052 (100.0%) |
Housing Occupancy in Westmont
Occupancy by Ownership in Westmont
Of the total 10,551 dwellings in Westmont, owner-occupied units account for 2,944 (27.9%), while renter-occupied units make up 7,607 (72.1%).
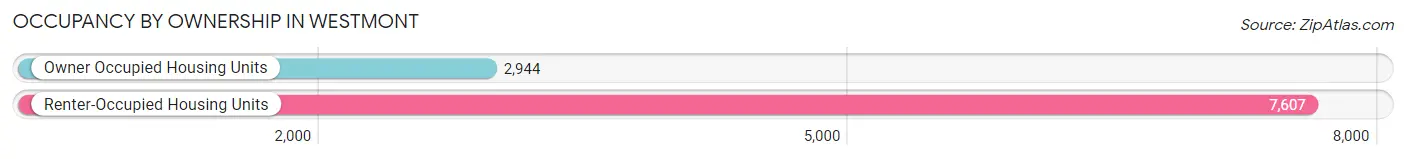
| Occupancy | # Housing Units | % Housing Units |
| Owner Occupied Housing Units | 2,944 | 27.9% |
| Renter-Occupied Housing Units | 7,607 | 72.1% |
| Total Occupied Housing Units | 10,551 | 100.0% |
Occupancy by Household Size in Westmont
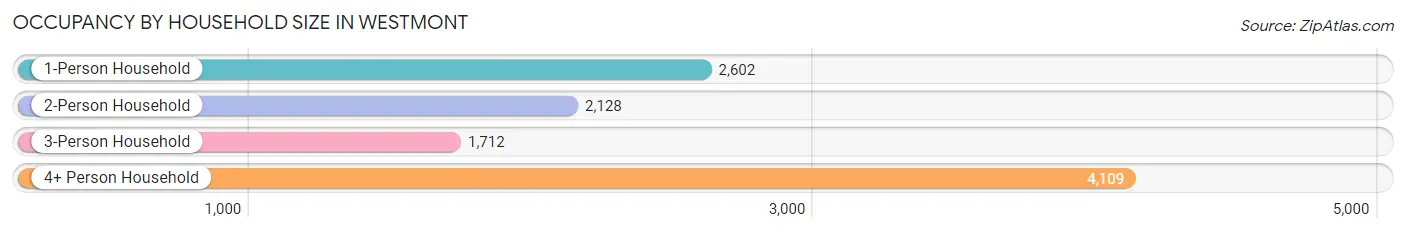
| Household Size | # Housing Units | % Housing Units |
| 1-Person Household | 2,602 | 24.7% |
| 2-Person Household | 2,128 | 20.2% |
| 3-Person Household | 1,712 | 16.2% |
| 4+ Person Household | 4,109 | 38.9% |
| Total Housing Units | 10,551 | 100.0% |
Occupancy by Ownership by Household Size in Westmont
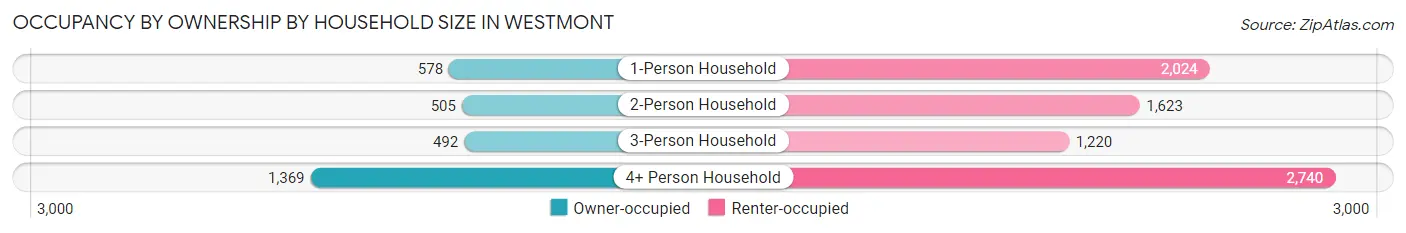
| Household Size | Owner-occupied | Renter-occupied |
| 1-Person Household | 578 (22.2%) | 2,024 (77.8%) |
| 2-Person Household | 505 (23.7%) | 1,623 (76.3%) |
| 3-Person Household | 492 (28.7%) | 1,220 (71.3%) |
| 4+ Person Household | 1,369 (33.3%) | 2,740 (66.7%) |
| Total Housing Units | 2,944 (27.9%) | 7,607 (72.1%) |
Occupancy by Educational Attainment in Westmont
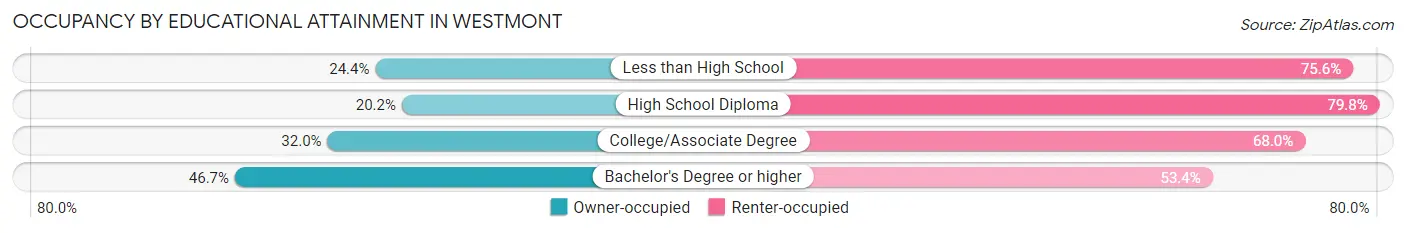
| Household Size | Owner-occupied | Renter-occupied |
| Less than High School | 666 (24.4%) | 2,066 (75.6%) |
| High School Diploma | 638 (20.2%) | 2,525 (79.8%) |
| College/Associate Degree | 1,159 (32.0%) | 2,466 (68.0%) |
| Bachelor's Degree or higher | 481 (46.7%) | 550 (53.3%) |
Occupancy by Age of Householder in Westmont
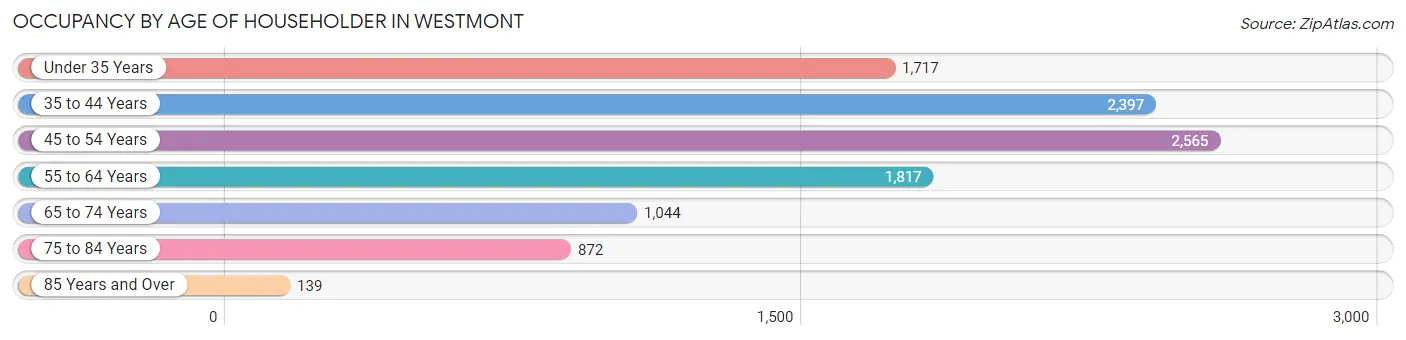
| Age Bracket | # Households | % Households |
| Under 35 Years | 1,717 | 16.3% |
| 35 to 44 Years | 2,397 | 22.7% |
| 45 to 54 Years | 2,565 | 24.3% |
| 55 to 64 Years | 1,817 | 17.2% |
| 65 to 74 Years | 1,044 | 9.9% |
| 75 to 84 Years | 872 | 8.3% |
| 85 Years and Over | 139 | 1.3% |
| Total | 10,551 | 100.0% |
Housing Finances in Westmont
Median Income by Occupancy in Westmont
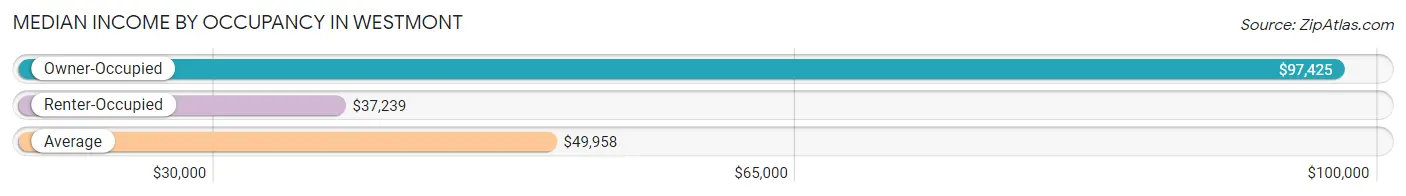
| Occupancy Type | # Households | Median Income |
| Owner-Occupied | 2,944 (27.9%) | $97,425 |
| Renter-Occupied | 7,607 (72.1%) | $37,239 |
| Average | 10,551 (100.0%) | $49,958 |
Occupancy by Householder Income Bracket in Westmont
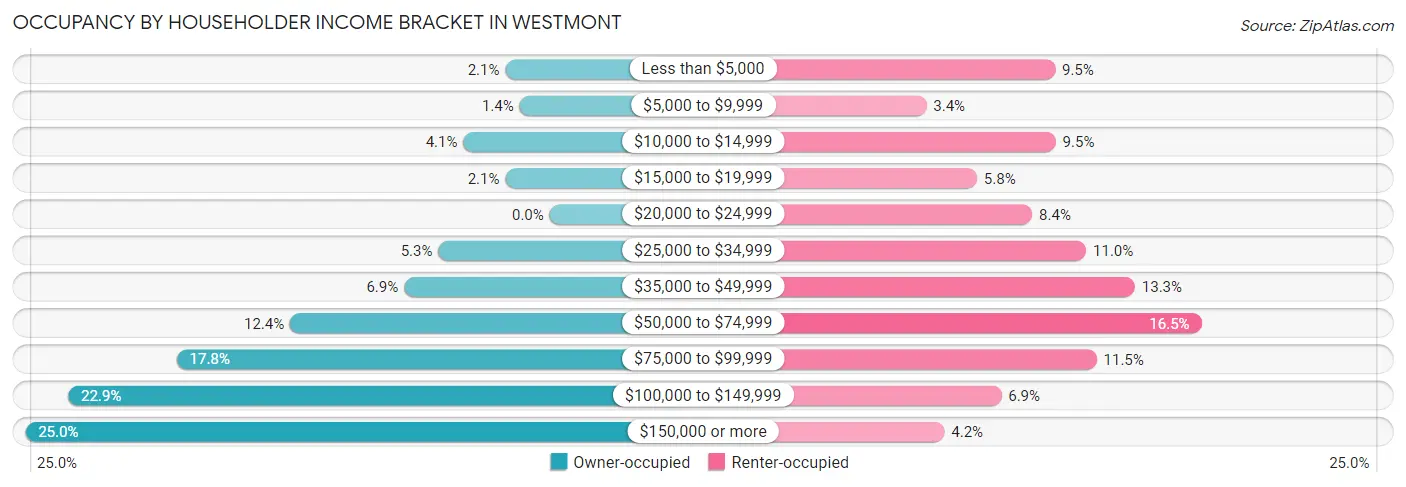
| Income Bracket | Owner-occupied | Renter-occupied |
| Less than $5,000 | 62 (2.1%) | 723 (9.5%) |
| $5,000 to $9,999 | 42 (1.4%) | 256 (3.4%) |
| $10,000 to $14,999 | 121 (4.1%) | 725 (9.5%) |
| $15,000 to $19,999 | 62 (2.1%) | 440 (5.8%) |
| $20,000 to $24,999 | 0 (0.0%) | 640 (8.4%) |
| $25,000 to $34,999 | 156 (5.3%) | 835 (11.0%) |
| $35,000 to $49,999 | 204 (6.9%) | 1,012 (13.3%) |
| $50,000 to $74,999 | 364 (12.4%) | 1,253 (16.5%) |
| $75,000 to $99,999 | 523 (17.8%) | 873 (11.5%) |
| $100,000 to $149,999 | 675 (22.9%) | 528 (6.9%) |
| $150,000 or more | 735 (25.0%) | 322 (4.2%) |
| Total | 2,944 (100.0%) | 7,607 (100.0%) |
Monthly Housing Cost Tiers in Westmont
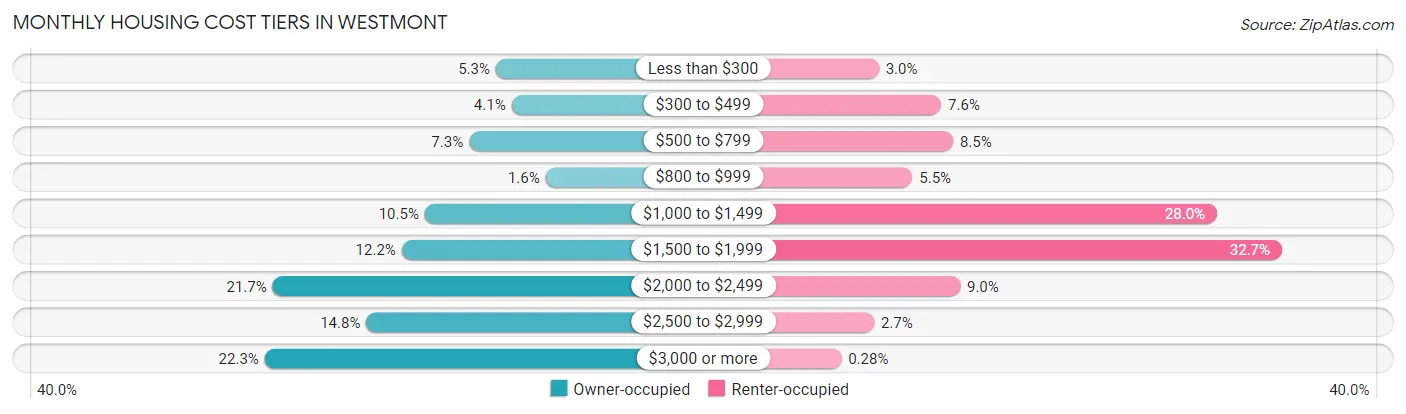
| Monthly Cost | Owner-occupied | Renter-occupied |
| Less than $300 | 156 (5.3%) | 231 (3.0%) |
| $300 to $499 | 122 (4.1%) | 581 (7.6%) |
| $500 to $799 | 214 (7.3%) | 647 (8.5%) |
| $800 to $999 | 48 (1.6%) | 420 (5.5%) |
| $1,000 to $1,499 | 310 (10.5%) | 2,126 (28.0%) |
| $1,500 to $1,999 | 360 (12.2%) | 2,490 (32.7%) |
| $2,000 to $2,499 | 640 (21.7%) | 687 (9.0%) |
| $2,500 to $2,999 | 437 (14.8%) | 205 (2.7%) |
| $3,000 or more | 657 (22.3%) | 21 (0.3%) |
| Total | 2,944 (100.0%) | 7,607 (100.0%) |
Physical Housing Characteristics in Westmont
Housing Structures in Westmont
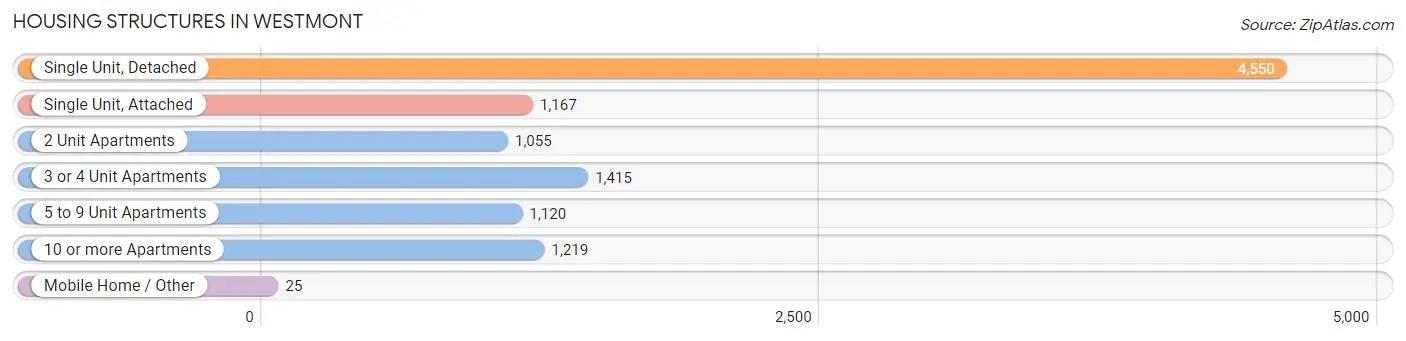
| Structure Type | # Housing Units | % Housing Units |
| Single Unit, Detached | 4,550 | 43.1% |
| Single Unit, Attached | 1,167 | 11.1% |
| 2 Unit Apartments | 1,055 | 10.0% |
| 3 or 4 Unit Apartments | 1,415 | 13.4% |
| 5 to 9 Unit Apartments | 1,120 | 10.6% |
| 10 or more Apartments | 1,219 | 11.6% |
| Mobile Home / Other | 25 | 0.2% |
| Total | 10,551 | 100.0% |
Housing Structures by Occupancy in Westmont
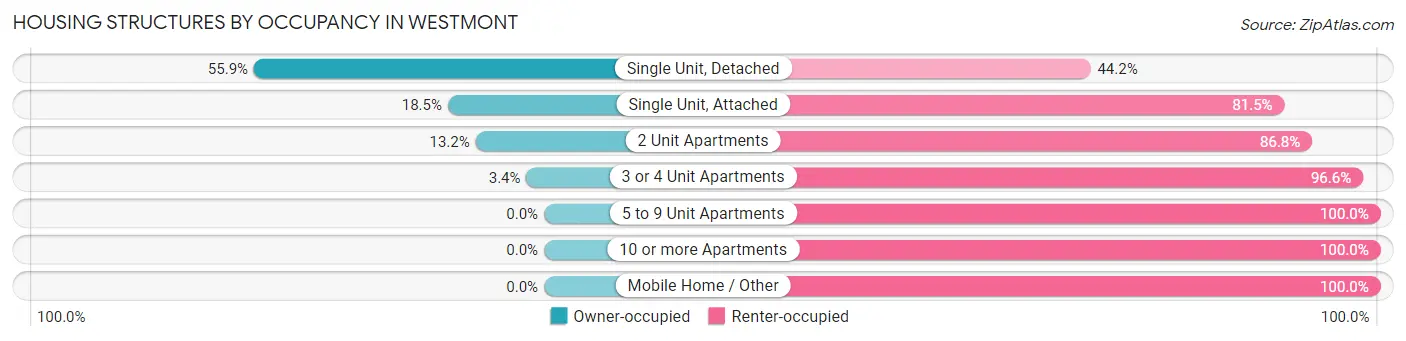
| Structure Type | Owner-occupied | Renter-occupied |
| Single Unit, Detached | 2,541 (55.8%) | 2,009 (44.2%) |
| Single Unit, Attached | 216 (18.5%) | 951 (81.5%) |
| 2 Unit Apartments | 139 (13.2%) | 916 (86.8%) |
| 3 or 4 Unit Apartments | 48 (3.4%) | 1,367 (96.6%) |
| 5 to 9 Unit Apartments | 0 (0.0%) | 1,120 (100.0%) |
| 10 or more Apartments | 0 (0.0%) | 1,219 (100.0%) |
| Mobile Home / Other | 0 (0.0%) | 25 (100.0%) |
| Total | 2,944 (27.9%) | 7,607 (72.1%) |
Housing Structures by Number of Rooms in Westmont
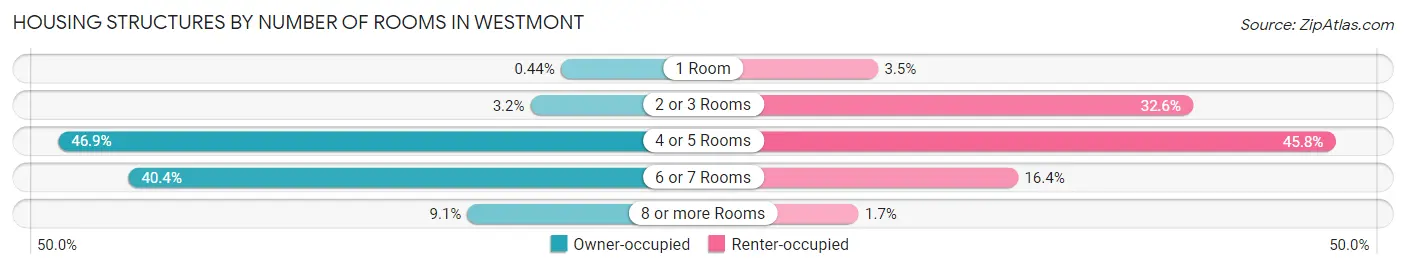
| Number of Rooms | Owner-occupied | Renter-occupied |
| 1 Room | 13 (0.4%) | 264 (3.5%) |
| 2 or 3 Rooms | 95 (3.2%) | 2,482 (32.6%) |
| 4 or 5 Rooms | 1,380 (46.9%) | 3,484 (45.8%) |
| 6 or 7 Rooms | 1,189 (40.4%) | 1,249 (16.4%) |
| 8 or more Rooms | 267 (9.1%) | 128 (1.7%) |
| Total | 2,944 (100.0%) | 7,607 (100.0%) |
Housing Structure by Heating Type in Westmont
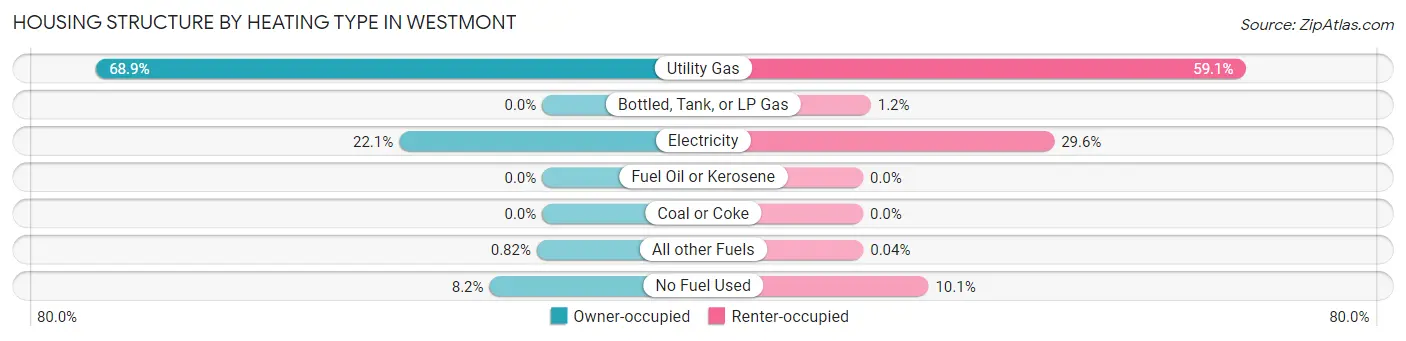
| Heating Type | Owner-occupied | Renter-occupied |
| Utility Gas | 2,029 (68.9%) | 4,495 (59.1%) |
| Bottled, Tank, or LP Gas | 0 (0.0%) | 91 (1.2%) |
| Electricity | 651 (22.1%) | 2,248 (29.5%) |
| Fuel Oil or Kerosene | 0 (0.0%) | 0 (0.0%) |
| Coal or Coke | 0 (0.0%) | 0 (0.0%) |
| All other Fuels | 24 (0.8%) | 3 (0.0%) |
| No Fuel Used | 240 (8.2%) | 770 (10.1%) |
| Total | 2,944 (100.0%) | 7,607 (100.0%) |
Household Vehicle Usage in Westmont
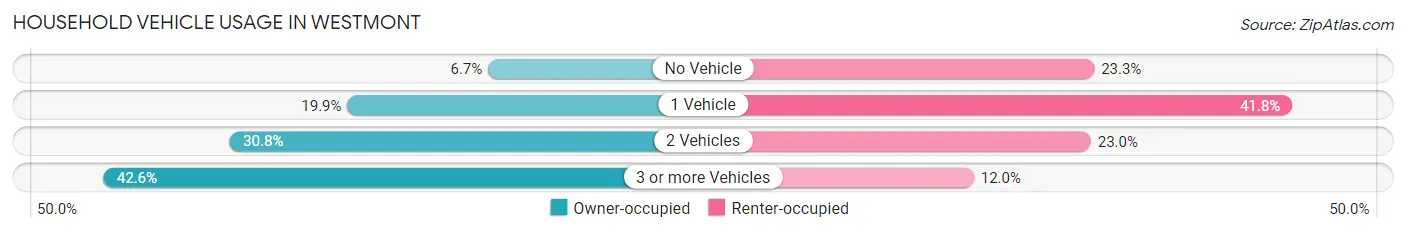
| Vehicles per Household | Owner-occupied | Renter-occupied |
| No Vehicle | 198 (6.7%) | 1,770 (23.3%) |
| 1 Vehicle | 585 (19.9%) | 3,176 (41.7%) |
| 2 Vehicles | 907 (30.8%) | 1,746 (23.0%) |
| 3 or more Vehicles | 1,254 (42.6%) | 915 (12.0%) |
| Total | 2,944 (100.0%) | 7,607 (100.0%) |
Real Estate & Mortgages in Westmont
Real Estate and Mortgage Overview in Westmont
| Characteristic | Without Mortgage | With Mortgage |
| Housing Units | 648 | 2,296 |
| Median Property Value | $536,500 | $604,300 |
| Median Household Income | $61,250 | $662 |
| Monthly Housing Costs | $564 | $657 |
| Real Estate Taxes | $4,135 | $39 |
Property Value by Mortgage Status in Westmont
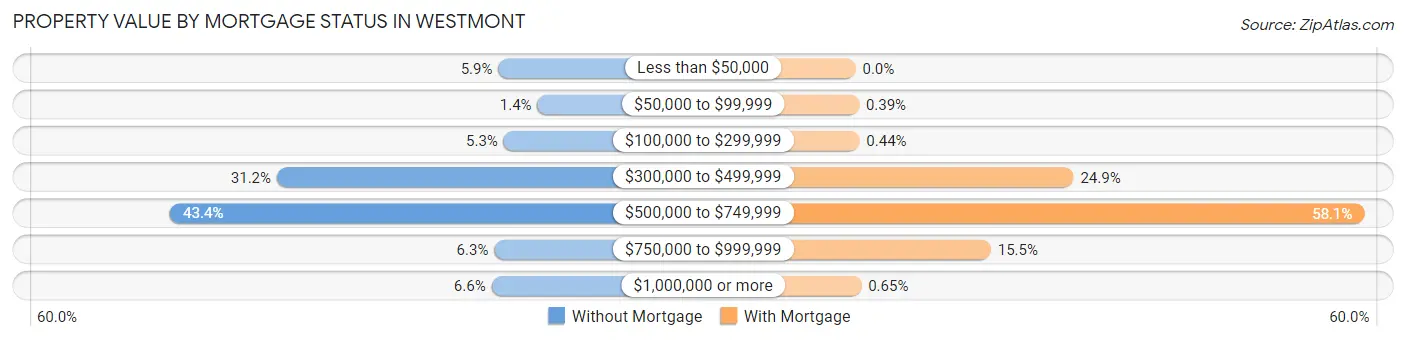
| Property Value | Without Mortgage | With Mortgage |
| Less than $50,000 | 38 (5.9%) | 0 (0.0%) |
| $50,000 to $99,999 | 9 (1.4%) | 9 (0.4%) |
| $100,000 to $299,999 | 34 (5.2%) | 10 (0.4%) |
| $300,000 to $499,999 | 202 (31.2%) | 572 (24.9%) |
| $500,000 to $749,999 | 281 (43.4%) | 1,335 (58.1%) |
| $750,000 to $999,999 | 41 (6.3%) | 355 (15.5%) |
| $1,000,000 or more | 43 (6.6%) | 15 (0.6%) |
| Total | 648 (100.0%) | 2,296 (100.0%) |
Household Income by Mortgage Status in Westmont
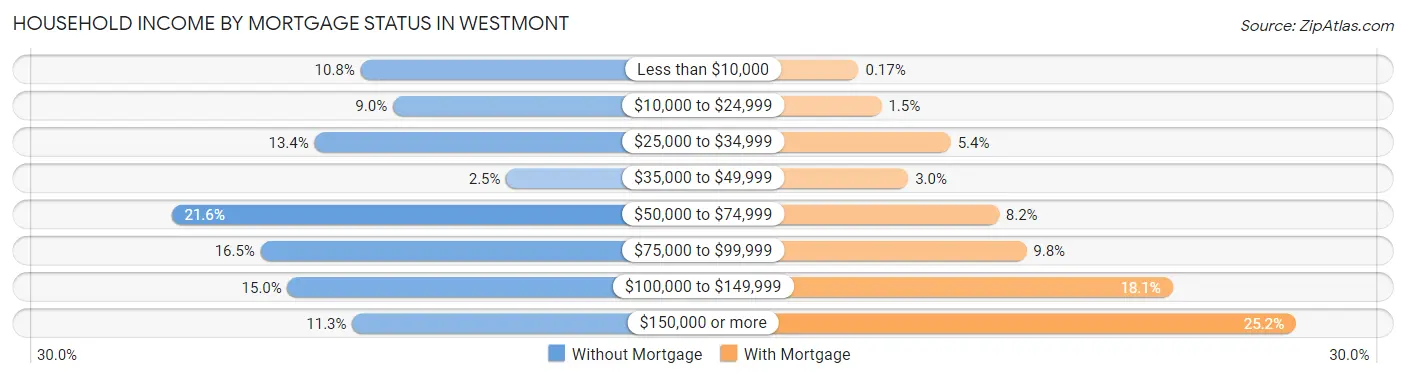
| Household Income | Without Mortgage | With Mortgage |
| Less than $10,000 | 70 (10.8%) | 4 (0.2%) |
| $10,000 to $24,999 | 58 (8.9%) | 34 (1.5%) |
| $25,000 to $34,999 | 87 (13.4%) | 125 (5.4%) |
| $35,000 to $49,999 | 16 (2.5%) | 69 (3.0%) |
| $50,000 to $74,999 | 140 (21.6%) | 188 (8.2%) |
| $75,000 to $99,999 | 107 (16.5%) | 224 (9.8%) |
| $100,000 to $149,999 | 97 (15.0%) | 416 (18.1%) |
| $150,000 or more | 73 (11.3%) | 578 (25.2%) |
| Total | 648 (100.0%) | 2,296 (100.0%) |
Property Value to Household Income Ratio in Westmont
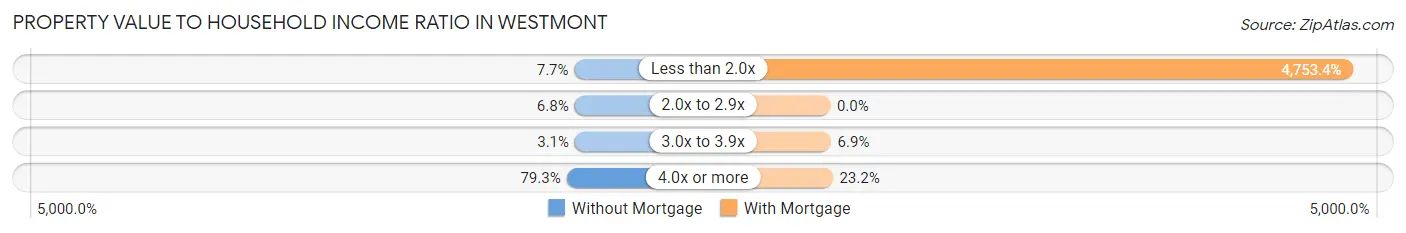
| Value-to-Income Ratio | Without Mortgage | With Mortgage |
| Less than 2.0x | 50 (7.7%) | 109,139 (4,753.4%) |
| 2.0x to 2.9x | 44 (6.8%) | 0 (0.0%) |
| 3.0x to 3.9x | 20 (3.1%) | 158 (6.9%) |
| 4.0x or more | 514 (79.3%) | 533 (23.2%) |
| Total | 648 (100.0%) | 2,296 (100.0%) |
Real Estate Taxes by Mortgage Status in Westmont
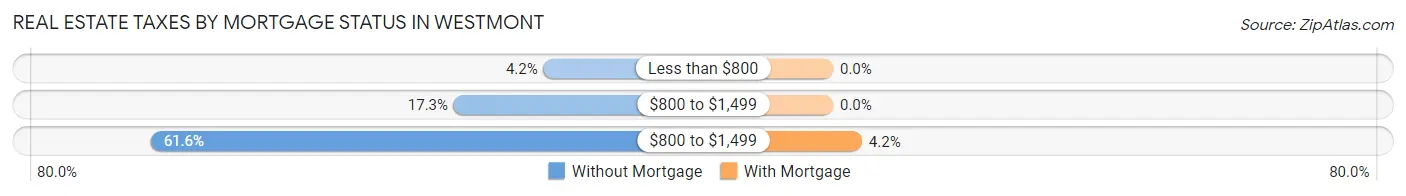
| Property Taxes | Without Mortgage | With Mortgage |
| Less than $800 | 27 (4.2%) | 0 (0.0%) |
| $800 to $1,499 | 112 (17.3%) | 0 (0.0%) |
| $800 to $1,499 | 399 (61.6%) | 97 (4.2%) |
| Total | 648 (100.0%) | 2,296 (100.0%) |
Health & Disability in Westmont
Health Insurance Coverage by Age in Westmont
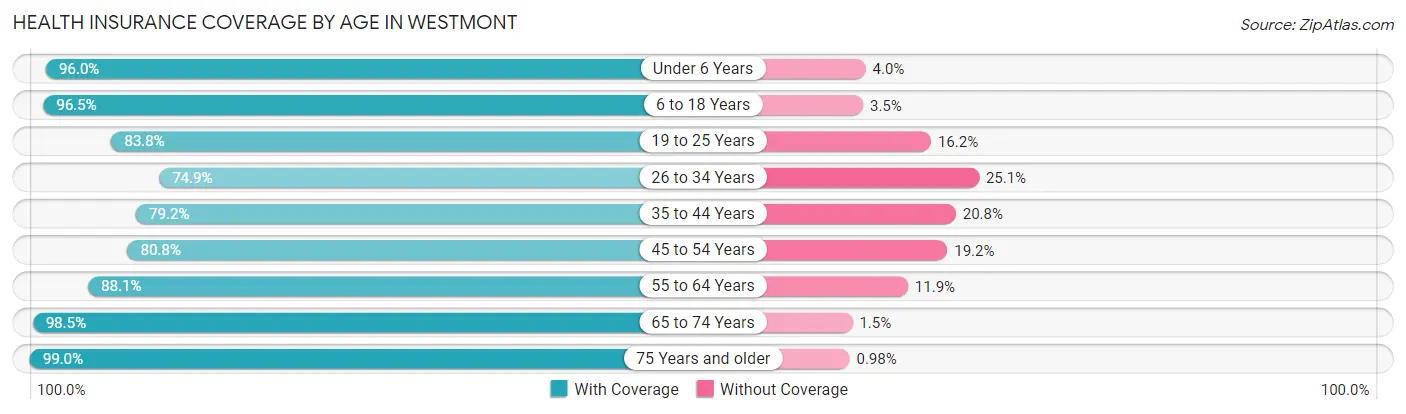
| Age Bracket | With Coverage | Without Coverage |
| Under 6 Years | 3,184 (96.0%) | 132 (4.0%) |
| 6 to 18 Years | 7,356 (96.5%) | 266 (3.5%) |
| 19 to 25 Years | 2,960 (83.8%) | 571 (16.2%) |
| 26 to 34 Years | 3,520 (74.9%) | 1,180 (25.1%) |
| 35 to 44 Years | 4,048 (79.2%) | 1,063 (20.8%) |
| 45 to 54 Years | 3,511 (80.8%) | 835 (19.2%) |
| 55 to 64 Years | 2,794 (88.1%) | 376 (11.9%) |
| 65 to 74 Years | 1,938 (98.5%) | 30 (1.5%) |
| 75 Years and older | 1,517 (99.0%) | 15 (1.0%) |
| Total | 30,828 (87.3%) | 4,468 (12.7%) |
Health Insurance Coverage by Citizenship Status in Westmont
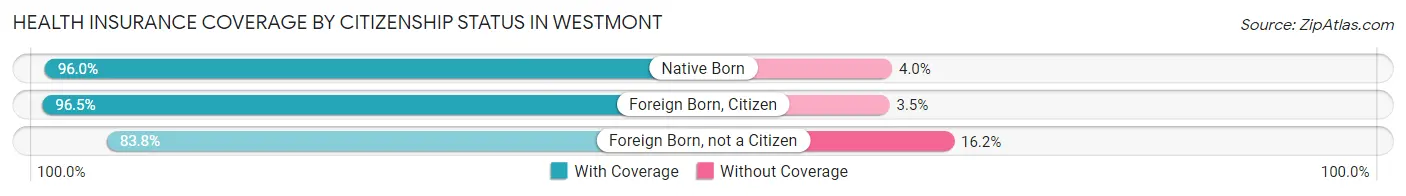
| Citizenship Status | With Coverage | Without Coverage |
| Native Born | 3,184 (96.0%) | 132 (4.0%) |
| Foreign Born, Citizen | 7,356 (96.5%) | 266 (3.5%) |
| Foreign Born, not a Citizen | 2,960 (83.8%) | 571 (16.2%) |
Health Insurance Coverage by Household Income in Westmont
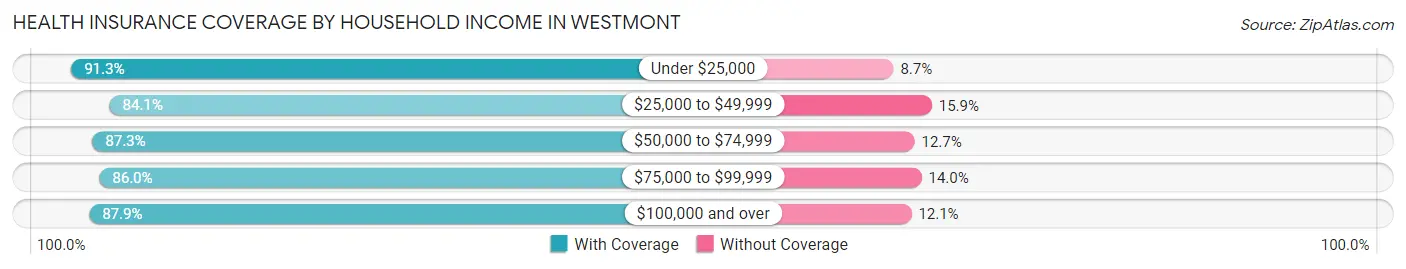
| Household Income | With Coverage | Without Coverage |
| Under $25,000 | 5,689 (91.3%) | 545 (8.7%) |
| $25,000 to $49,999 | 5,936 (84.1%) | 1,124 (15.9%) |
| $50,000 to $74,999 | 5,602 (87.3%) | 815 (12.7%) |
| $75,000 to $99,999 | 5,412 (86.0%) | 882 (14.0%) |
| $100,000 and over | 8,000 (87.9%) | 1,102 (12.1%) |
Public vs Private Health Insurance Coverage by Age in Westmont
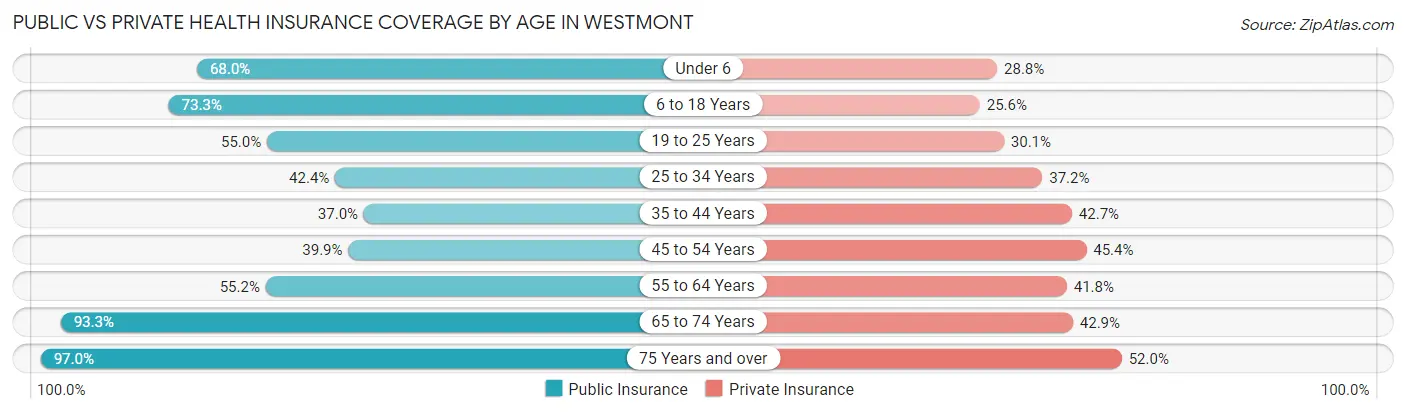
| Age Bracket | Public Insurance | Private Insurance |
| Under 6 | 2,255 (68.0%) | 956 (28.8%) |
| 6 to 18 Years | 5,584 (73.3%) | 1,952 (25.6%) |
| 19 to 25 Years | 1,942 (55.0%) | 1,062 (30.1%) |
| 25 to 34 Years | 1,991 (42.4%) | 1,749 (37.2%) |
| 35 to 44 Years | 1,892 (37.0%) | 2,183 (42.7%) |
| 45 to 54 Years | 1,734 (39.9%) | 1,972 (45.4%) |
| 55 to 64 Years | 1,751 (55.2%) | 1,324 (41.8%) |
| 65 to 74 Years | 1,836 (93.3%) | 844 (42.9%) |
| 75 Years and over | 1,486 (97.0%) | 796 (52.0%) |
| Total | 20,471 (58.0%) | 12,838 (36.4%) |
Disability Status by Sex by Age in Westmont
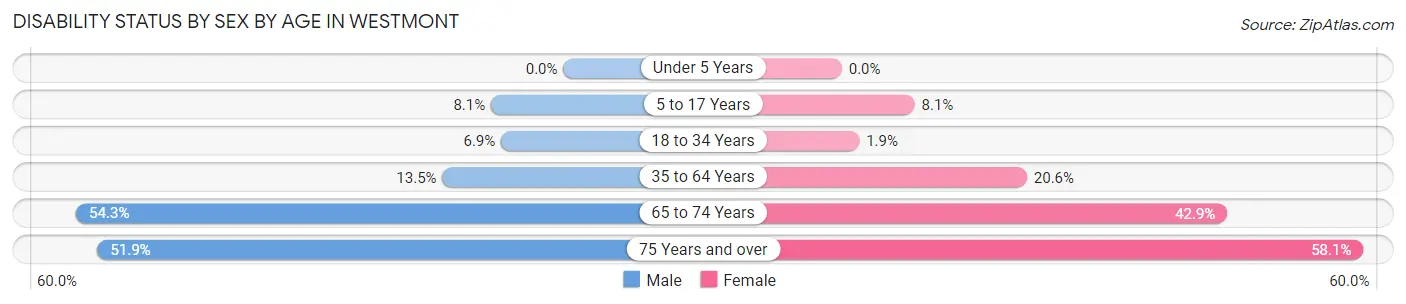
| Age Bracket | Male | Female |
| Under 5 Years | 0 (0.0%) | 0 (0.0%) |
| 5 to 17 Years | 347 (8.1%) | 276 (8.1%) |
| 18 to 34 Years | 298 (6.9%) | 88 (1.9%) |
| 35 to 64 Years | 740 (13.5%) | 1,470 (20.6%) |
| 65 to 74 Years | 470 (54.3%) | 473 (42.9%) |
| 75 Years and over | 274 (51.9%) | 583 (58.1%) |
Disability Class by Sex by Age in Westmont
Disability Class: Hearing Difficulty
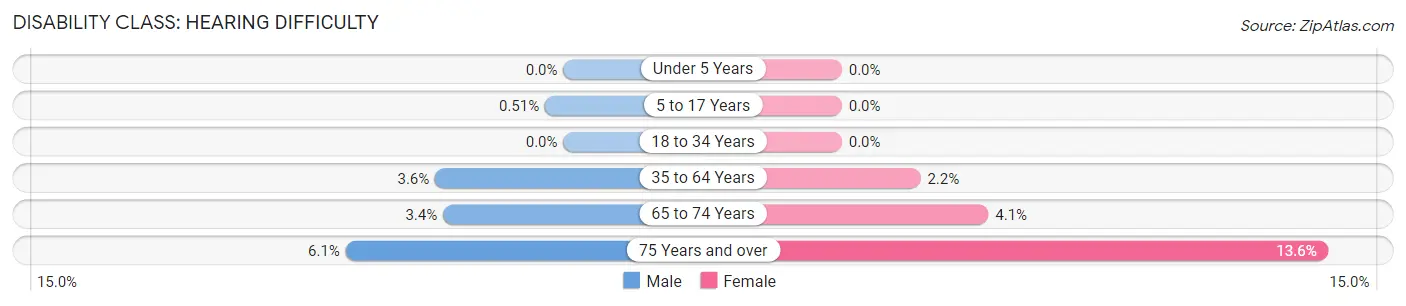
| Age Bracket | Male | Female |
| Under 5 Years | 0 (0.0%) | 0 (0.0%) |
| 5 to 17 Years | 22 (0.5%) | 0 (0.0%) |
| 18 to 34 Years | 0 (0.0%) | 0 (0.0%) |
| 35 to 64 Years | 196 (3.6%) | 156 (2.2%) |
| 65 to 74 Years | 29 (3.4%) | 45 (4.1%) |
| 75 Years and over | 32 (6.1%) | 136 (13.6%) |
Disability Class: Vision Difficulty
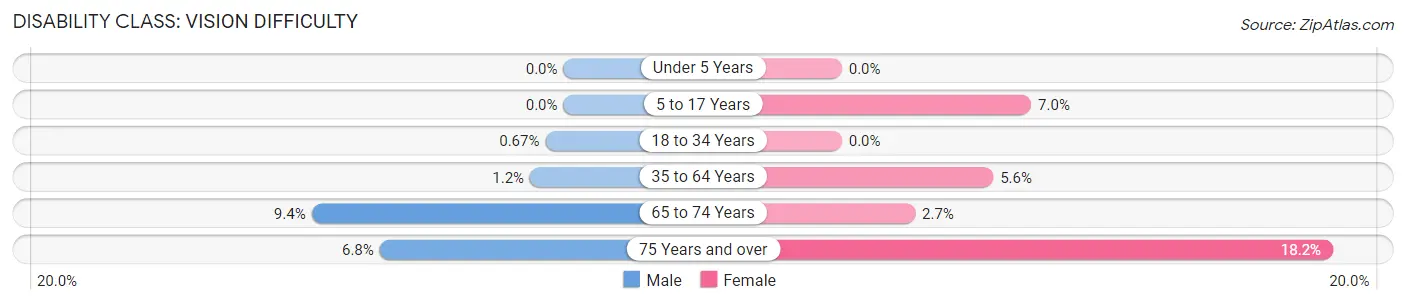
| Age Bracket | Male | Female |
| Under 5 Years | 0 (0.0%) | 0 (0.0%) |
| 5 to 17 Years | 0 (0.0%) | 239 (7.0%) |
| 18 to 34 Years | 29 (0.7%) | 0 (0.0%) |
| 35 to 64 Years | 68 (1.2%) | 401 (5.6%) |
| 65 to 74 Years | 81 (9.3%) | 30 (2.7%) |
| 75 Years and over | 36 (6.8%) | 183 (18.2%) |
Disability Class: Cognitive Difficulty
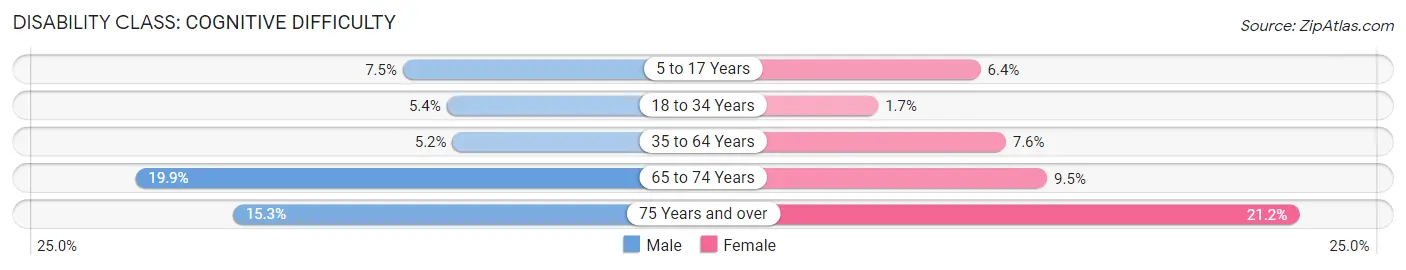
| Age Bracket | Male | Female |
| 5 to 17 Years | 321 (7.4%) | 219 (6.4%) |
| 18 to 34 Years | 233 (5.4%) | 77 (1.7%) |
| 35 to 64 Years | 283 (5.1%) | 543 (7.6%) |
| 65 to 74 Years | 172 (19.9%) | 105 (9.5%) |
| 75 Years and over | 81 (15.3%) | 213 (21.2%) |
Disability Class: Ambulatory Difficulty
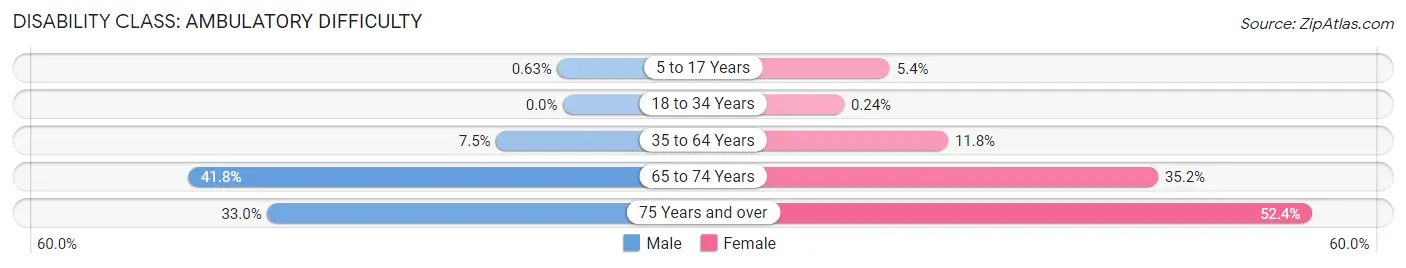
| Age Bracket | Male | Female |
| 5 to 17 Years | 27 (0.6%) | 182 (5.3%) |
| 18 to 34 Years | 0 (0.0%) | 11 (0.2%) |
| 35 to 64 Years | 409 (7.4%) | 843 (11.8%) |
| 65 to 74 Years | 362 (41.8%) | 388 (35.2%) |
| 75 Years and over | 174 (33.0%) | 526 (52.4%) |
Disability Class: Self-Care Difficulty
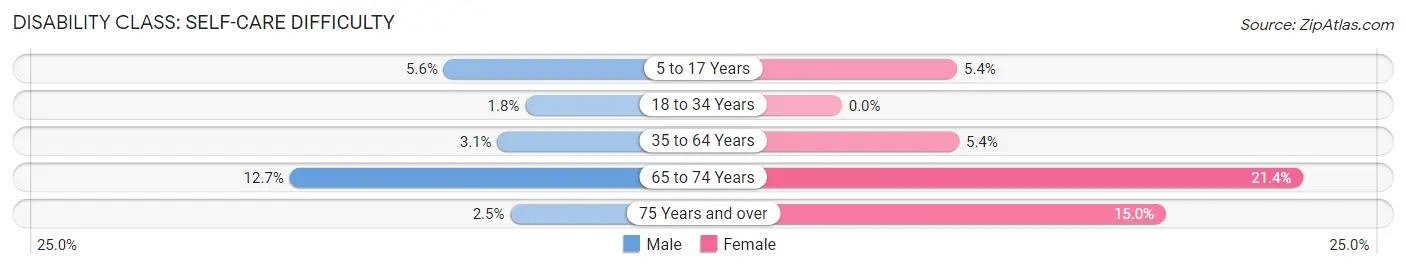
| Age Bracket | Male | Female |
| 5 to 17 Years | 239 (5.6%) | 182 (5.3%) |
| 18 to 34 Years | 76 (1.8%) | 0 (0.0%) |
| 35 to 64 Years | 168 (3.1%) | 388 (5.4%) |
| 65 to 74 Years | 110 (12.7%) | 236 (21.4%) |
| 75 Years and over | 13 (2.5%) | 151 (15.0%) |
Technology Access in Westmont
Computing Device Access in Westmont
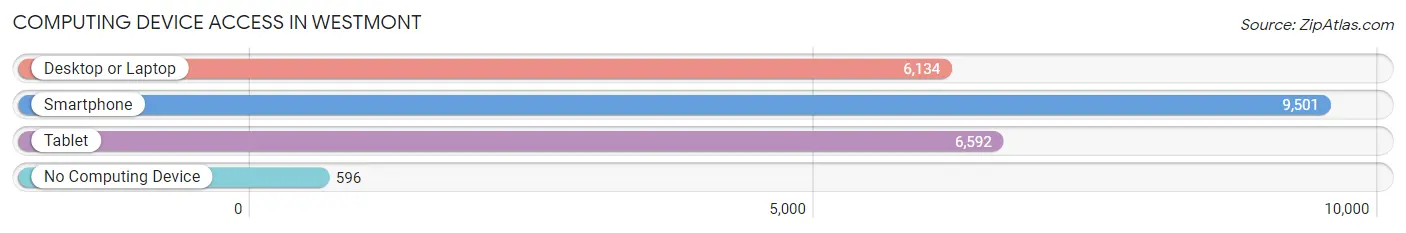
| Device Type | # Households | % Households |
| Desktop or Laptop | 6,134 | 58.1% |
| Smartphone | 9,501 | 90.0% |
| Tablet | 6,592 | 62.5% |
| No Computing Device | 596 | 5.7% |
| Total | 10,551 | 100.0% |
Internet Access in Westmont
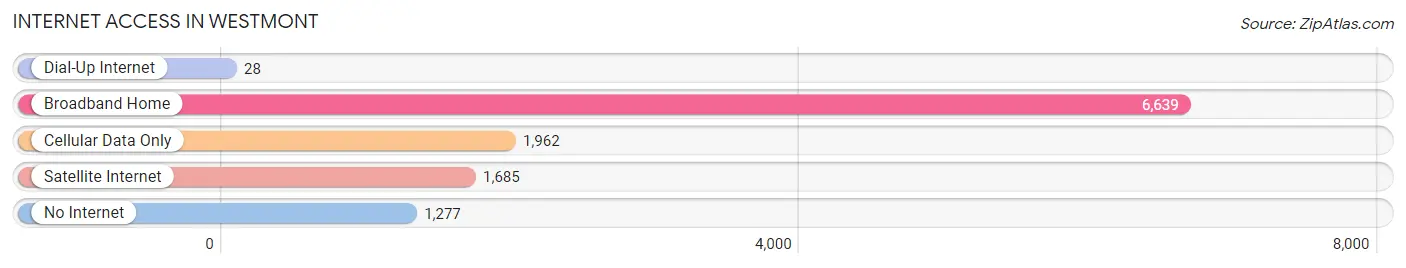
| Internet Type | # Households | % Households |
| Dial-Up Internet | 28 | 0.3% |
| Broadband Home | 6,639 | 62.9% |
| Cellular Data Only | 1,962 | 18.6% |
| Satellite Internet | 1,685 | 16.0% |
| No Internet | 1,277 | 12.1% |
| Total | 10,551 | 100.0% |
Westmont Summary
Westmont is a census-designated place located in Los Angeles County, California. It is located in the South Bay region of the Greater Los Angeles area, and is bordered by the cities of Hawthorne, Gardena, and Inglewood. The population of Westmont was 35,912 at the 2010 census.
History
Westmont was originally part of the Rancho San Pedro land grant, which was granted to Juan Jose Dominguez in 1784. The area was developed in the 1920s as a residential area, and was annexed by the City of Los Angeles in 1926. In the 1950s, the area was rezoned for industrial use, and many of the homes were demolished to make way for factories and warehouses. In the 1970s, the area was rezoned for residential use, and many of the factories and warehouses were demolished to make way for homes.
Geography
Westmont is located at 33°54'25" North, 118°19'17" West (33.906833, -118.321389). It is situated in the South Bay region of Los Angeles County, and is bordered by the cities of Hawthorne, Gardena, and Inglewood. The area is approximately 4.5 square miles in size, and is located at an elevation of approximately 200 feet above sea level.
Economy
Westmont is primarily a residential area, and the majority of its residents are employed in the service sector. The area is home to a number of small businesses, including restaurants, retail stores, and professional services. The area is also home to a number of industrial and manufacturing businesses, including aerospace and automotive companies.
Demographics
As of the 2010 census, the population of Westmont was 35,912. The racial makeup of the area was 44.3% White, 11.2% African American, 0.7% Native American, 11.2% Asian, 0.2% Pacific Islander, and 32.4% from other races. The median household income was $45,844, and the median family income was $50,945. The per capita income was $20,945.
Conclusion
Westmont is a census-designated place located in Los Angeles County, California. It is located in the South Bay region of the Greater Los Angeles area, and is bordered by the cities of Hawthorne, Gardena, and Inglewood. The population of Westmont was 35,912 at the 2010 census. The area was originally part of the Rancho San Pedro land grant, and was developed in the 1920s as a residential area. In the 1950s, the area was rezoned for industrial use, and in the 1970s, it was rezoned for residential use. Westmont is primarily a residential area, and the majority of its residents are employed in the service sector. The area is also home to a number of industrial and manufacturing businesses. As of the 2010 census, the population of Westmont was 35,912, and the racial makeup of the area was 44.3% White, 11.2% African American, 0.7% Native American, 11.2% Asian, 0.2% Pacific Islander, and 32.4% from other races. The median household income was $45,844, and the median family income was $50,945.
Common Questions
What is Per Capita Income in Westmont?
Per Capita income in Westmont is $21,086.
What is the Median Family Income in Westmont?
Median Family Income in Westmont is $59,439.
What is the Median Household income in Westmont?
Median Household Income in Westmont is $49,958.
What is Income or Wage Gap in Westmont?
Income or Wage Gap in Westmont is 22.4%.
Women in Westmont earn 77.6 cents for every dollar earned by a man.
What is Family Income Deficit in Westmont?
Family Income Deficit in Westmont is $9,710.
Families that are below poverty line in Westmont earn $9,710 less on average than the poverty threshold level.
What is Inequality or Gini Index in Westmont?
Inequality or Gini Index in Westmont is 0.47.
What is the Total Population of Westmont?
Total Population of Westmont is 35,345.
What is the Total Male Population of Westmont?
Total Male Population of Westmont is 16,912.
What is the Total Female Population of Westmont?
Total Female Population of Westmont is 18,433.
What is the Ratio of Males per 100 Females in Westmont?
There are 91.75 Males per 100 Females in Westmont.
What is the Ratio of Females per 100 Males in Westmont?
There are 108.99 Females per 100 Males in Westmont.
What is the Median Population Age in Westmont?
Median Population Age in Westmont is 32.1 Years.
What is the Average Family Size in Westmont
Average Family Size in Westmont is 4.0 People.
What is the Average Household Size in Westmont
Average Household Size in Westmont is 3.3 People.
How Large is the Labor Force in Westmont?
There are 15,852 People in the Labor Forcein in Westmont.
What is the Percentage of People in the Labor Force in Westmont?
60.6% of People are in the Labor Force in Westmont.
What is the Unemployment Rate in Westmont?
Unemployment Rate in Westmont is 11.0%.