Earnings by Sex by Educational Attainment in Casmalia
Educational Attainment
Male Income
Female Income
Less than High School
-
-
High School Diploma
-
-
College or Associate's Degree
-
-
Bachelor's Degree
-
-
Graduate Degree
-
-
Total
-
-
Family Income in Casmalia
Family Income Brackets in Casmalia
According to the Casmalia family income data, there are 15 families falling into the $75,000 to $99,999 income range, which is the most common income bracket and makes up 100.0% of all families.
Income Bracket
# Families
% Families
Less than $10,000
0
0.0%
$10,000 to $14,999
0
0.0%
$15,000 to $24,999
0
0.0%
$25,000 to $34,999
0
0.0%
$35,000 to $49,999
0
0.0%
$50,000 to $74,999
0
0.0%
$75,000 to $99,999
15
100.0%
$100,000 to $149,999
0
0.0%
$150,000 to $199,999
0
0.0%
$200,000+
0
0.0%
Family Income by Famaliy Size in Casmalia
Income Bracket
# Families
Median Income
2-Person Families
15 (100.0%)
$0
3-Person Families
0 (0.0%)
$0
4-Person Families
0 (0.0%)
$0
5-Person Families
0 (0.0%)
$0
6-Person Families
0 (0.0%)
$0
7+ Person Families
0 (0.0%)
$0
Total
15 (100.0%)
$0
Family Income by Number of Earners in Casmalia
Number of Earners
# Families
Median Income
No Earners
15 (100.0%)
$0
1 Earner
0 (0.0%)
$0
2 Earners
0 (0.0%)
$0
3+ Earners
0 (0.0%)
$0
Total
15 (100.0%)
$0
Household Income in Casmalia
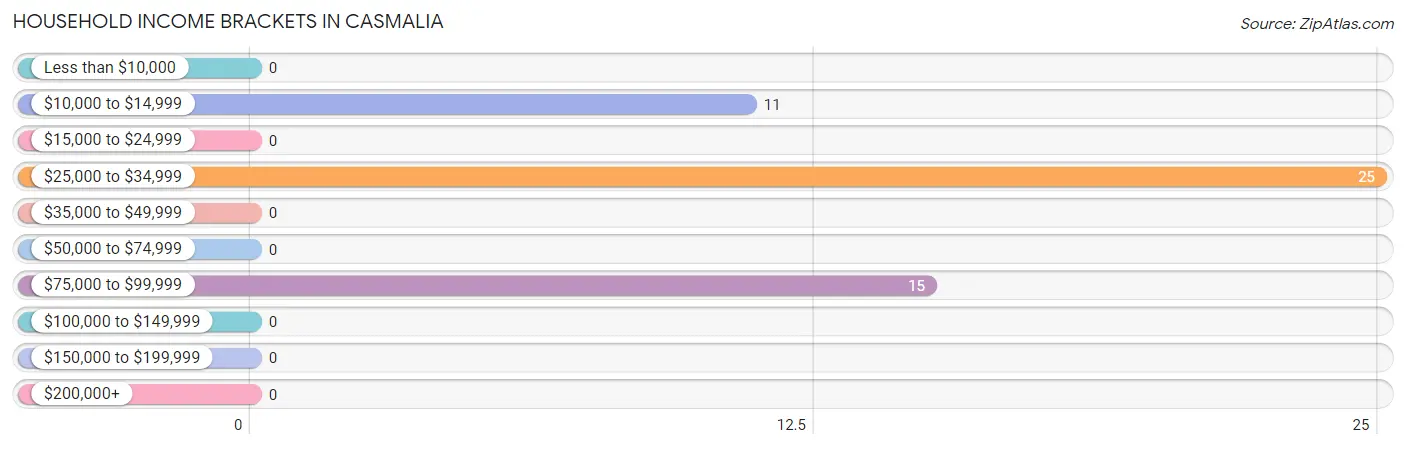
Household Income Brackets in Casmalia
With 25 households falling in the category, the $25,000 to $34,999 income range is the most frequent in Casmalia, accounting for 49.0% of all households.
Income Bracket
# Households
% Households
Less than $10,000
0
0.0%
$10,000 to $14,999
11
21.6%
$15,000 to $24,999
0
0.0%
$25,000 to $34,999
25
49.0%
$35,000 to $49,999
0
0.0%
$50,000 to $74,999
0
0.0%
$75,000 to $99,999
15
29.4%
$100,000 to $149,999
0
0.0%
$150,000 to $199,999
0
0.0%
$200,000+
0
0.0%
Household Income by Householder Age in Casmalia
Income Bracket
# Households
Median Income
15 to 24 Years
0 (0.0%)
$0
25 to 44 Years
0 (0.0%)
$0
45 to 64 Years
0 (0.0%)
$0
65+ Years
51 (100.0%)
$0
Total
51 (100.0%)
$0
Poverty in Casmalia
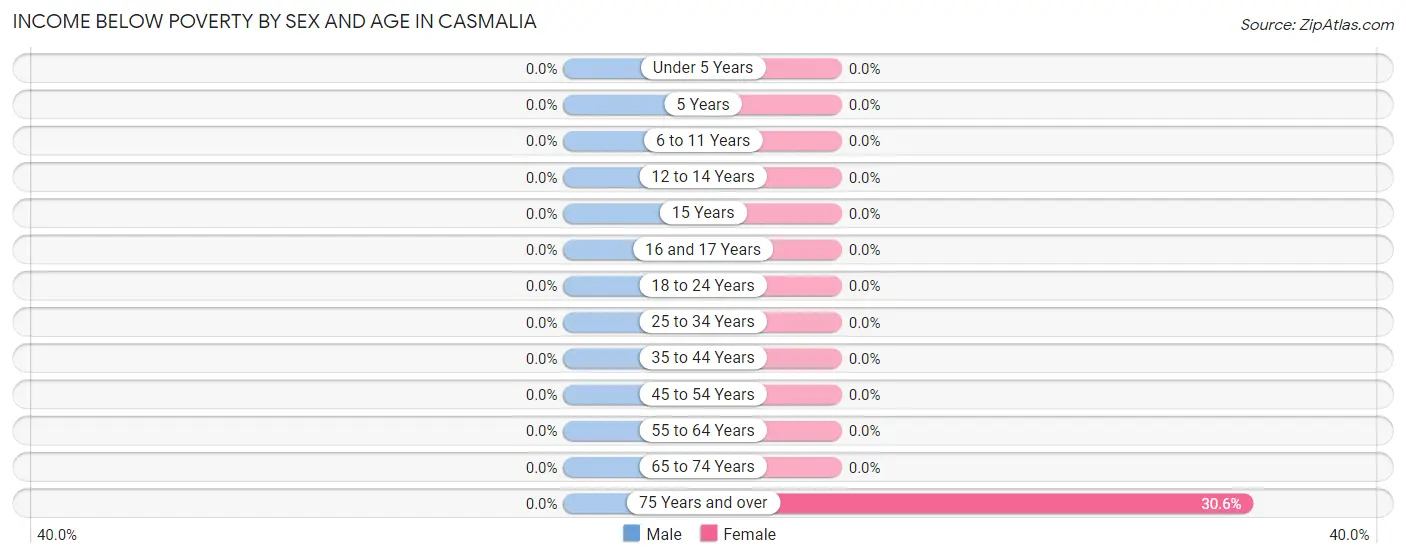
Income Below Poverty by Sex and Age in Casmalia
Age Bracket
Male
Female
Under 5 Years
0 (0.0%)
0 (0.0%)
5 Years
0 (0.0%)
0 (0.0%)
6 to 11 Years
0 (0.0%)
0 (0.0%)
12 to 14 Years
0 (0.0%)
0 (0.0%)
15 Years
0 (0.0%)
0 (0.0%)
16 and 17 Years
0 (0.0%)
0 (0.0%)
18 to 24 Years
0 (0.0%)
0 (0.0%)
25 to 34 Years
0 (0.0%)
0 (0.0%)
35 to 44 Years
0 (0.0%)
0 (0.0%)
45 to 54 Years
0 (0.0%)
0 (0.0%)
55 to 64 Years
0 (0.0%)
0 (0.0%)
65 to 74 Years
0 (0.0%)
0 (0.0%)
75 Years and over
0 (0.0%)
11 (30.6%)
Total
0 (0.0%)
11 (22.5%)
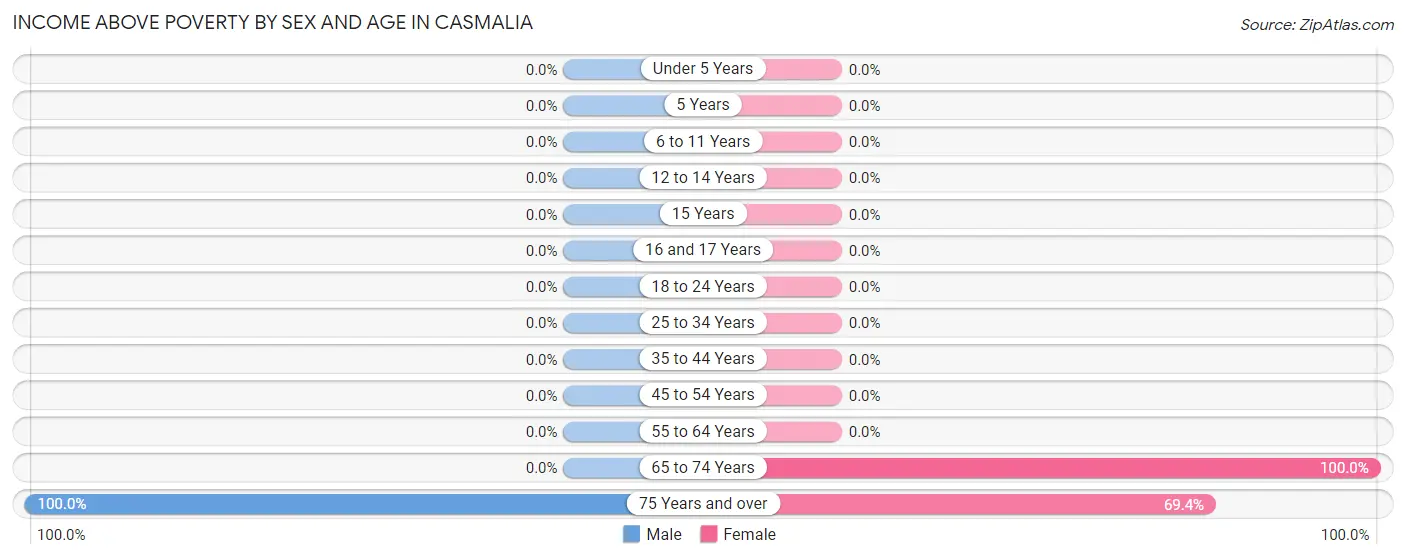
Income Above Poverty by Sex and Age in Casmalia
According to the poverty statistics in Casmalia, males aged 75 years and over and females aged 65 to 74 years are the age groups that are most secure financially, with 100.0% of males and 100.0% of females in these age groups living above the poverty line.
Age Bracket
Male
Female
Under 5 Years
0 (0.0%)
0 (0.0%)
5 Years
0 (0.0%)
0 (0.0%)
6 to 11 Years
0 (0.0%)
0 (0.0%)
12 to 14 Years
0 (0.0%)
0 (0.0%)
15 Years
0 (0.0%)
0 (0.0%)
16 and 17 Years
0 (0.0%)
0 (0.0%)
18 to 24 Years
0 (0.0%)
0 (0.0%)
25 to 34 Years
0 (0.0%)
0 (0.0%)
35 to 44 Years
0 (0.0%)
0 (0.0%)
45 to 54 Years
0 (0.0%)
0 (0.0%)
55 to 64 Years
0 (0.0%)
0 (0.0%)
65 to 74 Years
0 (0.0%)
13 (100.0%)
75 Years and over
15 (100.0%)
25 (69.4%)
Total
15 (100.0%)
38 (77.5%)
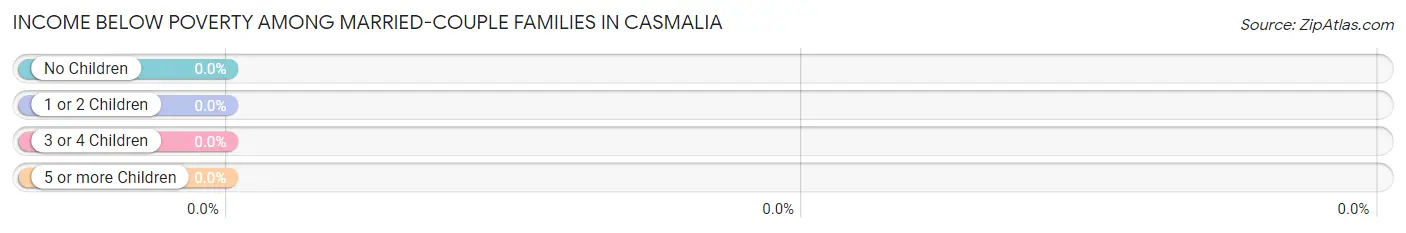
Income Below Poverty Among Married-Couple Families in Casmalia
Children
Above Poverty
Below Poverty
No Children
15 (100.0%)
0 (0.0%)
1 or 2 Children
0 (0.0%)
0 (0.0%)
3 or 4 Children
0 (0.0%)
0 (0.0%)
5 or more Children
0 (0.0%)
0 (0.0%)
Total
15 (100.0%)
0 (0.0%)
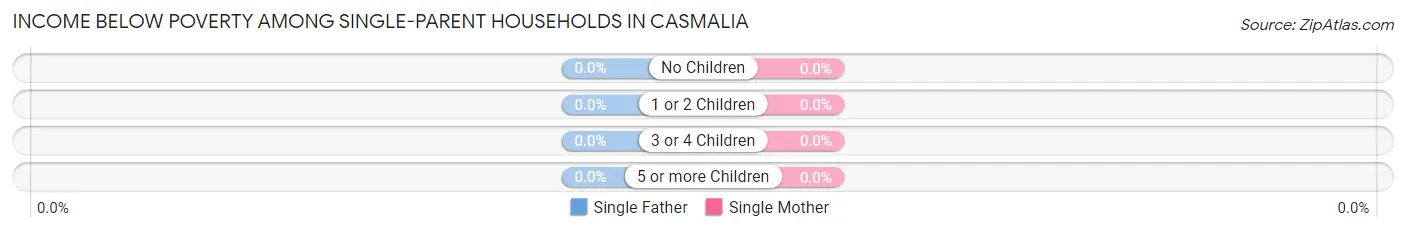
Income Below Poverty Among Single-Parent Households in Casmalia
Children
Single Father
Single Mother
No Children
0 (0.0%)
0 (0.0%)
1 or 2 Children
0 (0.0%)
0 (0.0%)
3 or 4 Children
0 (0.0%)
0 (0.0%)
5 or more Children
0 (0.0%)
0 (0.0%)
Total
0 (0.0%)
0 (0.0%)
Income Below Poverty Among Married-Couple vs Single-Parent Households in Casmalia
Children
Married-Couple Families
Single-Parent Households
No Children
0 (0.0%)
0 (0.0%)
1 or 2 Children
0 (0.0%)
0 (0.0%)
3 or 4 Children
0 (0.0%)
0 (0.0%)
5 or more Children
0 (0.0%)
0 (0.0%)
Total
0 (0.0%)
0 (0.0%)
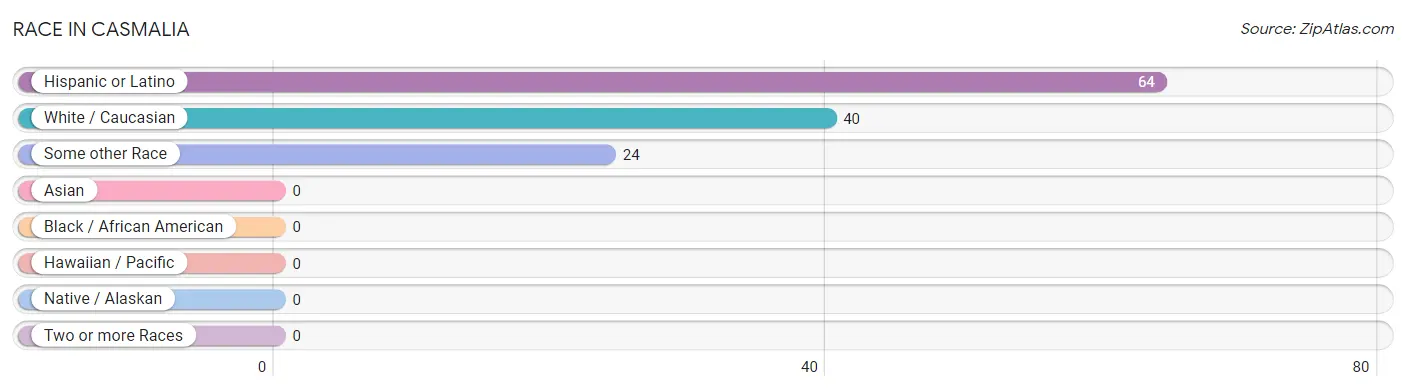
Race in Casmalia
The most populous races in Casmalia are Hispanic or Latino (64 | 100.0%), White / Caucasian (40 | 62.5%), and Some other Race (24 | 37.5%).
Race
# Population
% Population
Asian
0
0.0%
Black / African American
0
0.0%
Hawaiian / Pacific
0
0.0%
Hispanic or Latino
64
100.0%
Native / Alaskan
0
0.0%
White / Caucasian
40
62.5%
Two or more Races
0
0.0%
Some other Race
24
37.5%
Total
64
100.0%
Ancestry in Casmalia
The most populous ancestries reported in Casmalia are , and Mexican (36 | 56.2%), together accounting for 56.2% of all Casmalia residents.
Ancestry
# Population
% Population
Mexican
36
56.2%
View All 1 Rows
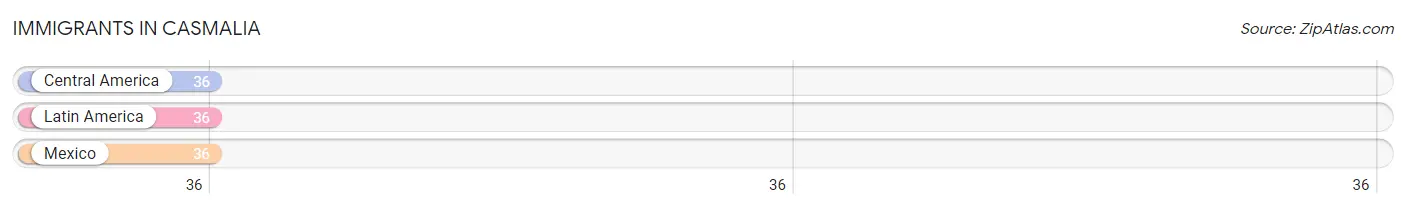
Immigrants in Casmalia
The most numerous immigrant groups reported in Casmalia came from Central America (36 | 56.2%), Latin America (36 | 56.2%), and Mexico (36 | 56.2%), together accounting for 168.8% of all Casmalia residents.
Immigration Origin
# Population
% Population
Central America
36
56.2%
Latin America
36
56.2%
Mexico
36
56.2%
View All 3 Rows
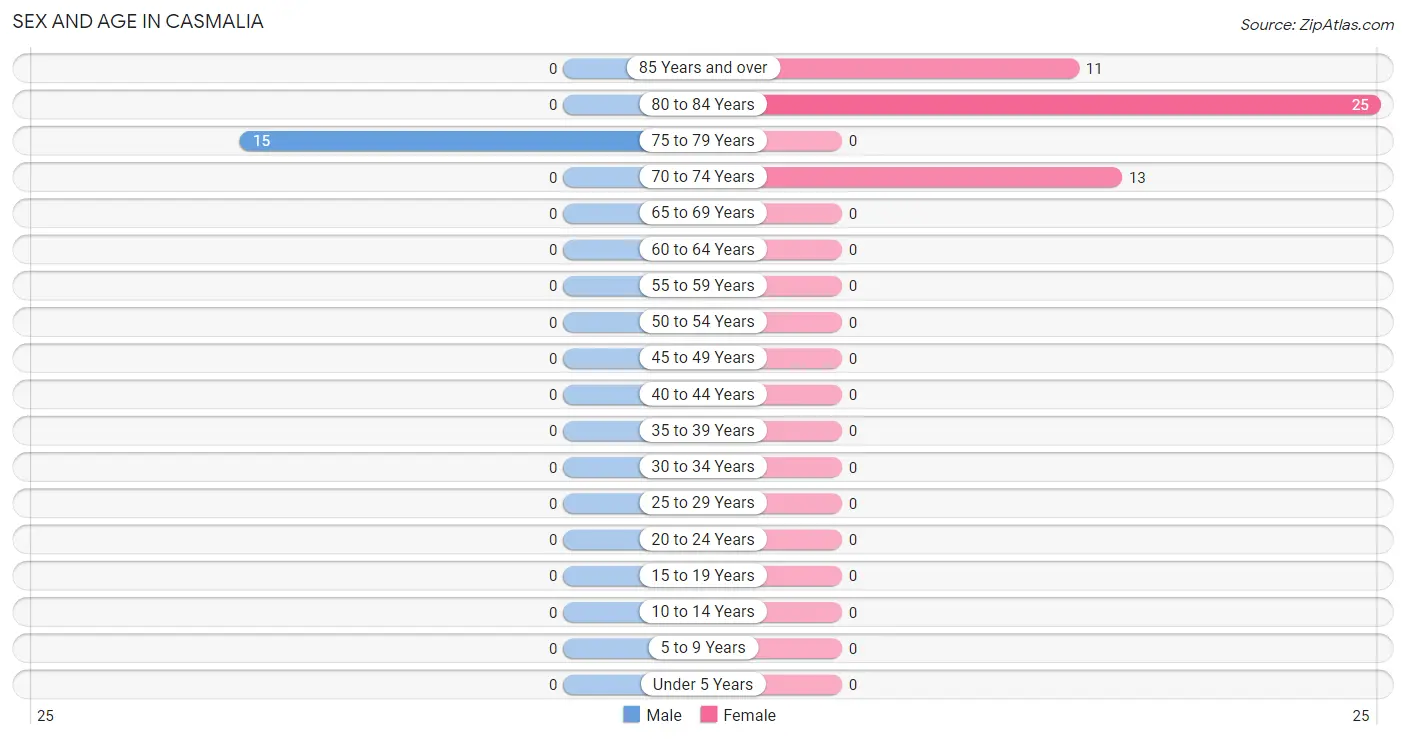
Sex and Age in Casmalia
Sex and Age in Casmalia
The most populous age groups in Casmalia are 75 to 79 Years (15 | 100.0%) for men and 80 to 84 Years (25 | 51.0%) for women.
Age Bracket
Male
Female
Under 5 Years
0 (0.0%)
0 (0.0%)
5 to 9 Years
0 (0.0%)
0 (0.0%)
10 to 14 Years
0 (0.0%)
0 (0.0%)
15 to 19 Years
0 (0.0%)
0 (0.0%)
20 to 24 Years
0 (0.0%)
0 (0.0%)
25 to 29 Years
0 (0.0%)
0 (0.0%)
30 to 34 Years
0 (0.0%)
0 (0.0%)
35 to 39 Years
0 (0.0%)
0 (0.0%)
40 to 44 Years
0 (0.0%)
0 (0.0%)
45 to 49 Years
0 (0.0%)
0 (0.0%)
50 to 54 Years
0 (0.0%)
0 (0.0%)
55 to 59 Years
0 (0.0%)
0 (0.0%)
60 to 64 Years
0 (0.0%)
0 (0.0%)
65 to 69 Years
0 (0.0%)
0 (0.0%)
70 to 74 Years
0 (0.0%)
13 (26.5%)
75 to 79 Years
15 (100.0%)
0 (0.0%)
80 to 84 Years
0 (0.0%)
25 (51.0%)
85 Years and over
0 (0.0%)
11 (22.5%)
Total
15 (100.0%)
49 (100.0%)
Families and Households in Casmalia
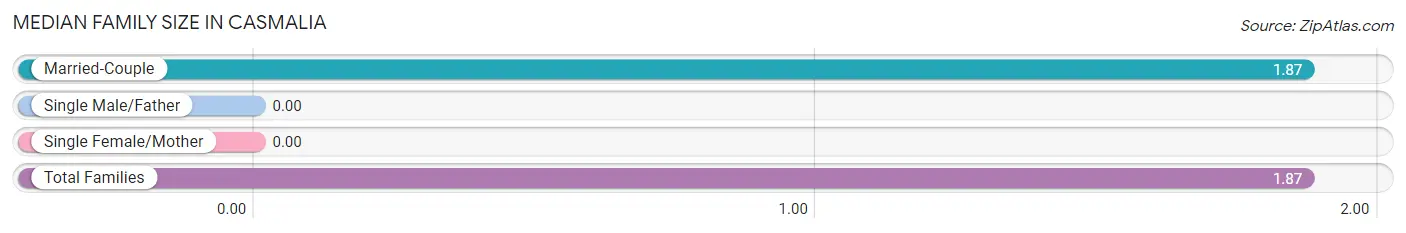
Median Family Size in Casmalia
Family Type
# Families
Family Size
Married-Couple
15 (100.0%)
1.87
Single Male/Father
0 (0.0%)
-
Single Female/Mother
0 (0.0%)
-
Total Families
15 (100.0%)
1.87
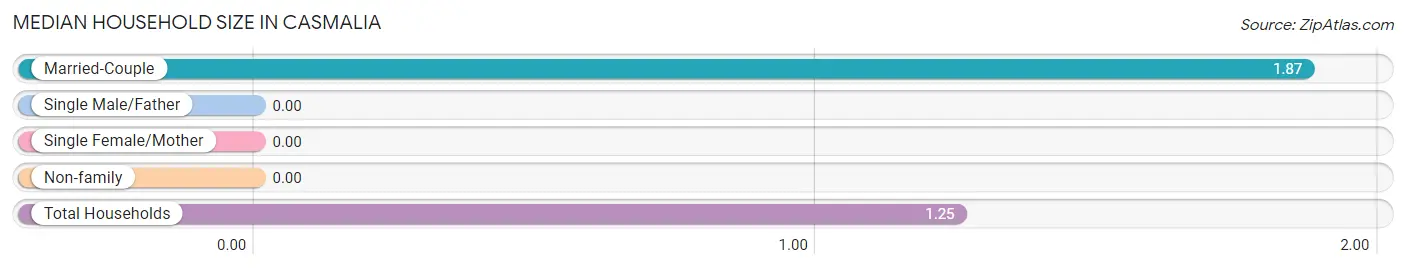
Median Household Size in Casmalia
Household Type
# Households
Household Size
Married-Couple
15 (29.4%)
1.87
Single Male/Father
0 (0.0%)
-
Single Female/Mother
0 (0.0%)
-
Non-family
36 (70.6%)
-
Total Households
51 (100.0%)
1.25
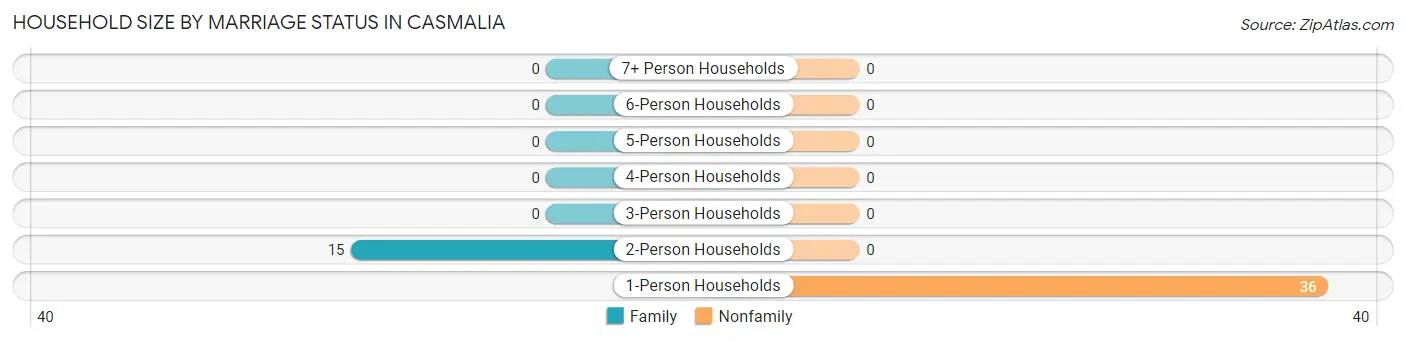
Household Size by Marriage Status in Casmalia
Out of a total of 51 households in Casmalia, 15 (29.4%) are family households, while 36 (70.6%) are nonfamily households. The most numerous type of family households are 2-person households, comprising 15, and the most common type of nonfamily households are 1-person households, comprising 36.
Household Size
Family Households
Nonfamily Households
1-Person Households
-
36 (70.6%)
2-Person Households
15 (29.4%)
0 (0.0%)
3-Person Households
0 (0.0%)
0 (0.0%)
4-Person Households
0 (0.0%)
0 (0.0%)
5-Person Households
0 (0.0%)
0 (0.0%)
6-Person Households
0 (0.0%)
0 (0.0%)
7+ Person Households
0 (0.0%)
0 (0.0%)
Total
15 (29.4%)
36 (70.6%)
Female Fertility in Casmalia
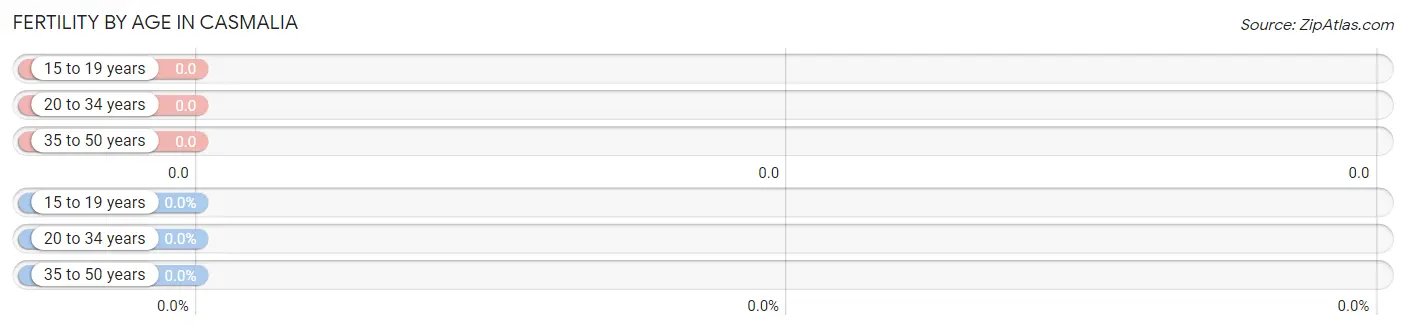
Fertility by Age in Casmalia
Age Bracket
Women with Births
Births / 1,000 Women
15 to 19 years
0 (0.0%)
0.0
20 to 34 years
0 (0.0%)
0.0
35 to 50 years
0 (0.0%)
0.0
Total
0 (0.0%)
0.0
Fertility by Age by Marriage Status in Casmalia
Age Bracket
Married
Unmarried
15 to 19 years
0 (0.0%)
0 (0.0%)
20 to 34 years
0 (0.0%)
0 (0.0%)
35 to 50 years
0 (0.0%)
0 (0.0%)
Total
0 (0.0%)
0 (0.0%)
Fertility by Education in Casmalia
Educational Attainment
Women with Births
Births / 1,000 Women
Less than High School
0 (0.0%)
0.0
High School Diploma
0 (0.0%)
0.0
College or Associate's Degree
0 (0.0%)
0.0
Bachelor's Degree
0 (0.0%)
0.0
Graduate Degree
0 (0.0%)
0.0
Total
0 (0.0%)
0.0
Fertility by Education by Marriage Status in Casmalia
Educational Attainment
Married
Unmarried
Less than High School
0 (0.0%)
0 (0.0%)
High School Diploma
0 (0.0%)
0 (0.0%)
College or Associate's Degree
0 (0.0%)
0 (0.0%)
Bachelor's Degree
0 (0.0%)
0 (0.0%)
Graduate Degree
0 (0.0%)
0 (0.0%)
Total
0 (0.0%)
0 (0.0%)
Employment Characteristics in Casmalia
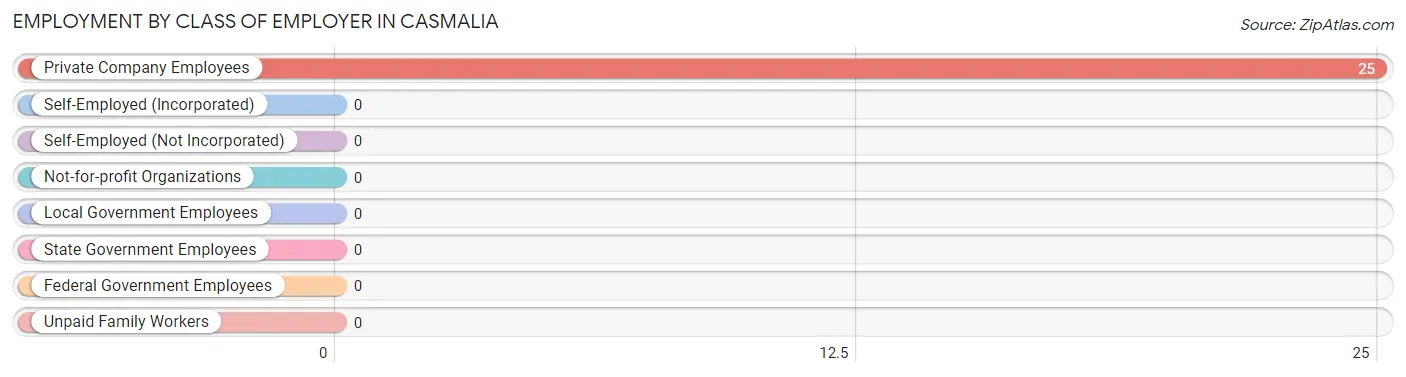
Employment by Class of Employer in Casmalia
Among the 25 employed individuals in Casmalia, , and private company employees (25 | 100.0%) make up the most common classes of employment.
Employer Class
# Employees
% Employees
Private Company Employees
25
100.0%
Self-Employed (Incorporated)
0
0.0%
Self-Employed (Not Incorporated)
0
0.0%
Not-for-profit Organizations
0
0.0%
Local Government Employees
0
0.0%
State Government Employees
0
0.0%
Federal Government Employees
0
0.0%
Unpaid Family Workers
0
0.0%
Total
25
100.0%
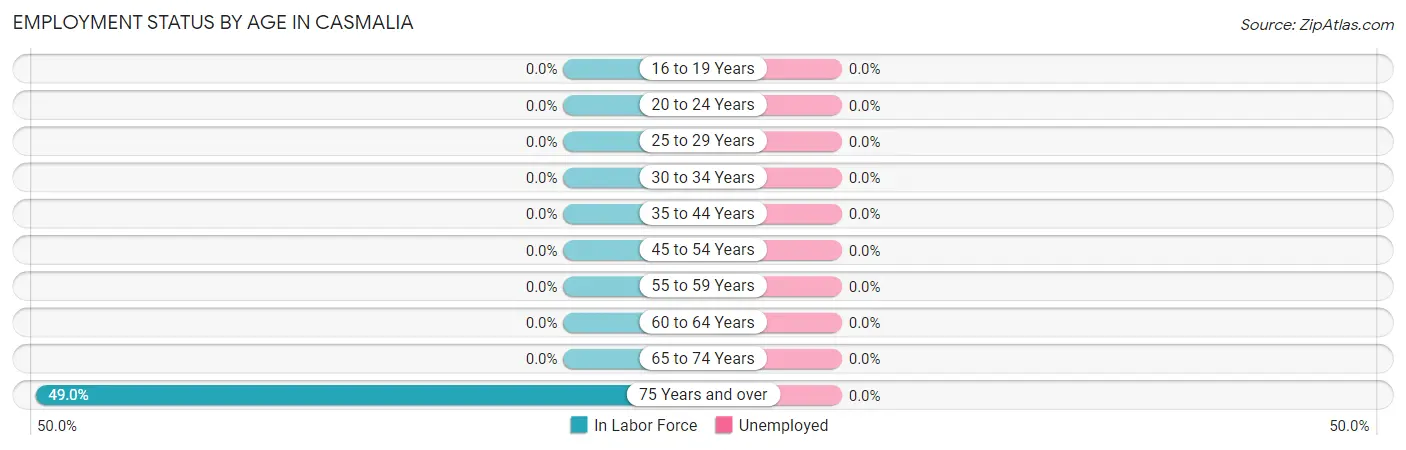
Employment Status by Age in Casmalia
Age Bracket
In Labor Force
Unemployed
16 to 19 Years
0 (0.0%)
0 (0.0%)
20 to 24 Years
0 (0.0%)
0 (0.0%)
25 to 29 Years
0 (0.0%)
0 (0.0%)
30 to 34 Years
0 (0.0%)
0 (0.0%)
35 to 44 Years
0 (0.0%)
0 (0.0%)
45 to 54 Years
0 (0.0%)
0 (0.0%)
55 to 59 Years
0 (0.0%)
0 (0.0%)
60 to 64 Years
0 (0.0%)
0 (0.0%)
65 to 74 Years
0 (0.0%)
0 (0.0%)
75 Years and over
25 (49.0%)
0 (0.0%)
Total
25 (39.1%)
0 (0.0%)
Employment Status by Educational Attainment in Casmalia
Educational Attainment
In Labor Force
Unemployed
Less than High School
0 (0.0%)
0 (0.0%)
High School Diploma
0 (0.0%)
0 (0.0%)
College / Associate Degree
0 (0.0%)
0 (0.0%)
Bachelor's Degree or higher
0 (0.0%)
0 (0.0%)
Total
0 (0.0%)
0 (0.0%)
Employment Occupations by Sex in Casmalia
Management, Business, Science and Arts Occupations
Management, Business, Science and Arts Occupations by Sex
Occupation
Male
Female
Management
0 (0.0%)
0 (0.0%)
Business & Financial
0 (0.0%)
0 (0.0%)
Computers, Engineering & Science
0 (0.0%)
0 (0.0%)
Computers & Mathematics
0 (0.0%)
0 (0.0%)
Architecture & Engineering
0 (0.0%)
0 (0.0%)
Life, Physical & Social Science
0 (0.0%)
0 (0.0%)
Community & Social Service
0 (0.0%)
0 (0.0%)
Education, Arts & Media
0 (0.0%)
0 (0.0%)
Legal Services & Support
0 (0.0%)
0 (0.0%)
Education Instruction & Library
0 (0.0%)
0 (0.0%)
Arts, Media & Entertainment
0 (0.0%)
0 (0.0%)
Health Diagnosing & Treating
0 (0.0%)
0 (0.0%)
Health Technologists
0 (0.0%)
0 (0.0%)
Total (Category)
0 (0.0%)
0 (0.0%)
Total (Overall)
0 (0.0%)
25 (100.0%)
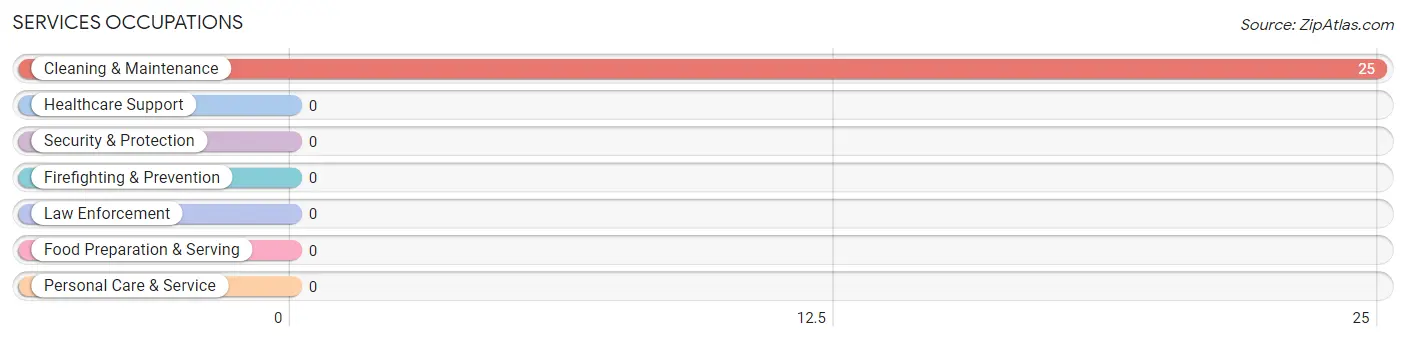
Services Occupations
The most common Services occupations in Casmalia are , and Cleaning & Maintenance (25 | 100.0%).
Services Occupations by Sex
Occupation
Male
Female
Healthcare Support
0 (0.0%)
0 (0.0%)
Security & Protection
0 (0.0%)
0 (0.0%)
Firefighting & Prevention
0 (0.0%)
0 (0.0%)
Law Enforcement
0 (0.0%)
0 (0.0%)
Food Preparation & Serving
0 (0.0%)
0 (0.0%)
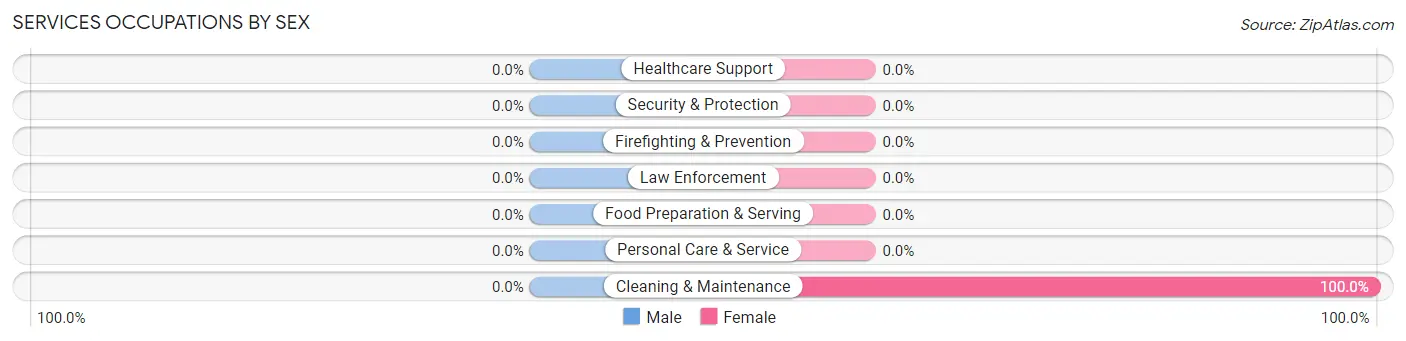
Cleaning & Maintenance
0 (0.0%)
25 (100.0%)
Personal Care & Service
0 (0.0%)
0 (0.0%)
Total (Category)
0 (0.0%)
25 (100.0%)
Total (Overall)
0 (0.0%)
25 (100.0%)
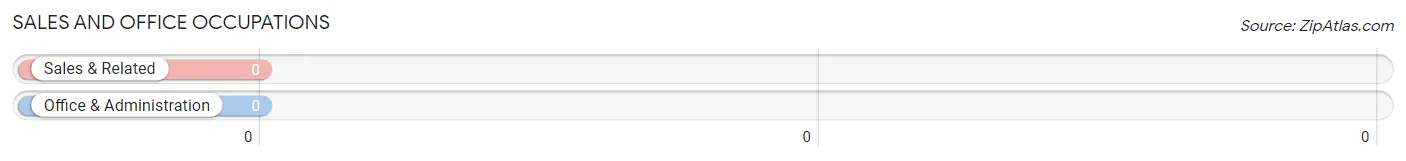
Sales and Office Occupations
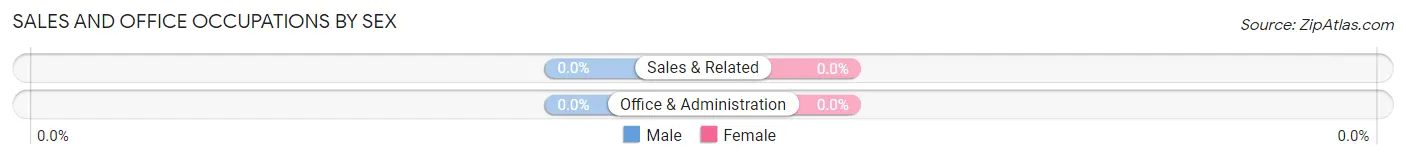
Sales and Office Occupations by Sex
Occupation
Male
Female
Sales & Related
0 (0.0%)
0 (0.0%)
Office & Administration
0 (0.0%)
0 (0.0%)
Total (Category)
0 (0.0%)
0 (0.0%)
Total (Overall)
0 (0.0%)
25 (100.0%)
Natural Resources, Construction and Maintenance Occupations
Natural Resources, Construction and Maintenance Occupations by Sex
Occupation
Male
Female
Farming, Fishing & Forestry
0 (0.0%)
0 (0.0%)
Construction & Extraction
0 (0.0%)
0 (0.0%)
Installation, Maintenance & Repair
0 (0.0%)
0 (0.0%)
Total (Category)
0 (0.0%)
0 (0.0%)
Total (Overall)
0 (0.0%)
25 (100.0%)
Production, Transportation and Moving Occupations
Production, Transportation and Moving Occupations by Sex
Occupation
Male
Female
Production
0 (0.0%)
0 (0.0%)
Transportation
0 (0.0%)
0 (0.0%)
Material Moving
0 (0.0%)
0 (0.0%)
Total (Category)
0 (0.0%)
0 (0.0%)
Total (Overall)
0 (0.0%)
25 (100.0%)
Employment Industries by Sex in Casmalia
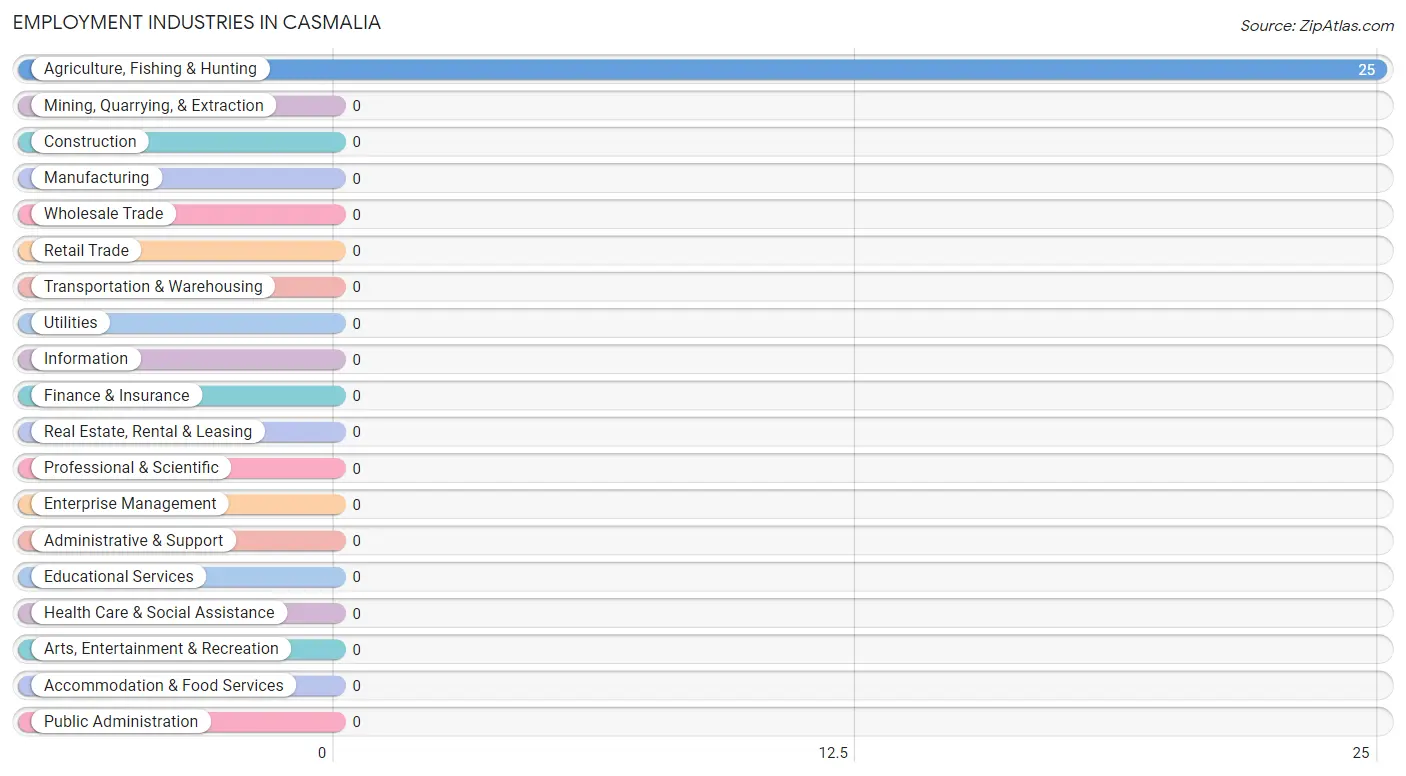
Employment Industries in Casmalia
The major employment industries in Casmalia include , and Agriculture, Fishing & Hunting (25 | 100.0%).
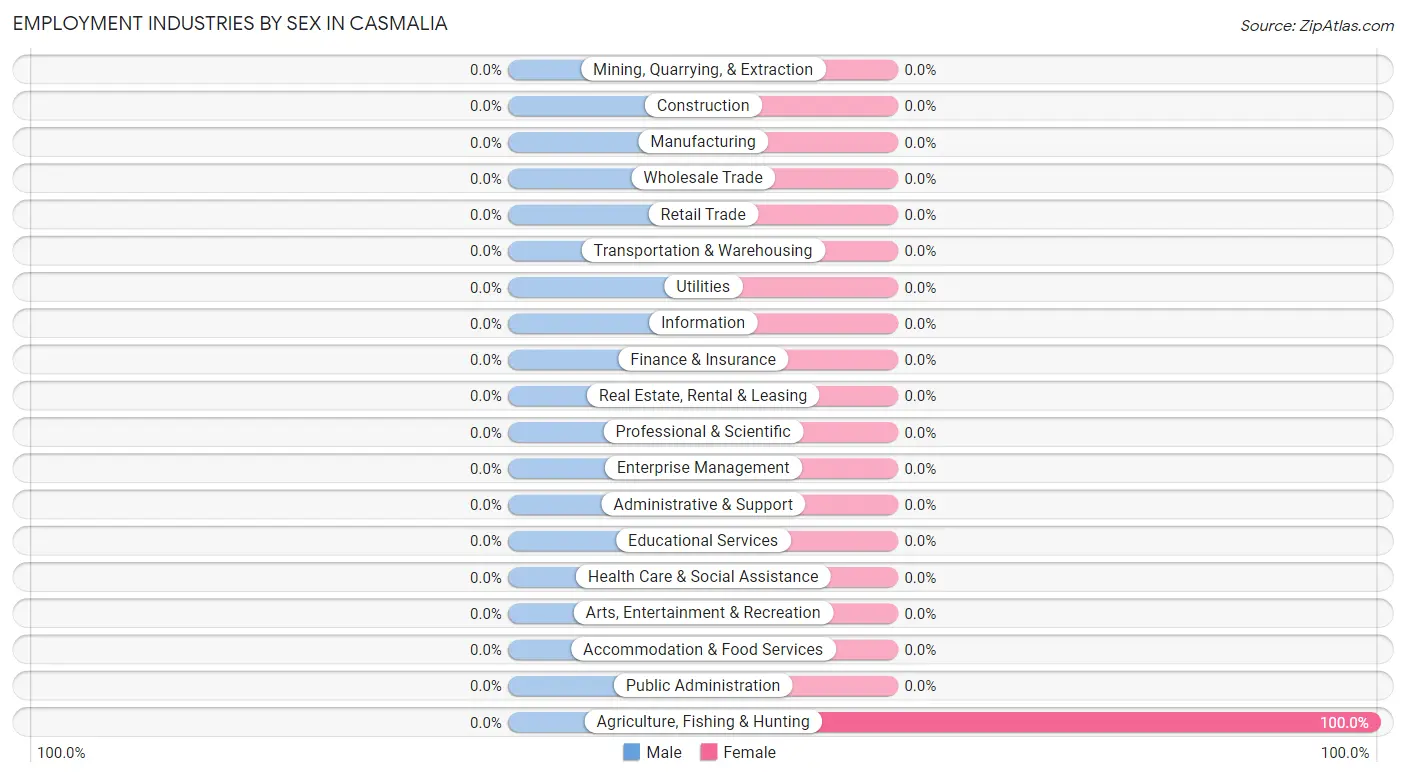
Employment Industries by Sex in Casmalia
Industry
Male
Female
Agriculture, Fishing & Hunting
0 (0.0%)
25 (100.0%)
Mining, Quarrying, & Extraction
0 (0.0%)
0 (0.0%)
Construction
0 (0.0%)
0 (0.0%)
Manufacturing
0 (0.0%)
0 (0.0%)
Wholesale Trade
0 (0.0%)
0 (0.0%)
Retail Trade
0 (0.0%)
0 (0.0%)
Transportation & Warehousing
0 (0.0%)
0 (0.0%)
Utilities
0 (0.0%)
0 (0.0%)
Information
0 (0.0%)
0 (0.0%)
Finance & Insurance
0 (0.0%)
0 (0.0%)
Real Estate, Rental & Leasing
0 (0.0%)
0 (0.0%)
Professional & Scientific
0 (0.0%)
0 (0.0%)
Enterprise Management
0 (0.0%)
0 (0.0%)
Administrative & Support
0 (0.0%)
0 (0.0%)
Educational Services
0 (0.0%)
0 (0.0%)
Health Care & Social Assistance
0 (0.0%)
0 (0.0%)
Arts, Entertainment & Recreation
0 (0.0%)
0 (0.0%)
Accommodation & Food Services
0 (0.0%)
0 (0.0%)
Public Administration
0 (0.0%)
0 (0.0%)
Total
0 (0.0%)
25 (100.0%)
Education in Casmalia
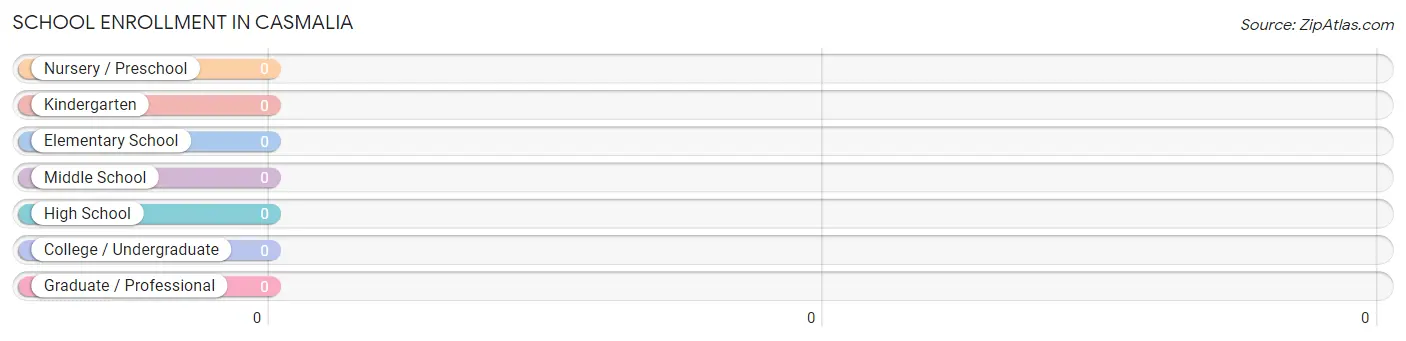
School Enrollment in Casmalia
School Level
# Students
% Students
Nursery / Preschool
0
0.0%
Kindergarten
0
0.0%
Elementary School
0
0.0%
Middle School
0
0.0%
High School
0
0.0%
College / Undergraduate
0
0.0%
Graduate / Professional
0
0.0%
Total
0
0.0%
School Enrollment by Age by Funding Source in Casmalia
Age Bracket
Public School
Private School
3 to 4 Year Olds
0 (0.0%)
0 (0.0%)
5 to 9 Year Old
0 (0.0%)
0 (0.0%)
10 to 14 Year Olds
0 (0.0%)
0 (0.0%)
15 to 17 Year Olds
0 (0.0%)
0 (0.0%)
18 to 19 Year Olds
0 (0.0%)
0 (0.0%)
20 to 24 Year Olds
0 (0.0%)
0 (0.0%)
25 to 34 Year Olds
0 (0.0%)
0 (0.0%)
35 Years and over
0 (0.0%)
0 (0.0%)
Total
0 (0.0%)
0 (0.0%)
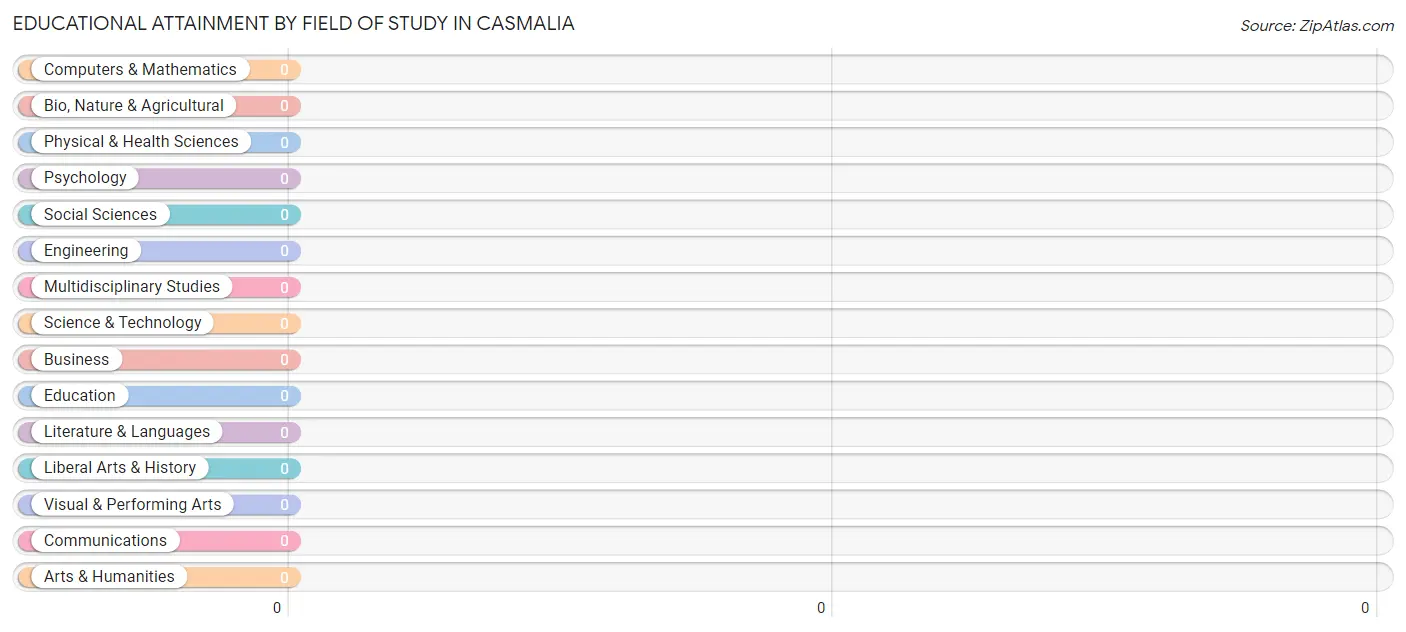
Educational Attainment by Field of Study in Casmalia
Field of Study
# Graduates
% Graduates
Computers & Mathematics
0
0.0%
Bio, Nature & Agricultural
0
0.0%
Physical & Health Sciences
0
0.0%
Psychology
0
0.0%
Social Sciences
0
0.0%
Engineering
0
0.0%
Multidisciplinary Studies
0
0.0%
Science & Technology
0
0.0%
Business
0
0.0%
Education
0
0.0%
Literature & Languages
0
0.0%
Liberal Arts & History
0
0.0%
Visual & Performing Arts
0
0.0%
Communications
0
0.0%
Arts & Humanities
0
0.0%
Total
0
0.0%
Transportation & Commute in Casmalia
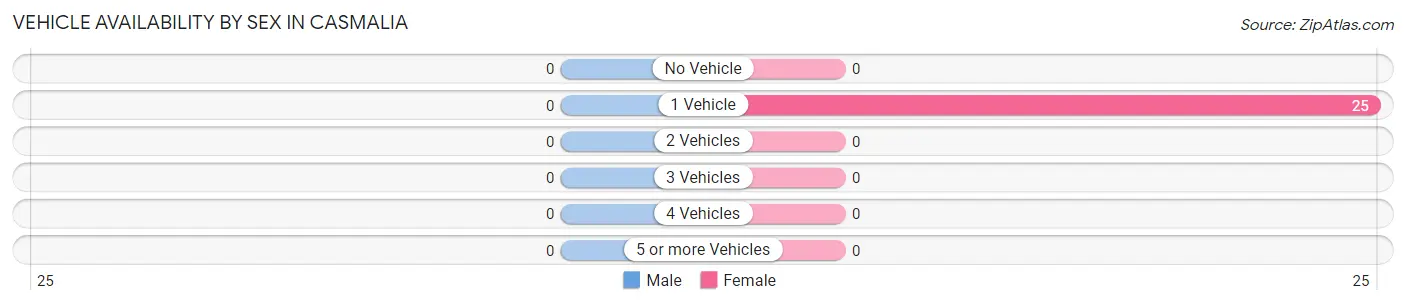
Vehicle Availability by Sex in Casmalia
Vehicles Available
Male
Female
No Vehicle
0 (0.0%)
0 (0.0%)
1 Vehicle
0 (0.0%)
25 (100.0%)
2 Vehicles
0 (0.0%)
0 (0.0%)
3 Vehicles
0 (0.0%)
0 (0.0%)
4 Vehicles
0 (0.0%)
0 (0.0%)
5 or more Vehicles
0 (0.0%)
0 (0.0%)
Total
0 (0.0%)
25 (100.0%)
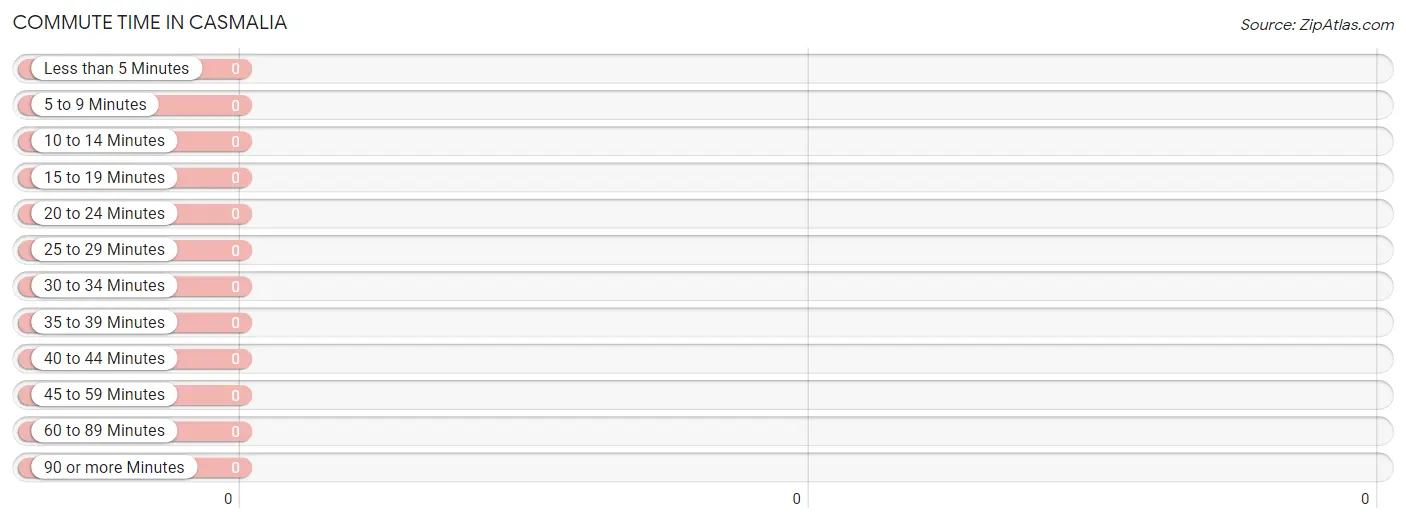
Commute Time in Casmalia
Commute Time
# Commuters
% Commuters
Less than 5 Minutes
0
0.0%
5 to 9 Minutes
0
0.0%
10 to 14 Minutes
0
0.0%
15 to 19 Minutes
0
0.0%
20 to 24 Minutes
0
0.0%
25 to 29 Minutes
0
0.0%
30 to 34 Minutes
0
0.0%
35 to 39 Minutes
0
0.0%
40 to 44 Minutes
0
0.0%
45 to 59 Minutes
0
0.0%
60 to 89 Minutes
0
0.0%
90 or more Minutes
0
0.0%
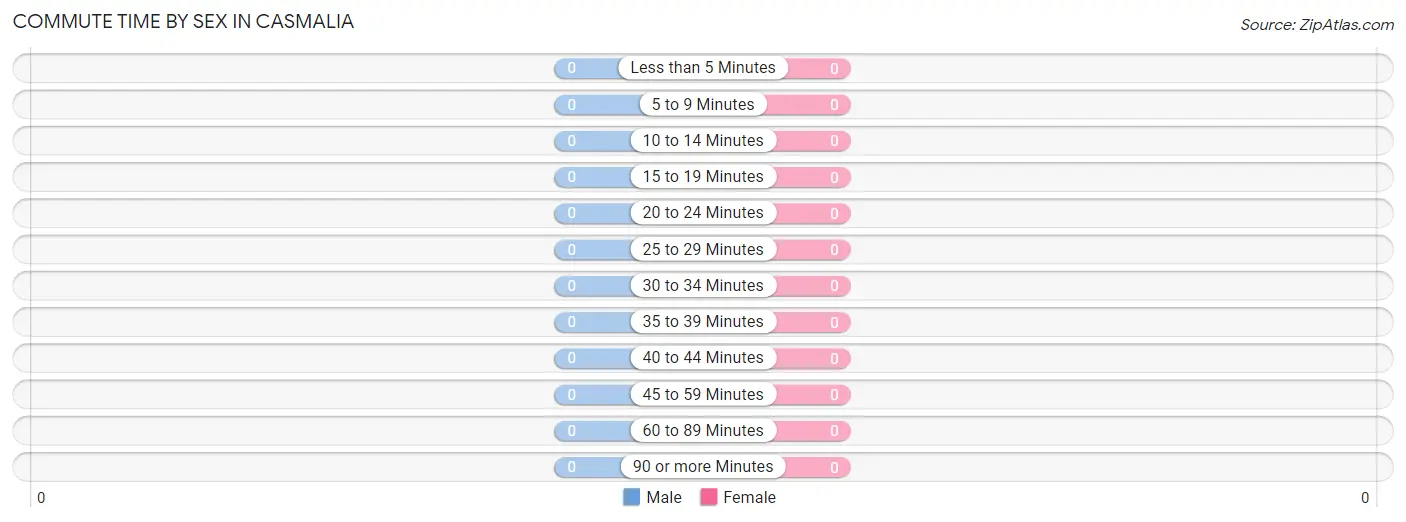
Commute Time by Sex in Casmalia
Commute Time
Male
Female
Less than 5 Minutes
0 (0.0%)
0 (0.0%)
5 to 9 Minutes
0 (0.0%)
0 (0.0%)
10 to 14 Minutes
0 (0.0%)
0 (0.0%)
15 to 19 Minutes
0 (0.0%)
0 (0.0%)
20 to 24 Minutes
0 (0.0%)
0 (0.0%)
25 to 29 Minutes
0 (0.0%)
0 (0.0%)
30 to 34 Minutes
0 (0.0%)
0 (0.0%)
35 to 39 Minutes
0 (0.0%)
0 (0.0%)
40 to 44 Minutes
0 (0.0%)
0 (0.0%)
45 to 59 Minutes
0 (0.0%)
0 (0.0%)
60 to 89 Minutes
0 (0.0%)
0 (0.0%)
90 or more Minutes
0 (0.0%)
0 (0.0%)
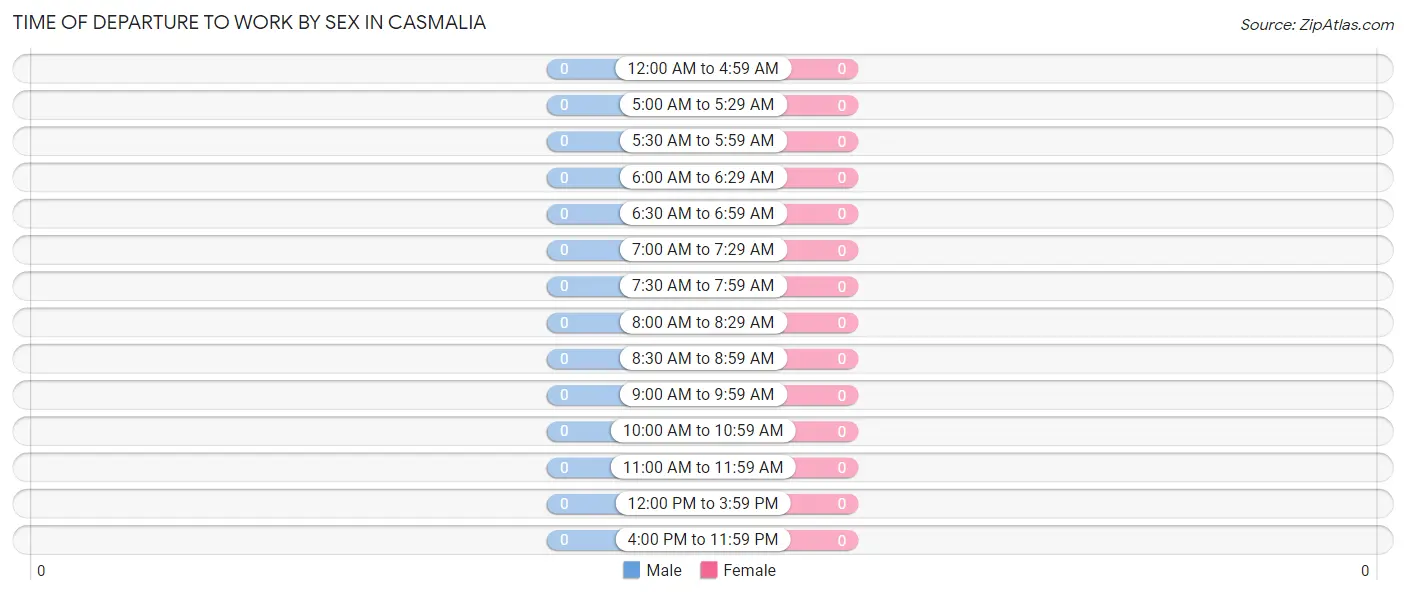
Time of Departure to Work by Sex in Casmalia
Time of Departure
Male
Female
12:00 AM to 4:59 AM
0 (0.0%)
0 (0.0%)
5:00 AM to 5:29 AM
0 (0.0%)
0 (0.0%)
5:30 AM to 5:59 AM
0 (0.0%)
0 (0.0%)
6:00 AM to 6:29 AM
0 (0.0%)
0 (0.0%)
6:30 AM to 6:59 AM
0 (0.0%)
0 (0.0%)
7:00 AM to 7:29 AM
0 (0.0%)
0 (0.0%)
7:30 AM to 7:59 AM
0 (0.0%)
0 (0.0%)
8:00 AM to 8:29 AM
0 (0.0%)
0 (0.0%)
8:30 AM to 8:59 AM
0 (0.0%)
0 (0.0%)
9:00 AM to 9:59 AM
0 (0.0%)
0 (0.0%)
10:00 AM to 10:59 AM
0 (0.0%)
0 (0.0%)
11:00 AM to 11:59 AM
0 (0.0%)
0 (0.0%)
12:00 PM to 3:59 PM
0 (0.0%)
0 (0.0%)
4:00 PM to 11:59 PM
0 (0.0%)
0 (0.0%)
Total
0 (0.0%)
0 (0.0%)
Housing Occupancy in Casmalia
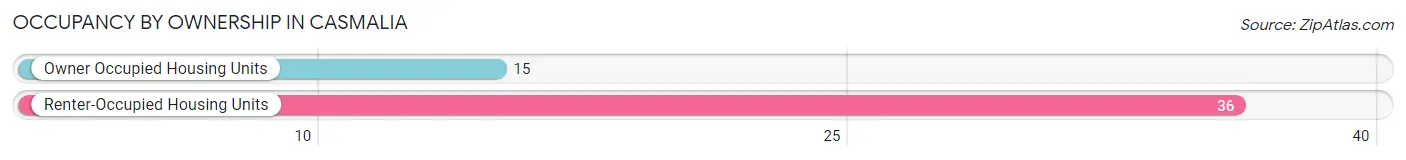
Occupancy by Ownership in Casmalia
Of the total 51 dwellings in Casmalia, owner-occupied units account for 15 (29.4%), while renter-occupied units make up 36 (70.6%).
Occupancy
# Housing Units
% Housing Units
Owner Occupied Housing Units
15
29.4%
Renter-Occupied Housing Units
36
70.6%
Total Occupied Housing Units
51
100.0%
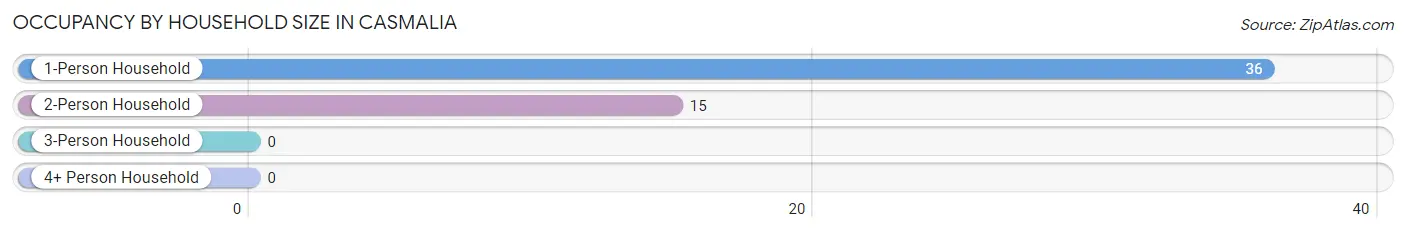
Occupancy by Household Size in Casmalia
Household Size
# Housing Units
% Housing Units
1-Person Household
36
70.6%
2-Person Household
15
29.4%
3-Person Household
0
0.0%
4+ Person Household
0
0.0%
Total Housing Units
51
100.0%
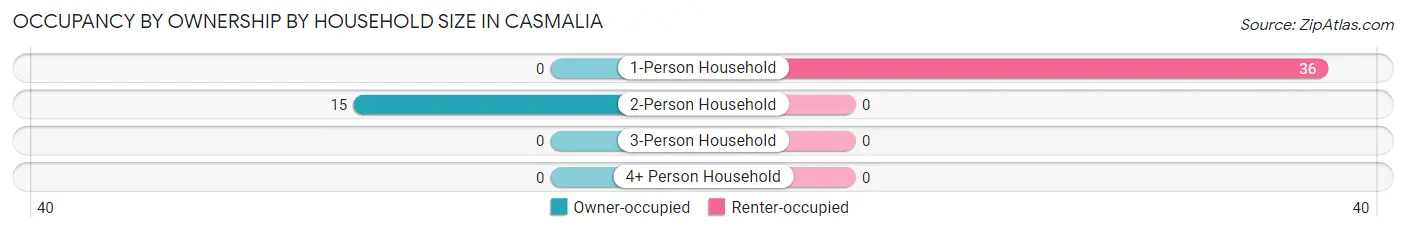
Occupancy by Ownership by Household Size in Casmalia
Household Size
Owner-occupied
Renter-occupied
1-Person Household
0 (0.0%)
36 (100.0%)
2-Person Household
15 (100.0%)
0 (0.0%)
3-Person Household
0 (0.0%)
0 (0.0%)
4+ Person Household
0 (0.0%)
0 (0.0%)
Total Housing Units
15 (29.4%)
36 (70.6%)
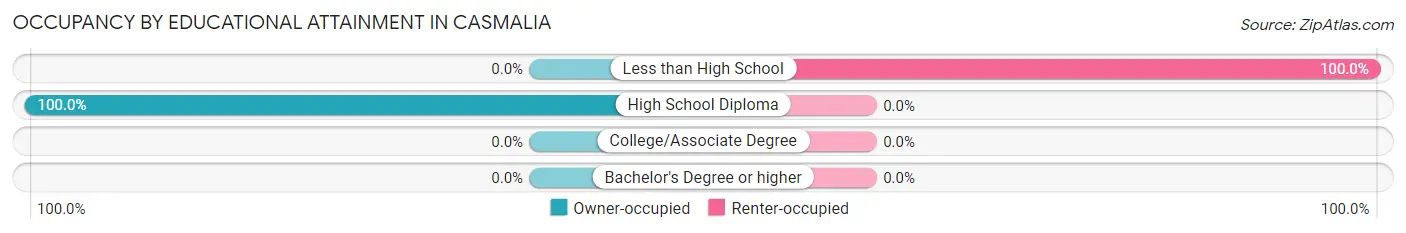
Occupancy by Educational Attainment in Casmalia
Household Size
Owner-occupied
Renter-occupied
Less than High School
0 (0.0%)
36 (100.0%)
High School Diploma
15 (100.0%)
0 (0.0%)
College/Associate Degree
0 (0.0%)
0 (0.0%)
Bachelor's Degree or higher
0 (0.0%)
0 (0.0%)
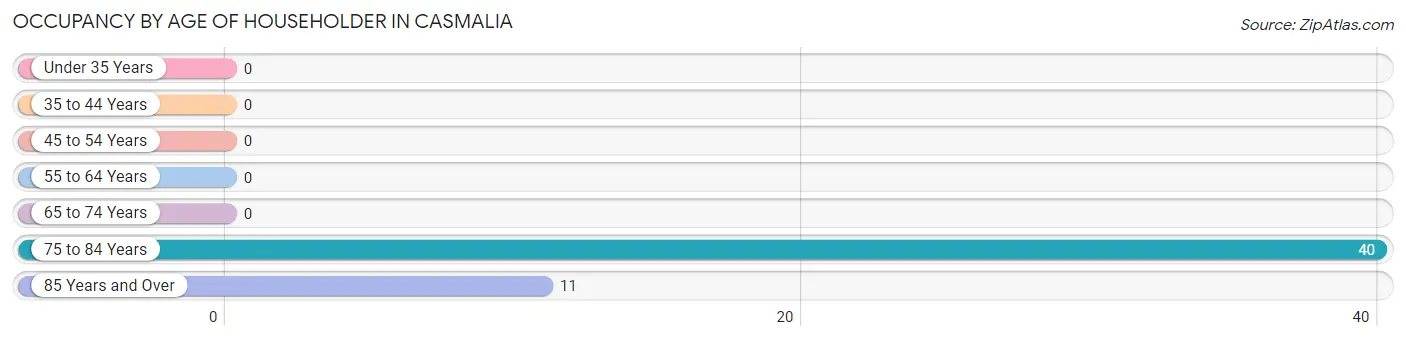
Occupancy by Age of Householder in Casmalia
Age Bracket
# Households
% Households
Under 35 Years
0
0.0%
35 to 44 Years
0
0.0%
45 to 54 Years
0
0.0%
55 to 64 Years
0
0.0%
65 to 74 Years
0
0.0%
75 to 84 Years
40
78.4%
85 Years and Over
11
21.6%
Total
51
100.0%
Housing Finances in Casmalia
Median Income by Occupancy in Casmalia
Occupancy Type
# Households
Median Income
Owner-Occupied
15 (29.4%)
$0
Renter-Occupied
36 (70.6%)
$0
Average
51 (100.0%)
$0
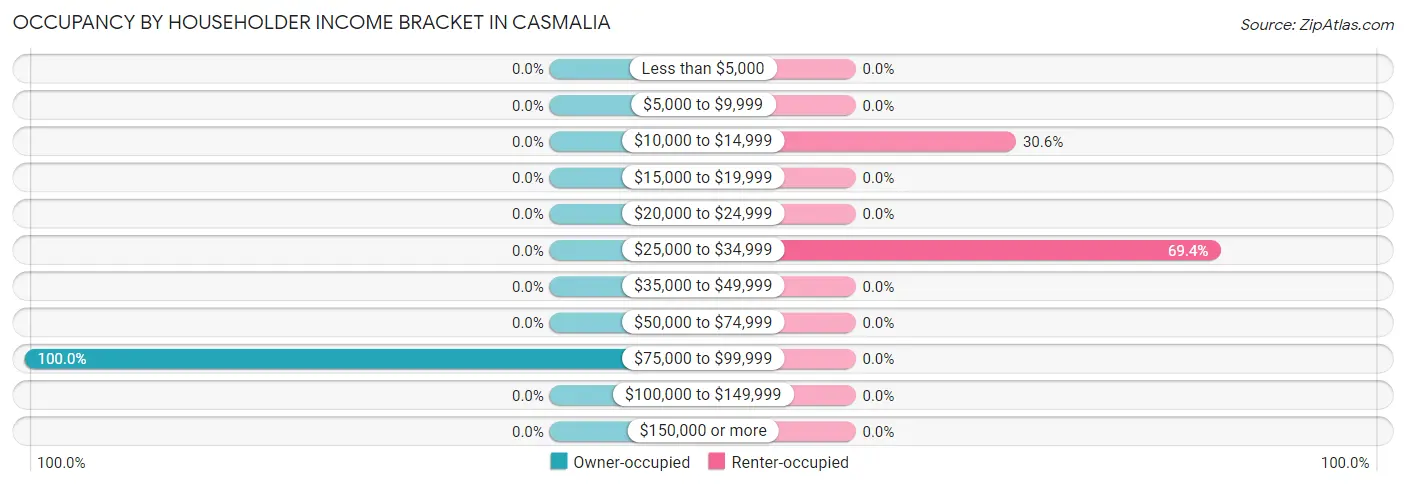
Occupancy by Householder Income Bracket in Casmalia
Income Bracket
Owner-occupied
Renter-occupied
Less than $5,000
0 (0.0%)
0 (0.0%)
$5,000 to $9,999
0 (0.0%)
0 (0.0%)
$10,000 to $14,999
0 (0.0%)
11 (30.6%)
$15,000 to $19,999
0 (0.0%)
0 (0.0%)
$20,000 to $24,999
0 (0.0%)
0 (0.0%)
$25,000 to $34,999
0 (0.0%)
25 (69.4%)
$35,000 to $49,999
0 (0.0%)
0 (0.0%)
$50,000 to $74,999
0 (0.0%)
0 (0.0%)
$75,000 to $99,999
15 (100.0%)
0 (0.0%)
$100,000 to $149,999
0 (0.0%)
0 (0.0%)
$150,000 or more
0 (0.0%)
0 (0.0%)
Total
15 (100.0%)
36 (100.0%)
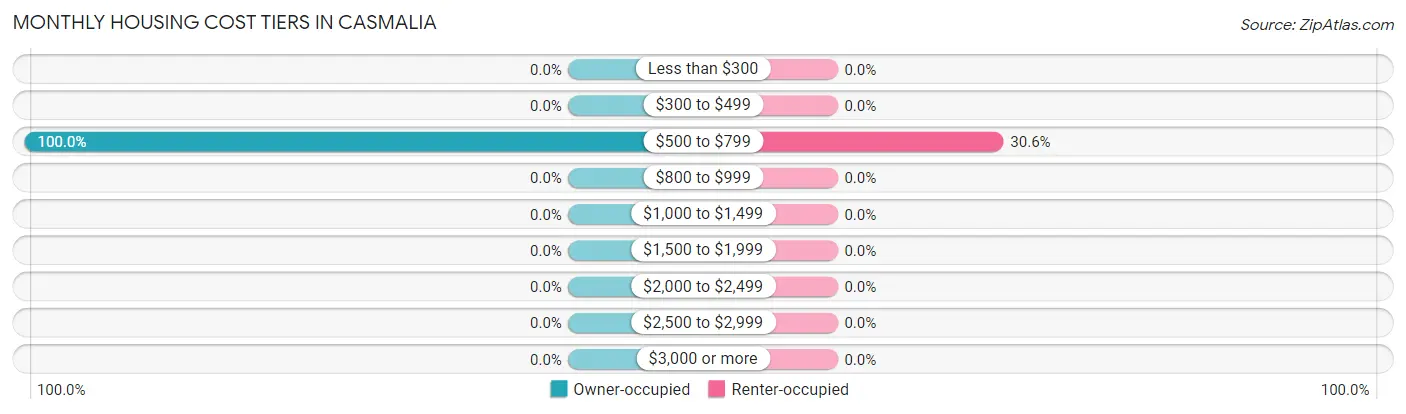
Monthly Housing Cost Tiers in Casmalia
Monthly Cost
Owner-occupied
Renter-occupied
Less than $300
0 (0.0%)
0 (0.0%)
$300 to $499
0 (0.0%)
0 (0.0%)
$500 to $799
15 (100.0%)
11 (30.6%)
$800 to $999
0 (0.0%)
0 (0.0%)
$1,000 to $1,499
0 (0.0%)
0 (0.0%)
$1,500 to $1,999
0 (0.0%)
0 (0.0%)
$2,000 to $2,499
0 (0.0%)
0 (0.0%)
$2,500 to $2,999
0 (0.0%)
0 (0.0%)
$3,000 or more
0 (0.0%)
0 (0.0%)
Total
15 (100.0%)
36 (100.0%)
Physical Housing Characteristics in Casmalia
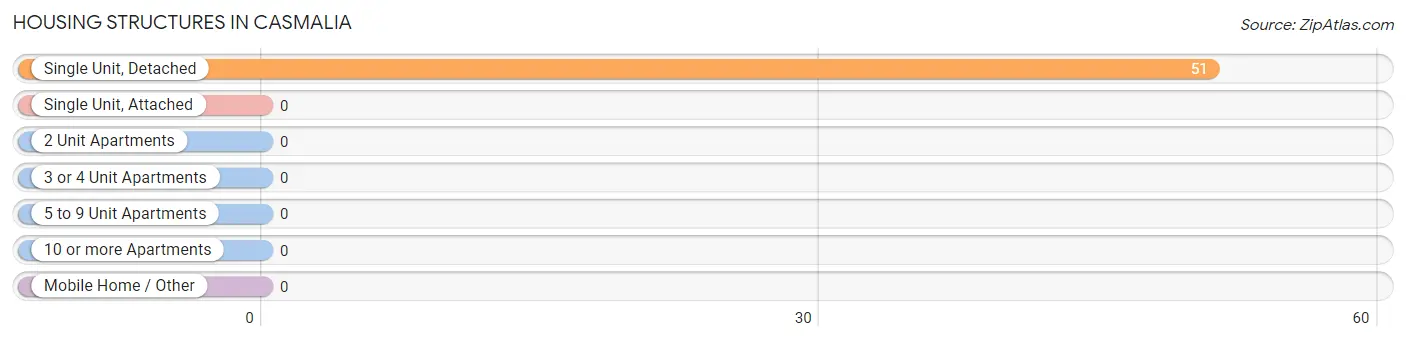
Housing Structures in Casmalia
Structure Type
# Housing Units
% Housing Units
Single Unit, Detached
51
100.0%
Single Unit, Attached
0
0.0%
2 Unit Apartments
0
0.0%
3 or 4 Unit Apartments
0
0.0%
5 to 9 Unit Apartments
0
0.0%
10 or more Apartments
0
0.0%
Mobile Home / Other
0
0.0%
Total
51
100.0%
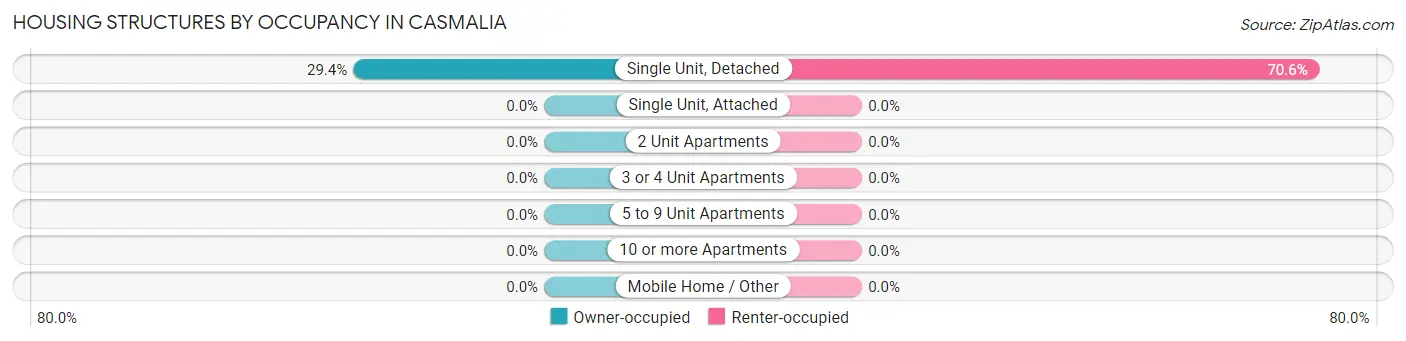
Housing Structures by Occupancy in Casmalia
Structure Type
Owner-occupied
Renter-occupied
Single Unit, Detached
15 (29.4%)
36 (70.6%)
Single Unit, Attached
0 (0.0%)
0 (0.0%)
2 Unit Apartments
0 (0.0%)
0 (0.0%)
3 or 4 Unit Apartments
0 (0.0%)
0 (0.0%)
5 to 9 Unit Apartments
0 (0.0%)
0 (0.0%)
10 or more Apartments
0 (0.0%)
0 (0.0%)
Mobile Home / Other
0 (0.0%)
0 (0.0%)
Total
15 (29.4%)
36 (70.6%)
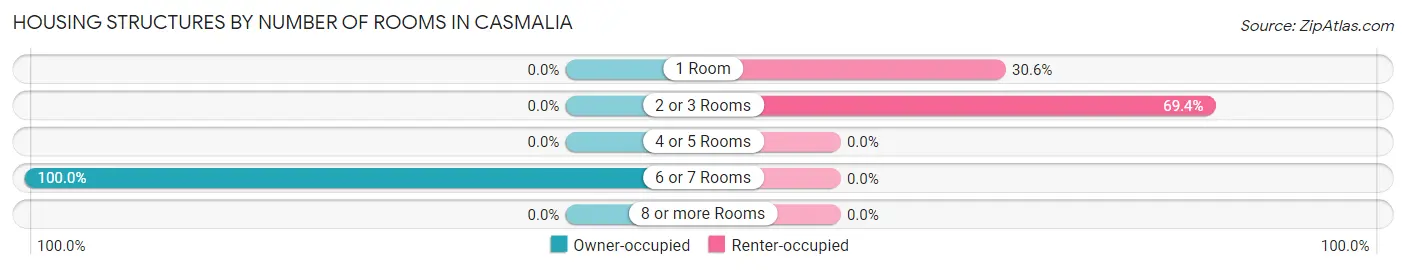
Housing Structures by Number of Rooms in Casmalia
Number of Rooms
Owner-occupied
Renter-occupied
1 Room
0 (0.0%)
11 (30.6%)
2 or 3 Rooms
0 (0.0%)
25 (69.4%)
4 or 5 Rooms
0 (0.0%)
0 (0.0%)
6 or 7 Rooms
15 (100.0%)
0 (0.0%)
8 or more Rooms
0 (0.0%)
0 (0.0%)
Total
15 (100.0%)
36 (100.0%)
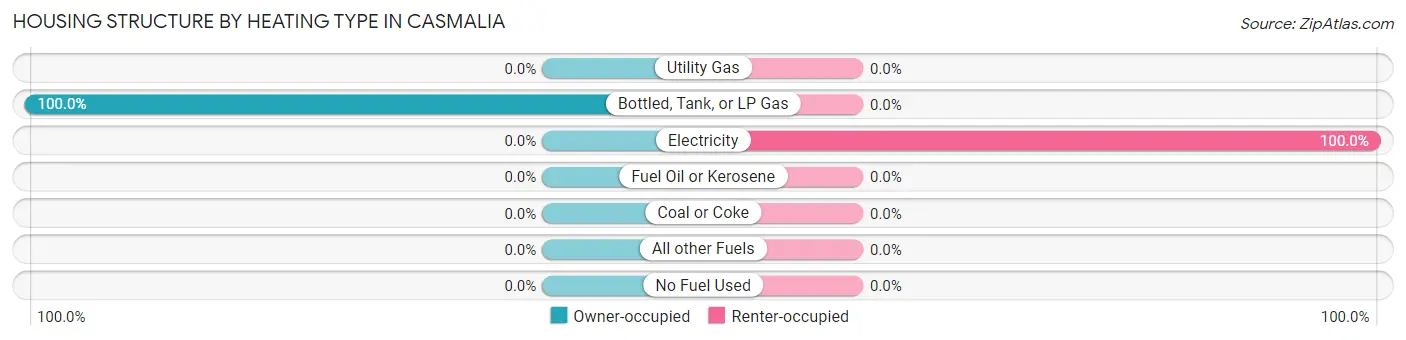
Housing Structure by Heating Type in Casmalia
Heating Type
Owner-occupied
Renter-occupied
Utility Gas
0 (0.0%)
0 (0.0%)
Bottled, Tank, or LP Gas
15 (100.0%)
0 (0.0%)
Electricity
0 (0.0%)
36 (100.0%)
Fuel Oil or Kerosene
0 (0.0%)
0 (0.0%)
Coal or Coke
0 (0.0%)
0 (0.0%)
All other Fuels
0 (0.0%)
0 (0.0%)
No Fuel Used
0 (0.0%)
0 (0.0%)
Total
15 (100.0%)
36 (100.0%)
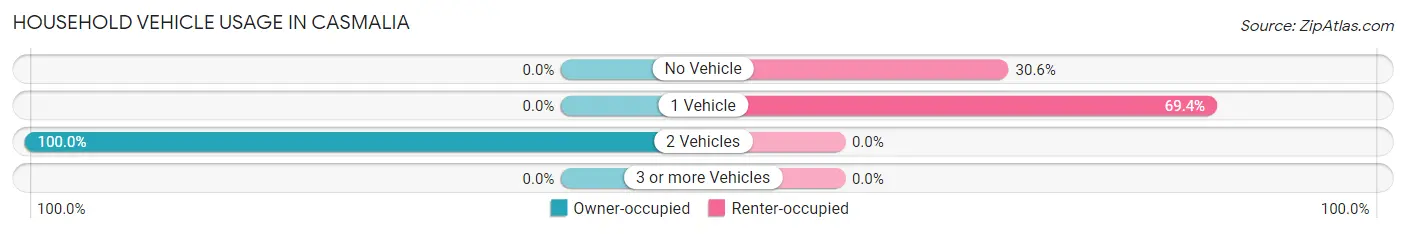
Household Vehicle Usage in Casmalia
Vehicles per Household
Owner-occupied
Renter-occupied
No Vehicle
0 (0.0%)
11 (30.6%)
1 Vehicle
0 (0.0%)
25 (69.4%)
2 Vehicles
15 (100.0%)
0 (0.0%)
3 or more Vehicles
0 (0.0%)
0 (0.0%)
Total
15 (100.0%)
36 (100.0%)
Real Estate & Mortgages in Casmalia
Real Estate and Mortgage Overview in Casmalia
Characteristic
Without Mortgage
With Mortgage
Housing Units
15
0
Median Property Value
-
-
Median Household Income
-
-
Monthly Housing Costs
-
-
Real Estate Taxes
-
-
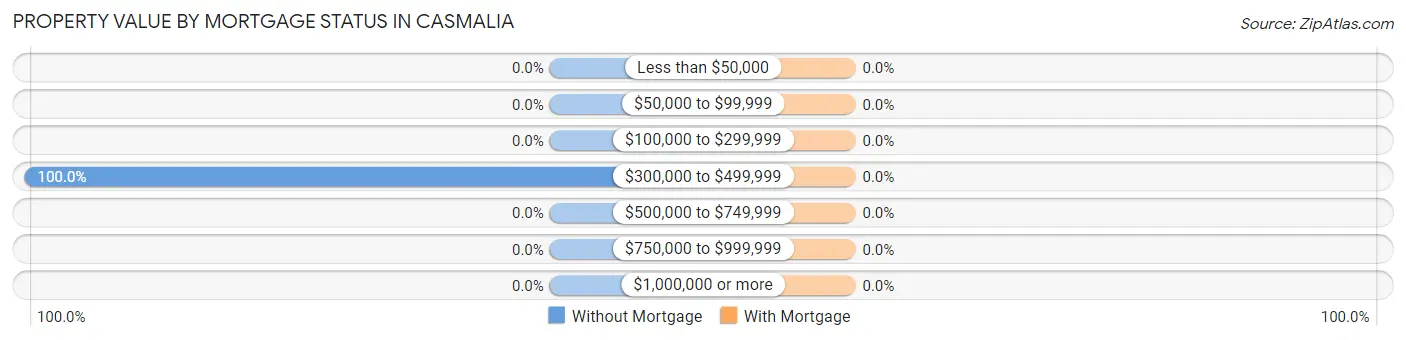
Property Value by Mortgage Status in Casmalia
Property Value
Without Mortgage
With Mortgage
Less than $50,000
0 (0.0%)
0 (0.0%)
$50,000 to $99,999
0 (0.0%)
0 (0.0%)
$100,000 to $299,999
0 (0.0%)
0 (0.0%)
$300,000 to $499,999
15 (100.0%)
0 (0.0%)
$500,000 to $749,999
0 (0.0%)
0 (0.0%)
$750,000 to $999,999
0 (0.0%)
0 (0.0%)
$1,000,000 or more
0 (0.0%)
0 (0.0%)
Total
15 (100.0%)
0 (0.0%)
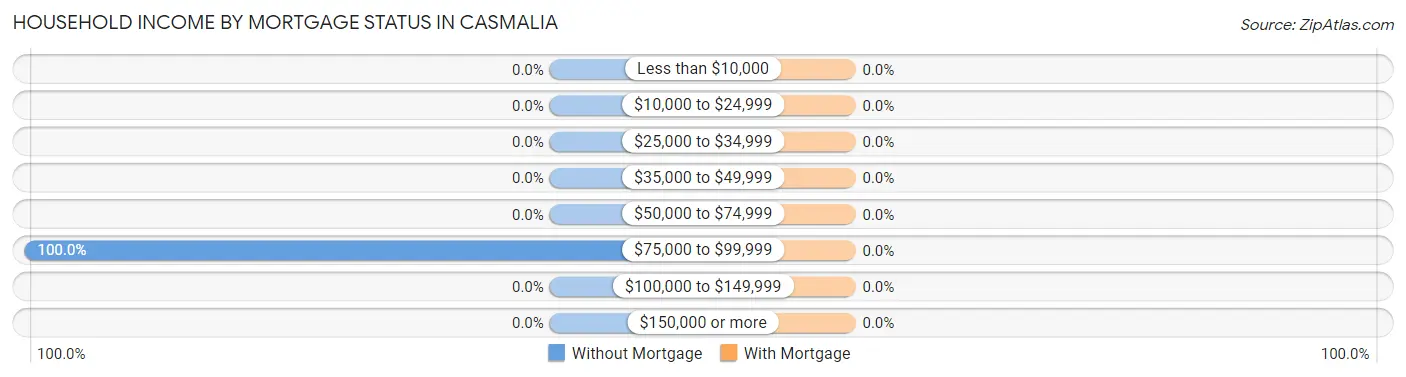
Household Income by Mortgage Status in Casmalia
Household Income
Without Mortgage
With Mortgage
Less than $10,000
0 (0.0%)
0 (0.0%)
$10,000 to $24,999
0 (0.0%)
0 (0.0%)
$25,000 to $34,999
0 (0.0%)
0 (0.0%)
$35,000 to $49,999
0 (0.0%)
0 (0.0%)
$50,000 to $74,999
0 (0.0%)
0 (0.0%)
$75,000 to $99,999
15 (100.0%)
0 (0.0%)
$100,000 to $149,999
0 (0.0%)
0 (0.0%)
$150,000 or more
0 (0.0%)
0 (0.0%)
Total
15 (100.0%)
0 (0.0%)
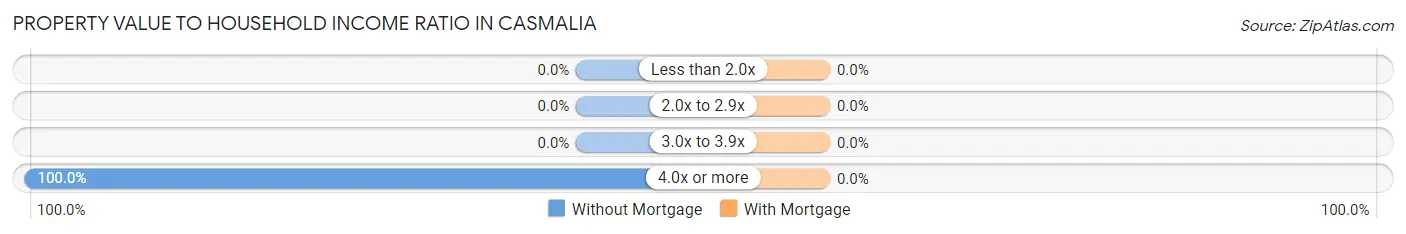
Property Value to Household Income Ratio in Casmalia
Value-to-Income Ratio
Without Mortgage
With Mortgage
Less than 2.0x
0 (0.0%)
0 (0.0%)
2.0x to 2.9x
0 (0.0%)
0 (0.0%)
3.0x to 3.9x
0 (0.0%)
0 (0.0%)
4.0x or more
15 (100.0%)
0 (0.0%)
Total
15 (100.0%)
0 (0.0%)
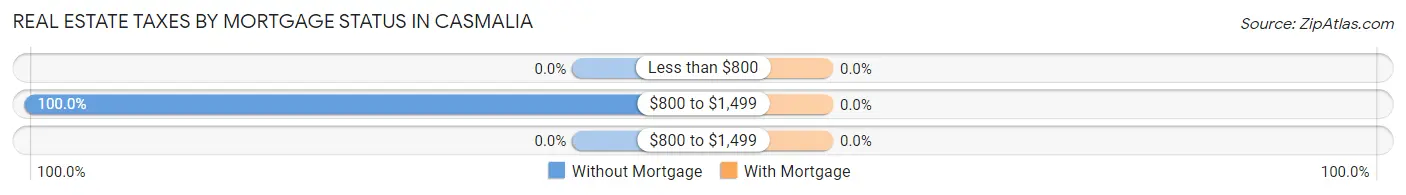
Real Estate Taxes by Mortgage Status in Casmalia
Property Taxes
Without Mortgage
With Mortgage
Less than $800
0 (0.0%)
0 (0.0%)
$800 to $1,499
15 (100.0%)
0 (0.0%)
$800 to $1,499
0 (0.0%)
0 (0.0%)
Total
15 (100.0%)
0 (0.0%)
Health & Disability in Casmalia
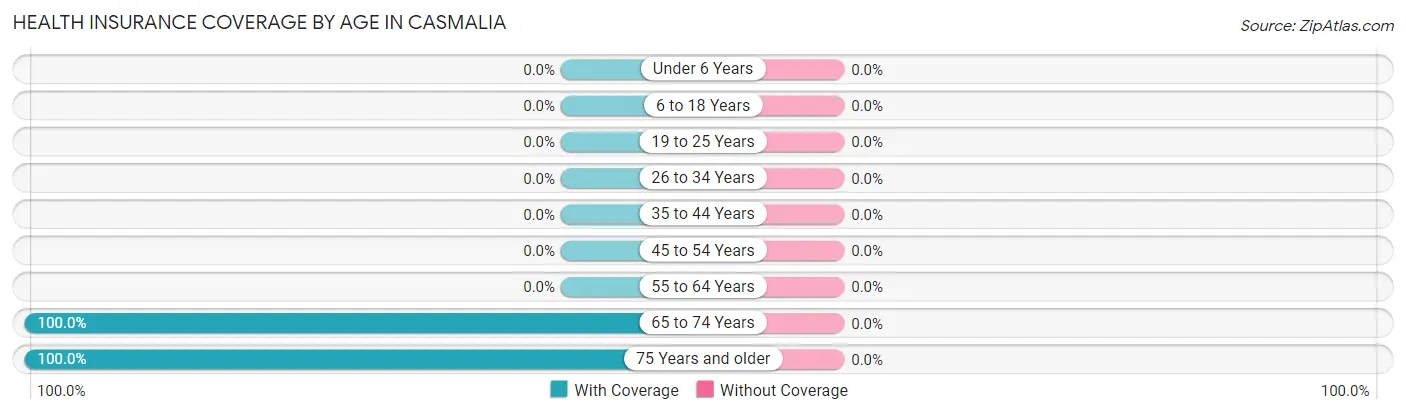
Health Insurance Coverage by Age in Casmalia
Age Bracket
With Coverage
Without Coverage
Under 6 Years
0 (0.0%)
0 (0.0%)
6 to 18 Years
0 (0.0%)
0 (0.0%)
19 to 25 Years
0 (0.0%)
0 (0.0%)
26 to 34 Years
0 (0.0%)
0 (0.0%)
35 to 44 Years
0 (0.0%)
0 (0.0%)
45 to 54 Years
0 (0.0%)
0 (0.0%)
55 to 64 Years
0 (0.0%)
0 (0.0%)
65 to 74 Years
13 (100.0%)
0 (0.0%)
75 Years and older
51 (100.0%)
0 (0.0%)
Total
64 (100.0%)
0 (0.0%)
Health Insurance Coverage by Citizenship Status in Casmalia
Citizenship Status
With Coverage
Without Coverage
Native Born
0 (0.0%)
0 (0.0%)
Foreign Born, Citizen
0 (0.0%)
0 (0.0%)
Foreign Born, not a Citizen
0 (0.0%)
0 (0.0%)
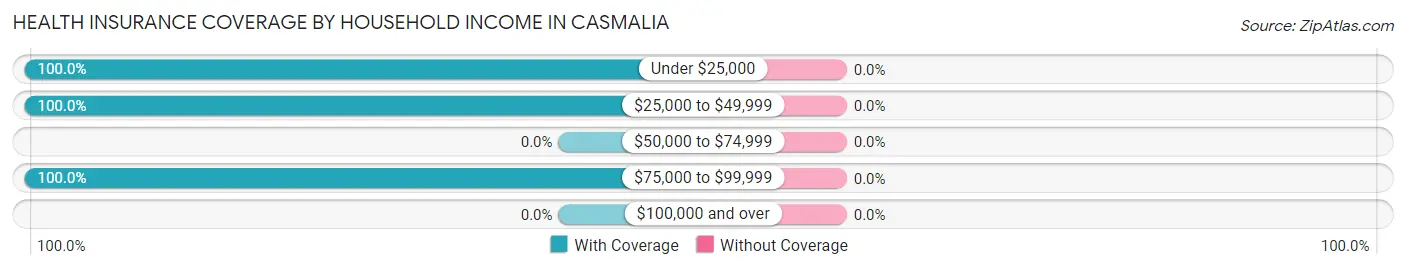
Health Insurance Coverage by Household Income in Casmalia
Household Income
With Coverage
Without Coverage
Under $25,000
11 (100.0%)
0 (0.0%)
$25,000 to $49,999
25 (100.0%)
0 (0.0%)
$50,000 to $74,999
0 (0.0%)
0 (0.0%)
$75,000 to $99,999
28 (100.0%)
0 (0.0%)
$100,000 and over
0 (0.0%)
0 (0.0%)
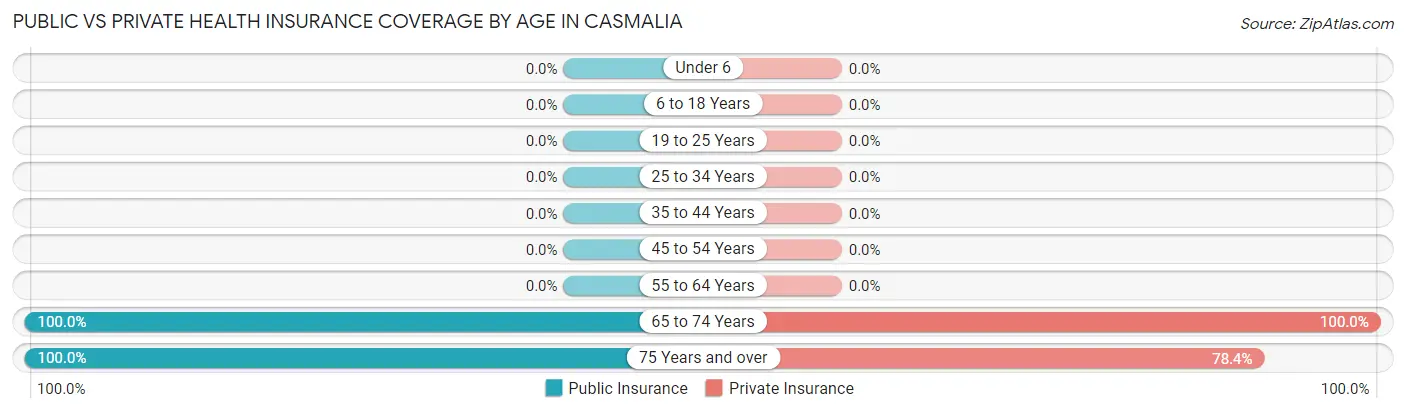
Public vs Private Health Insurance Coverage by Age in Casmalia
Age Bracket
Public Insurance
Private Insurance
Under 6
0 (0.0%)
0 (0.0%)
6 to 18 Years
0 (0.0%)
0 (0.0%)
19 to 25 Years
0 (0.0%)
0 (0.0%)
25 to 34 Years
0 (0.0%)
0 (0.0%)
35 to 44 Years
0 (0.0%)
0 (0.0%)
45 to 54 Years
0 (0.0%)
0 (0.0%)
55 to 64 Years
0 (0.0%)
0 (0.0%)
65 to 74 Years
13 (100.0%)
13 (100.0%)
75 Years and over
51 (100.0%)
40 (78.4%)
Total
64 (100.0%)
53 (82.8%)
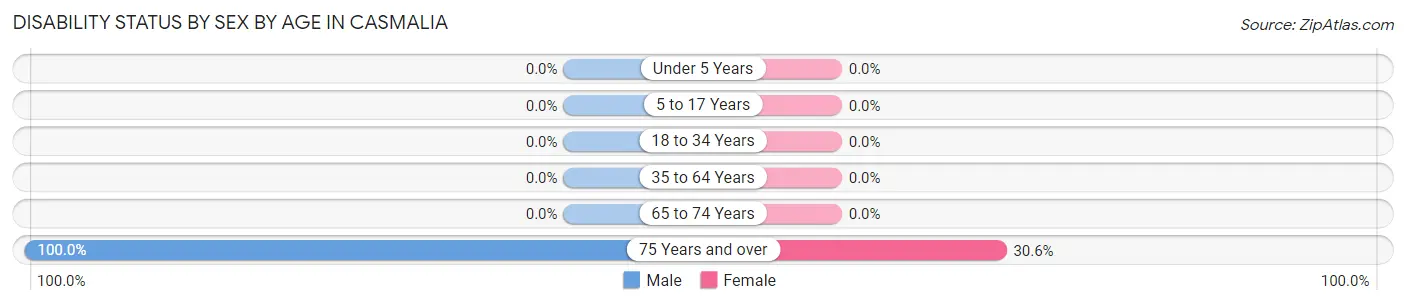
Disability Status by Sex by Age in Casmalia
Age Bracket
Male
Female
Under 5 Years
0 (0.0%)
0 (0.0%)
5 to 17 Years
0 (0.0%)
0 (0.0%)
18 to 34 Years
0 (0.0%)
0 (0.0%)
35 to 64 Years
0 (0.0%)
0 (0.0%)
65 to 74 Years
0 (0.0%)
0 (0.0%)
75 Years and over
15 (100.0%)
11 (30.6%)
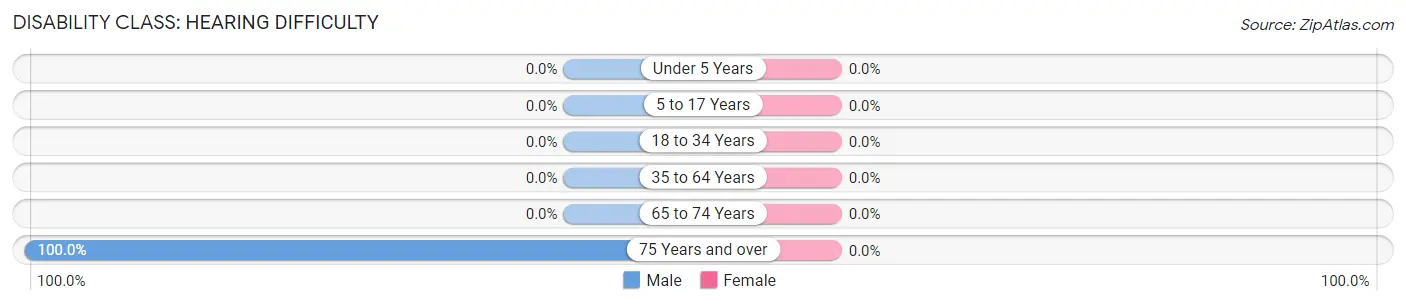
Disability Class by Sex by Age in Casmalia
Disability Class: Hearing Difficulty
Age Bracket
Male
Female
Under 5 Years
0 (0.0%)
0 (0.0%)
5 to 17 Years
0 (0.0%)
0 (0.0%)
18 to 34 Years
0 (0.0%)
0 (0.0%)
35 to 64 Years
0 (0.0%)
0 (0.0%)
65 to 74 Years
0 (0.0%)
0 (0.0%)
75 Years and over
15 (100.0%)
0 (0.0%)
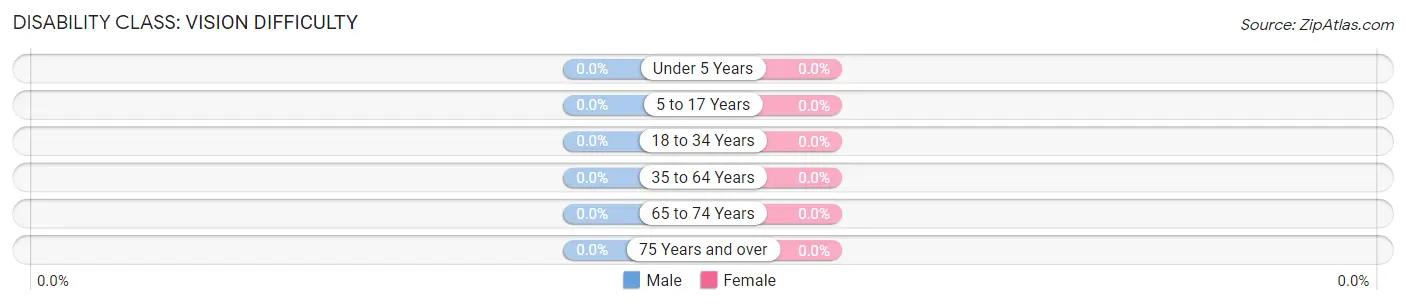
Disability Class: Vision Difficulty
Age Bracket
Male
Female
Under 5 Years
0 (0.0%)
0 (0.0%)
5 to 17 Years
0 (0.0%)
0 (0.0%)
18 to 34 Years
0 (0.0%)
0 (0.0%)
35 to 64 Years
0 (0.0%)
0 (0.0%)
65 to 74 Years
0 (0.0%)
0 (0.0%)
75 Years and over
0 (0.0%)
0 (0.0%)
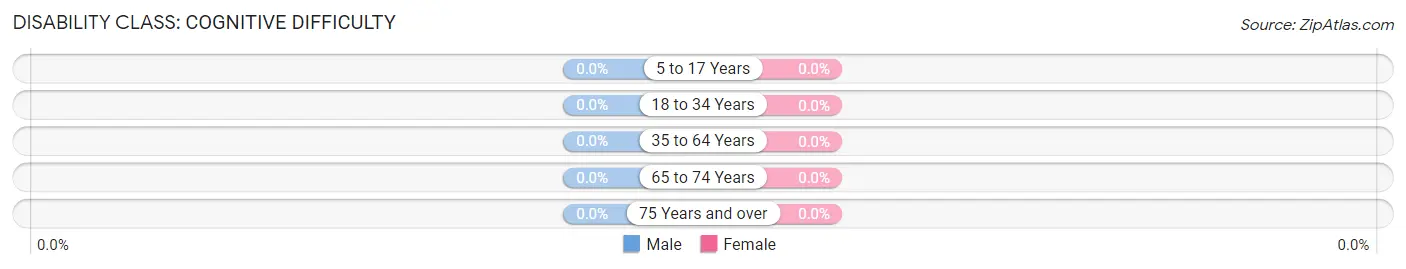
Disability Class: Cognitive Difficulty
Age Bracket
Male
Female
5 to 17 Years
0 (0.0%)
0 (0.0%)
18 to 34 Years
0 (0.0%)
0 (0.0%)
35 to 64 Years
0 (0.0%)
0 (0.0%)
65 to 74 Years
0 (0.0%)
0 (0.0%)
75 Years and over
0 (0.0%)
0 (0.0%)
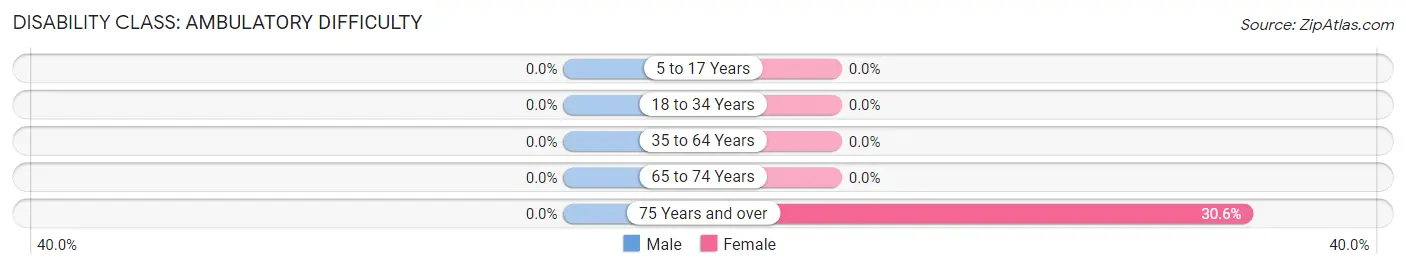
Disability Class: Ambulatory Difficulty
Age Bracket
Male
Female
5 to 17 Years
0 (0.0%)
0 (0.0%)
18 to 34 Years
0 (0.0%)
0 (0.0%)
35 to 64 Years
0 (0.0%)
0 (0.0%)
65 to 74 Years
0 (0.0%)
0 (0.0%)
75 Years and over
0 (0.0%)
11 (30.6%)
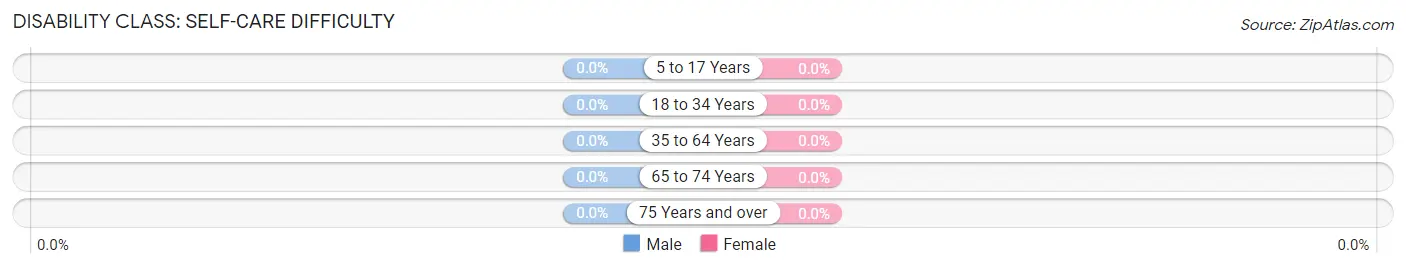
Disability Class: Self-Care Difficulty
Age Bracket
Male
Female
5 to 17 Years
0 (0.0%)
0 (0.0%)
18 to 34 Years
0 (0.0%)
0 (0.0%)
35 to 64 Years
0 (0.0%)
0 (0.0%)
65 to 74 Years
0 (0.0%)
0 (0.0%)
75 Years and over
0 (0.0%)
0 (0.0%)
Technology Access in Casmalia
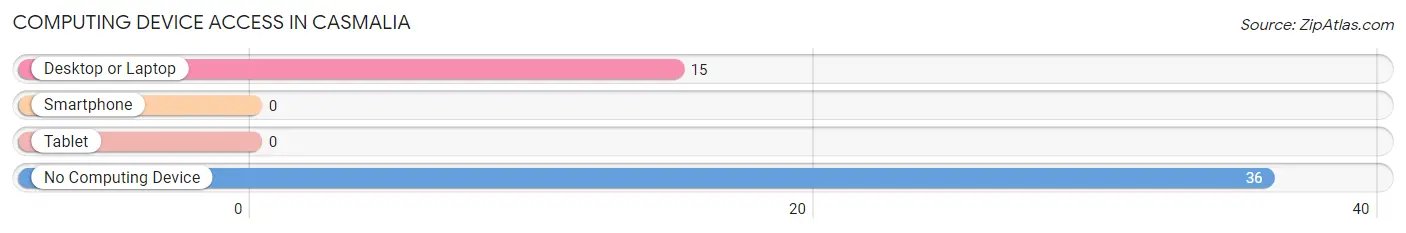
Computing Device Access in Casmalia
Device Type
# Households
% Households
Desktop or Laptop
15
29.4%
Smartphone
0
0.0%
Tablet
0
0.0%
No Computing Device
36
70.6%
Total
51
100.0%
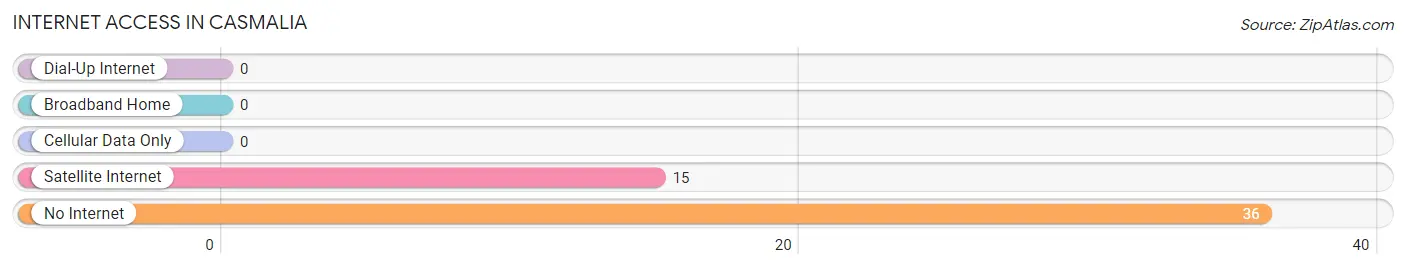
Internet Access in Casmalia
Internet Type
# Households
% Households
Dial-Up Internet
0
0.0%
Broadband Home
0
0.0%
Cellular Data Only
0
0.0%
Satellite Internet
15
29.4%
No Internet
36
70.6%
Total
51
100.0%
Casmalia Summary
Casmalia is a small unincorporated community located in the Santa Barbara County of California. It is situated in the Santa Maria Valley, approximately 8 miles south of the city of Santa Maria. The population of Casmalia was estimated to be around 200 people in 2020.
History
The area of Casmalia was originally inhabited by the Chumash people, who were hunter-gatherers and lived in the area for thousands of years. The first European settlers arrived in the area in the late 1800s, and the town was officially founded in 1887. The town was named after the Casmalia Hills, which were named after the Chumash word for “place of the deer”.
The town was initially a small farming community, and the main crops grown were wheat, barley, and oats. In the early 1900s, the town began to grow and expand, and the population increased to around 500 people. The town was also home to a number of businesses, including a general store, a blacksmith, a post office, and a school.
In the 1950s, the town began to decline as many of the residents moved away in search of better opportunities. The population decreased to around 200 people by the year 2000.
Geography
Casmalia is located in the Santa Maria Valley, which is part of the Central Coast region of California. The town is situated on the Casmalia Hills, which are part of the Santa Lucia Range. The hills are covered in oak and chaparral vegetation, and the area is known for its scenic beauty.
The climate in Casmalia is Mediterranean, with mild winters and warm summers. The average annual temperature is around 60°F, and the average annual precipitation is around 20 inches.
Economy
The economy of Casmalia is largely based on agriculture. The main crops grown in the area are grapes, strawberries, and vegetables. The town is also home to a number of small businesses, including a general store, a post office, and a school.
Demographics
As of 2020, the population of Casmalia was estimated to be around 200 people. The racial makeup of the town is predominantly white (90%), with the remaining population being Hispanic (7%) and Asian (3%). The median household income in Casmalia is around $50,000, and the median home value is around $400,000. The town has a low unemployment rate of around 3%.
Conclusion
Casmalia is a small unincorporated community located in the Santa Barbara County of California. It is situated in the Santa Maria Valley, approximately 8 miles south of the city of Santa Maria. The population of Casmalia was estimated to be around 200 people in 2020. The town is largely based on agriculture, and the main crops grown in the area are grapes, strawberries, and vegetables. The racial makeup of the town is predominantly white, with the remaining population being Hispanic and Asian. The median household income in Casmalia is around $50,000, and the median home value is around $400,000. The town has a low unemployment rate of around 3%.
Common Questions
What is Per Capita Income in Casmalia?
Per Capita income in Casmalia is $30,394.
What is Inequality or Gini Index in Casmalia?
Inequality or Gini Index in Casmalia is 0.35.
What is the Total Population of Casmalia?
Total Population of Casmalia is 64.
What is the Total Male Population of Casmalia?
Total Male Population of Casmalia is 15.
What is the Total Female Population of Casmalia?
Total Female Population of Casmalia is 49.
What is the Ratio of Males per 100 Females in Casmalia?
There are 30.61 Males per 100 Females in Casmalia.
What is the Ratio of Females per 100 Males in Casmalia?
There are 326.67 Females per 100 Males in Casmalia.
What is the Median Population Age in Casmalia?
Median Population Age in Casmalia is 82.2 Years.
What is the Average Family Size in Casmalia
Average Family Size in Casmalia is 1.9 People.
What is the Average Household Size in Casmalia
Average Household Size in Casmalia is 1.2 People.
How Large is the Labor Force in Casmalia?
There are 25 People in the Labor Forcein in Casmalia.
What is the Percentage of People in the Labor Force in Casmalia?
39.1% of People are in the Labor Force in Casmalia.
Report Title
Report Link
HTML Copy & Paste Link
Social Media
Copy and paste the folowing code into any webpage where you would like this interactive chart to display