Cities with the Highest Percentage of Households Without a Vehicle in New Hampshire
RELATED REPORTS & OPTIONS
Households without a Cars
New Hampshire
Compare Cities
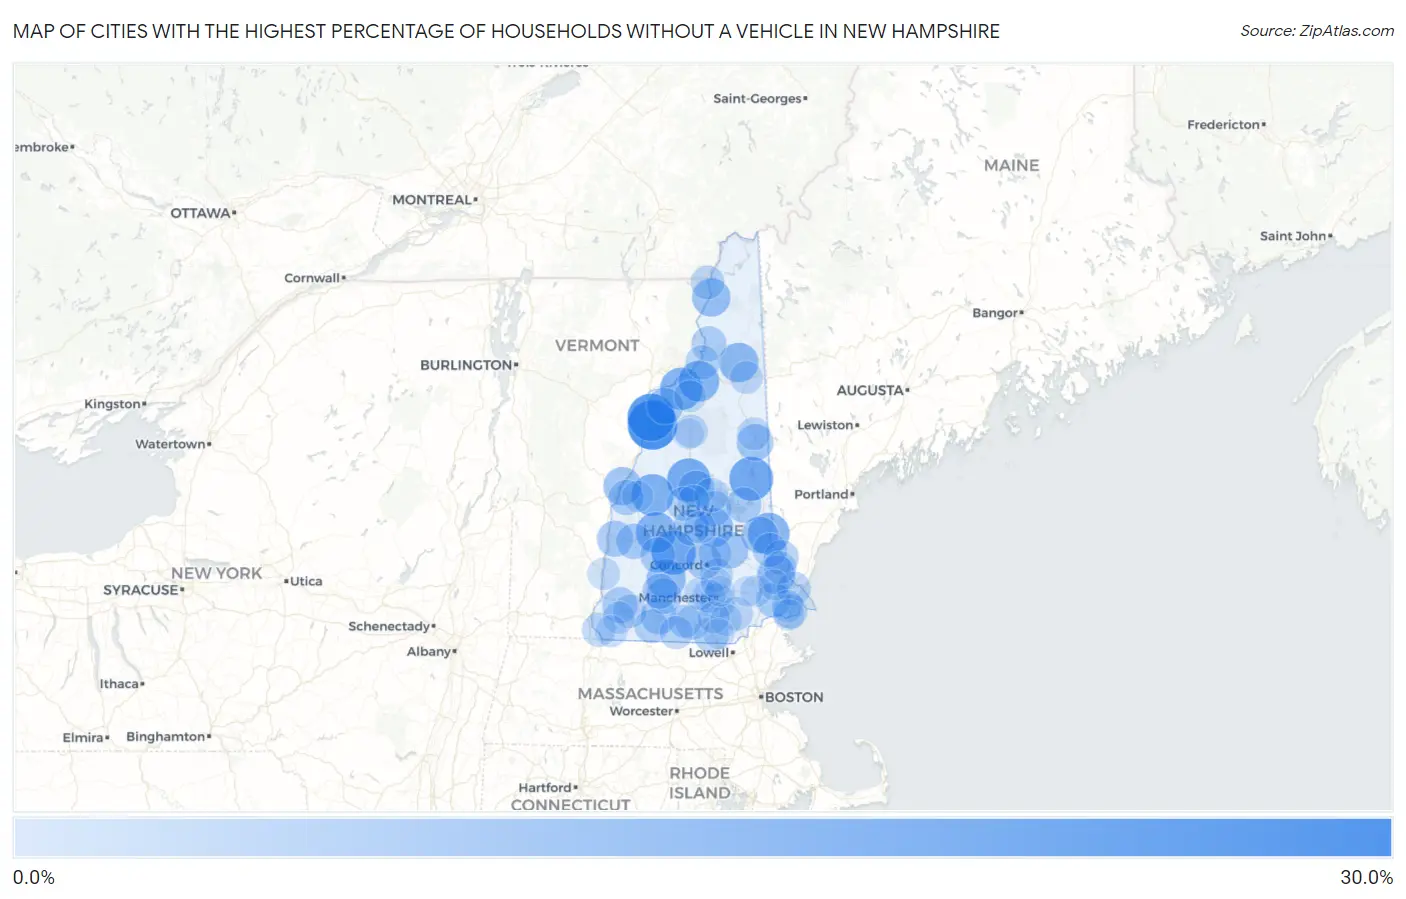
Map of Cities with the Highest Percentage of Households Without a Vehicle in New Hampshire
0.0%
30.0%
Cities with the Highest Percentage of Households Without a Vehicle in New Hampshire
| City | Housholds Without a Car | vs State | vs National | |
| 1. | North Haverhill | 29.8% | 4.6%(+25.2)#1 | 8.3%(+21.5)#599 |
| 2. | Woodsville | 26.4% | 4.6%(+21.8)#2 | 8.3%(+18.1)#761 |
| 3. | Warner | 21.4% | 4.6%(+16.8)#3 | 8.3%(+13.1)#1,200 |
| 4. | Center Ossipee | 20.8% | 4.6%(+16.2)#4 | 8.3%(+12.5)#1,288 |
| 5. | Plymouth | 20.2% | 4.6%(+15.6)#5 | 8.3%(+11.9)#1,368 |
| 6. | Littleton | 18.6% | 4.6%(+14.0)#6 | 8.3%(+10.3)#1,652 |
| 7. | Canaan | 17.9% | 4.6%(+13.3)#7 | 8.3%(+9.60)#1,810 |
| 8. | Milton | 17.7% | 4.6%(+13.1)#8 | 8.3%(+9.40)#1,857 |
| 9. | New London | 16.3% | 4.6%(+11.7)#9 | 8.3%(+8.00)#2,232 |
| 10. | Whitefield | 16.3% | 4.6%(+11.7)#10 | 8.3%(+8.00)#2,233 |
| 11. | Berlin | 13.9% | 4.6%(+9.30)#11 | 8.3%(+5.60)#3,133 |
| 12. | Hillsborough | 13.7% | 4.6%(+9.10)#12 | 8.3%(+5.40)#3,242 |
| 13. | Belmont | 13.0% | 4.6%(+8.40)#13 | 8.3%(+4.70)#3,558 |
| 14. | Colebrook | 12.5% | 4.6%(+7.90)#14 | 8.3%(+4.20)#3,830 |
| 15. | Hanover | 12.2% | 4.6%(+7.60)#15 | 8.3%(+3.90)#3,991 |
| 16. | Durham | 11.9% | 4.6%(+7.30)#16 | 8.3%(+3.60)#4,177 |
| 17. | Farmington | 10.0% | 4.6%(+5.40)#17 | 8.3%(+1.70)#5,667 |
| 18. | Pittsfield | 10.0% | 4.6%(+5.40)#18 | 8.3%(+1.70)#5,683 |
| 19. | Conway | 9.9% | 4.6%(+5.30)#19 | 8.3%(+1.60)#5,750 |
| 20. | Lisbon | 9.5% | 4.6%(+4.90)#20 | 8.3%(+1.20)#6,163 |
| 21. | Ashland | 9.4% | 4.6%(+4.80)#21 | 8.3%(+1.10)#6,250 |
| 22. | Franklin | 9.2% | 4.6%(+4.60)#22 | 8.3%(+0.900)#6,431 |
| 23. | Claremont | 9.0% | 4.6%(+4.40)#23 | 8.3%(+0.700)#6,657 |
| 24. | Peterborough | 8.8% | 4.6%(+4.20)#24 | 8.3%(+0.500)#6,917 |
| 25. | Concord | 8.7% | 4.6%(+4.10)#25 | 8.3%(+0.400)#6,994 |
| 26. | Keene | 8.3% | 4.6%(+3.70)#26 | 8.3%(=0.000)#7,460 |
| 27. | Bennington | 8.3% | 4.6%(+3.70)#27 | 8.3%(=0.000)#7,552 |
| 28. | Newport | 8.0% | 4.6%(+3.40)#28 | 8.3%(-0.300)#7,878 |
| 29. | Laconia | 7.9% | 4.6%(+3.30)#29 | 8.3%(-0.400)#7,986 |
| 30. | Wolfeboro | 7.8% | 4.6%(+3.20)#30 | 8.3%(-0.500)#8,158 |
| 31. | Bradford | 7.8% | 4.6%(+3.20)#31 | 8.3%(-0.500)#8,215 |
| 32. | Lebanon | 7.6% | 4.6%(+3.00)#32 | 8.3%(-0.700)#8,404 |
| 33. | Exeter | 7.5% | 4.6%(+2.90)#33 | 8.3%(-0.800)#8,538 |
| 34. | Nashua | 7.4% | 4.6%(+2.80)#34 | 8.3%(-0.900)#8,651 |
| 35. | Manchester | 7.3% | 4.6%(+2.70)#35 | 8.3%(-1.00)#8,815 |
| 36. | Antrim | 7.3% | 4.6%(+2.70)#36 | 8.3%(-1.00)#8,907 |
| 37. | Groveton | 7.2% | 4.6%(+2.60)#37 | 8.3%(-1.10)#9,070 |
| 38. | Somersworth | 7.1% | 4.6%(+2.50)#38 | 8.3%(-1.20)#9,133 |
| 39. | Hampton Beach | 6.6% | 4.6%(+2.00)#39 | 8.3%(-1.70)#9,963 |
| 40. | Lancaster | 6.4% | 4.6%(+1.80)#40 | 8.3%(-1.90)#10,313 |
| 41. | Milford | 6.2% | 4.6%(+1.60)#41 | 8.3%(-2.10)#10,622 |
| 42. | Rochester | 6.1% | 4.6%(+1.50)#42 | 8.3%(-2.20)#10,767 |
| 43. | Portsmouth | 6.0% | 4.6%(+1.40)#43 | 8.3%(-2.30)#10,957 |
| 44. | Bristol | 5.8% | 4.6%(+1.20)#44 | 8.3%(-2.50)#11,411 |
| 45. | Meredith | 5.7% | 4.6%(+1.10)#45 | 8.3%(-2.60)#11,618 |
| 46. | Jaffrey | 5.5% | 4.6%(+0.900)#46 | 8.3%(-2.80)#12,019 |
| 47. | West Stewartstown | 5.5% | 4.6%(+0.900)#47 | 8.3%(-2.80)#12,095 |
| 48. | Marlborough | 5.2% | 4.6%(+0.600)#48 | 8.3%(-3.10)#12,629 |
| 49. | Derry | 5.1% | 4.6%(+0.500)#49 | 8.3%(-3.20)#12,726 |
| 50. | Hinsdale | 5.1% | 4.6%(+0.500)#50 | 8.3%(-3.20)#12,798 |
| 51. | Suncook | 4.9% | 4.6%(+0.300)#51 | 8.3%(-3.40)#13,142 |
| 52. | Wilton | 4.6% | 4.6%(=0.000)#52 | 8.3%(-3.70)#13,862 |
| 53. | Greenville | 4.6% | 4.6%(=0.000)#53 | 8.3%(-3.70)#13,868 |
| 54. | Lincoln | 4.6% | 4.6%(=0.000)#54 | 8.3%(-3.70)#13,870 |
| 55. | Loudon | 4.6% | 4.6%(=0.000)#55 | 8.3%(-3.70)#13,890 |
| 56. | North Conway | 4.3% | 4.6%(-0.300)#56 | 8.3%(-4.00)#14,455 |
| 57. | Pinardville | 4.2% | 4.6%(-0.400)#57 | 8.3%(-4.10)#14,665 |
| 58. | Dover | 4.1% | 4.6%(-0.500)#58 | 8.3%(-4.20)#14,837 |
| 59. | Gorham | 4.1% | 4.6%(-0.500)#59 | 8.3%(-4.20)#14,925 |
| 60. | New Hampton | 3.7% | 4.6%(-0.900)#60 | 8.3%(-4.60)#15,993 |
| 61. | Hampton | 3.5% | 4.6%(-1.10)#61 | 8.3%(-4.80)#16,320 |
| 62. | Goffstown | 3.5% | 4.6%(-1.10)#62 | 8.3%(-4.80)#16,365 |
| 63. | North Walpole | 3.4% | 4.6%(-1.20)#63 | 8.3%(-4.90)#16,692 |
| 64. | Tilton Northfield | 3.2% | 4.6%(-1.40)#64 | 8.3%(-5.10)#17,067 |
| 65. | West Swanzey | 3.2% | 4.6%(-1.40)#65 | 8.3%(-5.10)#17,128 |
| 66. | Bethlehem | 3.0% | 4.6%(-1.60)#66 | 8.3%(-5.30)#17,630 |
| 67. | Londonderry | 2.7% | 4.6%(-1.90)#67 | 8.3%(-5.60)#18,270 |
| 68. | Winchester | 2.7% | 4.6%(-1.90)#68 | 8.3%(-5.60)#18,377 |
| 69. | East Merrimack | 2.6% | 4.6%(-2.00)#69 | 8.3%(-5.70)#18,536 |
| 70. | Epping | 2.4% | 4.6%(-2.20)#70 | 8.3%(-5.90)#19,077 |
| 71. | Seabrook Beach | 2.0% | 4.6%(-2.60)#71 | 8.3%(-6.30)#20,117 |
| 72. | Enfield | 1.9% | 4.6%(-2.70)#72 | 8.3%(-6.40)#20,326 |
| 73. | Newmarket | 1.3% | 4.6%(-3.30)#73 | 8.3%(-7.00)#21,757 |
| 74. | North Woodstock | 1.3% | 4.6%(-3.30)#74 | 8.3%(-7.00)#21,897 |
| 75. | Hooksett | 1.2% | 4.6%(-3.40)#75 | 8.3%(-7.10)#22,009 |
| 76. | Hudson | 1.1% | 4.6%(-3.50)#76 | 8.3%(-7.20)#22,220 |
| 77. | Raymond | 0.90% | 4.6%(-3.70)#77 | 8.3%(-7.40)#22,720 |
| 78. | South Hooksett | 0.30% | 4.6%(-4.30)#78 | 8.3%(-8.00)#23,704 |
1
Common Questions
What are the Top 10 Cities with the Highest Percentage of Households Without a Vehicle in New Hampshire?
Top 10 Cities with the Highest Percentage of Households Without a Vehicle in New Hampshire are:
#1
29.8%
#2
26.4%
#3
21.4%
#4
20.8%
#5
20.2%
#6
18.6%
#7
17.9%
#8
17.7%
#9
16.3%
#10
16.3%
What city has the Highest Percentage of Households Without a Vehicle in New Hampshire?
North Haverhill has the Highest Percentage of Households Without a Vehicle in New Hampshire with 29.8%.
What is the Percentage of Households Without a Vehicle in the State of New Hampshire?
Percentage of Households Without a Vehicle in New Hampshire is 4.6%.
What is the Percentage of Households Without a Vehicle in the United States?
Percentage of Households Without a Vehicle in the United States is 8.3%.