Huntington Park, CA Map & Demographics
Huntington Park Map
Huntington Park Overview
$19,217
PER CAPITA INCOME
$56,503
AVG FAMILY INCOME
$54,073
AVG HOUSEHOLD INCOME
17.0%
WAGE / INCOME GAP [ % ]
83.0¢/ $1
WAGE / INCOME GAP [ $ ]
$11,429
FAMILY INCOME DEFICIT
0.41
INEQUALITY / GINI INDEX
54,547
TOTAL POPULATION
27,580
MALE POPULATION
26,967
FEMALE POPULATION
102.27
MALES / 100 FEMALES
97.78
FEMALES / 100 MALES
33.5
MEDIAN AGE
4.0
AVG FAMILY SIZE
3.7
AVG HOUSEHOLD SIZE
28,086
LABOR FORCE [ PEOPLE ]
65.6%
PERCENT IN LABOR FORCE
10.1%
UNEMPLOYMENT RATE
Huntington Park Zip Codes
Huntington Park Area Codes
Income in Huntington Park
Income Overview in Huntington Park
Per Capita Income in Huntington Park is $19,217, while median incomes of families and households are $56,503 and $54,073 respectively.
| Characteristic | Number | Measure |
| Per Capita Income | 54,547 | $19,217 |
| Median Family Income | 11,890 | $56,503 |
| Mean Family Income | 11,890 | $70,107 |
| Median Household Income | 14,712 | $54,073 |
| Mean Household Income | 14,712 | $67,547 |
| Income Deficit | 11,890 | $11,429 |
| Wage / Income Gap (%) | 54,547 | 16.98% |
| Wage / Income Gap ($) | 54,547 | 83.02¢ per $1 |
| Gini / Inequality Index | 54,547 | 0.41 |
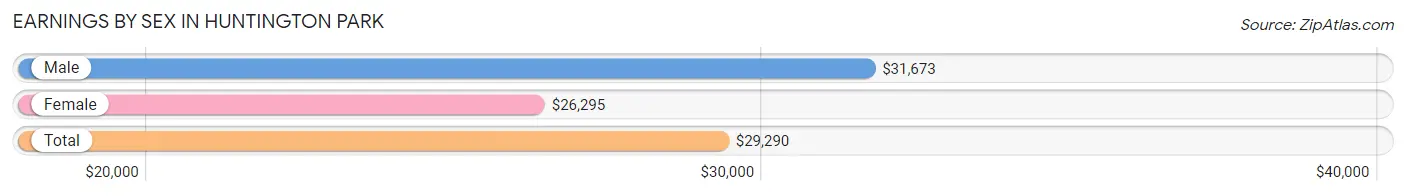
Earnings by Sex in Huntington Park
Average Earnings in Huntington Park are $29,290, $31,673 for men and $26,295 for women, a difference of 17.0%.
| Sex | Number | Average Earnings |
| Male | 15,088 (56.1%) | $31,673 |
| Female | 11,804 (43.9%) | $26,295 |
| Total | 26,892 (100.0%) | $29,290 |
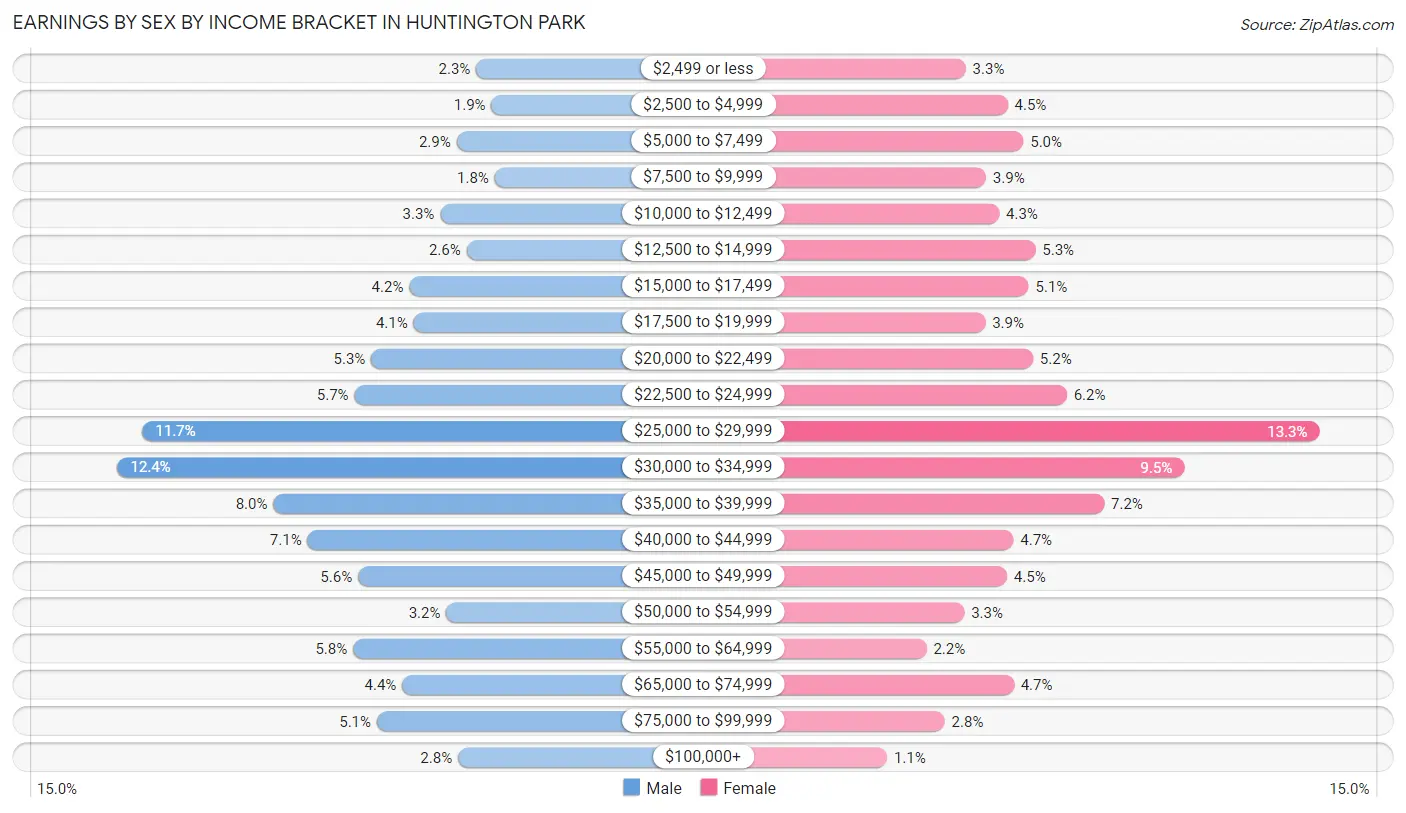
Earnings by Sex by Income Bracket in Huntington Park
The most common earnings brackets in Huntington Park are $30,000 to $34,999 for men (1,869 | 12.4%) and $25,000 to $29,999 for women (1,568 | 13.3%).
| Income | Male | Female |
| $2,499 or less | 349 (2.3%) | 394 (3.3%) |
| $2,500 to $4,999 | 284 (1.9%) | 533 (4.5%) |
| $5,000 to $7,499 | 432 (2.9%) | 586 (5.0%) |
| $7,500 to $9,999 | 270 (1.8%) | 462 (3.9%) |
| $10,000 to $12,499 | 501 (3.3%) | 505 (4.3%) |
| $12,500 to $14,999 | 389 (2.6%) | 626 (5.3%) |
| $15,000 to $17,499 | 632 (4.2%) | 603 (5.1%) |
| $17,500 to $19,999 | 614 (4.1%) | 459 (3.9%) |
| $20,000 to $22,499 | 793 (5.3%) | 617 (5.2%) |
| $22,500 to $24,999 | 865 (5.7%) | 729 (6.2%) |
| $25,000 to $29,999 | 1,764 (11.7%) | 1,568 (13.3%) |
| $30,000 to $34,999 | 1,869 (12.4%) | 1,119 (9.5%) |
| $35,000 to $39,999 | 1,209 (8.0%) | 854 (7.2%) |
| $40,000 to $44,999 | 1,064 (7.0%) | 552 (4.7%) |
| $45,000 to $49,999 | 849 (5.6%) | 531 (4.5%) |
| $50,000 to $54,999 | 476 (3.2%) | 390 (3.3%) |
| $55,000 to $64,999 | 871 (5.8%) | 264 (2.2%) |
| $65,000 to $74,999 | 663 (4.4%) | 554 (4.7%) |
| $75,000 to $99,999 | 769 (5.1%) | 325 (2.8%) |
| $100,000+ | 425 (2.8%) | 133 (1.1%) |
| Total | 15,088 (100.0%) | 11,804 (100.0%) |
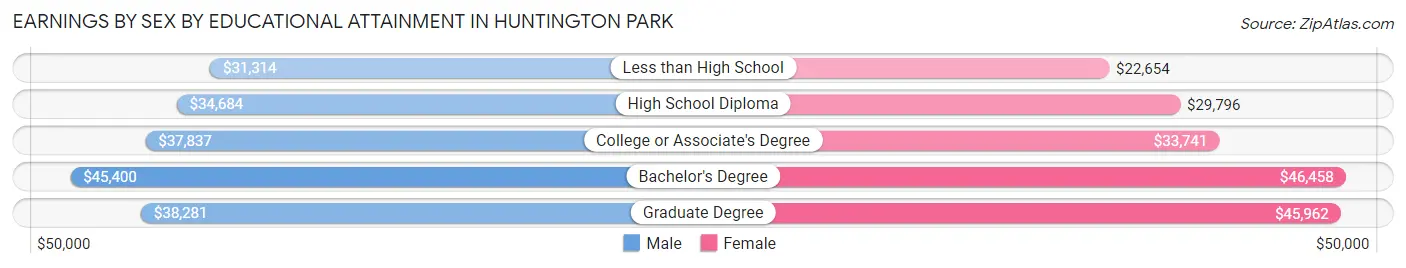
Earnings by Sex by Educational Attainment in Huntington Park
Average earnings in Huntington Park are $33,586 for men and $28,472 for women, a difference of 15.2%. Men with an educational attainment of bachelor's degree enjoy the highest average annual earnings of $45,400, while those with less than high school education earn the least with $31,314. Women with an educational attainment of bachelor's degree earn the most with the average annual earnings of $46,458, while those with less than high school education have the smallest earnings of $22,654.
| Educational Attainment | Male Income | Female Income |
| Less than High School | $31,314 | $22,654 |
| High School Diploma | $34,684 | $29,796 |
| College or Associate's Degree | $37,837 | $33,741 |
| Bachelor's Degree | $45,400 | $46,458 |
| Graduate Degree | $38,281 | $45,962 |
| Total | $33,586 | $28,472 |
Family Income in Huntington Park
Family Income Brackets in Huntington Park
According to the Huntington Park family income data, there are 2,223 families falling into the $50,000 to $74,999 income range, which is the most common income bracket and makes up 18.7% of all families. Conversely, the $10,000 to $14,999 income bracket is the least frequent group with only 309 families (2.6%) belonging to this category.
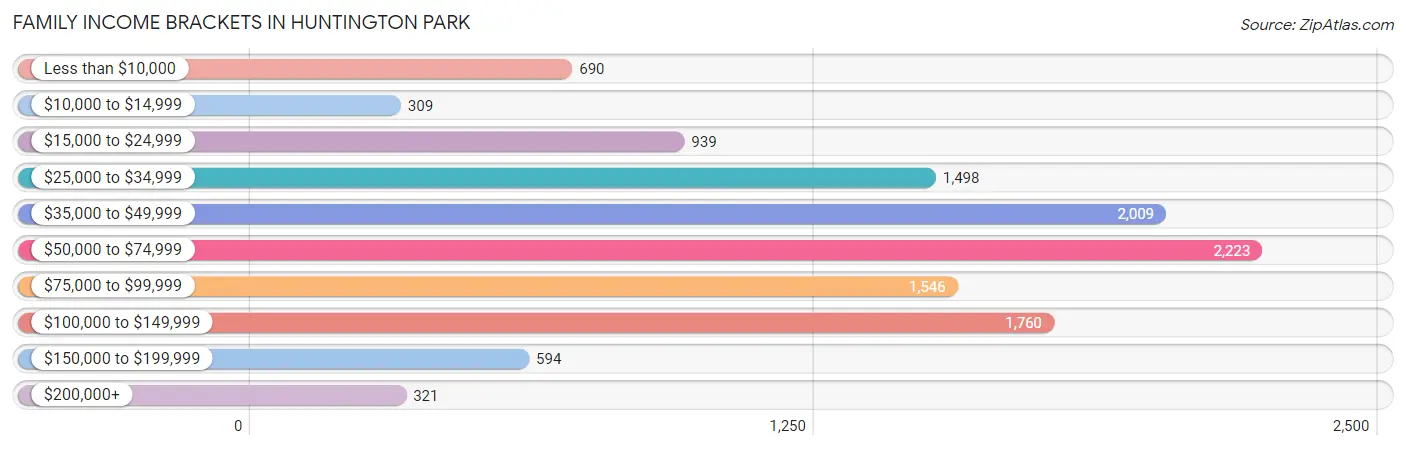
| Income Bracket | # Families | % Families |
| Less than $10,000 | 690 | 5.8% |
| $10,000 to $14,999 | 309 | 2.6% |
| $15,000 to $24,999 | 939 | 7.9% |
| $25,000 to $34,999 | 1,498 | 12.6% |
| $35,000 to $49,999 | 2,009 | 16.9% |
| $50,000 to $74,999 | 2,223 | 18.7% |
| $75,000 to $99,999 | 1,546 | 13.0% |
| $100,000 to $149,999 | 1,760 | 14.8% |
| $150,000 to $199,999 | 594 | 5.0% |
| $200,000+ | 321 | 2.7% |
Family Income by Famaliy Size in Huntington Park
7+ person families (716 | 6.0%) account for the highest median family income in Huntington Park with $123,756 per family, while 2-person families (2,739 | 23.0%) have the highest median income of $18,550 per family member.
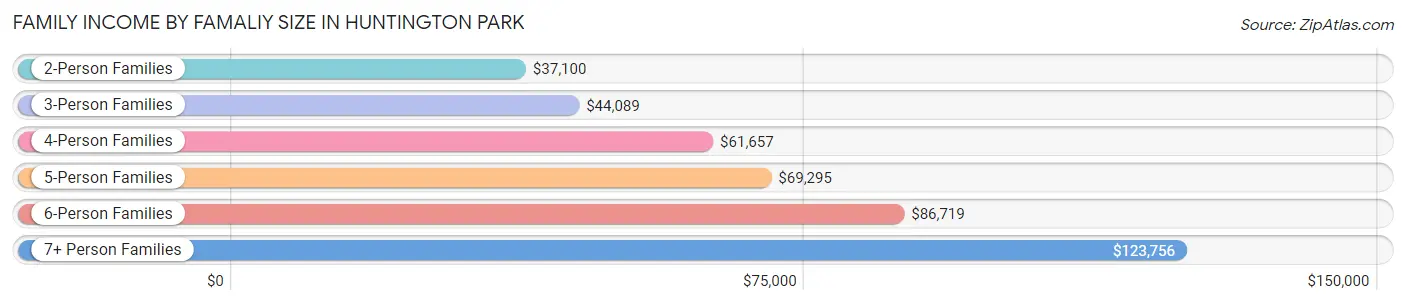
| Income Bracket | # Families | Median Income |
| 2-Person Families | 2,739 (23.0%) | $37,100 |
| 3-Person Families | 3,135 (26.4%) | $44,089 |
| 4-Person Families | 2,759 (23.2%) | $61,657 |
| 5-Person Families | 1,691 (14.2%) | $69,295 |
| 6-Person Families | 850 (7.1%) | $86,719 |
| 7+ Person Families | 716 (6.0%) | $123,756 |
| Total | 11,890 (100.0%) | $56,503 |
Family Income by Number of Earners in Huntington Park
The median family income in Huntington Park is $56,503, with families comprising 3+ earners (2,527) having the highest median family income of $117,094, while families with no earners (952) have the lowest median family income of $18,750, accounting for 21.2% and 8.0% of families, respectively.
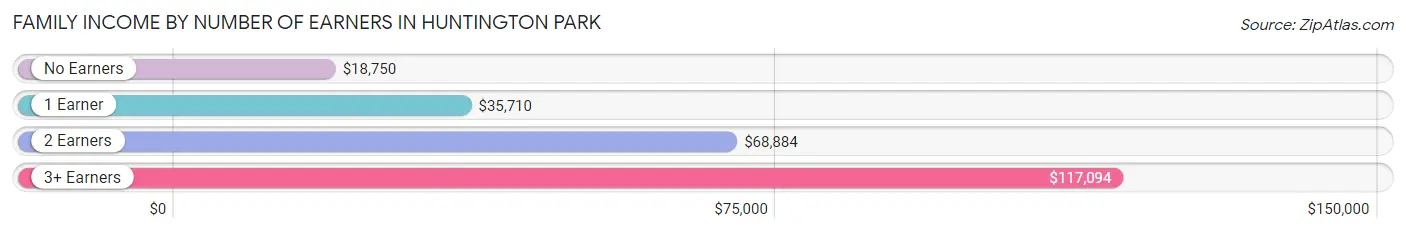
| Number of Earners | # Families | Median Income |
| No Earners | 952 (8.0%) | $18,750 |
| 1 Earner | 4,605 (38.7%) | $35,710 |
| 2 Earners | 3,806 (32.0%) | $68,884 |
| 3+ Earners | 2,527 (21.2%) | $117,094 |
| Total | 11,890 (100.0%) | $56,503 |
Household Income in Huntington Park
Household Income Brackets in Huntington Park
With 2,884 households falling in the category, the $50,000 to $74,999 income range is the most frequent in Huntington Park, accounting for 19.6% of all households. In contrast, only 383 households (2.6%) fall into the $200,000+ income bracket, making it the least populous group.
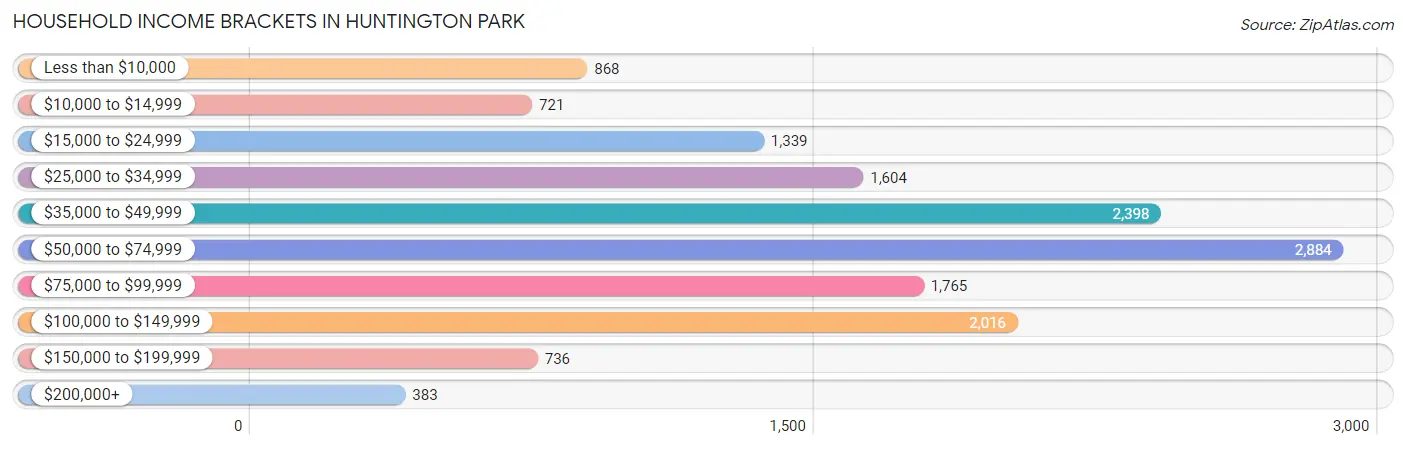
| Income Bracket | # Households | % Households |
| Less than $10,000 | 868 | 5.9% |
| $10,000 to $14,999 | 721 | 4.9% |
| $15,000 to $24,999 | 1,339 | 9.1% |
| $25,000 to $34,999 | 1,604 | 10.9% |
| $35,000 to $49,999 | 2,398 | 16.3% |
| $50,000 to $74,999 | 2,884 | 19.6% |
| $75,000 to $99,999 | 1,765 | 12.0% |
| $100,000 to $149,999 | 2,016 | 13.7% |
| $150,000 to $199,999 | 736 | 5.0% |
| $200,000+ | 383 | 2.6% |
Household Income by Householder Age in Huntington Park
The median household income in Huntington Park is $54,073, with the highest median household income of $62,390 found in the 45 to 64 years age bracket for the primary householder. A total of 6,082 households (41.3%) fall into this category. Meanwhile, the 65+ years age bracket for the primary householder has the lowest median household income of $36,651, with 2,801 households (19.0%) in this group.
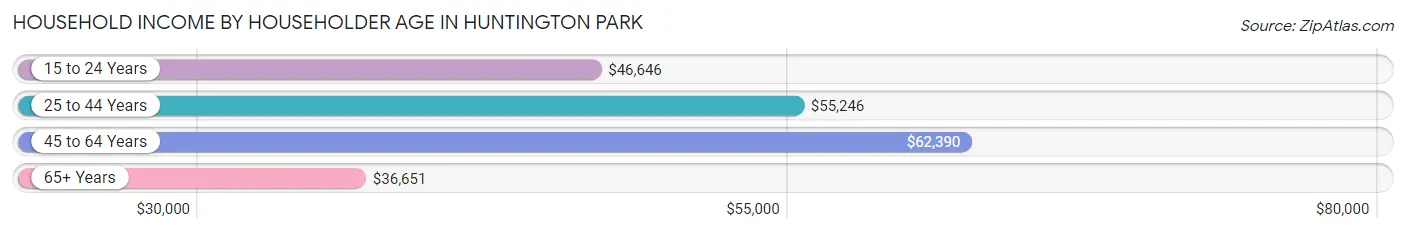
| Income Bracket | # Households | Median Income |
| 15 to 24 Years | 380 (2.6%) | $46,646 |
| 25 to 44 Years | 5,449 (37.0%) | $55,246 |
| 45 to 64 Years | 6,082 (41.3%) | $62,390 |
| 65+ Years | 2,801 (19.0%) | $36,651 |
| Total | 14,712 (100.0%) | $54,073 |
Poverty in Huntington Park
Income Below Poverty by Sex and Age in Huntington Park
With 16.1% poverty level for males and 19.7% for females among the residents of Huntington Park, 6 to 11 year old males and 5 year old females are the most vulnerable to poverty, with 665 males (30.0%) and 65 females (33.2%) in their respective age groups living below the poverty level.
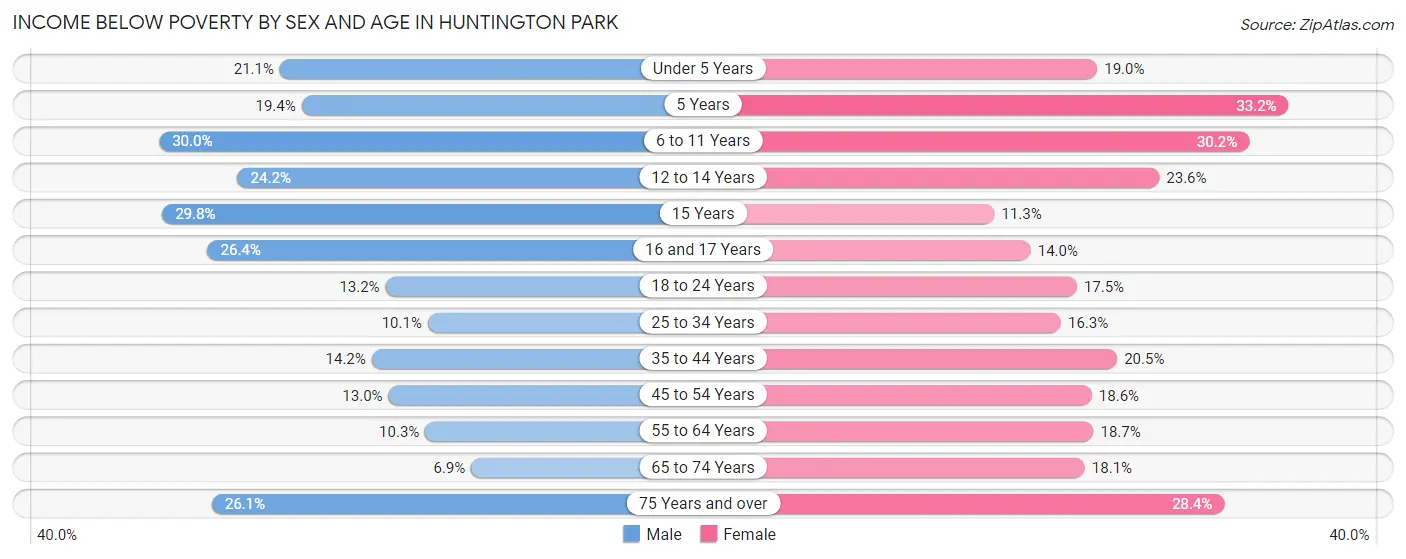
| Age Bracket | Male | Female |
| Under 5 Years | 337 (21.0%) | 301 (19.0%) |
| 5 Years | 56 (19.4%) | 65 (33.2%) |
| 6 to 11 Years | 665 (30.0%) | 637 (30.2%) |
| 12 to 14 Years | 333 (24.2%) | 254 (23.6%) |
| 15 Years | 212 (29.8%) | 38 (11.3%) |
| 16 and 17 Years | 263 (26.4%) | 116 (14.0%) |
| 18 to 24 Years | 477 (13.2%) | 551 (17.5%) |
| 25 to 34 Years | 393 (10.1%) | 706 (16.3%) |
| 35 to 44 Years | 567 (14.2%) | 769 (20.4%) |
| 45 to 54 Years | 479 (13.0%) | 700 (18.6%) |
| 55 to 64 Years | 251 (10.3%) | 475 (18.7%) |
| 65 to 74 Years | 108 (6.9%) | 352 (18.0%) |
| 75 Years and over | 280 (26.1%) | 314 (28.4%) |
| Total | 4,421 (16.1%) | 5,278 (19.7%) |
Income Above Poverty by Sex and Age in Huntington Park
According to the poverty statistics in Huntington Park, males aged 65 to 74 years and females aged 15 years are the age groups that are most secure financially, with 93.1% of males and 88.7% of females in these age groups living above the poverty line.
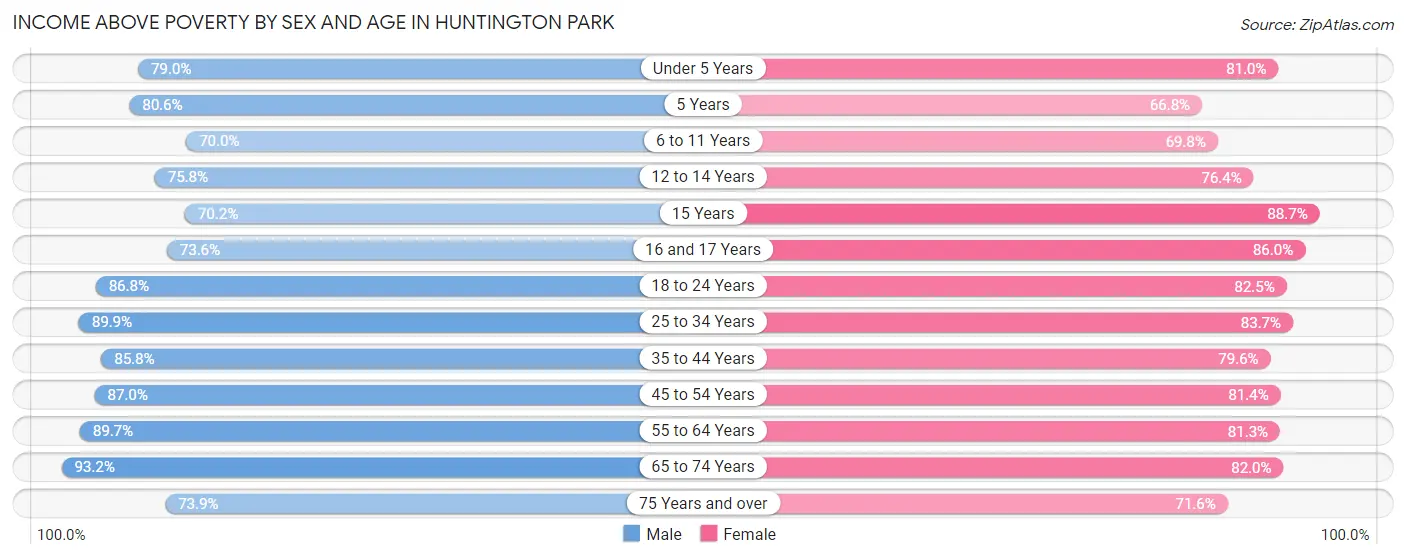
| Age Bracket | Male | Female |
| Under 5 Years | 1,264 (78.9%) | 1,286 (81.0%) |
| 5 Years | 232 (80.6%) | 131 (66.8%) |
| 6 to 11 Years | 1,552 (70.0%) | 1,470 (69.8%) |
| 12 to 14 Years | 1,044 (75.8%) | 823 (76.4%) |
| 15 Years | 500 (70.2%) | 297 (88.7%) |
| 16 and 17 Years | 733 (73.6%) | 711 (86.0%) |
| 18 to 24 Years | 3,134 (86.8%) | 2,605 (82.5%) |
| 25 to 34 Years | 3,509 (89.9%) | 3,631 (83.7%) |
| 35 to 44 Years | 3,415 (85.8%) | 2,991 (79.5%) |
| 45 to 54 Years | 3,209 (87.0%) | 3,070 (81.4%) |
| 55 to 64 Years | 2,196 (89.7%) | 2,066 (81.3%) |
| 65 to 74 Years | 1,468 (93.1%) | 1,598 (82.0%) |
| 75 Years and over | 793 (73.9%) | 792 (71.6%) |
| Total | 23,049 (83.9%) | 21,471 (80.3%) |
Income Below Poverty Among Married-Couple Families in Huntington Park
The poverty statistics for married-couple families in Huntington Park show that 9.3% or 587 of the total 6,286 families live below the poverty line. Families with 3 or 4 children have the highest poverty rate of 22.1%, comprising of 181 families. On the other hand, families with 5 or more children have the lowest poverty rate of 0.0%, which includes 0 families.
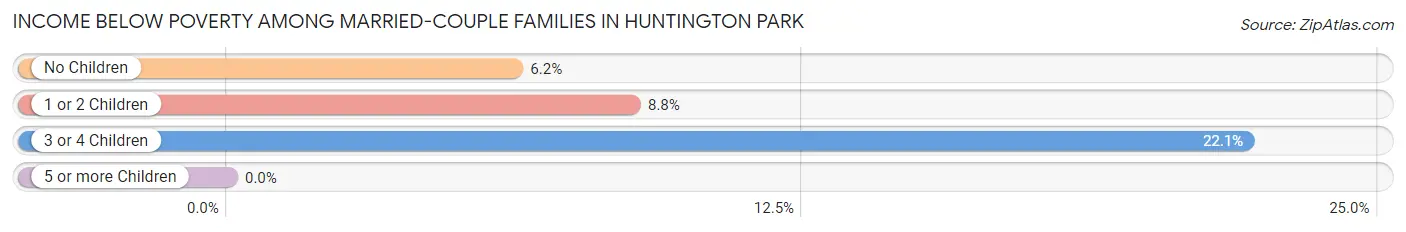
| Children | Above Poverty | Below Poverty |
| No Children | 2,629 (93.8%) | 174 (6.2%) |
| 1 or 2 Children | 2,413 (91.2%) | 232 (8.8%) |
| 3 or 4 Children | 637 (77.9%) | 181 (22.1%) |
| 5 or more Children | 20 (100.0%) | 0 (0.0%) |
| Total | 5,699 (90.7%) | 587 (9.3%) |
Income Below Poverty Among Single-Parent Households in Huntington Park
According to the poverty data in Huntington Park, 16.0% or 283 single-father households and 27.1% or 1,041 single-mother households are living below the poverty line. Among single-father households, those with 3 or 4 children have the highest poverty rate, with 128 households (64.0%) experiencing poverty. Likewise, among single-mother households, those with 3 or 4 children have the highest poverty rate, with 181 households (44.2%) falling below the poverty line.
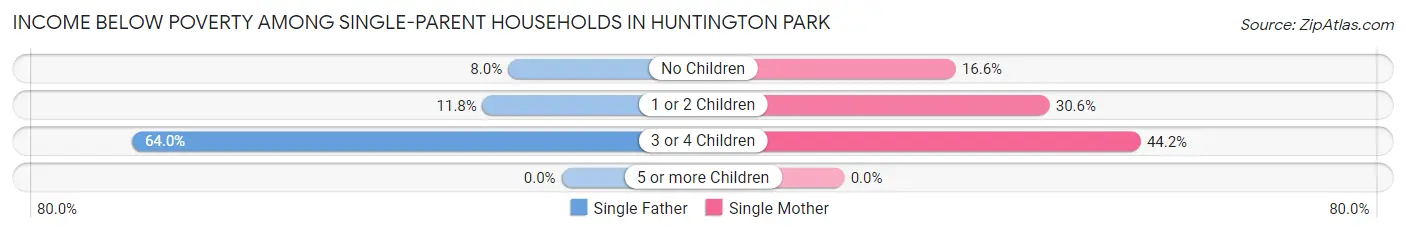
| Children | Single Father | Single Mother |
| No Children | 61 (8.0%) | 223 (16.6%) |
| 1 or 2 Children | 94 (11.7%) | 637 (30.6%) |
| 3 or 4 Children | 128 (64.0%) | 181 (44.2%) |
| 5 or more Children | 0 (0.0%) | 0 (0.0%) |
| Total | 283 (16.0%) | 1,041 (27.1%) |
Income Below Poverty Among Married-Couple vs Single-Parent Households in Huntington Park
The poverty data for Huntington Park shows that 587 of the married-couple family households (9.3%) and 1,324 of the single-parent households (23.6%) are living below the poverty level. Within the married-couple family households, those with 3 or 4 children have the highest poverty rate, with 181 households (22.1%) falling below the poverty line. Among the single-parent households, those with 3 or 4 children have the highest poverty rate, with 309 household (50.7%) living below poverty.
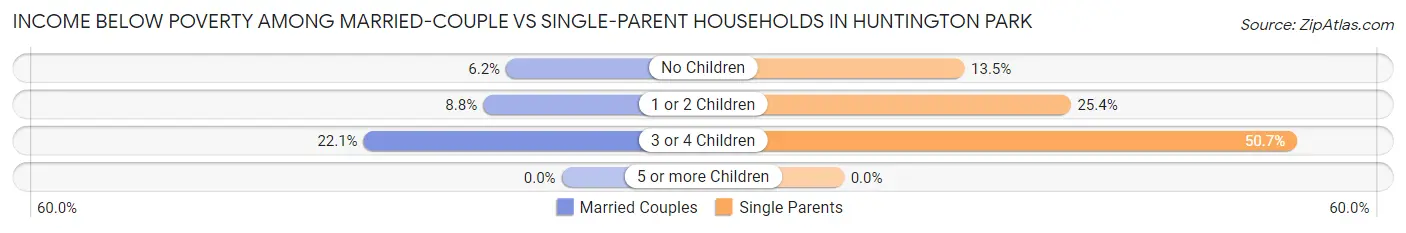
| Children | Married-Couple Families | Single-Parent Households |
| No Children | 174 (6.2%) | 284 (13.5%) |
| 1 or 2 Children | 232 (8.8%) | 731 (25.4%) |
| 3 or 4 Children | 181 (22.1%) | 309 (50.7%) |
| 5 or more Children | 0 (0.0%) | 0 (0.0%) |
| Total | 587 (9.3%) | 1,324 (23.6%) |
Race in Huntington Park
The most populous races in Huntington Park are Hispanic or Latino (52,935 | 97.0%), Some other Race (23,015 | 42.2%), and White / Caucasian (19,033 | 34.9%).
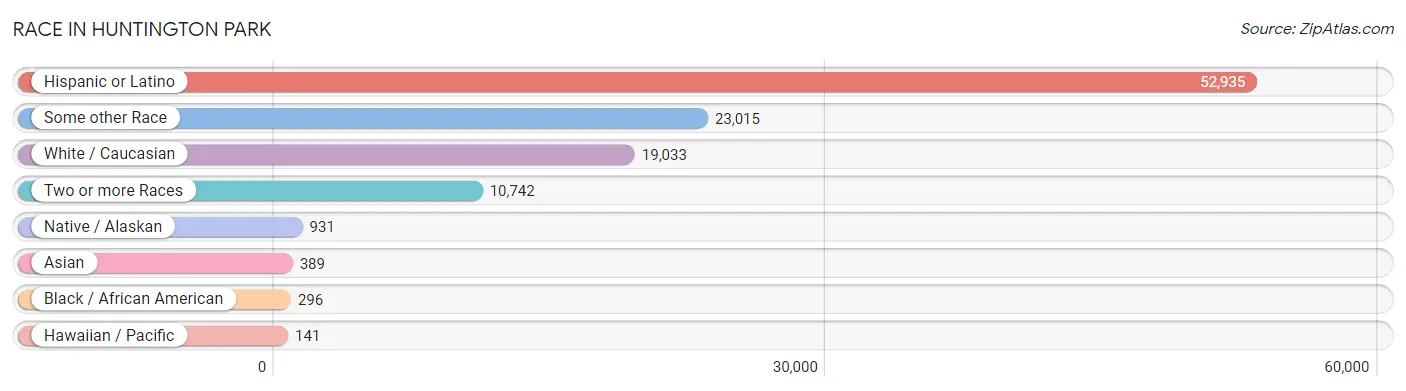
| Race | # Population | % Population |
| Asian | 389 | 0.7% |
| Black / African American | 296 | 0.5% |
| Hawaiian / Pacific | 141 | 0.3% |
| Hispanic or Latino | 52,935 | 97.0% |
| Native / Alaskan | 931 | 1.7% |
| White / Caucasian | 19,033 | 34.9% |
| Two or more Races | 10,742 | 19.7% |
| Some other Race | 23,015 | 42.2% |
| Total | 54,547 | 100.0% |
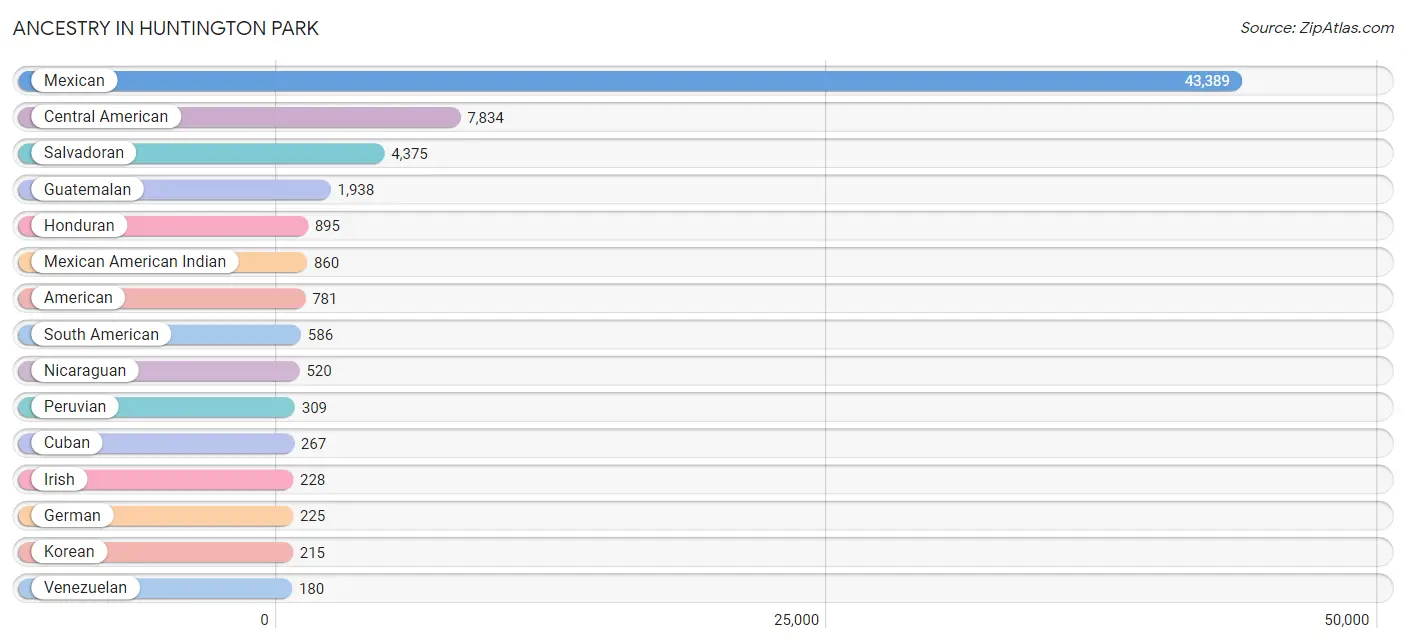
Ancestry in Huntington Park
The most populous ancestries reported in Huntington Park are Mexican (43,389 | 79.5%), Central American (7,834 | 14.4%), Salvadoran (4,375 | 8.0%), Guatemalan (1,938 | 3.5%), and Honduran (895 | 1.6%), together accounting for 107.1% of all Huntington Park residents.
| Ancestry | # Population | % Population |
| African | 2 | 0.0% |
| American | 781 | 1.4% |
| Apache | 13 | 0.0% |
| Arab | 90 | 0.2% |
| Argentinean | 6 | 0.0% |
| Basque | 6 | 0.0% |
| Belgian | 12 | 0.0% |
| Brazilian | 82 | 0.2% |
| Burmese | 35 | 0.1% |
| Central American | 7,834 | 14.4% |
| Central American Indian | 128 | 0.2% |
| Cherokee | 4 | 0.0% |
| Colombian | 44 | 0.1% |
| Costa Rican | 87 | 0.2% |
| Cuban | 267 | 0.5% |
| Dominican | 16 | 0.0% |
| Dutch | 7 | 0.0% |
| Ecuadorian | 47 | 0.1% |
| Egyptian | 9 | 0.0% |
| English | 135 | 0.3% |
| European | 17 | 0.0% |
| French | 89 | 0.2% |
| German | 225 | 0.4% |
| Greek | 12 | 0.0% |
| Guamanian / Chamorro | 18 | 0.0% |
| Guatemalan | 1,938 | 3.5% |
| Honduran | 895 | 1.6% |
| Hungarian | 3 | 0.0% |
| Indian (Asian) | 47 | 0.1% |
| Iranian | 14 | 0.0% |
| Irish | 228 | 0.4% |
| Italian | 43 | 0.1% |
| Japanese | 1 | 0.0% |
| Korean | 215 | 0.4% |
| Laotian | 35 | 0.1% |
| Mexican | 43,389 | 79.5% |
| Mexican American Indian | 860 | 1.6% |
| Native Hawaiian | 72 | 0.1% |
| Navajo | 137 | 0.3% |
| Nicaraguan | 520 | 0.9% |
| Norwegian | 5 | 0.0% |
| Pakistani | 30 | 0.1% |
| Panamanian | 8 | 0.0% |
| Peruvian | 309 | 0.6% |
| Polish | 4 | 0.0% |
| Portuguese | 37 | 0.1% |
| Pueblo | 47 | 0.1% |
| Puerto Rican | 115 | 0.2% |
| Russian | 28 | 0.1% |
| Salvadoran | 4,375 | 8.0% |
| Sioux | 7 | 0.0% |
| South American | 586 | 1.1% |
| Spaniard | 13 | 0.0% |
| Spanish | 68 | 0.1% |
| Spanish American Indian | 26 | 0.1% |
| Sri Lankan | 33 | 0.1% |
| Subsaharan African | 2 | 0.0% |
| Swedish | 15 | 0.0% |
| Syrian | 81 | 0.2% |
| Thai | 20 | 0.0% |
| Venezuelan | 180 | 0.3% |
| Yaqui | 12 | 0.0% | View All 62 Rows |
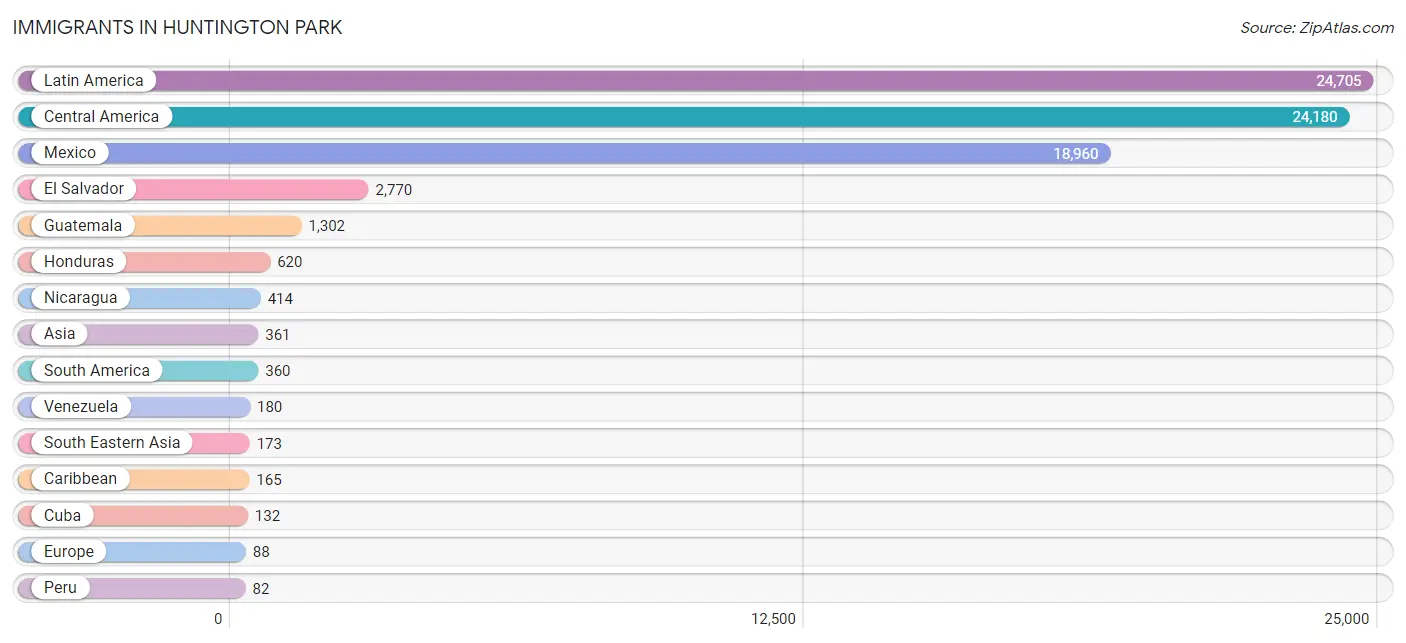
Immigrants in Huntington Park
The most numerous immigrant groups reported in Huntington Park came from Latin America (24,705 | 45.3%), Central America (24,180 | 44.3%), Mexico (18,960 | 34.8%), El Salvador (2,770 | 5.1%), and Guatemala (1,302 | 2.4%), together accounting for 131.9% of all Huntington Park residents.
| Immigration Origin | # Population | % Population |
| Afghanistan | 11 | 0.0% |
| Africa | 5 | 0.0% |
| Argentina | 6 | 0.0% |
| Asia | 361 | 0.7% |
| Brazil | 3 | 0.0% |
| Cambodia | 1 | 0.0% |
| Caribbean | 165 | 0.3% |
| Central America | 24,180 | 44.3% |
| China | 52 | 0.1% |
| Colombia | 35 | 0.1% |
| Costa Rica | 76 | 0.1% |
| Cuba | 132 | 0.2% |
| Dominican Republic | 16 | 0.0% |
| Eastern Asia | 70 | 0.1% |
| Eastern Europe | 33 | 0.1% |
| Ecuador | 54 | 0.1% |
| Egypt | 5 | 0.0% |
| El Salvador | 2,770 | 5.1% |
| Europe | 88 | 0.2% |
| Fiji | 34 | 0.1% |
| France | 6 | 0.0% |
| Germany | 1 | 0.0% |
| Guatemala | 1,302 | 2.4% |
| Honduras | 620 | 1.1% |
| Hong Kong | 9 | 0.0% |
| Hungary | 3 | 0.0% |
| India | 12 | 0.0% |
| Indonesia | 35 | 0.1% |
| Iran | 14 | 0.0% |
| Italy | 16 | 0.0% |
| Jamaica | 17 | 0.0% |
| Korea | 18 | 0.0% |
| Latin America | 24,705 | 45.3% |
| Latvia | 1 | 0.0% |
| Mexico | 18,960 | 34.8% |
| Nicaragua | 414 | 0.8% |
| Northern Africa | 5 | 0.0% |
| Northern Europe | 2 | 0.0% |
| Oceania | 34 | 0.1% |
| Panama | 8 | 0.0% |
| Peru | 82 | 0.2% |
| Philippines | 77 | 0.1% |
| Russia | 5 | 0.0% |
| Scotland | 2 | 0.0% |
| South America | 360 | 0.7% |
| South Central Asia | 37 | 0.1% |
| South Eastern Asia | 173 | 0.3% |
| Southern Europe | 46 | 0.1% |
| Spain | 30 | 0.1% |
| Syria | 81 | 0.2% |
| Thailand | 30 | 0.1% |
| Venezuela | 180 | 0.3% |
| Vietnam | 30 | 0.1% |
| Western Asia | 81 | 0.2% |
| Western Europe | 7 | 0.0% | View All 55 Rows |
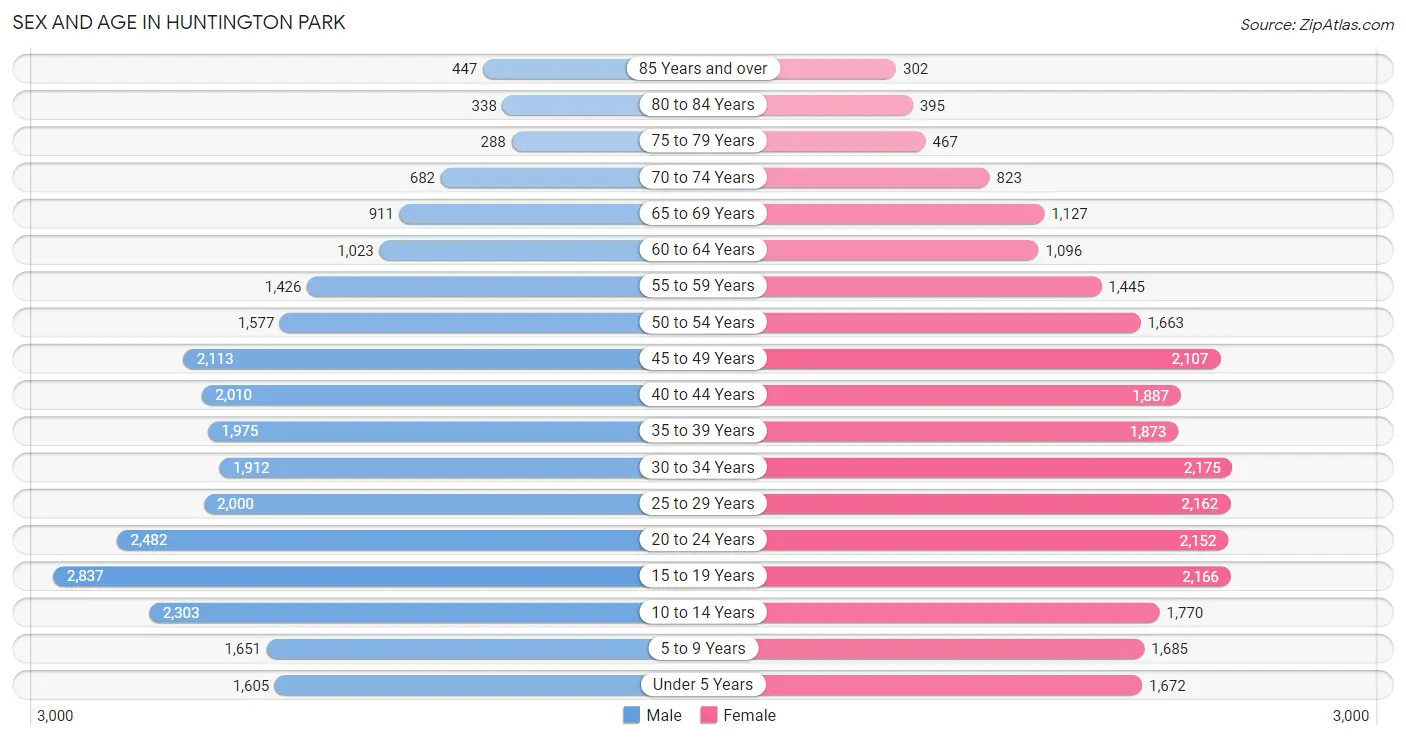
Sex and Age in Huntington Park
Sex and Age in Huntington Park
The most populous age groups in Huntington Park are 15 to 19 Years (2,837 | 10.3%) for men and 30 to 34 Years (2,175 | 8.1%) for women.
| Age Bracket | Male | Female |
| Under 5 Years | 1,605 (5.8%) | 1,672 (6.2%) |
| 5 to 9 Years | 1,651 (6.0%) | 1,685 (6.2%) |
| 10 to 14 Years | 2,303 (8.4%) | 1,770 (6.6%) |
| 15 to 19 Years | 2,837 (10.3%) | 2,166 (8.0%) |
| 20 to 24 Years | 2,482 (9.0%) | 2,152 (8.0%) |
| 25 to 29 Years | 2,000 (7.2%) | 2,162 (8.0%) |
| 30 to 34 Years | 1,912 (6.9%) | 2,175 (8.1%) |
| 35 to 39 Years | 1,975 (7.2%) | 1,873 (7.0%) |
| 40 to 44 Years | 2,010 (7.3%) | 1,887 (7.0%) |
| 45 to 49 Years | 2,113 (7.7%) | 2,107 (7.8%) |
| 50 to 54 Years | 1,577 (5.7%) | 1,663 (6.2%) |
| 55 to 59 Years | 1,426 (5.2%) | 1,445 (5.4%) |
| 60 to 64 Years | 1,023 (3.7%) | 1,096 (4.1%) |
| 65 to 69 Years | 911 (3.3%) | 1,127 (4.2%) |
| 70 to 74 Years | 682 (2.5%) | 823 (3.0%) |
| 75 to 79 Years | 288 (1.0%) | 467 (1.7%) |
| 80 to 84 Years | 338 (1.2%) | 395 (1.5%) |
| 85 Years and over | 447 (1.6%) | 302 (1.1%) |
| Total | 27,580 (100.0%) | 26,967 (100.0%) |
Families and Households in Huntington Park
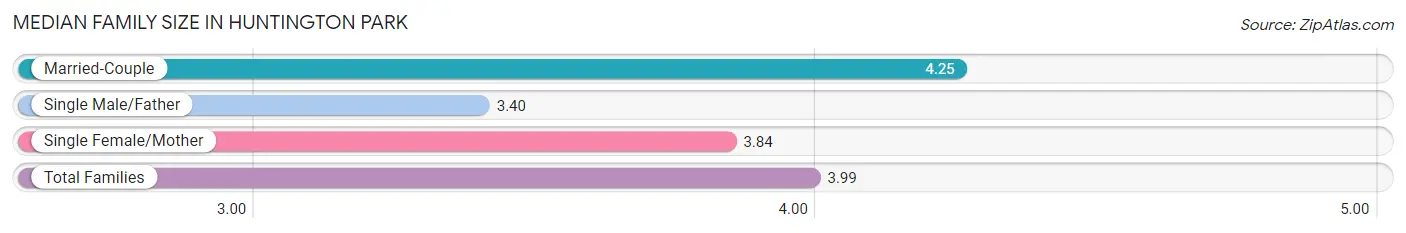
Median Family Size in Huntington Park
The median family size in Huntington Park is 3.99 persons per family, with married-couple families (6,286 | 52.9%) accounting for the largest median family size of 4.25 persons per family. On the other hand, single male/father families (1,765 | 14.8%) represent the smallest median family size with 3.40 persons per family.
| Family Type | # Families | Family Size |
| Married-Couple | 6,286 (52.9%) | 4.25 |
| Single Male/Father | 1,765 (14.8%) | 3.40 |
| Single Female/Mother | 3,839 (32.3%) | 3.84 |
| Total Families | 11,890 (100.0%) | 3.99 |
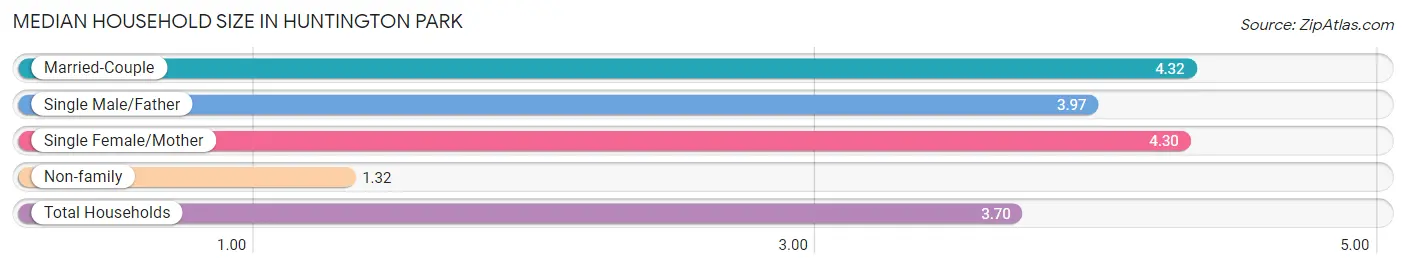
Median Household Size in Huntington Park
The median household size in Huntington Park is 3.70 persons per household, with married-couple households (6,286 | 42.7%) accounting for the largest median household size of 4.32 persons per household. non-family households (2,822 | 19.2%) represent the smallest median household size with 1.32 persons per household.
| Household Type | # Households | Household Size |
| Married-Couple | 6,286 (42.7%) | 4.32 |
| Single Male/Father | 1,765 (12.0%) | 3.97 |
| Single Female/Mother | 3,839 (26.1%) | 4.30 |
| Non-family | 2,822 (19.2%) | 1.32 |
| Total Households | 14,712 (100.0%) | 3.70 |
Household Size by Marriage Status in Huntington Park
Out of a total of 14,712 households in Huntington Park, 11,890 (80.8%) are family households, while 2,822 (19.2%) are nonfamily households. The most numerous type of family households are 3-person households, comprising 3,070, and the most common type of nonfamily households are 1-person households, comprising 2,117.
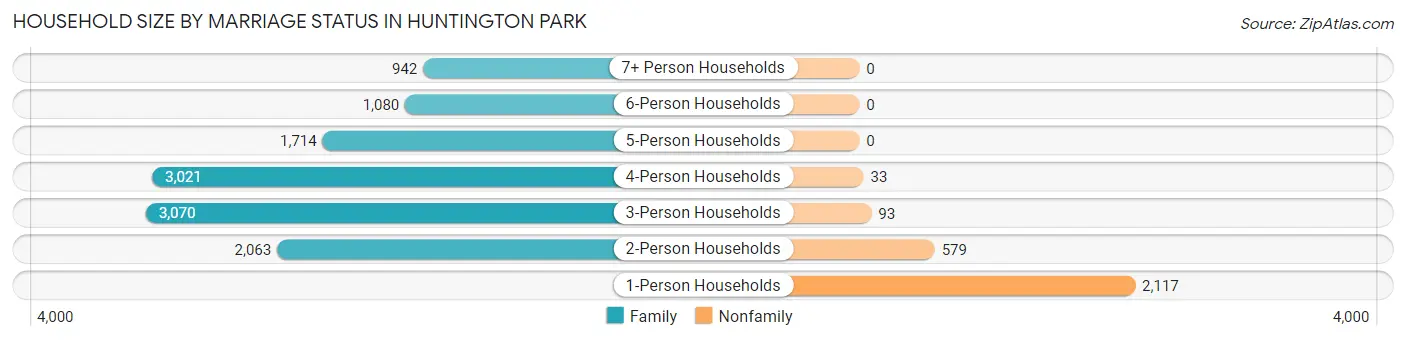
| Household Size | Family Households | Nonfamily Households |
| 1-Person Households | - | 2,117 (14.4%) |
| 2-Person Households | 2,063 (14.0%) | 579 (3.9%) |
| 3-Person Households | 3,070 (20.9%) | 93 (0.6%) |
| 4-Person Households | 3,021 (20.5%) | 33 (0.2%) |
| 5-Person Households | 1,714 (11.7%) | 0 (0.0%) |
| 6-Person Households | 1,080 (7.3%) | 0 (0.0%) |
| 7+ Person Households | 942 (6.4%) | 0 (0.0%) |
| Total | 11,890 (80.8%) | 2,822 (19.2%) |
Female Fertility in Huntington Park
Fertility by Age in Huntington Park
Average fertility rate in Huntington Park is 47.0 births per 1,000 women. Women in the age bracket of 20 to 34 years have the highest fertility rate with 72.0 births per 1,000 women. Women in the age bracket of 20 to 34 years acount for 67.9% of all women with births.
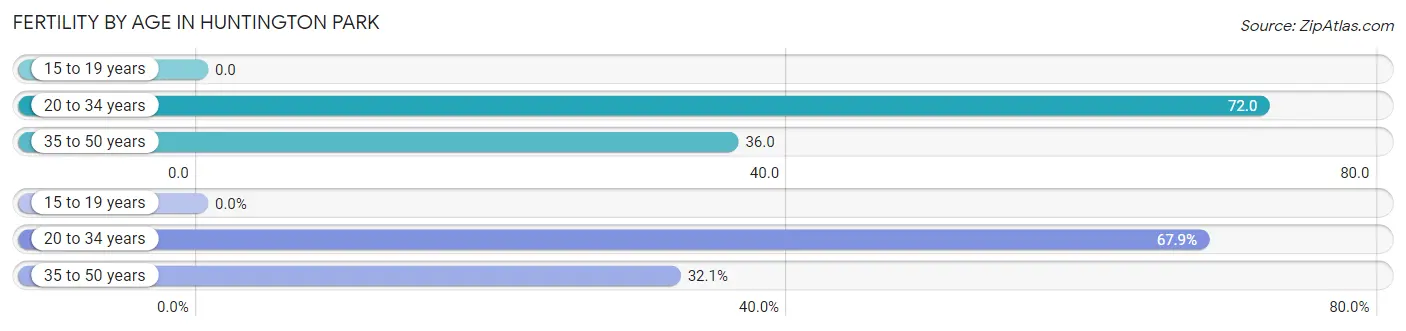
| Age Bracket | Women with Births | Births / 1,000 Women |
| 15 to 19 years | 0 (0.0%) | 0.0 |
| 20 to 34 years | 470 (67.9%) | 72.0 |
| 35 to 50 years | 222 (32.1%) | 36.0 |
| Total | 692 (100.0%) | 47.0 |
Fertility by Age by Marriage Status in Huntington Park
59.1% of women with births (692) in Huntington Park are married. The highest percentage of unmarried women with births falls into 20 to 34 years age bracket with 43.6% of them unmarried at the time of birth, while the lowest percentage of unmarried women with births belong to 35 to 50 years age bracket with 35.1% of them unmarried.
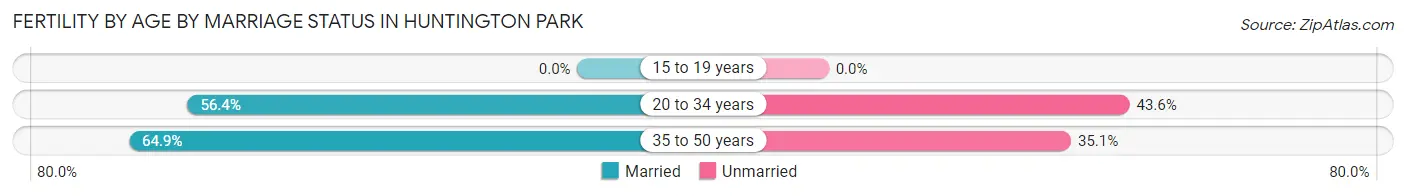
| Age Bracket | Married | Unmarried |
| 15 to 19 years | 0 (0.0%) | 0 (0.0%) |
| 20 to 34 years | 265 (56.4%) | 205 (43.6%) |
| 35 to 50 years | 144 (64.9%) | 78 (35.1%) |
| Total | 409 (59.1%) | 283 (40.9%) |
Fertility by Education in Huntington Park
Average fertility rate in Huntington Park is 47.0 births per 1,000 women. Women with the education attainment of college or associate's degree have the highest fertility rate of 54.0 births per 1,000 women, while women with the education attainment of graduate degree have the lowest fertility at 19.0 births per 1,000 women. Women with the education attainment of college or associate's degree represent 34.8% of all women with births.
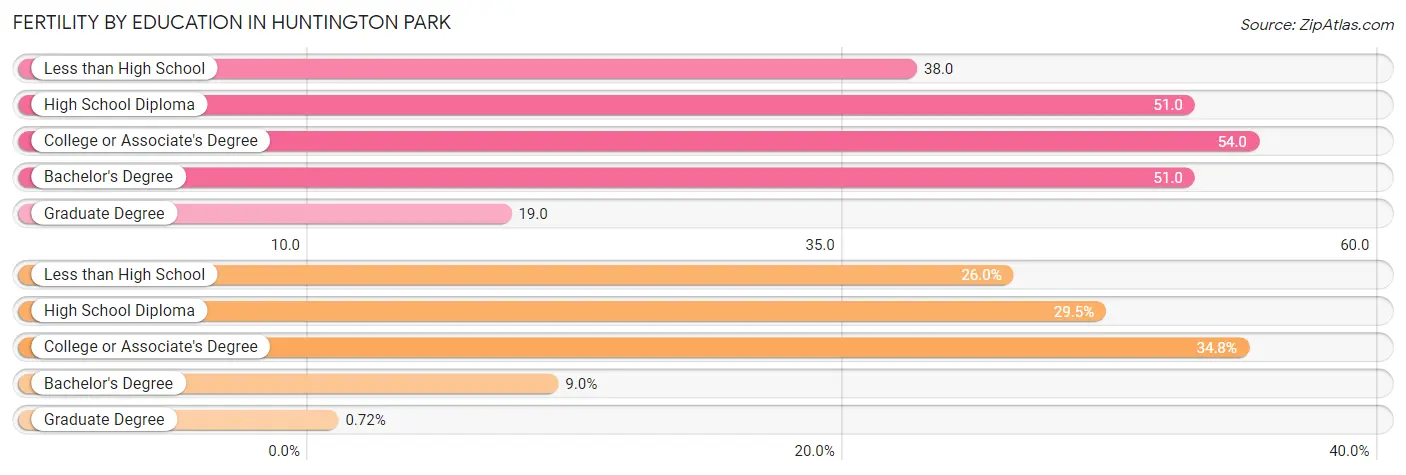
| Educational Attainment | Women with Births | Births / 1,000 Women |
| Less than High School | 180 (26.0%) | 38.0 |
| High School Diploma | 204 (29.5%) | 51.0 |
| College or Associate's Degree | 241 (34.8%) | 54.0 |
| Bachelor's Degree | 62 (9.0%) | 51.0 |
| Graduate Degree | 5 (0.7%) | 19.0 |
| Total | 692 (100.0%) | 47.0 |
Fertility by Education by Marriage Status in Huntington Park
40.9% of women with births in Huntington Park are unmarried. Women with the educational attainment of less than high school are most likely to be married with 77.2% of them married at childbirth, while women with the educational attainment of graduate degree are least likely to be married with 100.0% of them unmarried at childbirth.
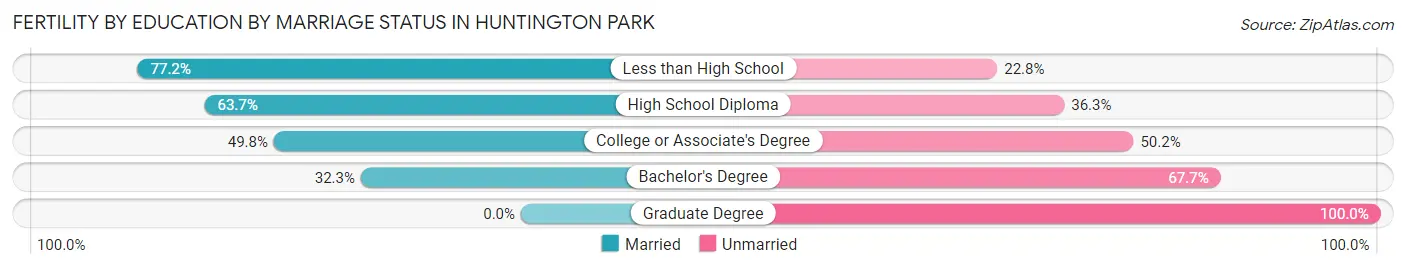
| Educational Attainment | Married | Unmarried |
| Less than High School | 139 (77.2%) | 41 (22.8%) |
| High School Diploma | 130 (63.7%) | 74 (36.3%) |
| College or Associate's Degree | 120 (49.8%) | 121 (50.2%) |
| Bachelor's Degree | 20 (32.3%) | 42 (67.7%) |
| Graduate Degree | 0 (0.0%) | 5 (100.0%) |
| Total | 409 (59.1%) | 283 (40.9%) |
Employment Characteristics in Huntington Park
Employment by Class of Employer in Huntington Park
Among the 24,633 employed individuals in Huntington Park, private company employees (18,773 | 76.2%), self-employed (not incorporated) (1,863 | 7.6%), and local government employees (1,584 | 6.4%) make up the most common classes of employment.
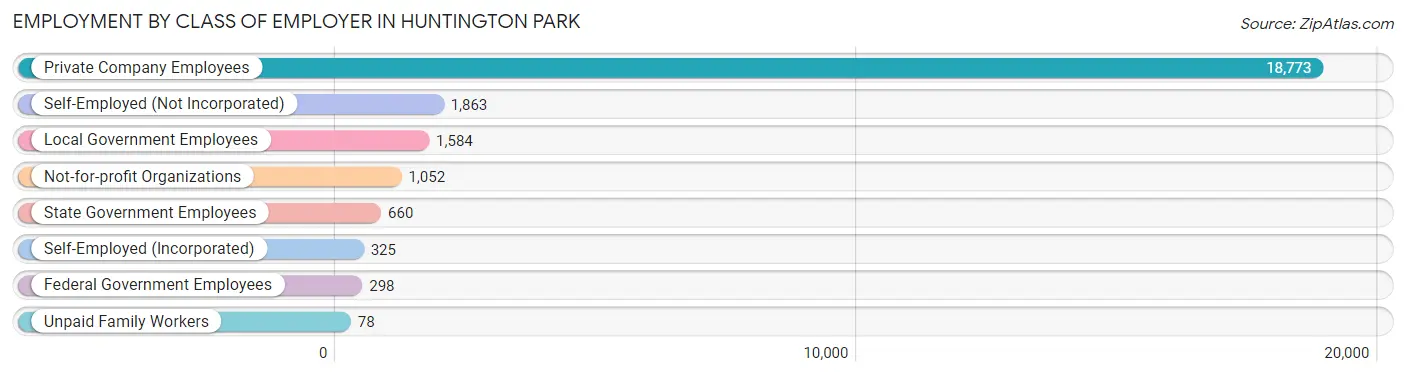
| Employer Class | # Employees | % Employees |
| Private Company Employees | 18,773 | 76.2% |
| Self-Employed (Incorporated) | 325 | 1.3% |
| Self-Employed (Not Incorporated) | 1,863 | 7.6% |
| Not-for-profit Organizations | 1,052 | 4.3% |
| Local Government Employees | 1,584 | 6.4% |
| State Government Employees | 660 | 2.7% |
| Federal Government Employees | 298 | 1.2% |
| Unpaid Family Workers | 78 | 0.3% |
| Total | 24,633 | 100.0% |
Employment Status by Age in Huntington Park
According to the labor force statistics for Huntington Park, out of the total population over 16 years of age (42,814), 65.6% or 28,086 individuals are in the labor force, with 10.1% or 2,837 of them unemployed. The age group with the highest labor force participation rate is 25 to 29 years, with 85.2% or 3,546 individuals in the labor force. Within the labor force, the 16 to 19 years age range has the highest percentage of unemployed individuals, with 55.3% or 812 of them being unemployed.
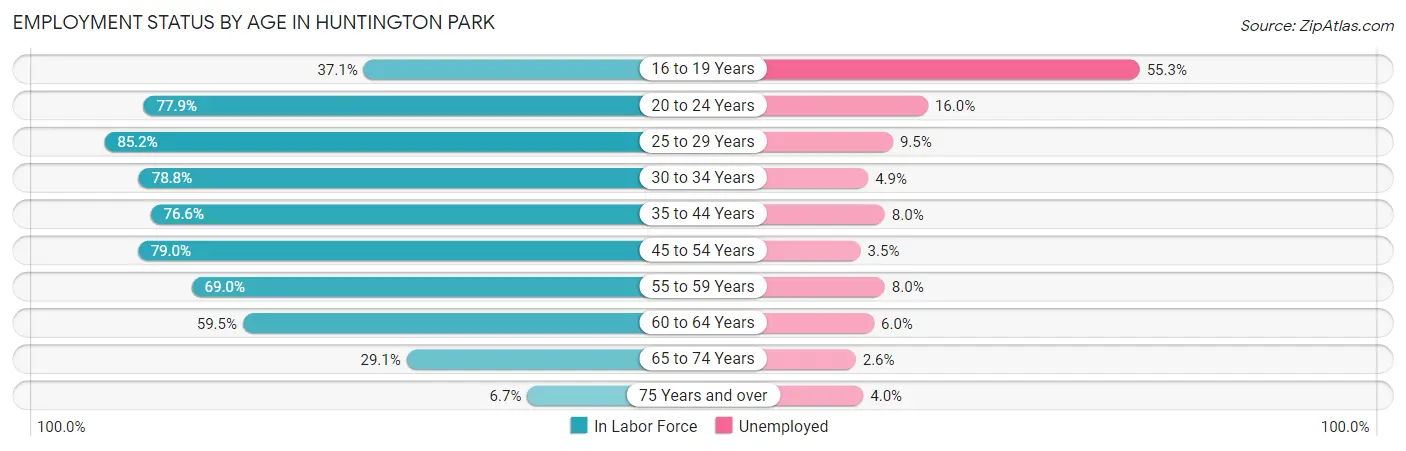
| Age Bracket | In Labor Force | Unemployed |
| 16 to 19 Years | 1,468 (37.1%) | 812 (55.3%) |
| 20 to 24 Years | 3,610 (77.9%) | 578 (16.0%) |
| 25 to 29 Years | 3,546 (85.2%) | 337 (9.5%) |
| 30 to 34 Years | 3,221 (78.8%) | 158 (4.9%) |
| 35 to 44 Years | 5,933 (76.6%) | 475 (8.0%) |
| 45 to 54 Years | 5,893 (79.0%) | 206 (3.5%) |
| 55 to 59 Years | 1,981 (69.0%) | 158 (8.0%) |
| 60 to 64 Years | 1,261 (59.5%) | 76 (6.0%) |
| 65 to 74 Years | 1,031 (29.1%) | 27 (2.6%) |
| 75 Years and over | 150 (6.7%) | 6 (4.0%) |
| Total | 28,086 (65.6%) | 2,837 (10.1%) |
Employment Status by Educational Attainment in Huntington Park
According to labor force statistics for Huntington Park, 76.8% of individuals (21,845) out of the total population between 25 and 64 years of age (28,444) are in the labor force, with 6.5% or 1,420 of them being unemployed. The group with the highest labor force participation rate are those with the educational attainment of bachelor's degree or higher, with 88.9% or 2,182 individuals in the labor force. Within the labor force, individuals with college / associate degree education have the highest percentage of unemployment, with 7.9% or 392 of them being unemployed.
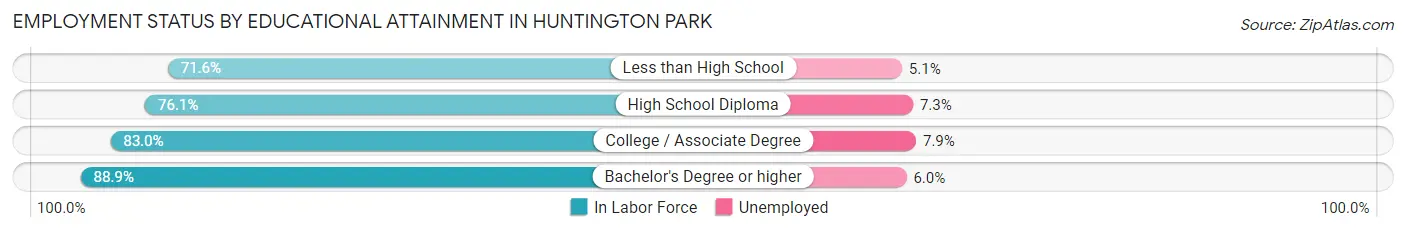
| Educational Attainment | In Labor Force | Unemployed |
| Less than High School | 8,573 (71.6%) | 611 (5.1%) |
| High School Diploma | 6,121 (76.1%) | 587 (7.3%) |
| College / Associate Degree | 4,958 (83.0%) | 472 (7.9%) |
| Bachelor's Degree or higher | 2,182 (88.9%) | 147 (6.0%) |
| Total | 21,845 (76.8%) | 1,849 (6.5%) |
Employment Occupations by Sex in Huntington Park
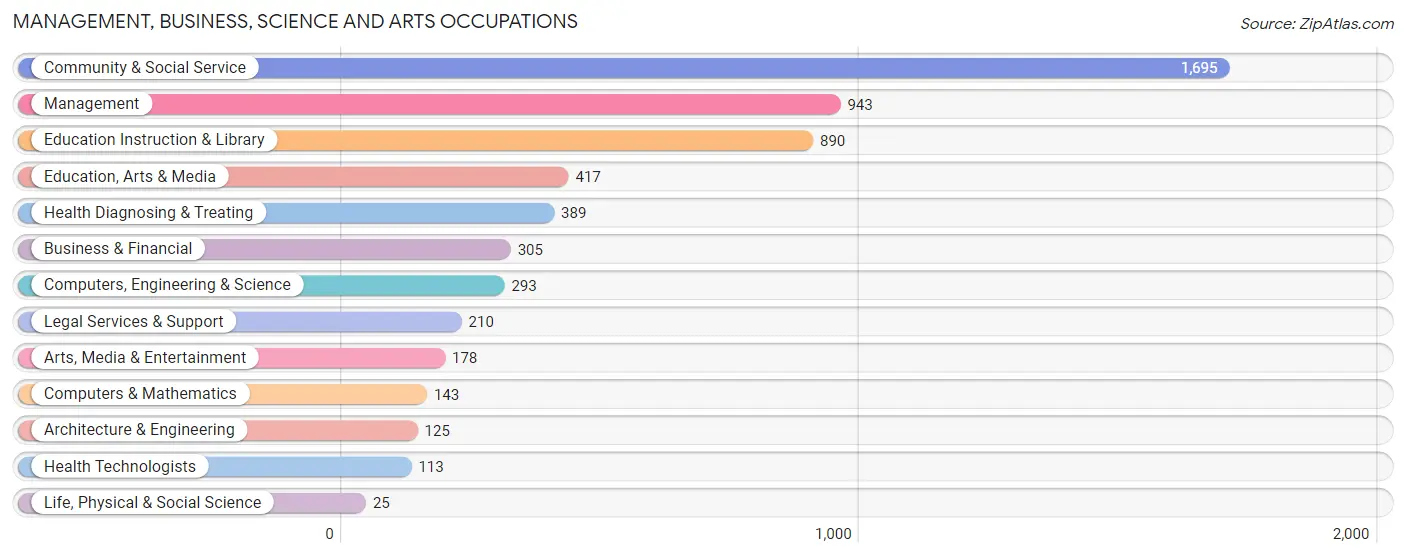
Management, Business, Science and Arts Occupations
The most common Management, Business, Science and Arts occupations in Huntington Park are Community & Social Service (1,695 | 6.7%), Management (943 | 3.7%), Education Instruction & Library (890 | 3.5%), Education, Arts & Media (417 | 1.7%), and Health Diagnosing & Treating (389 | 1.5%).
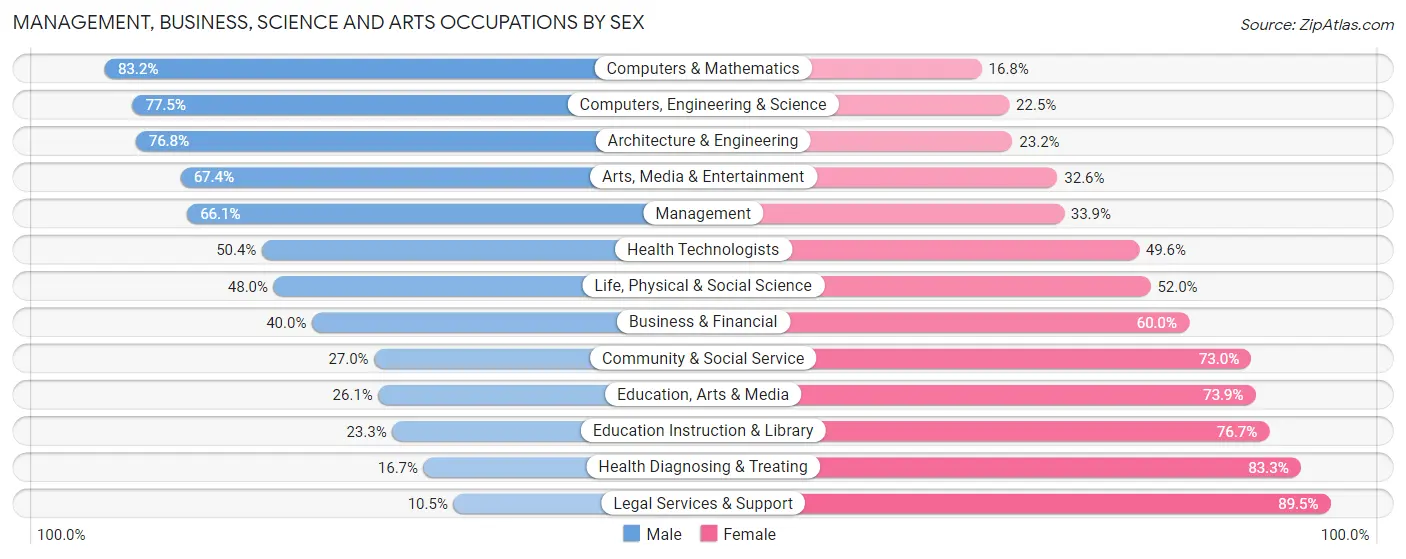
Management, Business, Science and Arts Occupations by Sex
Within the Management, Business, Science and Arts occupations in Huntington Park, the most male-oriented occupations are Computers & Mathematics (83.2%), Computers, Engineering & Science (77.5%), and Architecture & Engineering (76.8%), while the most female-oriented occupations are Legal Services & Support (89.5%), Health Diagnosing & Treating (83.3%), and Education Instruction & Library (76.7%).
| Occupation | Male | Female |
| Management | 623 (66.1%) | 320 (33.9%) |
| Business & Financial | 122 (40.0%) | 183 (60.0%) |
| Computers, Engineering & Science | 227 (77.5%) | 66 (22.5%) |
| Computers & Mathematics | 119 (83.2%) | 24 (16.8%) |
| Architecture & Engineering | 96 (76.8%) | 29 (23.2%) |
| Life, Physical & Social Science | 12 (48.0%) | 13 (52.0%) |
| Community & Social Service | 458 (27.0%) | 1,237 (73.0%) |
| Education, Arts & Media | 109 (26.1%) | 308 (73.9%) |
| Legal Services & Support | 22 (10.5%) | 188 (89.5%) |
| Education Instruction & Library | 207 (23.3%) | 683 (76.7%) |
| Arts, Media & Entertainment | 120 (67.4%) | 58 (32.6%) |
| Health Diagnosing & Treating | 65 (16.7%) | 324 (83.3%) |
| Health Technologists | 57 (50.4%) | 56 (49.6%) |
| Total (Category) | 1,495 (41.2%) | 2,130 (58.8%) |
| Total (Overall) | 14,177 (56.2%) | 11,059 (43.8%) |
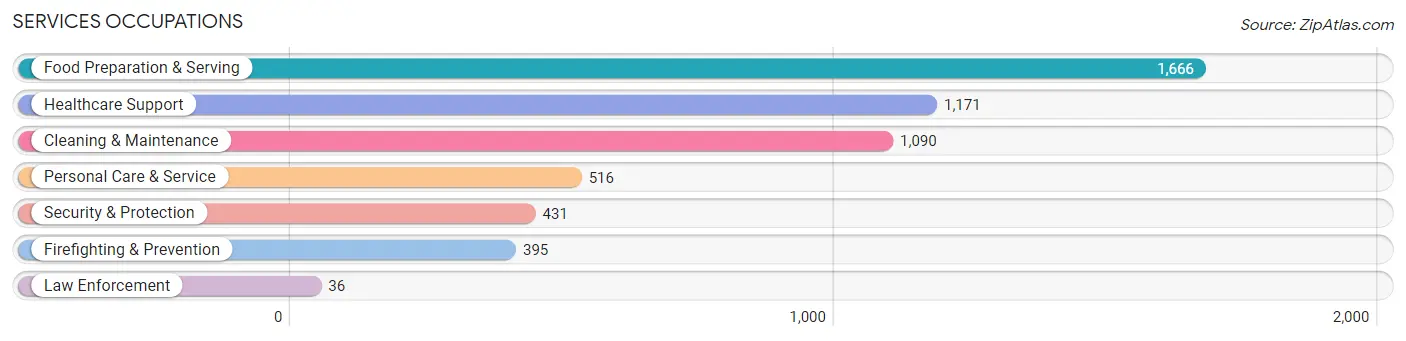
Services Occupations
The most common Services occupations in Huntington Park are Food Preparation & Serving (1,666 | 6.6%), Healthcare Support (1,171 | 4.6%), Cleaning & Maintenance (1,090 | 4.3%), Personal Care & Service (516 | 2.0%), and Security & Protection (431 | 1.7%).
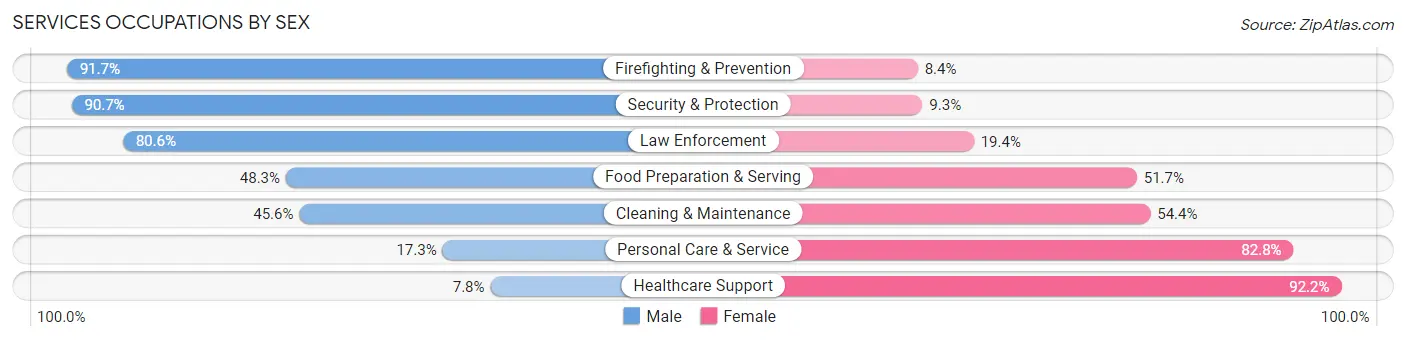
Services Occupations by Sex
Within the Services occupations in Huntington Park, the most male-oriented occupations are Firefighting & Prevention (91.6%), Security & Protection (90.7%), and Law Enforcement (80.6%), while the most female-oriented occupations are Healthcare Support (92.2%), Personal Care & Service (82.8%), and Cleaning & Maintenance (54.4%).
| Occupation | Male | Female |
| Healthcare Support | 91 (7.8%) | 1,080 (92.2%) |
| Security & Protection | 391 (90.7%) | 40 (9.3%) |
| Firefighting & Prevention | 362 (91.6%) | 33 (8.4%) |
| Law Enforcement | 29 (80.6%) | 7 (19.4%) |
| Food Preparation & Serving | 804 (48.3%) | 862 (51.7%) |
| Cleaning & Maintenance | 497 (45.6%) | 593 (54.4%) |
| Personal Care & Service | 89 (17.2%) | 427 (82.8%) |
| Total (Category) | 1,872 (38.4%) | 3,002 (61.6%) |
| Total (Overall) | 14,177 (56.2%) | 11,059 (43.8%) |
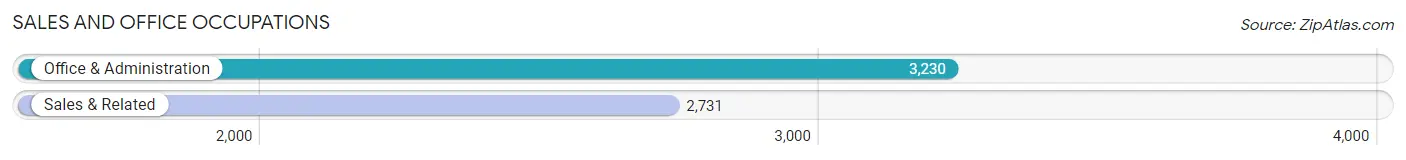
Sales and Office Occupations
The most common Sales and Office occupations in Huntington Park are Office & Administration (3,230 | 12.8%), and Sales & Related (2,731 | 10.8%).
Sales and Office Occupations by Sex
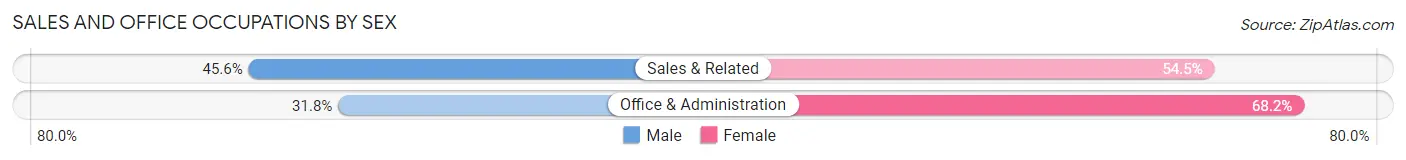
| Occupation | Male | Female |
| Sales & Related | 1,244 (45.6%) | 1,487 (54.4%) |
| Office & Administration | 1,026 (31.8%) | 2,204 (68.2%) |
| Total (Category) | 2,270 (38.1%) | 3,691 (61.9%) |
| Total (Overall) | 14,177 (56.2%) | 11,059 (43.8%) |
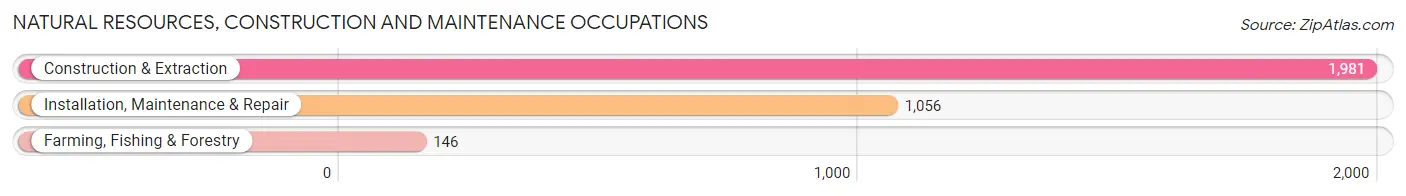
Natural Resources, Construction and Maintenance Occupations
The most common Natural Resources, Construction and Maintenance occupations in Huntington Park are Construction & Extraction (1,981 | 7.9%), Installation, Maintenance & Repair (1,056 | 4.2%), and Farming, Fishing & Forestry (146 | 0.6%).
Natural Resources, Construction and Maintenance Occupations by Sex
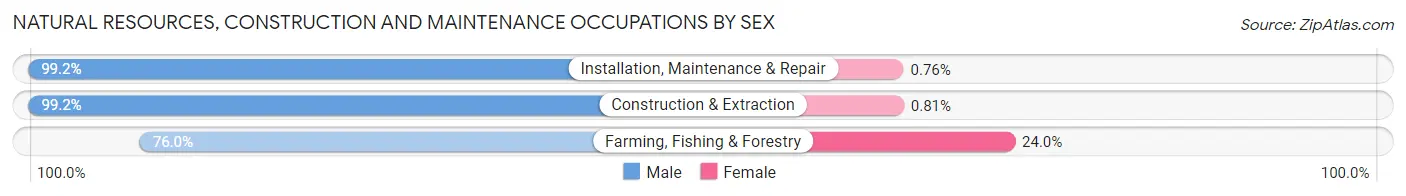
| Occupation | Male | Female |
| Farming, Fishing & Forestry | 111 (76.0%) | 35 (24.0%) |
| Construction & Extraction | 1,965 (99.2%) | 16 (0.8%) |
| Installation, Maintenance & Repair | 1,048 (99.2%) | 8 (0.8%) |
| Total (Category) | 3,124 (98.2%) | 59 (1.8%) |
| Total (Overall) | 14,177 (56.2%) | 11,059 (43.8%) |
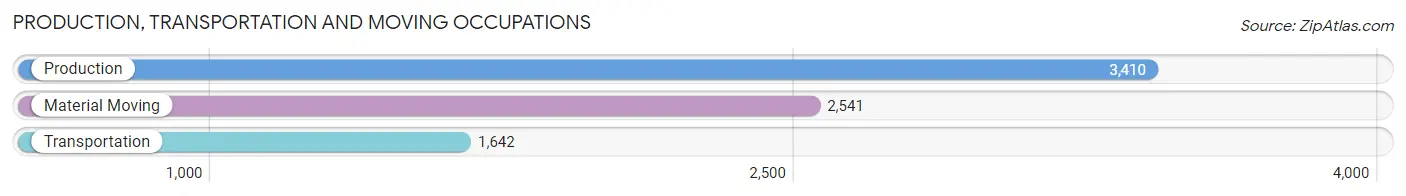
Production, Transportation and Moving Occupations
The most common Production, Transportation and Moving occupations in Huntington Park are Production (3,410 | 13.5%), Material Moving (2,541 | 10.1%), and Transportation (1,642 | 6.5%).
Production, Transportation and Moving Occupations by Sex
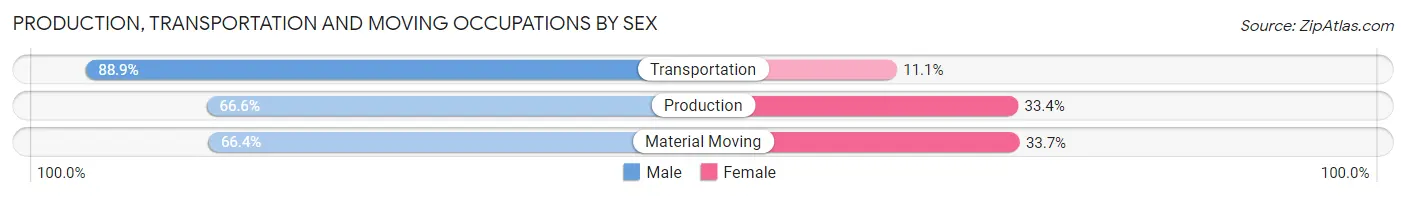
| Occupation | Male | Female |
| Production | 2,271 (66.6%) | 1,139 (33.4%) |
| Transportation | 1,459 (88.9%) | 183 (11.1%) |
| Material Moving | 1,686 (66.3%) | 855 (33.7%) |
| Total (Category) | 5,416 (71.3%) | 2,177 (28.7%) |
| Total (Overall) | 14,177 (56.2%) | 11,059 (43.8%) |
Employment Industries by Sex in Huntington Park
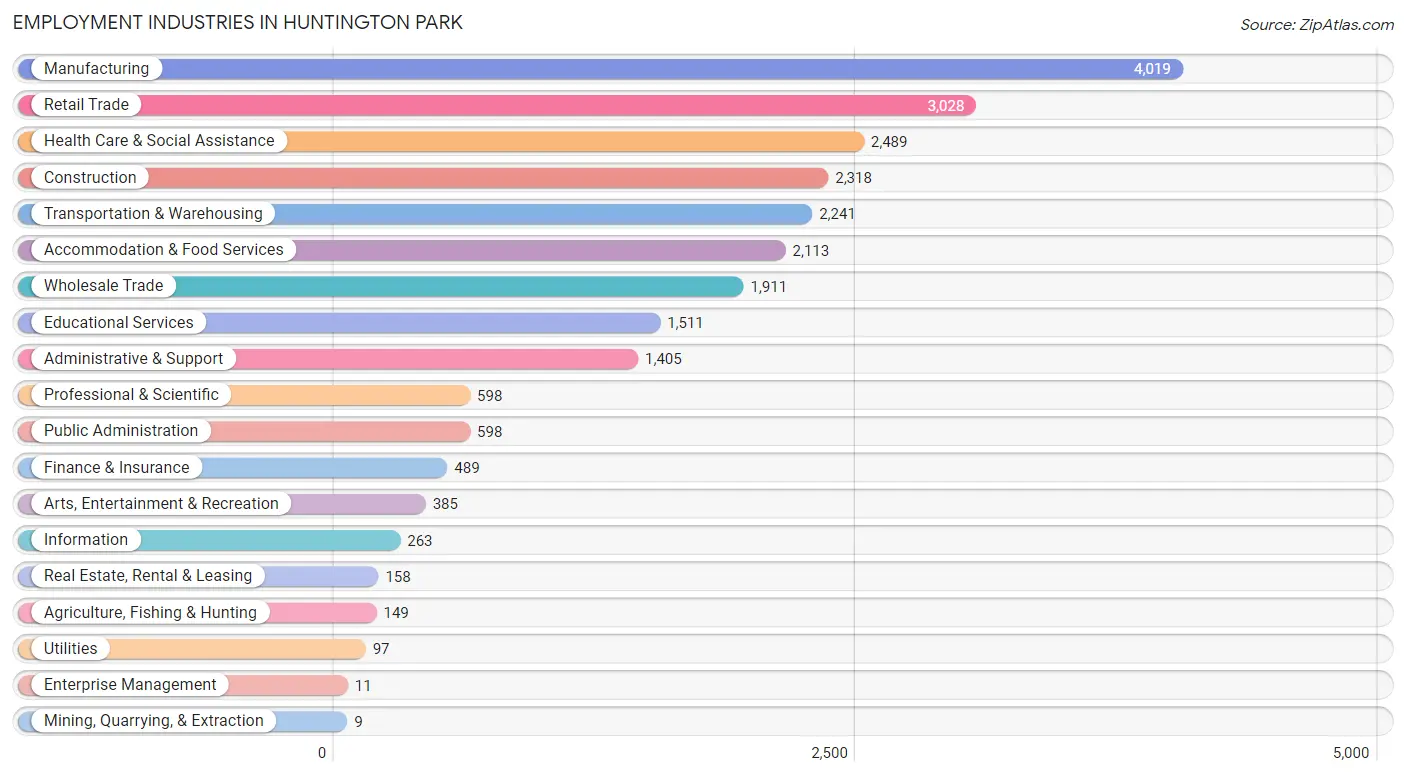
Employment Industries in Huntington Park
The major employment industries in Huntington Park include Manufacturing (4,019 | 15.9%), Retail Trade (3,028 | 12.0%), Health Care & Social Assistance (2,489 | 9.9%), Construction (2,318 | 9.2%), and Transportation & Warehousing (2,241 | 8.9%).
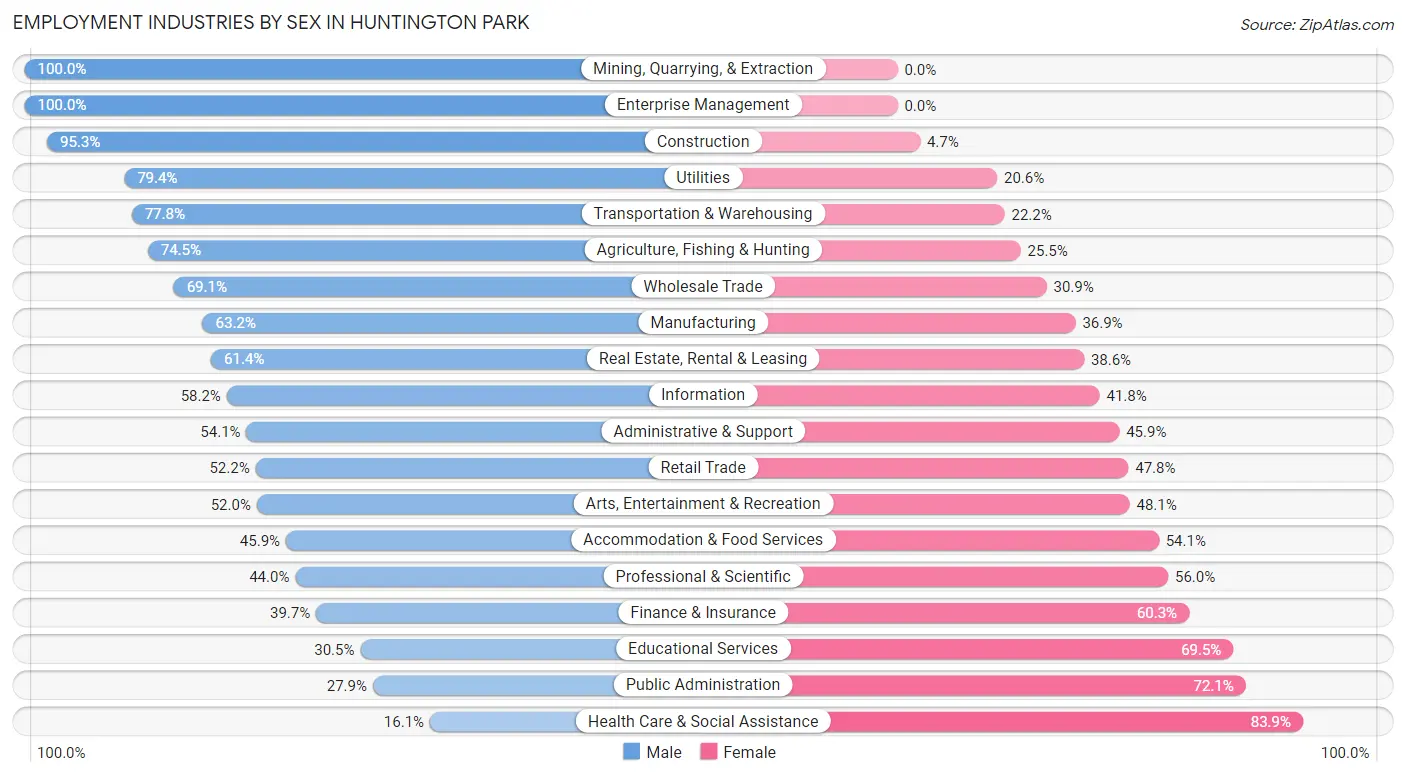
Employment Industries by Sex in Huntington Park
The Huntington Park industries that see more men than women are Mining, Quarrying, & Extraction (100.0%), Enterprise Management (100.0%), and Construction (95.3%), whereas the industries that tend to have a higher number of women are Health Care & Social Assistance (83.9%), Public Administration (72.1%), and Educational Services (69.5%).
| Industry | Male | Female |
| Agriculture, Fishing & Hunting | 111 (74.5%) | 38 (25.5%) |
| Mining, Quarrying, & Extraction | 9 (100.0%) | 0 (0.0%) |
| Construction | 2,210 (95.3%) | 108 (4.7%) |
| Manufacturing | 2,538 (63.1%) | 1,481 (36.8%) |
| Wholesale Trade | 1,321 (69.1%) | 590 (30.9%) |
| Retail Trade | 1,581 (52.2%) | 1,447 (47.8%) |
| Transportation & Warehousing | 1,744 (77.8%) | 497 (22.2%) |
| Utilities | 77 (79.4%) | 20 (20.6%) |
| Information | 153 (58.2%) | 110 (41.8%) |
| Finance & Insurance | 194 (39.7%) | 295 (60.3%) |
| Real Estate, Rental & Leasing | 97 (61.4%) | 61 (38.6%) |
| Professional & Scientific | 263 (44.0%) | 335 (56.0%) |
| Enterprise Management | 11 (100.0%) | 0 (0.0%) |
| Administrative & Support | 760 (54.1%) | 645 (45.9%) |
| Educational Services | 461 (30.5%) | 1,050 (69.5%) |
| Health Care & Social Assistance | 401 (16.1%) | 2,088 (83.9%) |
| Arts, Entertainment & Recreation | 200 (51.9%) | 185 (48.0%) |
| Accommodation & Food Services | 970 (45.9%) | 1,143 (54.1%) |
| Public Administration | 167 (27.9%) | 431 (72.1%) |
| Total | 14,177 (56.2%) | 11,059 (43.8%) |
Education in Huntington Park
School Enrollment in Huntington Park
The most common levels of schooling among the 15,125 students in Huntington Park are high school (3,952 | 26.1%), college / undergraduate (3,767 | 24.9%), and middle school (3,053 | 20.2%).
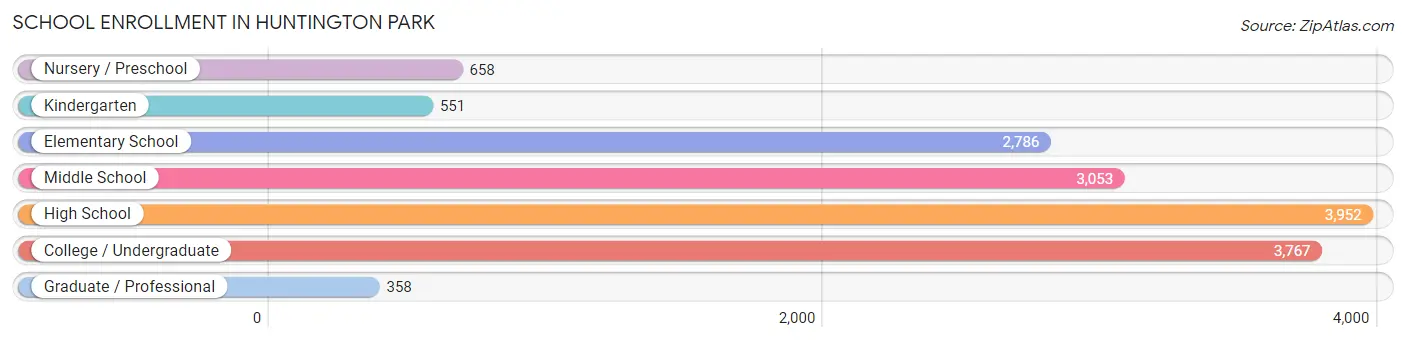
| School Level | # Students | % Students |
| Nursery / Preschool | 658 | 4.3% |
| Kindergarten | 551 | 3.6% |
| Elementary School | 2,786 | 18.4% |
| Middle School | 3,053 | 20.2% |
| High School | 3,952 | 26.1% |
| College / Undergraduate | 3,767 | 24.9% |
| Graduate / Professional | 358 | 2.4% |
| Total | 15,125 | 100.0% |
School Enrollment by Age by Funding Source in Huntington Park
Out of a total of 15,125 students who are enrolled in schools in Huntington Park, 1,013 (6.7%) attend a private institution, while the remaining 14,112 (93.3%) are enrolled in public schools. The age group of 18 to 19 year olds has the highest likelihood of being enrolled in private schools, with 310 (22.8% in the age bracket) enrolled. Conversely, the age group of 15 to 17 year olds has the lowest likelihood of being enrolled in a private school, with 2,807 (98.9% in the age bracket) attending a public institution.
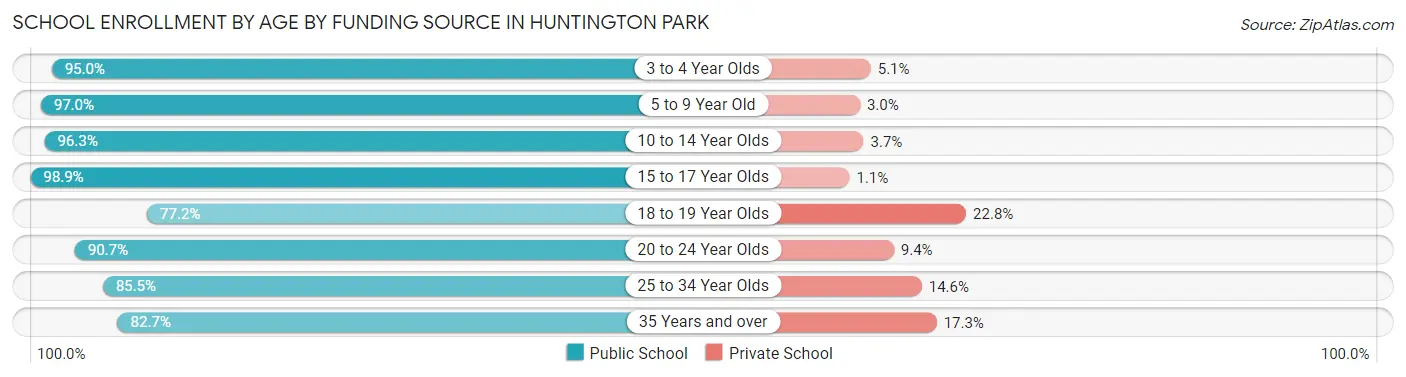
| Age Bracket | Public School | Private School |
| 3 to 4 Year Olds | 470 (95.0%) | 25 (5.1%) |
| 5 to 9 Year Old | 3,042 (97.0%) | 95 (3.0%) |
| 10 to 14 Year Olds | 3,841 (96.3%) | 148 (3.7%) |
| 15 to 17 Year Olds | 2,807 (98.9%) | 31 (1.1%) |
| 18 to 19 Year Olds | 1,049 (77.2%) | 310 (22.8%) |
| 20 to 24 Year Olds | 1,599 (90.6%) | 165 (9.3%) |
| 25 to 34 Year Olds | 934 (85.5%) | 159 (14.5%) |
| 35 Years and over | 372 (82.7%) | 78 (17.3%) |
| Total | 14,112 (93.3%) | 1,013 (6.7%) |
Educational Attainment by Field of Study in Huntington Park
Business (515 | 18.4%), social sciences (374 | 13.4%), education (318 | 11.4%), arts & humanities (308 | 11.0%), and engineering (230 | 8.2%) are the most common fields of study among 2,799 individuals in Huntington Park who have obtained a bachelor's degree or higher.
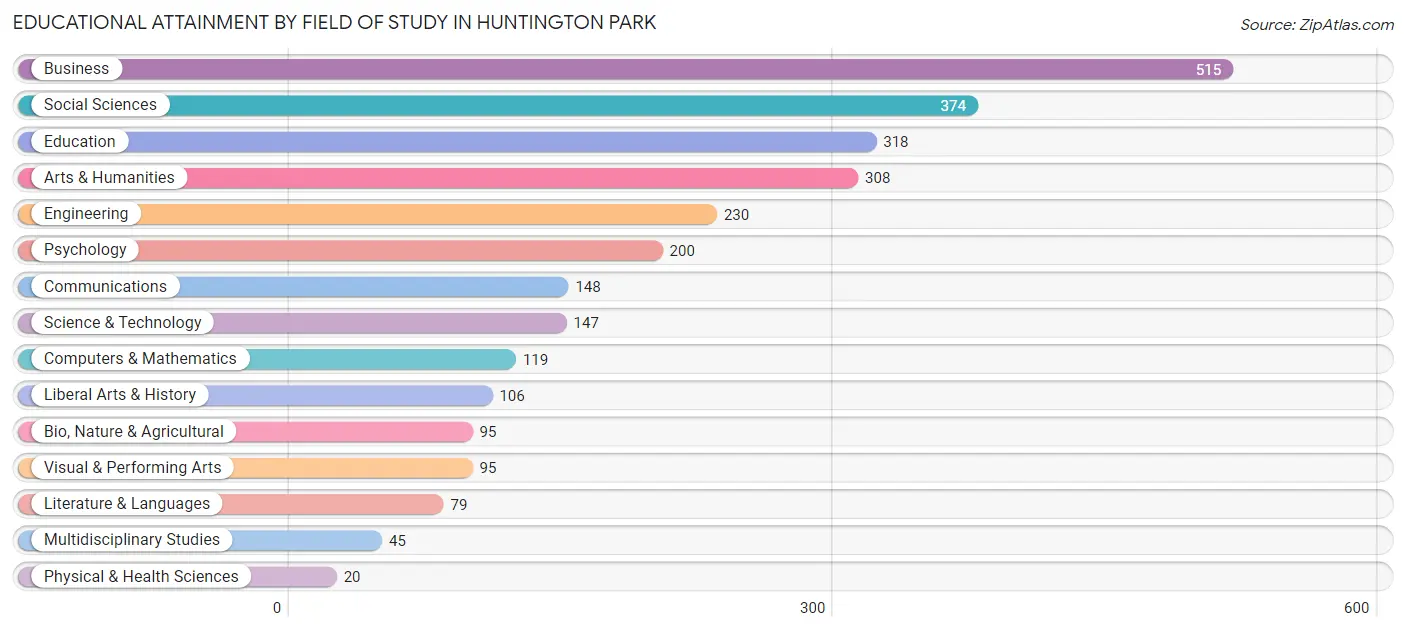
| Field of Study | # Graduates | % Graduates |
| Computers & Mathematics | 119 | 4.3% |
| Bio, Nature & Agricultural | 95 | 3.4% |
| Physical & Health Sciences | 20 | 0.7% |
| Psychology | 200 | 7.1% |
| Social Sciences | 374 | 13.4% |
| Engineering | 230 | 8.2% |
| Multidisciplinary Studies | 45 | 1.6% |
| Science & Technology | 147 | 5.2% |
| Business | 515 | 18.4% |
| Education | 318 | 11.4% |
| Literature & Languages | 79 | 2.8% |
| Liberal Arts & History | 106 | 3.8% |
| Visual & Performing Arts | 95 | 3.4% |
| Communications | 148 | 5.3% |
| Arts & Humanities | 308 | 11.0% |
| Total | 2,799 | 100.0% |
Transportation & Commute in Huntington Park
Vehicle Availability by Sex in Huntington Park
The most prevalent vehicle ownership categories in Huntington Park are males with 2 vehicles (4,812, accounting for 34.4%) and females with 2 vehicles (3,446, making up 45.3%).
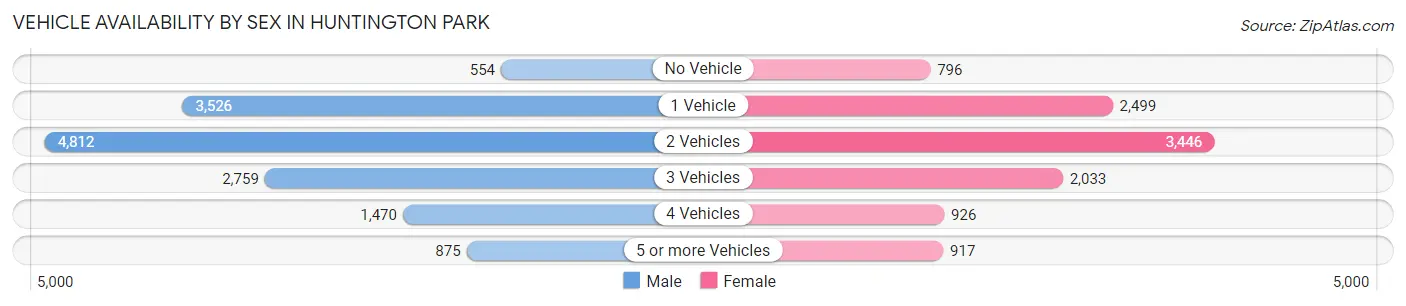
| Vehicles Available | Male | Female |
| No Vehicle | 554 (4.0%) | 796 (7.5%) |
| 1 Vehicle | 3,526 (25.2%) | 2,499 (23.5%) |
| 2 Vehicles | 4,812 (34.4%) | 3,446 (32.5%) |
| 3 Vehicles | 2,759 (19.7%) | 2,033 (19.2%) |
| 4 Vehicles | 1,470 (10.5%) | 926 (8.7%) |
| 5 or more Vehicles | 875 (6.2%) | 917 (8.6%) |
| Total | 13,996 (100.0%) | 10,617 (100.0%) |
Commute Time in Huntington Park
The most frequently occuring commute durations in Huntington Park are 30 to 34 minutes (4,610 commuters, 19.8%), 15 to 19 minutes (2,951 commuters, 12.7%), and 20 to 24 minutes (2,920 commuters, 12.5%).
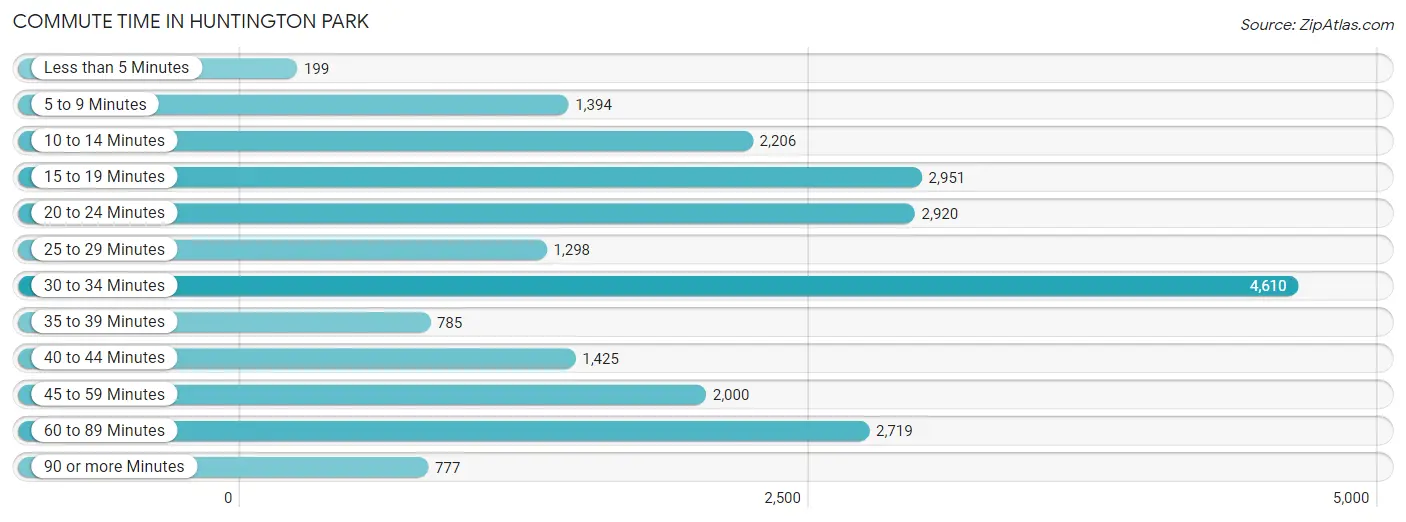
| Commute Time | # Commuters | % Commuters |
| Less than 5 Minutes | 199 | 0.9% |
| 5 to 9 Minutes | 1,394 | 6.0% |
| 10 to 14 Minutes | 2,206 | 9.5% |
| 15 to 19 Minutes | 2,951 | 12.7% |
| 20 to 24 Minutes | 2,920 | 12.5% |
| 25 to 29 Minutes | 1,298 | 5.6% |
| 30 to 34 Minutes | 4,610 | 19.8% |
| 35 to 39 Minutes | 785 | 3.4% |
| 40 to 44 Minutes | 1,425 | 6.1% |
| 45 to 59 Minutes | 2,000 | 8.6% |
| 60 to 89 Minutes | 2,719 | 11.7% |
| 90 or more Minutes | 777 | 3.3% |
Commute Time by Sex in Huntington Park
The most common commute times in Huntington Park are 30 to 34 minutes (2,568 commuters, 18.9%) for males and 30 to 34 minutes (2,042 commuters, 21.0%) for females.
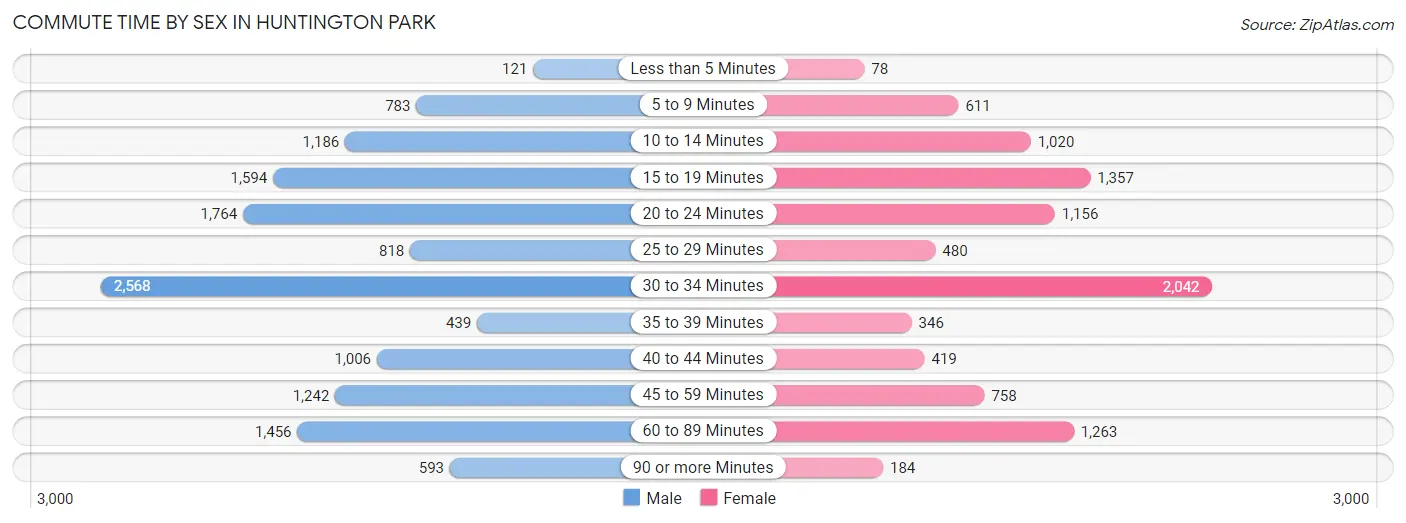
| Commute Time | Male | Female |
| Less than 5 Minutes | 121 (0.9%) | 78 (0.8%) |
| 5 to 9 Minutes | 783 (5.8%) | 611 (6.3%) |
| 10 to 14 Minutes | 1,186 (8.7%) | 1,020 (10.5%) |
| 15 to 19 Minutes | 1,594 (11.7%) | 1,357 (14.0%) |
| 20 to 24 Minutes | 1,764 (13.0%) | 1,156 (11.9%) |
| 25 to 29 Minutes | 818 (6.0%) | 480 (4.9%) |
| 30 to 34 Minutes | 2,568 (18.9%) | 2,042 (21.0%) |
| 35 to 39 Minutes | 439 (3.2%) | 346 (3.6%) |
| 40 to 44 Minutes | 1,006 (7.4%) | 419 (4.3%) |
| 45 to 59 Minutes | 1,242 (9.1%) | 758 (7.8%) |
| 60 to 89 Minutes | 1,456 (10.7%) | 1,263 (13.0%) |
| 90 or more Minutes | 593 (4.4%) | 184 (1.9%) |
Time of Departure to Work by Sex in Huntington Park
The most frequent times of departure to work in Huntington Park are 12:00 AM to 4:59 AM (1,735, 12.8%) for males and 7:00 AM to 7:29 AM (1,727, 17.8%) for females.
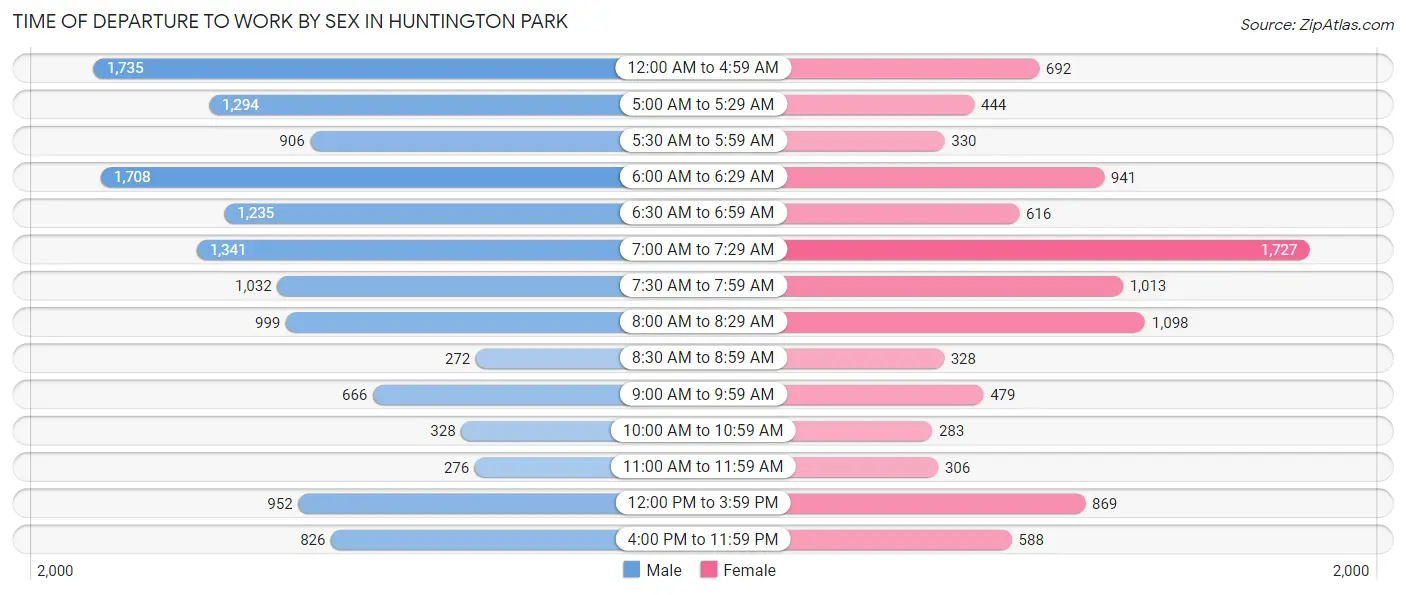
| Time of Departure | Male | Female |
| 12:00 AM to 4:59 AM | 1,735 (12.8%) | 692 (7.1%) |
| 5:00 AM to 5:29 AM | 1,294 (9.5%) | 444 (4.6%) |
| 5:30 AM to 5:59 AM | 906 (6.7%) | 330 (3.4%) |
| 6:00 AM to 6:29 AM | 1,708 (12.6%) | 941 (9.7%) |
| 6:30 AM to 6:59 AM | 1,235 (9.1%) | 616 (6.3%) |
| 7:00 AM to 7:29 AM | 1,341 (9.9%) | 1,727 (17.8%) |
| 7:30 AM to 7:59 AM | 1,032 (7.6%) | 1,013 (10.4%) |
| 8:00 AM to 8:29 AM | 999 (7.4%) | 1,098 (11.3%) |
| 8:30 AM to 8:59 AM | 272 (2.0%) | 328 (3.4%) |
| 9:00 AM to 9:59 AM | 666 (4.9%) | 479 (4.9%) |
| 10:00 AM to 10:59 AM | 328 (2.4%) | 283 (2.9%) |
| 11:00 AM to 11:59 AM | 276 (2.0%) | 306 (3.2%) |
| 12:00 PM to 3:59 PM | 952 (7.0%) | 869 (8.9%) |
| 4:00 PM to 11:59 PM | 826 (6.1%) | 588 (6.0%) |
| Total | 13,570 (100.0%) | 9,714 (100.0%) |
Housing Occupancy in Huntington Park
Occupancy by Ownership in Huntington Park
Of the total 14,712 dwellings in Huntington Park, owner-occupied units account for 3,571 (24.3%), while renter-occupied units make up 11,141 (75.7%).
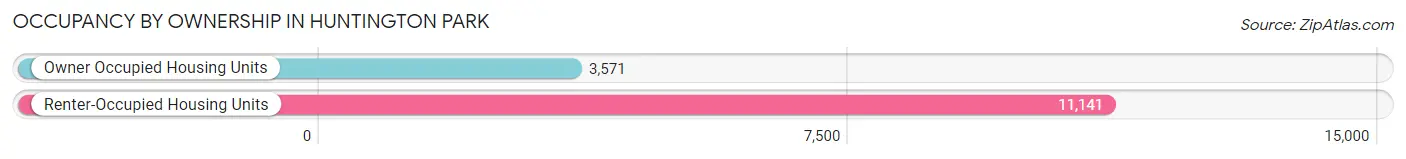
| Occupancy | # Housing Units | % Housing Units |
| Owner Occupied Housing Units | 3,571 | 24.3% |
| Renter-Occupied Housing Units | 11,141 | 75.7% |
| Total Occupied Housing Units | 14,712 | 100.0% |
Occupancy by Household Size in Huntington Park
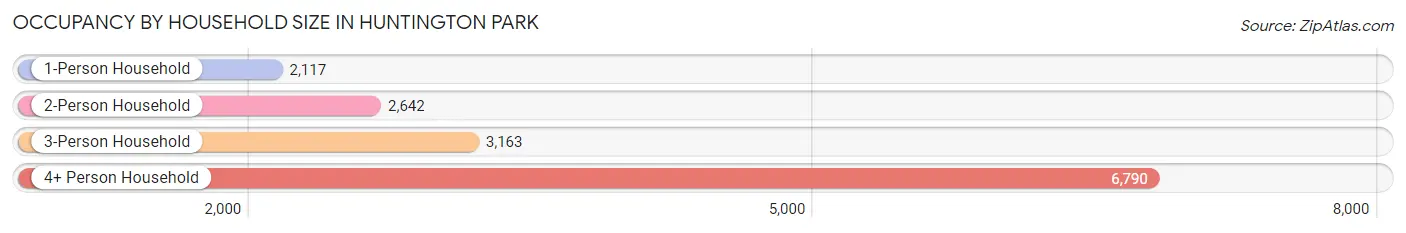
| Household Size | # Housing Units | % Housing Units |
| 1-Person Household | 2,117 | 14.4% |
| 2-Person Household | 2,642 | 18.0% |
| 3-Person Household | 3,163 | 21.5% |
| 4+ Person Household | 6,790 | 46.2% |
| Total Housing Units | 14,712 | 100.0% |
Occupancy by Ownership by Household Size in Huntington Park
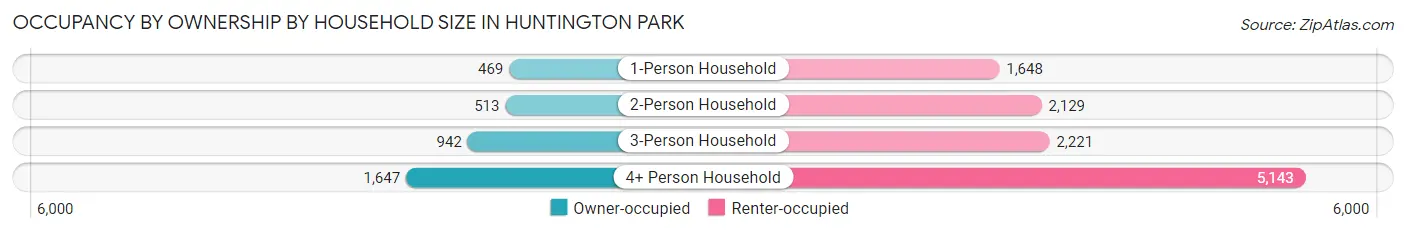
| Household Size | Owner-occupied | Renter-occupied |
| 1-Person Household | 469 (22.2%) | 1,648 (77.8%) |
| 2-Person Household | 513 (19.4%) | 2,129 (80.6%) |
| 3-Person Household | 942 (29.8%) | 2,221 (70.2%) |
| 4+ Person Household | 1,647 (24.3%) | 5,143 (75.7%) |
| Total Housing Units | 3,571 (24.3%) | 11,141 (75.7%) |
Occupancy by Educational Attainment in Huntington Park
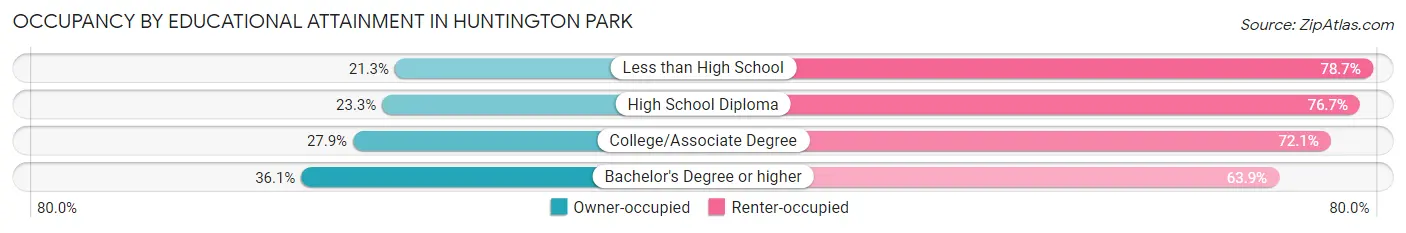
| Household Size | Owner-occupied | Renter-occupied |
| Less than High School | 1,489 (21.3%) | 5,512 (78.7%) |
| High School Diploma | 781 (23.3%) | 2,572 (76.7%) |
| College/Associate Degree | 931 (27.9%) | 2,403 (72.1%) |
| Bachelor's Degree or higher | 370 (36.1%) | 654 (63.9%) |
Occupancy by Age of Householder in Huntington Park
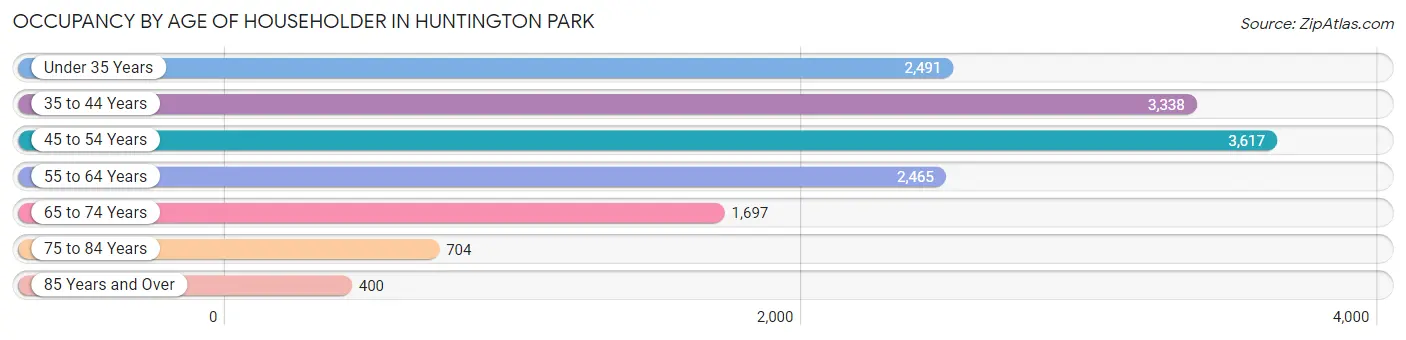
| Age Bracket | # Households | % Households |
| Under 35 Years | 2,491 | 16.9% |
| 35 to 44 Years | 3,338 | 22.7% |
| 45 to 54 Years | 3,617 | 24.6% |
| 55 to 64 Years | 2,465 | 16.8% |
| 65 to 74 Years | 1,697 | 11.5% |
| 75 to 84 Years | 704 | 4.8% |
| 85 Years and Over | 400 | 2.7% |
| Total | 14,712 | 100.0% |
Housing Finances in Huntington Park
Median Income by Occupancy in Huntington Park
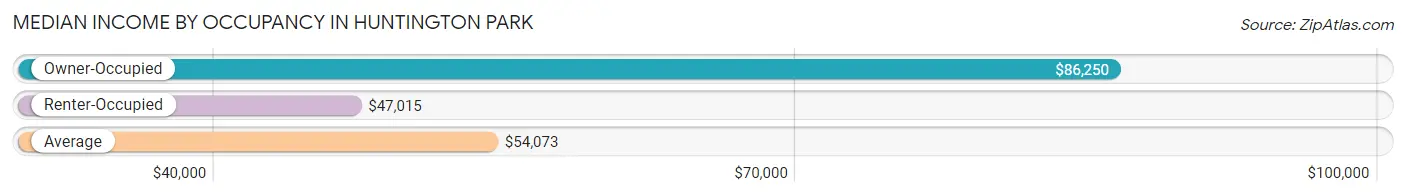
| Occupancy Type | # Households | Median Income |
| Owner-Occupied | 3,571 (24.3%) | $86,250 |
| Renter-Occupied | 11,141 (75.7%) | $47,015 |
| Average | 14,712 (100.0%) | $54,073 |
Occupancy by Householder Income Bracket in Huntington Park
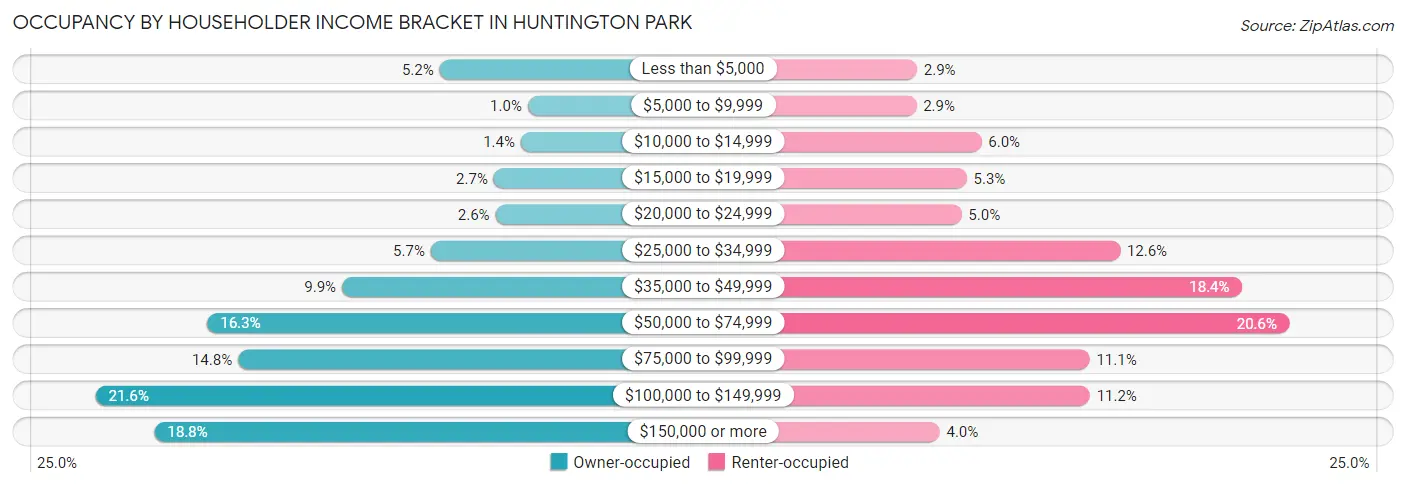
| Income Bracket | Owner-occupied | Renter-occupied |
| Less than $5,000 | 187 (5.2%) | 325 (2.9%) |
| $5,000 to $9,999 | 37 (1.0%) | 322 (2.9%) |
| $10,000 to $14,999 | 49 (1.4%) | 667 (6.0%) |
| $15,000 to $19,999 | 95 (2.7%) | 589 (5.3%) |
| $20,000 to $24,999 | 92 (2.6%) | 561 (5.0%) |
| $25,000 to $34,999 | 202 (5.7%) | 1,403 (12.6%) |
| $35,000 to $49,999 | 353 (9.9%) | 2,047 (18.4%) |
| $50,000 to $74,999 | 582 (16.3%) | 2,298 (20.6%) |
| $75,000 to $99,999 | 530 (14.8%) | 1,241 (11.1%) |
| $100,000 to $149,999 | 772 (21.6%) | 1,242 (11.2%) |
| $150,000 or more | 672 (18.8%) | 446 (4.0%) |
| Total | 3,571 (100.0%) | 11,141 (100.0%) |
Monthly Housing Cost Tiers in Huntington Park
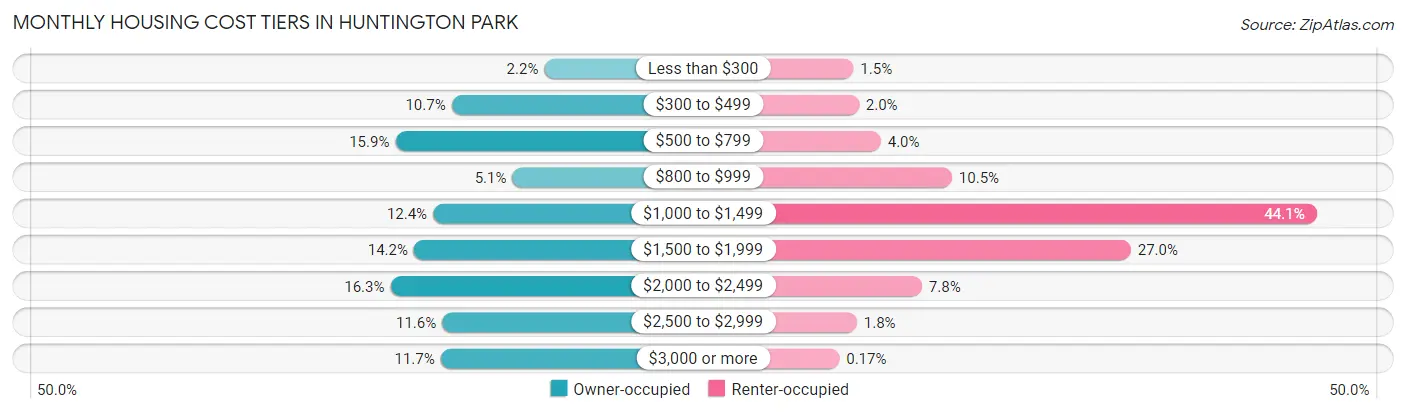
| Monthly Cost | Owner-occupied | Renter-occupied |
| Less than $300 | 77 (2.2%) | 164 (1.5%) |
| $300 to $499 | 382 (10.7%) | 220 (2.0%) |
| $500 to $799 | 567 (15.9%) | 444 (4.0%) |
| $800 to $999 | 182 (5.1%) | 1,174 (10.5%) |
| $1,000 to $1,499 | 443 (12.4%) | 4,913 (44.1%) |
| $1,500 to $1,999 | 506 (14.2%) | 3,009 (27.0%) |
| $2,000 to $2,499 | 583 (16.3%) | 867 (7.8%) |
| $2,500 to $2,999 | 413 (11.6%) | 199 (1.8%) |
| $3,000 or more | 418 (11.7%) | 19 (0.2%) |
| Total | 3,571 (100.0%) | 11,141 (100.0%) |
Physical Housing Characteristics in Huntington Park
Housing Structures in Huntington Park
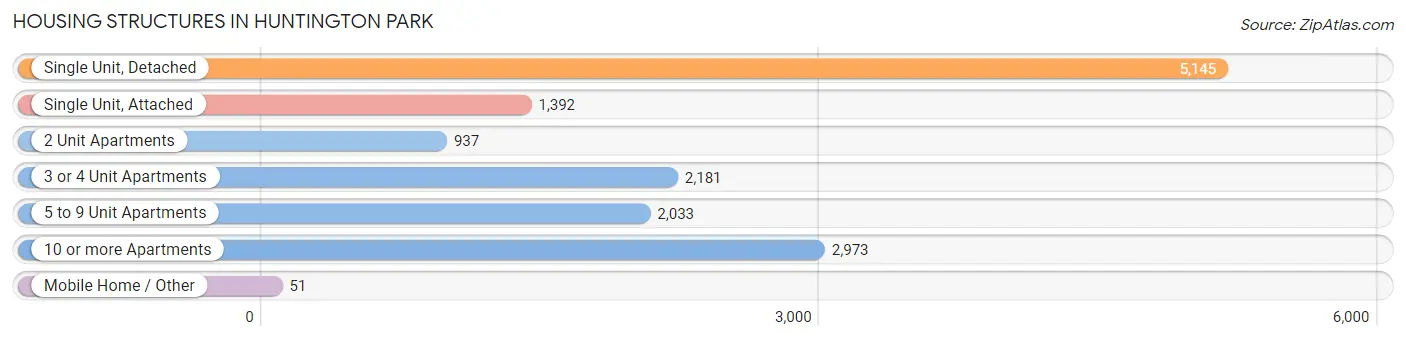
| Structure Type | # Housing Units | % Housing Units |
| Single Unit, Detached | 5,145 | 35.0% |
| Single Unit, Attached | 1,392 | 9.5% |
| 2 Unit Apartments | 937 | 6.4% |
| 3 or 4 Unit Apartments | 2,181 | 14.8% |
| 5 to 9 Unit Apartments | 2,033 | 13.8% |
| 10 or more Apartments | 2,973 | 20.2% |
| Mobile Home / Other | 51 | 0.4% |
| Total | 14,712 | 100.0% |
Housing Structures by Occupancy in Huntington Park
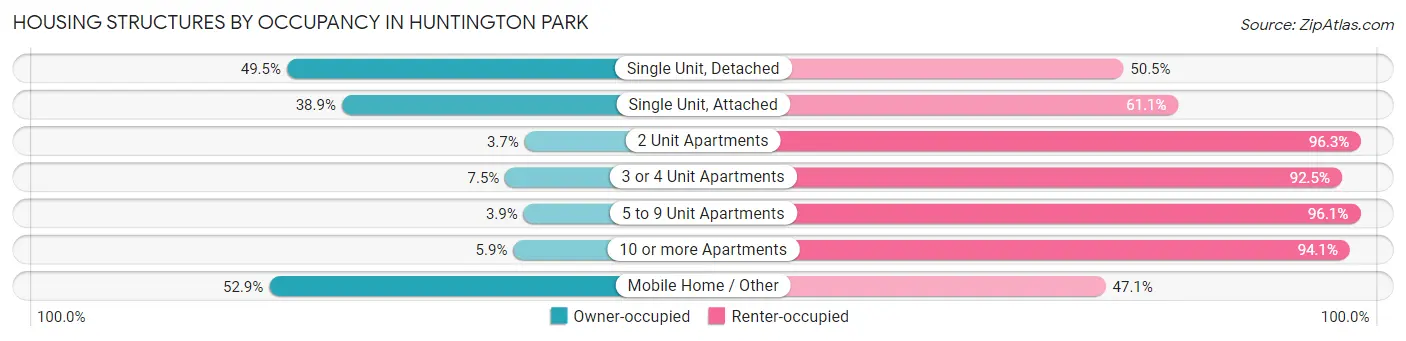
| Structure Type | Owner-occupied | Renter-occupied |
| Single Unit, Detached | 2,548 (49.5%) | 2,597 (50.5%) |
| Single Unit, Attached | 542 (38.9%) | 850 (61.1%) |
| 2 Unit Apartments | 35 (3.7%) | 902 (96.3%) |
| 3 or 4 Unit Apartments | 163 (7.5%) | 2,018 (92.5%) |
| 5 to 9 Unit Apartments | 80 (3.9%) | 1,953 (96.1%) |
| 10 or more Apartments | 176 (5.9%) | 2,797 (94.1%) |
| Mobile Home / Other | 27 (52.9%) | 24 (47.1%) |
| Total | 3,571 (24.3%) | 11,141 (75.7%) |
Housing Structures by Number of Rooms in Huntington Park
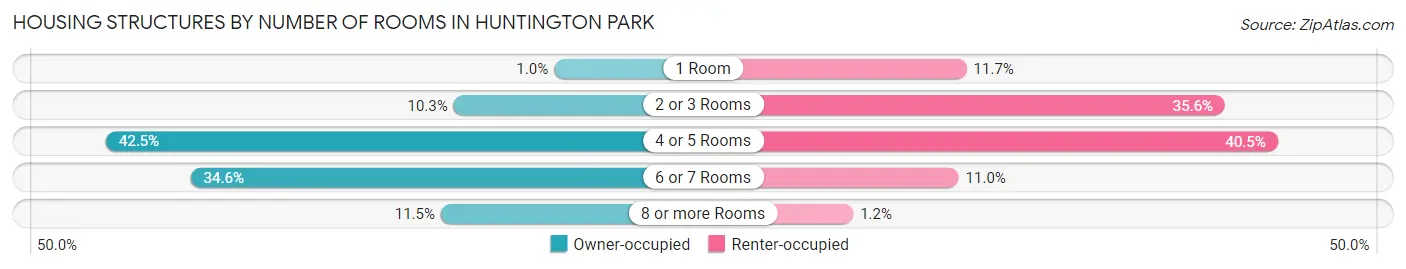
| Number of Rooms | Owner-occupied | Renter-occupied |
| 1 Room | 37 (1.0%) | 1,306 (11.7%) |
| 2 or 3 Rooms | 369 (10.3%) | 3,966 (35.6%) |
| 4 or 5 Rooms | 1,517 (42.5%) | 4,509 (40.5%) |
| 6 or 7 Rooms | 1,237 (34.6%) | 1,223 (11.0%) |
| 8 or more Rooms | 411 (11.5%) | 137 (1.2%) |
| Total | 3,571 (100.0%) | 11,141 (100.0%) |
Housing Structure by Heating Type in Huntington Park
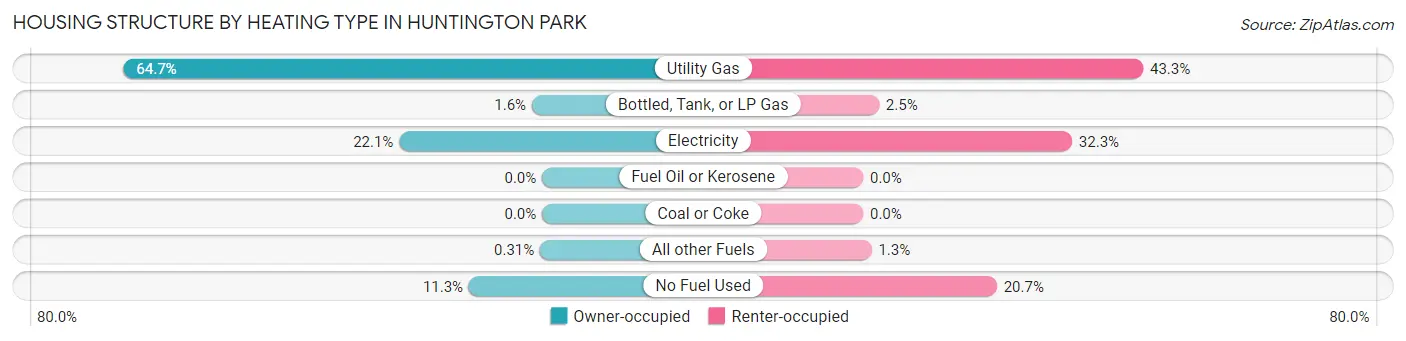
| Heating Type | Owner-occupied | Renter-occupied |
| Utility Gas | 2,311 (64.7%) | 4,823 (43.3%) |
| Bottled, Tank, or LP Gas | 56 (1.6%) | 273 (2.5%) |
| Electricity | 789 (22.1%) | 3,597 (32.3%) |
| Fuel Oil or Kerosene | 0 (0.0%) | 0 (0.0%) |
| Coal or Coke | 0 (0.0%) | 0 (0.0%) |
| All other Fuels | 11 (0.3%) | 145 (1.3%) |
| No Fuel Used | 404 (11.3%) | 2,303 (20.7%) |
| Total | 3,571 (100.0%) | 11,141 (100.0%) |
Household Vehicle Usage in Huntington Park
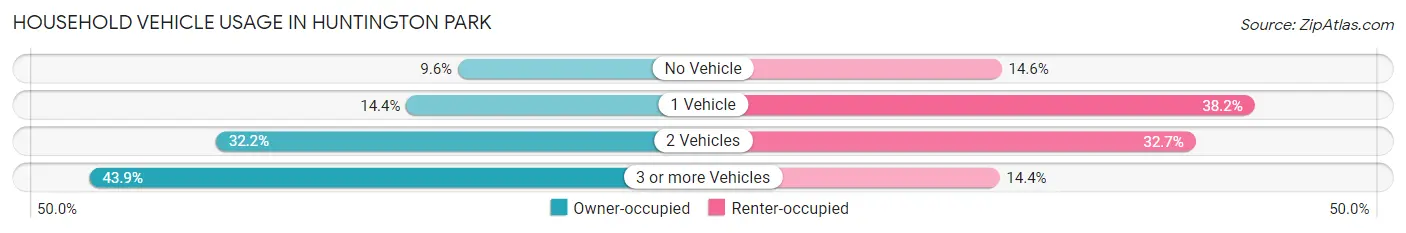
| Vehicles per Household | Owner-occupied | Renter-occupied |
| No Vehicle | 341 (9.6%) | 1,629 (14.6%) |
| 1 Vehicle | 513 (14.4%) | 4,259 (38.2%) |
| 2 Vehicles | 1,148 (32.2%) | 3,646 (32.7%) |
| 3 or more Vehicles | 1,569 (43.9%) | 1,607 (14.4%) |
| Total | 3,571 (100.0%) | 11,141 (100.0%) |
Real Estate & Mortgages in Huntington Park
Real Estate and Mortgage Overview in Huntington Park
| Characteristic | Without Mortgage | With Mortgage |
| Housing Units | 1,183 | 2,388 |
| Median Property Value | $475,900 | $527,100 |
| Median Household Income | $73,828 | $492 |
| Monthly Housing Costs | $563 | $418 |
| Real Estate Taxes | $3,343 | $26 |
Property Value by Mortgage Status in Huntington Park
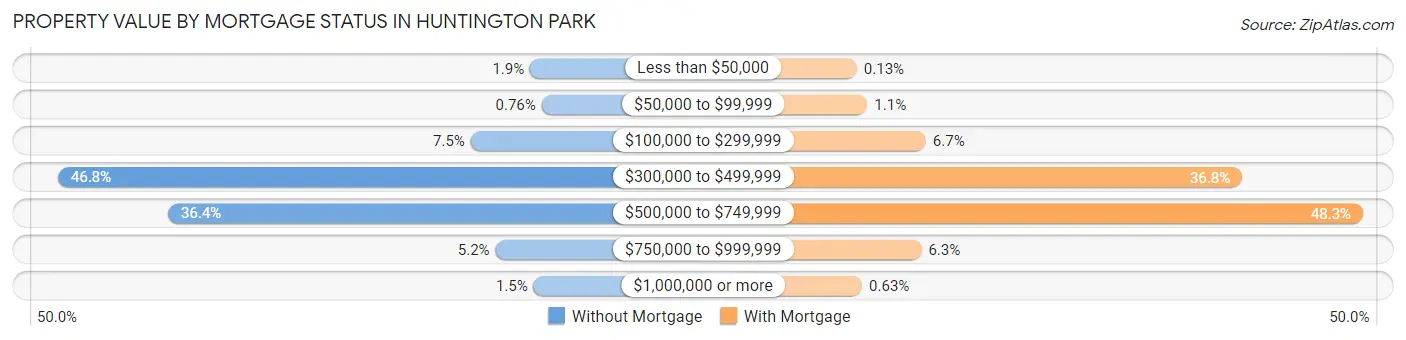
| Property Value | Without Mortgage | With Mortgage |
| Less than $50,000 | 22 (1.9%) | 3 (0.1%) |
| $50,000 to $99,999 | 9 (0.8%) | 27 (1.1%) |
| $100,000 to $299,999 | 89 (7.5%) | 160 (6.7%) |
| $300,000 to $499,999 | 554 (46.8%) | 879 (36.8%) |
| $500,000 to $749,999 | 430 (36.3%) | 1,154 (48.3%) |
| $750,000 to $999,999 | 61 (5.2%) | 150 (6.3%) |
| $1,000,000 or more | 18 (1.5%) | 15 (0.6%) |
| Total | 1,183 (100.0%) | 2,388 (100.0%) |
Household Income by Mortgage Status in Huntington Park
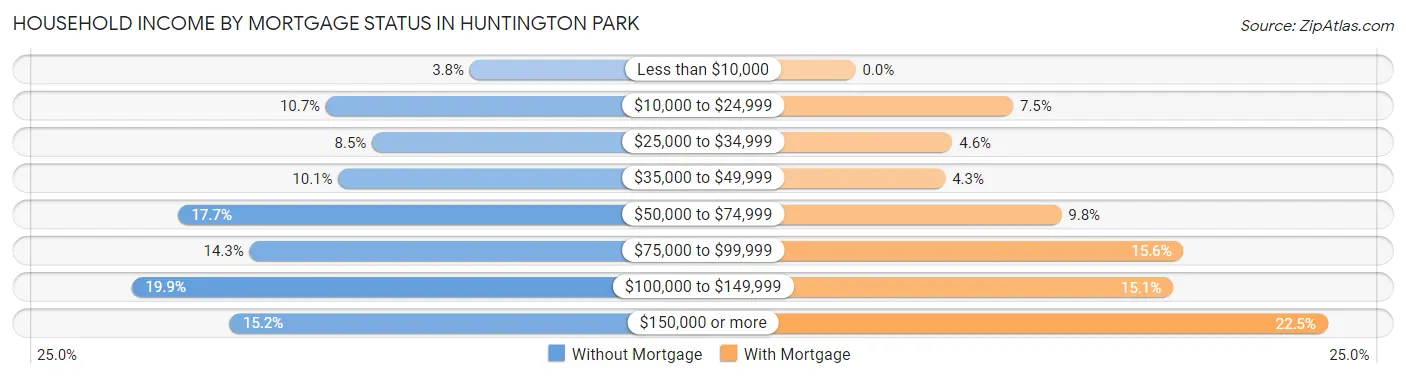
| Household Income | Without Mortgage | With Mortgage |
| Less than $10,000 | 45 (3.8%) | 0 (0.0%) |
| $10,000 to $24,999 | 126 (10.6%) | 179 (7.5%) |
| $25,000 to $34,999 | 100 (8.5%) | 110 (4.6%) |
| $35,000 to $49,999 | 119 (10.1%) | 102 (4.3%) |
| $50,000 to $74,999 | 209 (17.7%) | 234 (9.8%) |
| $75,000 to $99,999 | 169 (14.3%) | 373 (15.6%) |
| $100,000 to $149,999 | 235 (19.9%) | 361 (15.1%) |
| $150,000 or more | 180 (15.2%) | 537 (22.5%) |
| Total | 1,183 (100.0%) | 2,388 (100.0%) |
Property Value to Household Income Ratio in Huntington Park
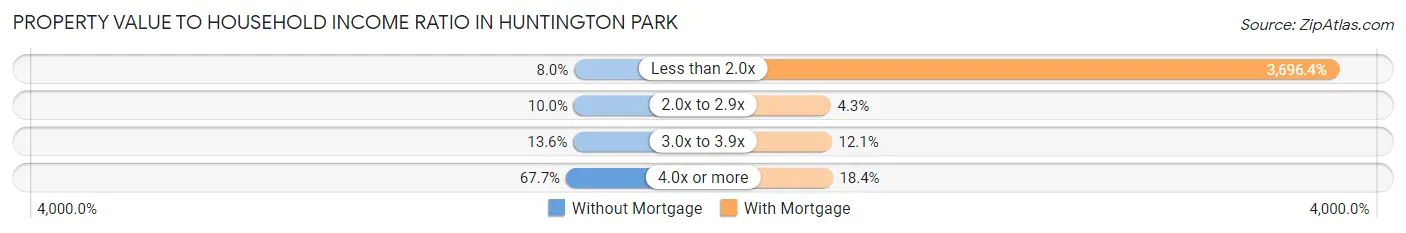
| Value-to-Income Ratio | Without Mortgage | With Mortgage |
| Less than 2.0x | 95 (8.0%) | 88,269 (3,696.4%) |
| 2.0x to 2.9x | 118 (10.0%) | 103 (4.3%) |
| 3.0x to 3.9x | 161 (13.6%) | 288 (12.1%) |
| 4.0x or more | 801 (67.7%) | 440 (18.4%) |
| Total | 1,183 (100.0%) | 2,388 (100.0%) |
Real Estate Taxes by Mortgage Status in Huntington Park
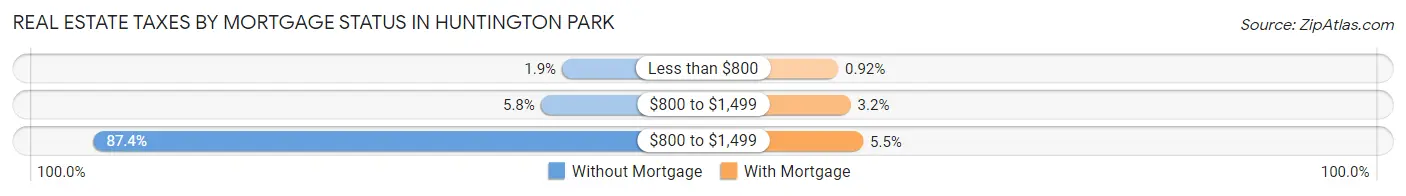
| Property Taxes | Without Mortgage | With Mortgage |
| Less than $800 | 22 (1.9%) | 22 (0.9%) |
| $800 to $1,499 | 68 (5.8%) | 77 (3.2%) |
| $800 to $1,499 | 1,034 (87.4%) | 131 (5.5%) |
| Total | 1,183 (100.0%) | 2,388 (100.0%) |
Health & Disability in Huntington Park
Health Insurance Coverage by Age in Huntington Park
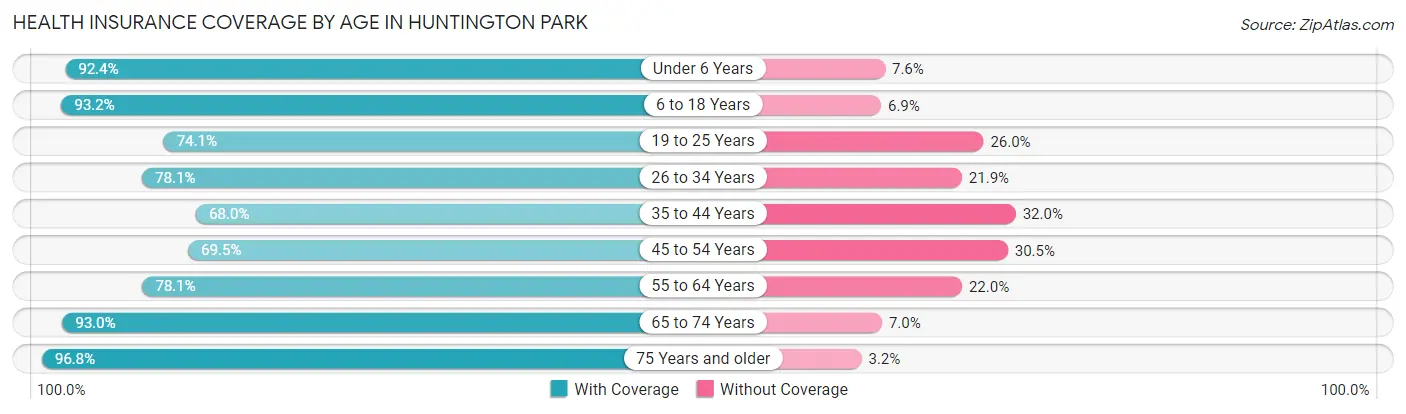
| Age Bracket | With Coverage | Without Coverage |
| Under 6 Years | 3,475 (92.4%) | 286 (7.6%) |
| 6 to 18 Years | 10,027 (93.1%) | 737 (6.9%) |
| 19 to 25 Years | 4,945 (74.1%) | 1,733 (26.0%) |
| 26 to 34 Years | 5,726 (78.1%) | 1,608 (21.9%) |
| 35 to 44 Years | 5,267 (68.0%) | 2,475 (32.0%) |
| 45 to 54 Years | 5,184 (69.5%) | 2,274 (30.5%) |
| 55 to 64 Years | 3,893 (78.0%) | 1,095 (22.0%) |
| 65 to 74 Years | 3,278 (93.0%) | 248 (7.0%) |
| 75 Years and older | 2,109 (96.8%) | 70 (3.2%) |
| Total | 43,904 (80.7%) | 10,526 (19.3%) |
Health Insurance Coverage by Citizenship Status in Huntington Park
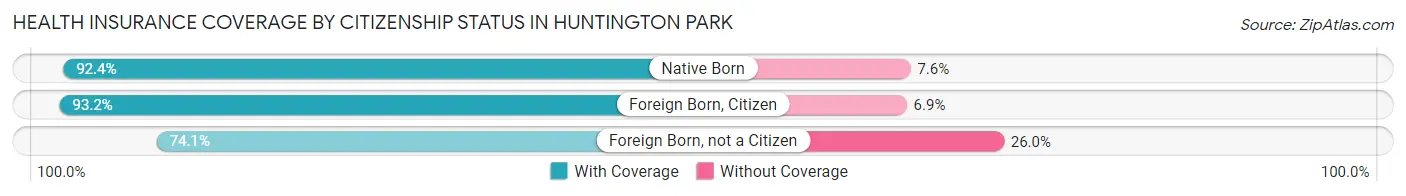
| Citizenship Status | With Coverage | Without Coverage |
| Native Born | 3,475 (92.4%) | 286 (7.6%) |
| Foreign Born, Citizen | 10,027 (93.1%) | 737 (6.9%) |
| Foreign Born, not a Citizen | 4,945 (74.1%) | 1,733 (26.0%) |
Health Insurance Coverage by Household Income in Huntington Park
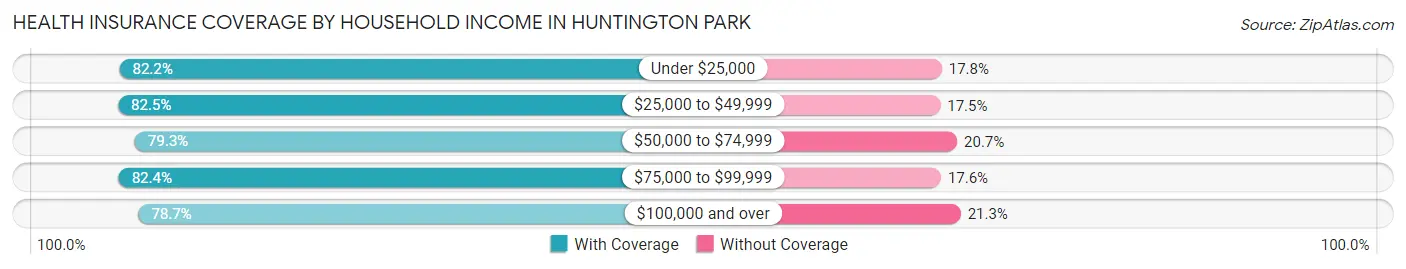
| Household Income | With Coverage | Without Coverage |
| Under $25,000 | 5,671 (82.2%) | 1,228 (17.8%) |
| $25,000 to $49,999 | 10,381 (82.5%) | 2,204 (17.5%) |
| $50,000 to $74,999 | 8,560 (79.3%) | 2,230 (20.7%) |
| $75,000 to $99,999 | 6,365 (82.4%) | 1,363 (17.6%) |
| $100,000 and over | 12,852 (78.7%) | 3,487 (21.3%) |
Public vs Private Health Insurance Coverage by Age in Huntington Park
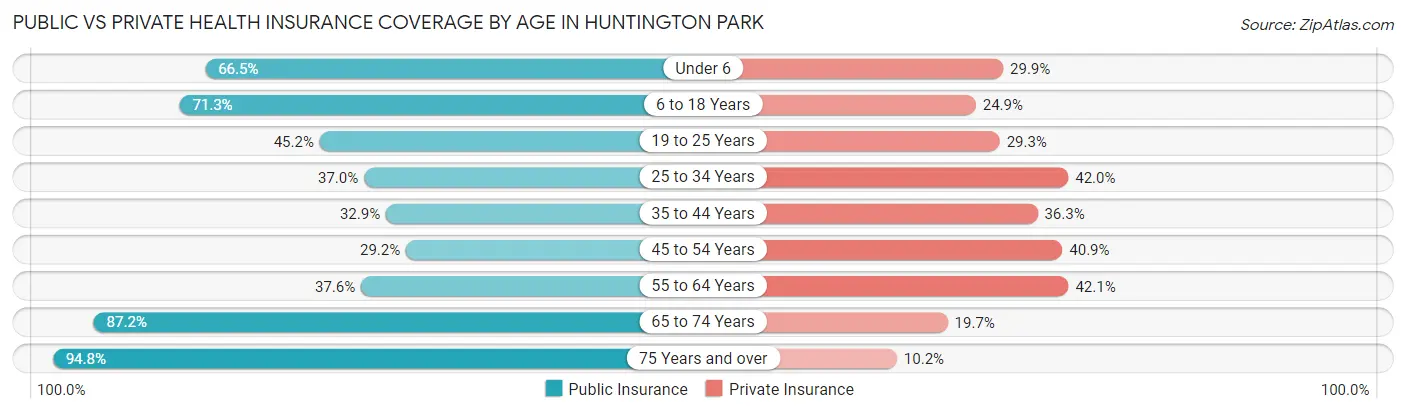
| Age Bracket | Public Insurance | Private Insurance |
| Under 6 | 2,500 (66.5%) | 1,126 (29.9%) |
| 6 to 18 Years | 7,669 (71.3%) | 2,677 (24.9%) |
| 19 to 25 Years | 3,020 (45.2%) | 1,957 (29.3%) |
| 25 to 34 Years | 2,713 (37.0%) | 3,083 (42.0%) |
| 35 to 44 Years | 2,549 (32.9%) | 2,812 (36.3%) |
| 45 to 54 Years | 2,178 (29.2%) | 3,053 (40.9%) |
| 55 to 64 Years | 1,873 (37.6%) | 2,099 (42.1%) |
| 65 to 74 Years | 3,074 (87.2%) | 693 (19.7%) |
| 75 Years and over | 2,065 (94.8%) | 223 (10.2%) |
| Total | 27,641 (50.8%) | 17,723 (32.6%) |
Disability Status by Sex by Age in Huntington Park
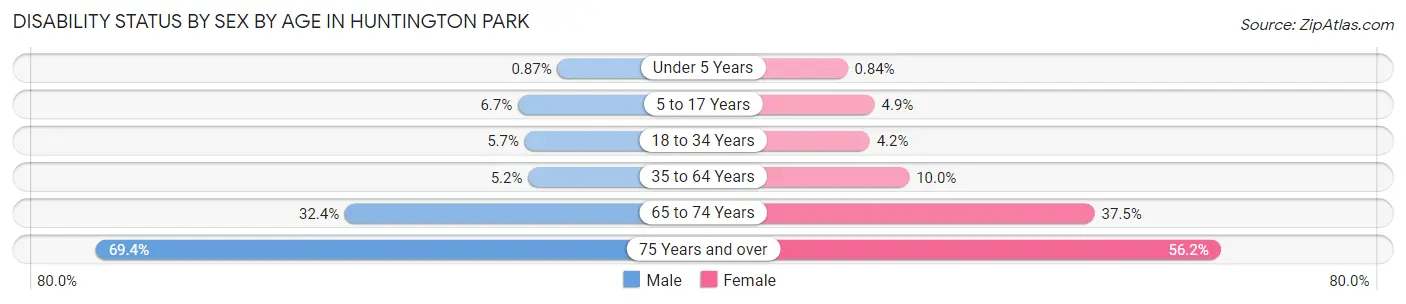
| Age Bracket | Male | Female |
| Under 5 Years | 14 (0.9%) | 14 (0.8%) |
| 5 to 17 Years | 381 (6.7%) | 225 (4.9%) |
| 18 to 34 Years | 429 (5.7%) | 311 (4.2%) |
| 35 to 64 Years | 527 (5.2%) | 1,008 (10.0%) |
| 65 to 74 Years | 511 (32.4%) | 732 (37.5%) |
| 75 Years and over | 745 (69.4%) | 622 (56.2%) |
Disability Class by Sex by Age in Huntington Park
Disability Class: Hearing Difficulty
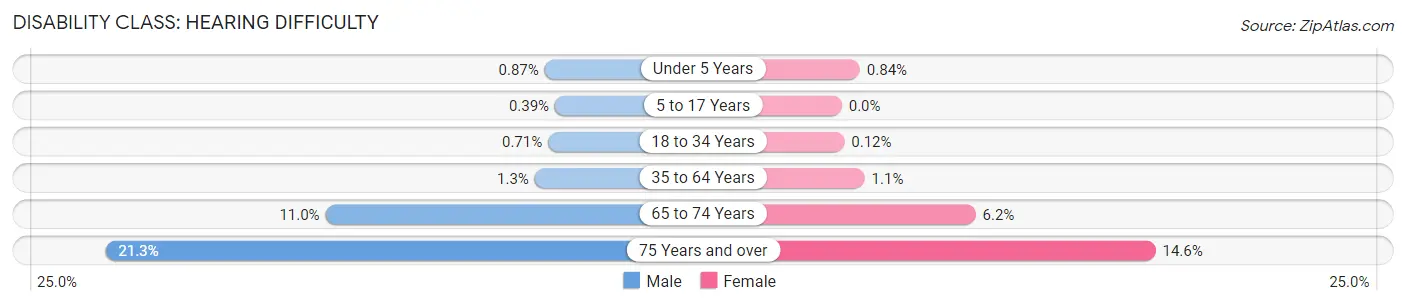
| Age Bracket | Male | Female |
| Under 5 Years | 14 (0.9%) | 14 (0.8%) |
| 5 to 17 Years | 22 (0.4%) | 0 (0.0%) |
| 18 to 34 Years | 53 (0.7%) | 9 (0.1%) |
| 35 to 64 Years | 135 (1.3%) | 107 (1.1%) |
| 65 to 74 Years | 174 (11.0%) | 121 (6.2%) |
| 75 Years and over | 228 (21.2%) | 161 (14.6%) |
Disability Class: Vision Difficulty
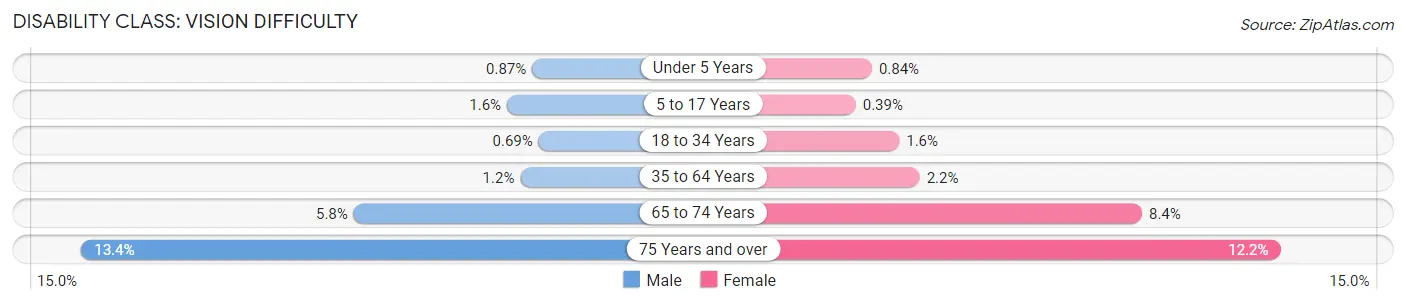
| Age Bracket | Male | Female |
| Under 5 Years | 14 (0.9%) | 14 (0.8%) |
| 5 to 17 Years | 89 (1.6%) | 18 (0.4%) |
| 18 to 34 Years | 52 (0.7%) | 120 (1.6%) |
| 35 to 64 Years | 121 (1.2%) | 219 (2.2%) |
| 65 to 74 Years | 92 (5.8%) | 163 (8.4%) |
| 75 Years and over | 144 (13.4%) | 135 (12.2%) |
Disability Class: Cognitive Difficulty
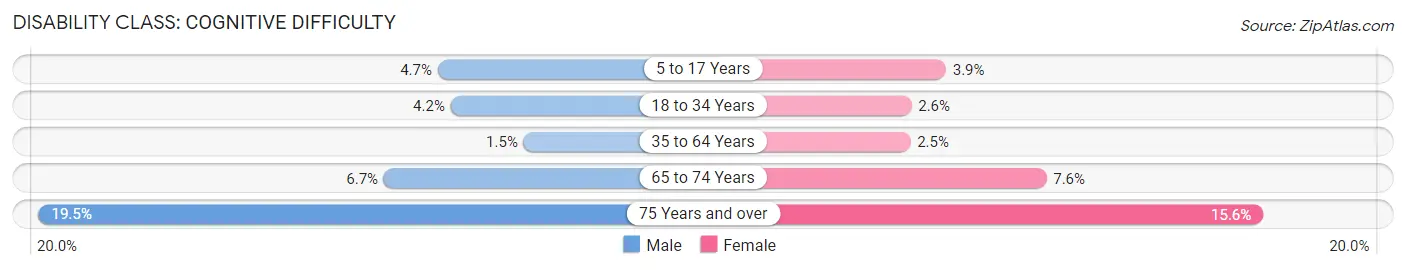
| Age Bracket | Male | Female |
| 5 to 17 Years | 264 (4.7%) | 178 (3.9%) |
| 18 to 34 Years | 313 (4.2%) | 193 (2.6%) |
| 35 to 64 Years | 149 (1.5%) | 256 (2.5%) |
| 65 to 74 Years | 105 (6.7%) | 148 (7.6%) |
| 75 Years and over | 209 (19.5%) | 173 (15.6%) |
Disability Class: Ambulatory Difficulty
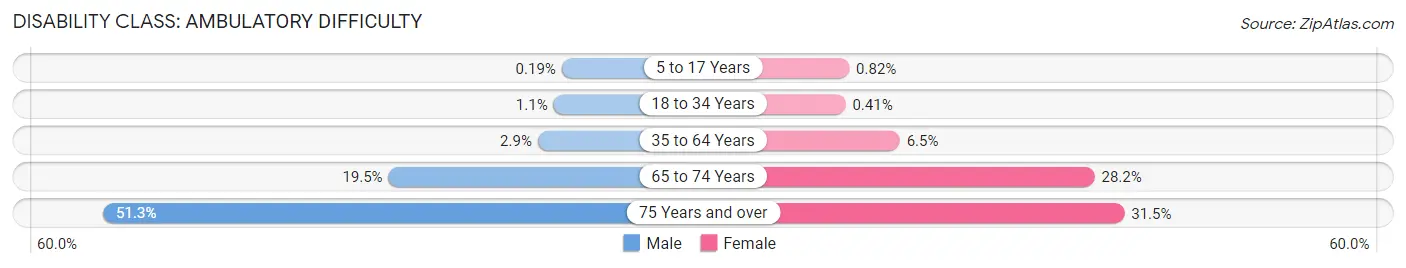
| Age Bracket | Male | Female |
| 5 to 17 Years | 11 (0.2%) | 38 (0.8%) |
| 18 to 34 Years | 82 (1.1%) | 31 (0.4%) |
| 35 to 64 Years | 288 (2.9%) | 650 (6.5%) |
| 65 to 74 Years | 307 (19.5%) | 549 (28.1%) |
| 75 Years and over | 550 (51.3%) | 348 (31.5%) |
Disability Class: Self-Care Difficulty
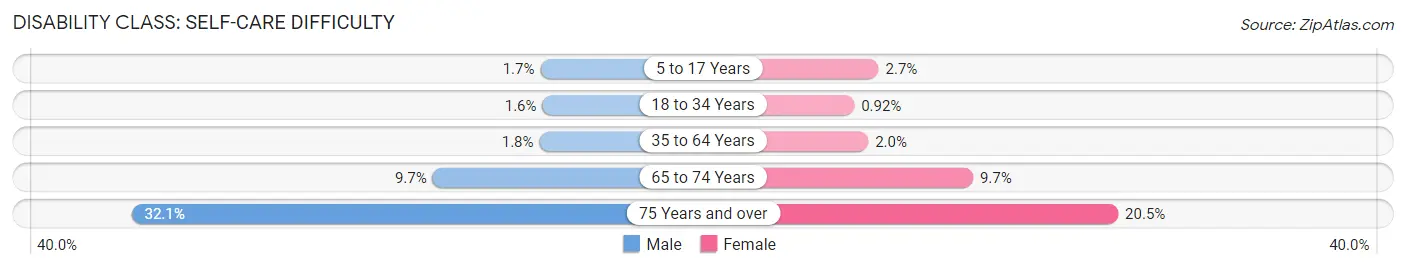
| Age Bracket | Male | Female |
| 5 to 17 Years | 97 (1.7%) | 126 (2.7%) |
| 18 to 34 Years | 117 (1.6%) | 69 (0.9%) |
| 35 to 64 Years | 180 (1.8%) | 197 (2.0%) |
| 65 to 74 Years | 153 (9.7%) | 190 (9.7%) |
| 75 Years and over | 344 (32.1%) | 227 (20.5%) |
Technology Access in Huntington Park
Computing Device Access in Huntington Park
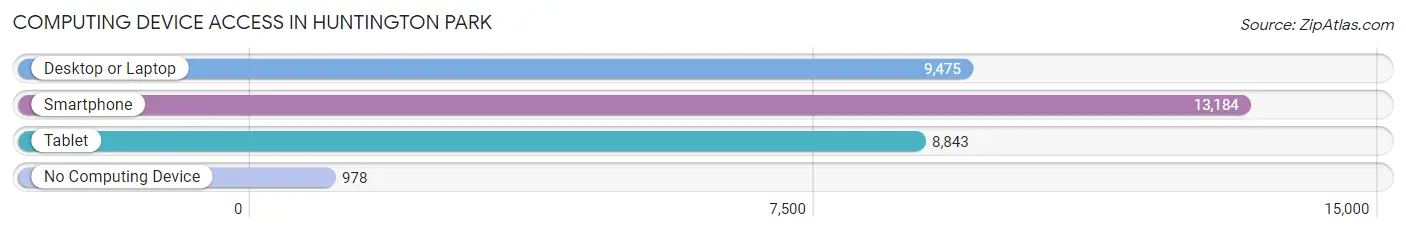
| Device Type | # Households | % Households |
| Desktop or Laptop | 9,475 | 64.4% |
| Smartphone | 13,184 | 89.6% |
| Tablet | 8,843 | 60.1% |
| No Computing Device | 978 | 6.7% |
| Total | 14,712 | 100.0% |
Internet Access in Huntington Park
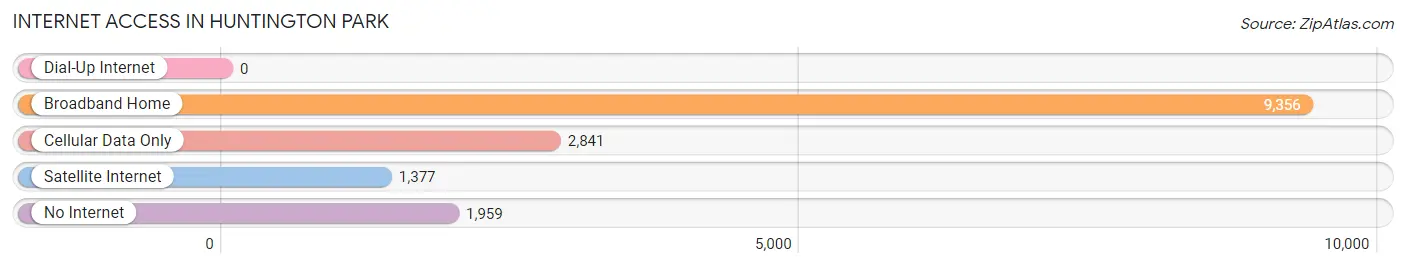
| Internet Type | # Households | % Households |
| Dial-Up Internet | 0 | 0.0% |
| Broadband Home | 9,356 | 63.6% |
| Cellular Data Only | 2,841 | 19.3% |
| Satellite Internet | 1,377 | 9.4% |
| No Internet | 1,959 | 13.3% |
| Total | 14,712 | 100.0% |
Huntington Park Summary
Huntington Park is a city located in the southeastern region of Los Angeles County, California. It is bordered by the cities of Bell, South Gate, and Maywood. The population was 58,114 at the 2010 census, up from 55,273 at the 2000 census.
History
Huntington Park was founded in 1906 by Henry Huntington, a railroad magnate and real estate developer. The city was named after him. The city was incorporated in 1906 and was initially a farming community. It was later developed into a residential area and became a popular destination for immigrants from Mexico and Central America.
Geography
Huntington Park is located at 33°59′N 118°13′W (33.983, -118.216). According to the United States Census Bureau, the city has a total area of 3.0 square miles (7.8 km2), all of it land.
Economy
Huntington Park is a predominantly working-class city. The city's economy is largely based on manufacturing, retail, and services. The city is home to many small businesses, including auto repair shops, restaurants, and clothing stores. The city also has a large industrial base, with many factories and warehouses located in the city.
Demographics
As of the 2010 census, there were 58,114 people, 16,845 households, and 13,845 families residing in the city. The population density was 19,270.4 people per square mile (7,427.2/km2). There were 17,945 housing units at an average density of 5,945.2 per square mile (2,297.2/km2). The racial makeup of the city was 68.2% Hispanic or Latino, 24.2% White (non-Hispanic), 0.7% African American, 0.4% Native American, 0.8% Asian, 0.1% Pacific Islander, 3.3% from other races, and 2.4% from two or more races.
The median income for a household in the city was $30,817, and the median income for a family was $34,945. Males had a median income of $27,817 versus $22,817 for females. The per capita income for the city was $13,945. About 17.2% of families and 20.2% of the population were below the poverty line, including 28.2% of those under age 18 and 11.7% of those age 65 or over.
Common Questions
What is Per Capita Income in Huntington Park?
Per Capita income in Huntington Park is $19,217.
What is the Median Family Income in Huntington Park?
Median Family Income in Huntington Park is $56,503.
What is the Median Household income in Huntington Park?
Median Household Income in Huntington Park is $54,073.
What is Income or Wage Gap in Huntington Park?
Income or Wage Gap in Huntington Park is 17.0%.
Women in Huntington Park earn 83.0 cents for every dollar earned by a man.
What is Family Income Deficit in Huntington Park?
Family Income Deficit in Huntington Park is $11,429.
Families that are below poverty line in Huntington Park earn $11,429 less on average than the poverty threshold level.
What is Inequality or Gini Index in Huntington Park?
Inequality or Gini Index in Huntington Park is 0.41.
What is the Total Population of Huntington Park?
Total Population of Huntington Park is 54,547.
What is the Total Male Population of Huntington Park?
Total Male Population of Huntington Park is 27,580.
What is the Total Female Population of Huntington Park?
Total Female Population of Huntington Park is 26,967.
What is the Ratio of Males per 100 Females in Huntington Park?
There are 102.27 Males per 100 Females in Huntington Park.
What is the Ratio of Females per 100 Males in Huntington Park?
There are 97.78 Females per 100 Males in Huntington Park.
What is the Median Population Age in Huntington Park?
Median Population Age in Huntington Park is 33.5 Years.
What is the Average Family Size in Huntington Park
Average Family Size in Huntington Park is 4.0 People.
What is the Average Household Size in Huntington Park
Average Household Size in Huntington Park is 3.7 People.
How Large is the Labor Force in Huntington Park?
There are 28,086 People in the Labor Forcein in Huntington Park.
What is the Percentage of People in the Labor Force in Huntington Park?
65.6% of People are in the Labor Force in Huntington Park.
What is the Unemployment Rate in Huntington Park?
Unemployment Rate in Huntington Park is 10.1%.