Cities with the Highest Percentage of Households Without a Vehicle in Mississippi
RELATED REPORTS & OPTIONS
Households without a Cars
Mississippi
Compare Cities
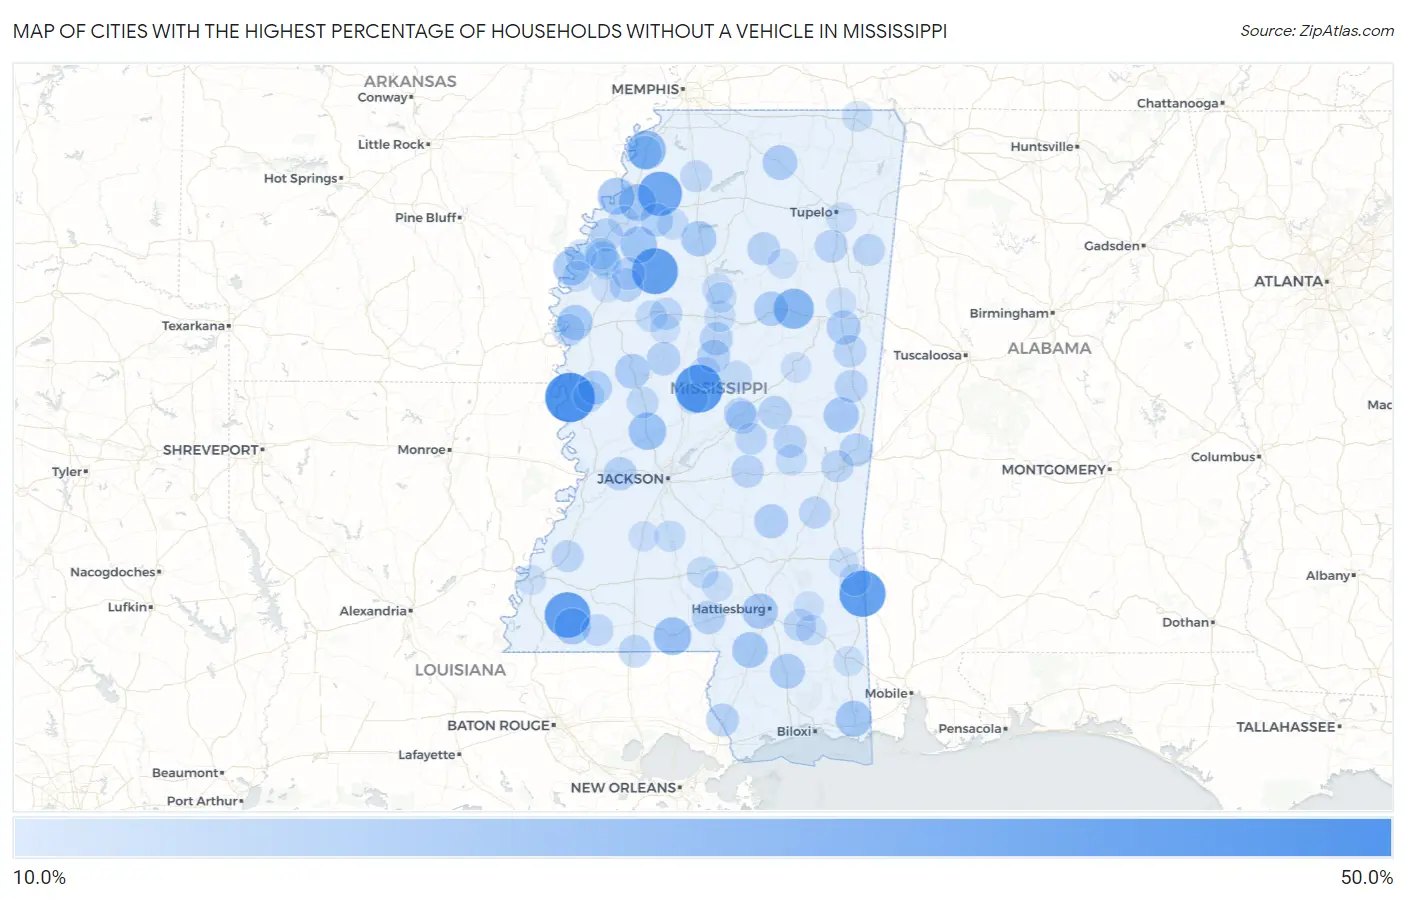
Map of Cities with the Highest Percentage of Households Without a Vehicle in Mississippi
0.0%
50.0%
Cities with the Highest Percentage of Households Without a Vehicle in Mississippi
| City | Housholds Without a Car | vs State | vs National | |
| 1. | Mayersville | 48.8% | 6.1%(+42.7)#1 | 8.3%(+40.5)#245 |
| 2. | Goodman | 45.3% | 6.1%(+39.2)#2 | 8.3%(+37.0)#277 |
| 3. | State Line | 42.4% | 6.1%(+36.3)#3 | 8.3%(+34.1)#314 |
| 4. | Glendora | 41.5% | 6.1%(+35.4)#4 | 8.3%(+33.2)#328 |
| 5. | Crosby | 41.1% | 6.1%(+35.0)#5 | 8.3%(+32.8)#333 |
| 6. | Falcon | 38.2% | 6.1%(+32.1)#6 | 8.3%(+29.9)#365 |
| 7. | Winterville | 35.5% | 6.1%(+29.4)#7 | 8.3%(+27.2)#422 |
| 8. | Maben | 30.6% | 6.1%(+24.5)#8 | 8.3%(+22.3)#561 |
| 9. | North Tunica | 28.3% | 6.1%(+22.2)#9 | 8.3%(+20.0)#666 |
| 10. | Tylertown | 25.7% | 6.1%(+19.6)#10 | 8.3%(+17.4)#804 |
| 11. | Bentonia | 25.1% | 6.1%(+19.0)#11 | 8.3%(+16.8)#840 |
| 12. | Jonestown | 24.1% | 6.1%(+18.0)#12 | 8.3%(+15.8)#917 |
| 13. | Tutwiler | 23.9% | 6.1%(+17.8)#13 | 8.3%(+15.6)#931 |
| 14. | Friars Point | 23.9% | 6.1%(+17.8)#14 | 8.3%(+15.6)#933 |
| 15. | Gloster | 23.0% | 6.1%(+16.9)#15 | 8.3%(+14.7)#1,012 |
| 16. | Escatawpa | 22.8% | 6.1%(+16.7)#16 | 8.3%(+14.5)#1,024 |
| 17. | Rosedale | 22.4% | 6.1%(+16.3)#17 | 8.3%(+14.1)#1,063 |
| 18. | Elizabeth | 22.0% | 6.1%(+15.9)#18 | 8.3%(+13.7)#1,127 |
| 19. | Lumberton | 21.8% | 6.1%(+15.7)#19 | 8.3%(+13.5)#1,151 |
| 20. | West Hattiesburg | 21.6% | 6.1%(+15.5)#20 | 8.3%(+13.3)#1,164 |
| 21. | De Kalb | 21.3% | 6.1%(+15.2)#21 | 8.3%(+13.0)#1,214 |
| 22. | Oakland | 21.1% | 6.1%(+15.0)#22 | 8.3%(+12.8)#1,244 |
| 23. | Metcalfe | 20.8% | 6.1%(+14.7)#23 | 8.3%(+12.5)#1,285 |
| 24. | Randolph | 20.7% | 6.1%(+14.6)#24 | 8.3%(+12.4)#1,308 |
| 25. | Wiggins | 20.3% | 6.1%(+14.2)#25 | 8.3%(+12.0)#1,354 |
| 26. | Silver City | 20.2% | 6.1%(+14.1)#26 | 8.3%(+11.9)#1,380 |
| 27. | Hickory Flat | 19.9% | 6.1%(+13.8)#27 | 8.3%(+11.6)#1,431 |
| 28. | Eupora | 19.4% | 6.1%(+13.3)#28 | 8.3%(+11.1)#1,515 |
| 29. | Bay Springs | 18.9% | 6.1%(+12.8)#29 | 8.3%(+10.6)#1,596 |
| 30. | Anguilla | 18.8% | 6.1%(+12.7)#30 | 8.3%(+10.5)#1,622 |
| 31. | Artesia | 18.8% | 6.1%(+12.7)#31 | 8.3%(+10.5)#1,625 |
| 32. | Winstonville | 18.4% | 6.1%(+12.3)#32 | 8.3%(+10.1)#1,706 |
| 33. | Tchula | 17.8% | 6.1%(+11.7)#33 | 8.3%(+9.50)#1,827 |
| 34. | Columbia | 17.6% | 6.1%(+11.5)#34 | 8.3%(+9.30)#1,864 |
| 35. | Lambert | 17.6% | 6.1%(+11.5)#35 | 8.3%(+9.30)#1,879 |
| 36. | Tunica | 17.5% | 6.1%(+11.4)#36 | 8.3%(+9.20)#1,908 |
| 37. | Ruleville | 17.4% | 6.1%(+11.3)#37 | 8.3%(+9.10)#1,930 |
| 38. | Edwards | 17.4% | 6.1%(+11.3)#38 | 8.3%(+9.10)#1,936 |
| 39. | Alligator | 17.3% | 6.1%(+11.2)#39 | 8.3%(+9.00)#1,964 |
| 40. | Lauderdale | 17.3% | 6.1%(+11.2)#40 | 8.3%(+9.00)#1,965 |
| 41. | Pearl River | 17.2% | 6.1%(+11.1)#41 | 8.3%(+8.90)#1,970 |
| 42. | Stewart | 17.2% | 6.1%(+11.1)#42 | 8.3%(+8.90)#1,988 |
| 43. | Hermanville | 17.1% | 6.1%(+11.0)#43 | 8.3%(+8.80)#2,006 |
| 44. | Bruce | 17.0% | 6.1%(+10.9)#44 | 8.3%(+8.70)#2,025 |
| 45. | Vaiden | 17.0% | 6.1%(+10.9)#45 | 8.3%(+8.70)#2,027 |
| 46. | West | 17.0% | 6.1%(+10.9)#46 | 8.3%(+8.70)#2,034 |
| 47. | Nicholson | 16.9% | 6.1%(+10.8)#47 | 8.3%(+8.60)#2,049 |
| 48. | Union | 16.6% | 6.1%(+10.5)#48 | 8.3%(+8.30)#2,138 |
| 49. | Okolona | 16.6% | 6.1%(+10.5)#49 | 8.3%(+8.30)#2,139 |
| 50. | Forest | 16.5% | 6.1%(+10.4)#50 | 8.3%(+8.20)#2,158 |
| 51. | Shuqualak | 16.5% | 6.1%(+10.4)#51 | 8.3%(+8.20)#2,175 |
| 52. | Carthage | 16.4% | 6.1%(+10.3)#52 | 8.3%(+8.10)#2,193 |
| 53. | Drew | 16.3% | 6.1%(+10.2)#53 | 8.3%(+8.00)#2,230 |
| 54. | Brooksville | 16.1% | 6.1%(+10.00)#54 | 8.3%(+7.80)#2,294 |
| 55. | Osyka | 15.9% | 6.1%(+9.80)#55 | 8.3%(+7.60)#2,365 |
| 56. | New Augusta | 15.6% | 6.1%(+9.50)#56 | 8.3%(+7.30)#2,480 |
| 57. | Meridian | 15.4% | 6.1%(+9.30)#57 | 8.3%(+7.10)#2,527 |
| 58. | Greenville | 15.3% | 6.1%(+9.20)#58 | 8.3%(+7.00)#2,567 |
| 59. | Greenwood | 15.3% | 6.1%(+9.20)#59 | 8.3%(+7.00)#2,571 |
| 60. | Hatley | 15.2% | 6.1%(+9.10)#60 | 8.3%(+6.90)#2,626 |
| 61. | Pachuta | 15.1% | 6.1%(+9.00)#61 | 8.3%(+6.80)#2,668 |
| 62. | Fayette | 15.0% | 6.1%(+8.90)#62 | 8.3%(+6.70)#2,688 |
| 63. | Walnut Grove | 15.0% | 6.1%(+8.90)#63 | 8.3%(+6.70)#2,694 |
| 64. | Redwater | 15.0% | 6.1%(+8.90)#64 | 8.3%(+6.70)#2,698 |
| 65. | Yazoo City | 14.9% | 6.1%(+8.80)#65 | 8.3%(+6.60)#2,710 |
| 66. | Durant | 14.9% | 6.1%(+8.80)#66 | 8.3%(+6.60)#2,722 |
| 67. | Como | 14.8% | 6.1%(+8.70)#67 | 8.3%(+6.50)#2,761 |
| 68. | Liberty | 14.7% | 6.1%(+8.60)#68 | 8.3%(+6.40)#2,808 |
| 69. | Shelby | 14.6% | 6.1%(+8.50)#69 | 8.3%(+6.30)#2,843 |
| 70. | Buckatunna | 14.6% | 6.1%(+8.50)#70 | 8.3%(+6.30)#2,857 |
| 71. | Rolling Fork | 14.5% | 6.1%(+8.40)#71 | 8.3%(+6.20)#2,884 |
| 72. | Itta Bena | 14.2% | 6.1%(+8.10)#72 | 8.3%(+5.90)#3,031 |
| 73. | Prentiss | 14.2% | 6.1%(+8.10)#73 | 8.3%(+5.90)#3,034 |
| 74. | Crowder | 14.2% | 6.1%(+8.10)#74 | 8.3%(+5.90)#3,035 |
| 75. | Mound Bayou | 14.1% | 6.1%(+8.00)#75 | 8.3%(+5.80)#3,068 |
| 76. | Kosciusko | 13.8% | 6.1%(+7.70)#76 | 8.3%(+5.50)#3,182 |
| 77. | Winona | 13.6% | 6.1%(+7.50)#77 | 8.3%(+5.30)#3,281 |
| 78. | Georgetown | 13.6% | 6.1%(+7.50)#78 | 8.3%(+5.30)#3,299 |
| 79. | Decatur | 13.5% | 6.1%(+7.40)#79 | 8.3%(+5.20)#3,325 |
| 80. | Gunnison | 13.5% | 6.1%(+7.40)#80 | 8.3%(+5.20)#3,342 |
| 81. | Elliott | 13.3% | 6.1%(+7.20)#81 | 8.3%(+5.00)#3,421 |
| 82. | Clarksdale | 13.0% | 6.1%(+6.90)#82 | 8.3%(+4.70)#3,536 |
| 83. | Corinth | 12.9% | 6.1%(+6.80)#83 | 8.3%(+4.60)#3,584 |
| 84. | Beaumont | 12.8% | 6.1%(+6.70)#84 | 8.3%(+4.50)#3,665 |
| 85. | Pickens | 12.7% | 6.1%(+6.60)#85 | 8.3%(+4.40)#3,715 |
| 86. | Bassfield | 12.7% | 6.1%(+6.60)#86 | 8.3%(+4.40)#3,730 |
| 87. | Beulah | 12.6% | 6.1%(+6.50)#87 | 8.3%(+4.30)#3,782 |
| 88. | Plantersville | 12.5% | 6.1%(+6.40)#88 | 8.3%(+4.20)#3,831 |
| 89. | Duck Hill | 12.5% | 6.1%(+6.40)#89 | 8.3%(+4.20)#3,833 |
| 90. | Louisville | 12.4% | 6.1%(+6.30)#90 | 8.3%(+4.10)#3,880 |
| 91. | Hazlehurst | 12.2% | 6.1%(+6.10)#91 | 8.3%(+3.90)#3,996 |
| 92. | Bond | 12.2% | 6.1%(+6.10)#92 | 8.3%(+3.90)#4,035 |
| 93. | Lucedale | 11.9% | 6.1%(+5.80)#93 | 8.3%(+3.60)#4,199 |
| 94. | Vardaman | 11.8% | 6.1%(+5.70)#94 | 8.3%(+3.50)#4,286 |
| 95. | Boyle | 11.7% | 6.1%(+5.60)#95 | 8.3%(+3.40)#4,354 |
| 96. | Natchez | 11.6% | 6.1%(+5.50)#96 | 8.3%(+3.30)#4,379 |
| 97. | West Point | 11.6% | 6.1%(+5.50)#97 | 8.3%(+3.30)#4,384 |
| 98. | Waynesboro | 11.6% | 6.1%(+5.50)#98 | 8.3%(+3.30)#4,391 |
| 99. | Sidon | 11.6% | 6.1%(+5.50)#99 | 8.3%(+3.30)#4,431 |
| 100. | Richton | 11.5% | 6.1%(+5.40)#100 | 8.3%(+3.20)#4,481 |
Common Questions
What are the Top 10 Cities with the Highest Percentage of Households Without a Vehicle in Mississippi?
Top 10 Cities with the Highest Percentage of Households Without a Vehicle in Mississippi are:
#1
48.8%
#2
45.3%
#3
42.4%
#4
41.5%
#5
41.1%
#6
38.2%
#7
30.6%
#8
28.3%
#9
25.7%
#10
25.1%
What city has the Highest Percentage of Households Without a Vehicle in Mississippi?
Mayersville has the Highest Percentage of Households Without a Vehicle in Mississippi with 48.8%.
What is the Percentage of Households Without a Vehicle in the State of Mississippi?
Percentage of Households Without a Vehicle in Mississippi is 6.1%.
What is the Percentage of Households Without a Vehicle in the United States?
Percentage of Households Without a Vehicle in the United States is 8.3%.