Cities with the Highest Percentage of Households Without a Vehicle in Michigan
RELATED REPORTS & OPTIONS
Households without a Cars
Michigan
Compare Cities
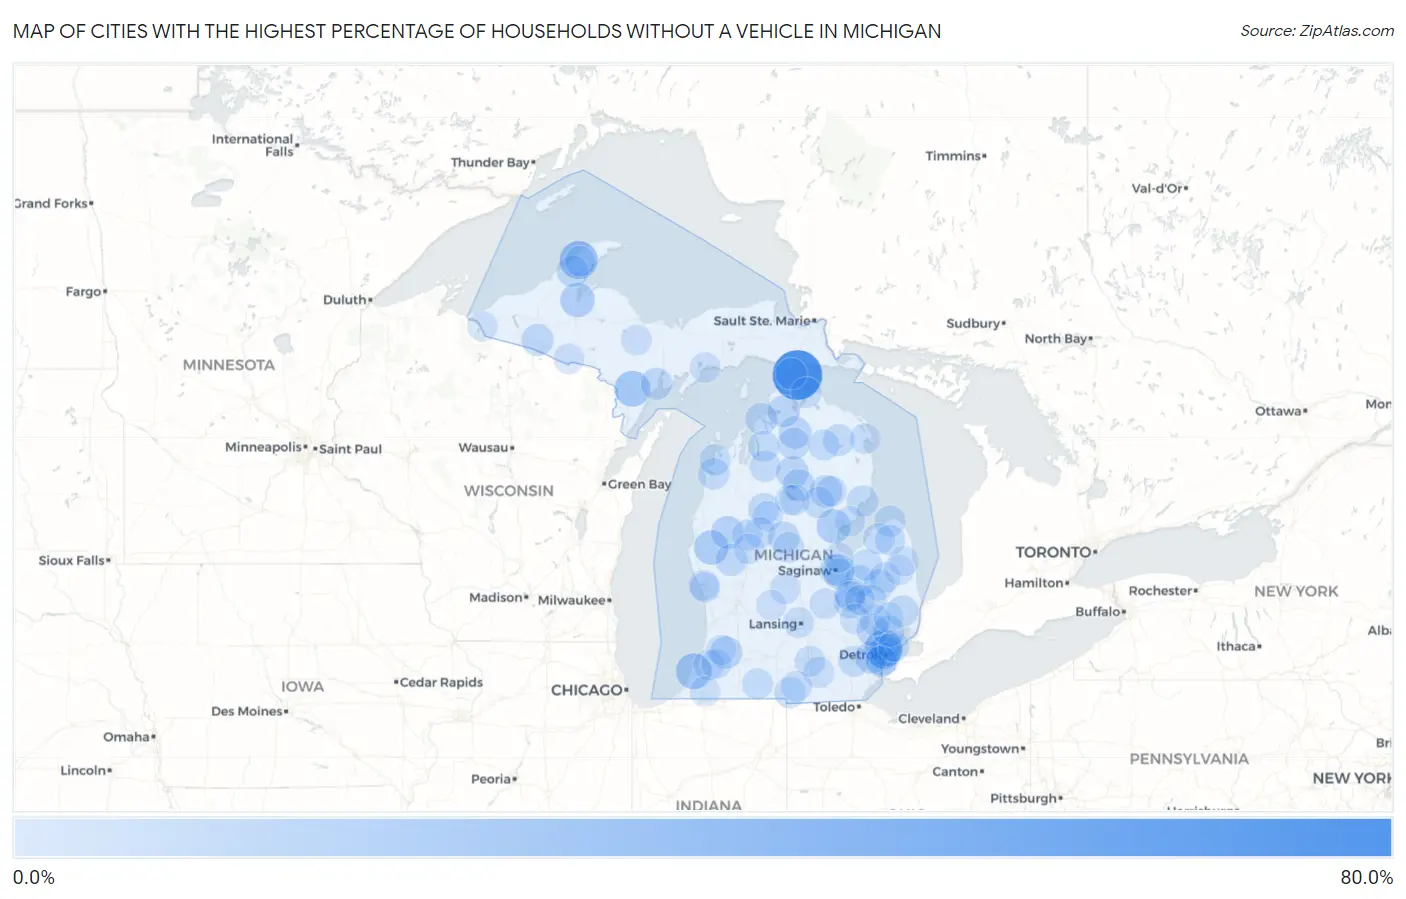
Map of Cities with the Highest Percentage of Households Without a Vehicle in Michigan
0.0%
80.0%
Cities with the Highest Percentage of Households Without a Vehicle in Michigan
| City | Housholds Without a Car | vs State | vs National | |
| 1. | Mackinac Island | 72.7% | 7.2%(+65.5)#1 | 8.3%(+64.4)#145 |
| 2. | Calumet | 36.5% | 7.2%(+29.3)#2 | 8.3%(+28.2)#398 |
| 3. | Highland Park | 36.1% | 7.2%(+28.9)#3 | 8.3%(+27.8)#403 |
| 4. | Benton Harbor | 29.6% | 7.2%(+22.4)#4 | 8.3%(+21.3)#606 |
| 5. | Powers | 29.6% | 7.2%(+22.4)#5 | 8.3%(+21.3)#611 |
| 6. | Walkerville | 25.3% | 7.2%(+18.1)#6 | 8.3%(+17.0)#828 |
| 7. | Baraga | 25.2% | 7.2%(+18.0)#7 | 8.3%(+16.9)#833 |
| 8. | Standish | 24.6% | 7.2%(+17.4)#8 | 8.3%(+16.3)#881 |
| 9. | Rapid River | 23.6% | 7.2%(+16.4)#9 | 8.3%(+15.3)#960 |
| 10. | Detroit | 21.4% | 7.2%(+14.2)#10 | 8.3%(+13.1)#1,186 |
| 11. | Baldwin | 21.2% | 7.2%(+14.0)#11 | 8.3%(+12.9)#1,227 |
| 12. | River Rouge | 21.0% | 7.2%(+13.8)#12 | 8.3%(+12.7)#1,253 |
| 13. | Gobles | 19.4% | 7.2%(+12.2)#13 | 8.3%(+11.1)#1,518 |
| 14. | Grayling | 19.3% | 7.2%(+12.1)#14 | 8.3%(+11.0)#1,537 |
| 15. | Vanderbilt | 19.3% | 7.2%(+12.1)#15 | 8.3%(+11.0)#1,544 |
| 16. | Rose City | 19.1% | 7.2%(+11.9)#16 | 8.3%(+10.8)#1,568 |
| 17. | Watersmeet | 18.8% | 7.2%(+11.6)#17 | 8.3%(+10.5)#1,627 |
| 18. | Hamtramck | 18.7% | 7.2%(+11.5)#18 | 8.3%(+10.4)#1,632 |
| 19. | Conway | 18.7% | 7.2%(+11.5)#19 | 8.3%(+10.4)#1,645 |
| 20. | Inkster | 18.4% | 7.2%(+11.2)#20 | 8.3%(+10.1)#1,687 |
| 21. | Roscommon | 18.4% | 7.2%(+11.2)#21 | 8.3%(+10.1)#1,701 |
| 22. | Buena Vista | 18.2% | 7.2%(+11.0)#22 | 8.3%(+9.90)#1,724 |
| 23. | Farwell | 18.1% | 7.2%(+10.9)#23 | 8.3%(+9.80)#1,755 |
| 24. | Pontiac | 18.0% | 7.2%(+10.8)#24 | 8.3%(+9.70)#1,764 |
| 25. | Escanaba | 18.0% | 7.2%(+10.8)#25 | 8.3%(+9.70)#1,767 |
| 26. | Gaylord | 17.8% | 7.2%(+10.6)#26 | 8.3%(+9.50)#1,824 |
| 27. | Charlevoix | 17.7% | 7.2%(+10.5)#27 | 8.3%(+9.40)#1,849 |
| 28. | White Cloud | 17.5% | 7.2%(+10.3)#28 | 8.3%(+9.20)#1,905 |
| 29. | Memphis | 17.5% | 7.2%(+10.3)#29 | 8.3%(+9.20)#1,906 |
| 30. | Flint | 17.4% | 7.2%(+10.2)#30 | 8.3%(+9.10)#1,921 |
| 31. | Houghton | 17.4% | 7.2%(+10.2)#31 | 8.3%(+9.10)#1,925 |
| 32. | Utica | 17.4% | 7.2%(+10.2)#32 | 8.3%(+9.10)#1,927 |
| 33. | East Tawas | 16.9% | 7.2%(+9.70)#33 | 8.3%(+8.60)#2,043 |
| 34. | Hillman | 16.9% | 7.2%(+9.70)#34 | 8.3%(+8.60)#2,056 |
| 35. | Saginaw | 16.8% | 7.2%(+9.60)#35 | 8.3%(+8.50)#2,065 |
| 36. | Mcbain | 16.7% | 7.2%(+9.50)#36 | 8.3%(+8.40)#2,104 |
| 37. | St Ignace | 16.5% | 7.2%(+9.30)#37 | 8.3%(+8.20)#2,164 |
| 38. | Beulah | 16.5% | 7.2%(+9.30)#38 | 8.3%(+8.20)#2,180 |
| 39. | Millington | 16.3% | 7.2%(+9.10)#39 | 8.3%(+8.00)#2,235 |
| 40. | Kalkaska | 16.2% | 7.2%(+9.00)#40 | 8.3%(+7.90)#2,258 |
| 41. | Port Austin | 16.2% | 7.2%(+9.00)#41 | 8.3%(+7.90)#2,267 |
| 42. | Empire | 16.2% | 7.2%(+9.00)#42 | 8.3%(+7.90)#2,271 |
| 43. | West Branch | 16.1% | 7.2%(+8.90)#43 | 8.3%(+7.80)#2,288 |
| 44. | Lake Orion | 16.0% | 7.2%(+8.80)#44 | 8.3%(+7.70)#2,315 |
| 45. | Ecorse | 15.9% | 7.2%(+8.70)#45 | 8.3%(+7.60)#2,337 |
| 46. | Caro | 15.8% | 7.2%(+8.60)#46 | 8.3%(+7.50)#2,380 |
| 47. | North Branch | 15.8% | 7.2%(+8.60)#47 | 8.3%(+7.50)#2,399 |
| 48. | Dodgeville | 15.8% | 7.2%(+8.60)#48 | 8.3%(+7.50)#2,405 |
| 49. | Ypsilanti | 15.6% | 7.2%(+8.40)#49 | 8.3%(+7.30)#2,454 |
| 50. | Elkton | 15.6% | 7.2%(+8.40)#50 | 8.3%(+7.30)#2,474 |
| 51. | Reading | 15.5% | 7.2%(+8.30)#51 | 8.3%(+7.20)#2,512 |
| 52. | Paris | 15.5% | 7.2%(+8.30)#52 | 8.3%(+7.20)#2,520 |
| 53. | Harper Woods | 15.4% | 7.2%(+8.20)#53 | 8.3%(+7.10)#2,529 |
| 54. | Colon | 15.4% | 7.2%(+8.20)#54 | 8.3%(+7.10)#2,539 |
| 55. | Atlanta | 15.3% | 7.2%(+8.10)#55 | 8.3%(+7.00)#2,596 |
| 56. | Mount Morris | 15.2% | 7.2%(+8.00)#56 | 8.3%(+6.90)#2,615 |
| 57. | Evart | 15.2% | 7.2%(+8.00)#57 | 8.3%(+6.90)#2,618 |
| 58. | Bellaire | 15.2% | 7.2%(+8.00)#58 | 8.3%(+6.90)#2,622 |
| 59. | Hurontown | 15.2% | 7.2%(+8.00)#59 | 8.3%(+6.90)#2,631 |
| 60. | Brooklyn | 15.1% | 7.2%(+7.90)#60 | 8.3%(+6.80)#2,660 |
| 61. | Carson City | 14.7% | 7.2%(+7.50)#61 | 8.3%(+6.40)#2,805 |
| 62. | Jackson | 14.6% | 7.2%(+7.40)#62 | 8.3%(+6.30)#2,821 |
| 63. | Hillsdale | 14.6% | 7.2%(+7.40)#63 | 8.3%(+6.30)#2,825 |
| 64. | Bridgeport | 14.6% | 7.2%(+7.40)#64 | 8.3%(+6.30)#2,827 |
| 65. | Edgemont Park | 14.6% | 7.2%(+7.40)#65 | 8.3%(+6.30)#2,836 |
| 66. | Cheboygan | 14.5% | 7.2%(+7.30)#66 | 8.3%(+6.20)#2,878 |
| 67. | Reed City | 14.5% | 7.2%(+7.30)#67 | 8.3%(+6.20)#2,882 |
| 68. | Falmouth | 14.5% | 7.2%(+7.30)#68 | 8.3%(+6.20)#2,904 |
| 69. | Marlette | 14.4% | 7.2%(+7.20)#69 | 8.3%(+6.10)#2,933 |
| 70. | Prudenville | 14.4% | 7.2%(+7.20)#70 | 8.3%(+6.10)#2,935 |
| 71. | Middletown | 14.4% | 7.2%(+7.20)#71 | 8.3%(+6.10)#2,947 |
| 72. | Rosebush | 14.4% | 7.2%(+7.20)#72 | 8.3%(+6.10)#2,956 |
| 73. | Beecher | 14.3% | 7.2%(+7.10)#73 | 8.3%(+6.00)#2,965 |
| 74. | Ewen | 14.3% | 7.2%(+7.10)#74 | 8.3%(+6.00)#2,991 |
| 75. | Lapeer | 14.2% | 7.2%(+7.00)#75 | 8.3%(+5.90)#3,011 |
| 76. | Bad Axe | 14.2% | 7.2%(+7.00)#76 | 8.3%(+5.90)#3,025 |
| 77. | Lupton | 14.2% | 7.2%(+7.00)#77 | 8.3%(+5.90)#3,043 |
| 78. | Hartford | 14.1% | 7.2%(+6.90)#78 | 8.3%(+5.80)#3,060 |
| 79. | Laurium | 14.1% | 7.2%(+6.90)#79 | 8.3%(+5.80)#3,067 |
| 80. | Gwinn | 14.1% | 7.2%(+6.90)#80 | 8.3%(+5.80)#3,071 |
| 81. | Muskegon | 14.0% | 7.2%(+6.80)#81 | 8.3%(+5.70)#3,090 |
| 82. | Alpena | 13.8% | 7.2%(+6.60)#82 | 8.3%(+5.50)#3,178 |
| 83. | Manistique | 13.8% | 7.2%(+6.60)#83 | 8.3%(+5.50)#3,190 |
| 84. | Lawrence | 13.8% | 7.2%(+6.60)#84 | 8.3%(+5.50)#3,204 |
| 85. | Marion | 13.7% | 7.2%(+6.50)#85 | 8.3%(+5.40)#3,257 |
| 86. | Caspian | 13.7% | 7.2%(+6.50)#86 | 8.3%(+5.40)#3,258 |
| 87. | Big Rapids | 13.5% | 7.2%(+6.30)#87 | 8.3%(+5.20)#3,317 |
| 88. | Davison | 13.4% | 7.2%(+6.20)#88 | 8.3%(+5.10)#3,364 |
| 89. | Muskegon Heights | 13.3% | 7.2%(+6.10)#89 | 8.3%(+5.00)#3,401 |
| 90. | Niles | 13.2% | 7.2%(+6.00)#90 | 8.3%(+4.90)#3,445 |
| 91. | Au Gres | 13.2% | 7.2%(+6.00)#91 | 8.3%(+4.90)#3,474 |
| 92. | Holly | 13.1% | 7.2%(+5.90)#92 | 8.3%(+4.80)#3,501 |
| 93. | Bloomingdale | 13.1% | 7.2%(+5.90)#93 | 8.3%(+4.80)#3,523 |
| 94. | Ionia | 13.0% | 7.2%(+5.80)#94 | 8.3%(+4.70)#3,538 |
| 95. | Sandusky | 13.0% | 7.2%(+5.80)#95 | 8.3%(+4.70)#3,550 |
| 96. | Deckerville | 13.0% | 7.2%(+5.80)#96 | 8.3%(+4.70)#3,560 |
| 97. | Bay City | 12.9% | 7.2%(+5.70)#97 | 8.3%(+4.60)#3,581 |
| 98. | Houghton Lake | 12.8% | 7.2%(+5.60)#98 | 8.3%(+4.50)#3,643 |
| 99. | Ironwood | 12.7% | 7.2%(+5.50)#99 | 8.3%(+4.40)#3,697 |
| 100. | Romeo | 12.7% | 7.2%(+5.50)#100 | 8.3%(+4.40)#3,699 |
Common Questions
What are the Top 10 Cities with the Highest Percentage of Households Without a Vehicle in Michigan?
Top 10 Cities with the Highest Percentage of Households Without a Vehicle in Michigan are:
#1
72.7%
#2
36.5%
#3
36.1%
#4
29.6%
#5
29.6%
#6
25.3%
#7
25.2%
#8
24.6%
#9
21.4%
#10
21.2%
What city has the Highest Percentage of Households Without a Vehicle in Michigan?
Mackinac Island has the Highest Percentage of Households Without a Vehicle in Michigan with 72.7%.
What is the Percentage of Households Without a Vehicle in the State of Michigan?
Percentage of Households Without a Vehicle in Michigan is 7.2%.
What is the Percentage of Households Without a Vehicle in the United States?
Percentage of Households Without a Vehicle in the United States is 8.3%.