Cities with the Highest Percentage of Households Without a Vehicle in Indiana
RELATED REPORTS & OPTIONS
Households without a Cars
Indiana
Compare Cities
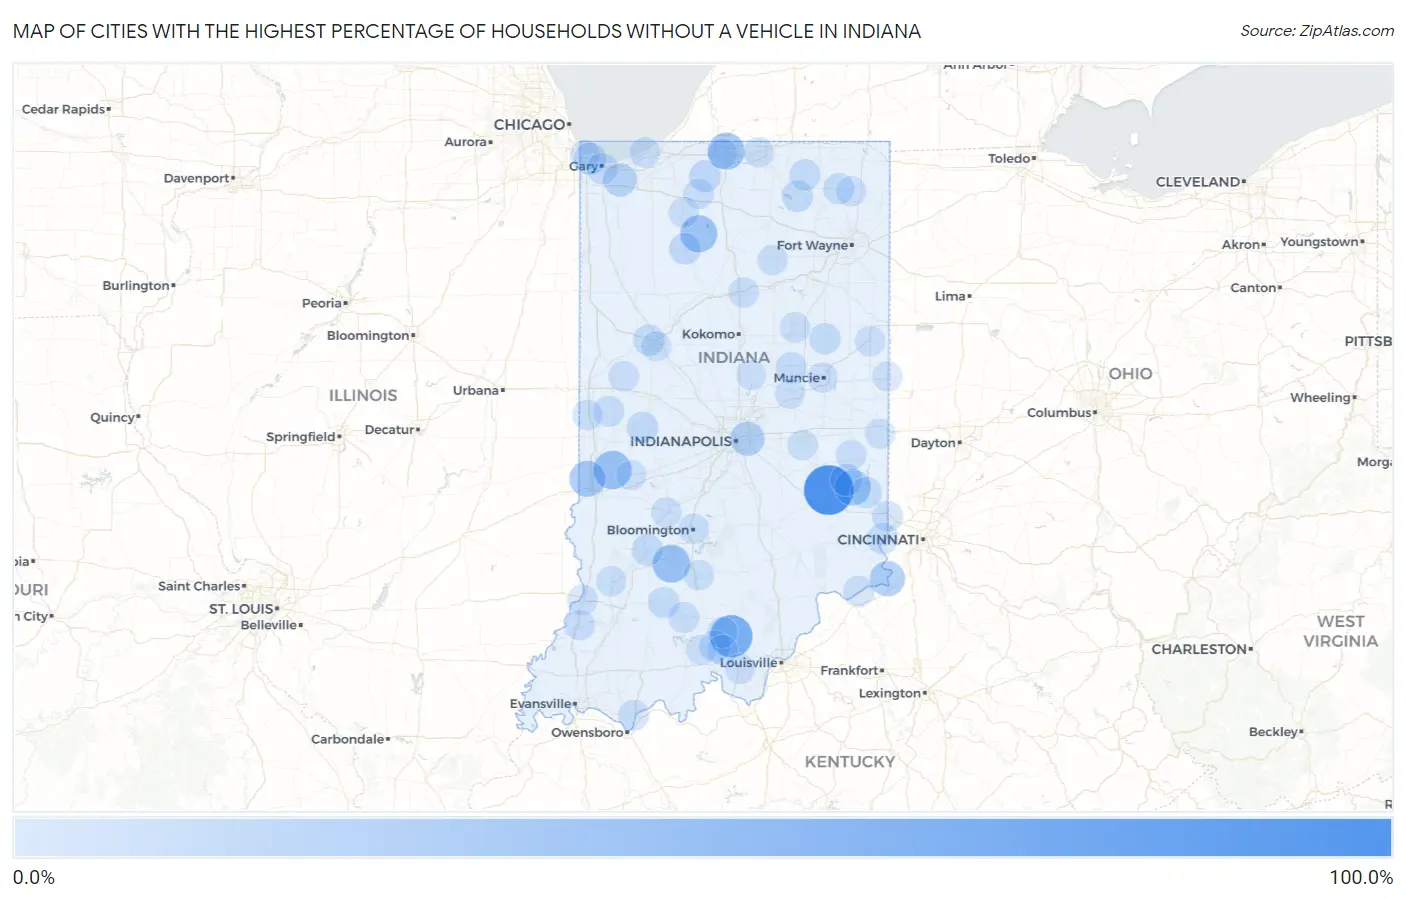
Map of Cities with the Highest Percentage of Households Without a Vehicle in Indiana
0.0%
100.0%
Cities with the Highest Percentage of Households Without a Vehicle in Indiana
| City | Housholds Without a Car | vs State | vs National | |
| 1. | Pence | 100.0% | 6.2%(+93.8)#1 | 8.3%(+91.7)#13 |
| 2. | Clarksburg | 100.0% | 6.2%(+93.8)#2 | 8.3%(+91.7)#46 |
| 3. | New Marion | 72.7% | 6.2%(+66.5)#3 | 8.3%(+64.4)#147 |
| 4. | Azalia | 71.7% | 6.2%(+65.5)#4 | 8.3%(+63.4)#150 |
| 5. | Fredericksburg | 66.7% | 6.2%(+60.5)#5 | 8.3%(+58.4)#164 |
| 6. | Fontanet | 46.4% | 6.2%(+40.2)#6 | 8.3%(+38.1)#263 |
| 7. | Paris Crossing | 46.2% | 6.2%(+40.0)#7 | 8.3%(+37.9)#270 |
| 8. | Owensburg | 44.7% | 6.2%(+38.5)#8 | 8.3%(+36.4)#284 |
| 9. | Ontario | 43.3% | 6.2%(+37.1)#9 | 8.3%(+35.0)#299 |
| 10. | Notre Dame | 41.5% | 6.2%(+35.3)#10 | 8.3%(+33.2)#325 |
| 11. | Monterey | 41.5% | 6.2%(+35.3)#11 | 8.3%(+33.2)#327 |
| 12. | Lake View | 40.5% | 6.2%(+34.3)#12 | 8.3%(+32.2)#341 |
| 13. | St Mary Of The Woods | 37.3% | 6.2%(+31.1)#13 | 8.3%(+29.0)#384 |
| 14. | Charlottesville | 36.8% | 6.2%(+30.6)#14 | 8.3%(+28.5)#392 |
| 15. | Metamora | 36.6% | 6.2%(+30.4)#15 | 8.3%(+28.3)#395 |
| 16. | Cass | 35.0% | 6.2%(+28.8)#16 | 8.3%(+26.7)#432 |
| 17. | Maxwell | 34.9% | 6.2%(+28.7)#17 | 8.3%(+26.6)#437 |
| 18. | Twelve Mile | 34.4% | 6.2%(+28.2)#18 | 8.3%(+26.1)#451 |
| 19. | Otisco | 32.5% | 6.2%(+26.3)#19 | 8.3%(+24.2)#512 |
| 20. | Stroh | 32.3% | 6.2%(+26.1)#20 | 8.3%(+24.0)#518 |
| 21. | Patriot | 32.3% | 6.2%(+26.1)#21 | 8.3%(+24.0)#519 |
| 22. | Poland | 31.7% | 6.2%(+25.5)#22 | 8.3%(+23.4)#531 |
| 23. | Wadesville | 29.8% | 6.2%(+23.6)#23 | 8.3%(+21.5)#600 |
| 24. | Blocher | 29.2% | 6.2%(+23.0)#24 | 8.3%(+20.9)#629 |
| 25. | Warren Park | 28.0% | 6.2%(+21.8)#25 | 8.3%(+19.7)#679 |
| 26. | Spartanburg | 25.6% | 6.2%(+19.4)#26 | 8.3%(+17.3)#818 |
| 27. | Laud | 25.0% | 6.2%(+18.8)#27 | 8.3%(+16.7)#852 |
| 28. | Leiters Ford | 23.8% | 6.2%(+17.6)#28 | 8.3%(+15.5)#946 |
| 29. | Wheeler | 23.7% | 6.2%(+17.5)#29 | 8.3%(+15.4)#951 |
| 30. | Blue Ridge | 21.7% | 6.2%(+15.5)#30 | 8.3%(+13.4)#1,162 |
| 31. | Willow Branch | 20.9% | 6.2%(+14.7)#31 | 8.3%(+12.6)#1,279 |
| 32. | Blairsville | 20.0% | 6.2%(+13.8)#32 | 8.3%(+11.7)#1,408 |
| 33. | Fairview | 20.0% | 6.2%(+13.8)#33 | 8.3%(+11.7)#1,412 |
| 34. | East Chicago | 19.6% | 6.2%(+13.4)#34 | 8.3%(+11.3)#1,469 |
| 35. | Judah | 18.9% | 6.2%(+12.7)#35 | 8.3%(+10.6)#1,606 |
| 36. | Laurel | 18.8% | 6.2%(+12.6)#36 | 8.3%(+10.5)#1,623 |
| 37. | Flat Rock | 18.7% | 6.2%(+12.5)#37 | 8.3%(+10.4)#1,643 |
| 38. | Sumava Resorts | 18.6% | 6.2%(+12.4)#38 | 8.3%(+10.3)#1,666 |
| 39. | North Liberty | 18.3% | 6.2%(+12.1)#39 | 8.3%(+10.00)#1,712 |
| 40. | Winamac | 17.6% | 6.2%(+11.4)#40 | 8.3%(+9.30)#1,871 |
| 41. | Libertyville | 17.1% | 6.2%(+10.9)#41 | 8.3%(+8.80)#2,009 |
| 42. | Marengo | 16.7% | 6.2%(+10.5)#42 | 8.3%(+8.40)#2,103 |
| 43. | Cromwell | 16.7% | 6.2%(+10.5)#43 | 8.3%(+8.40)#2,107 |
| 44. | Adams | 16.7% | 6.2%(+10.5)#44 | 8.3%(+8.40)#2,115 |
| 45. | Bloomfield | 16.5% | 6.2%(+10.3)#45 | 8.3%(+8.20)#2,163 |
| 46. | Russellville | 16.2% | 6.2%(+10.00)#46 | 8.3%(+7.90)#2,272 |
| 47. | Stewartsville | 16.2% | 6.2%(+10.00)#47 | 8.3%(+7.90)#2,278 |
| 48. | Brookville | 15.9% | 6.2%(+9.70)#48 | 8.3%(+7.60)#2,344 |
| 49. | Hartford City | 15.8% | 6.2%(+9.60)#49 | 8.3%(+7.50)#2,377 |
| 50. | Shoals | 15.8% | 6.2%(+9.60)#50 | 8.3%(+7.50)#2,402 |
| 51. | West Lafayette | 15.7% | 6.2%(+9.50)#51 | 8.3%(+7.40)#2,419 |
| 52. | Lawrenceburg | 15.7% | 6.2%(+9.50)#52 | 8.3%(+7.40)#2,423 |
| 53. | Lake Cicott | 15.7% | 6.2%(+9.50)#53 | 8.3%(+7.40)#2,451 |
| 54. | Topeka | 15.2% | 6.2%(+9.00)#54 | 8.3%(+6.90)#2,620 |
| 55. | Alexandria | 14.9% | 6.2%(+8.70)#55 | 8.3%(+6.60)#2,714 |
| 56. | Kendallville | 14.8% | 6.2%(+8.60)#56 | 8.3%(+6.50)#2,751 |
| 57. | Gary | 14.4% | 6.2%(+8.20)#57 | 8.3%(+6.10)#2,911 |
| 58. | West Baden Springs | 14.3% | 6.2%(+8.10)#58 | 8.3%(+6.00)#2,987 |
| 59. | Kingman | 14.0% | 6.2%(+7.80)#59 | 8.3%(+5.70)#3,119 |
| 60. | Pierceville | 14.0% | 6.2%(+7.80)#60 | 8.3%(+5.70)#3,126 |
| 61. | Vevay | 13.9% | 6.2%(+7.70)#61 | 8.3%(+5.60)#3,152 |
| 62. | West Harrison | 13.8% | 6.2%(+7.60)#62 | 8.3%(+5.50)#3,211 |
| 63. | Hardinsburg | 13.2% | 6.2%(+7.00)#63 | 8.3%(+4.90)#3,487 |
| 64. | Rockport | 12.7% | 6.2%(+6.50)#64 | 8.3%(+4.40)#3,707 |
| 65. | Laketon | 12.7% | 6.2%(+6.50)#65 | 8.3%(+4.40)#3,729 |
| 66. | Marion | 12.7% | 6.2%(+6.50)#66 | 8.3%(+4.40)#3,732 |
| 67. | Vincennes | 12.6% | 6.2%(+6.40)#67 | 8.3%(+4.30)#3,739 |
| 68. | Newtown | 12.6% | 6.2%(+6.40)#68 | 8.3%(+4.30)#3,784 |
| 69. | Eugene | 12.5% | 6.2%(+6.30)#69 | 8.3%(+4.20)#3,850 |
| 70. | Peru | 12.4% | 6.2%(+6.20)#70 | 8.3%(+4.10)#3,874 |
| 71. | Knox | 12.4% | 6.2%(+6.20)#71 | 8.3%(+4.10)#3,887 |
| 72. | Milltown | 12.4% | 6.2%(+6.20)#72 | 8.3%(+4.10)#3,910 |
| 73. | Koontz Lake | 12.2% | 6.2%(+6.00)#73 | 8.3%(+3.90)#4,009 |
| 74. | Town Of Pines | 12.2% | 6.2%(+6.00)#74 | 8.3%(+3.90)#4,021 |
| 75. | Anoka | 12.2% | 6.2%(+6.00)#75 | 8.3%(+3.90)#4,034 |
| 76. | Corydon | 12.1% | 6.2%(+5.90)#76 | 8.3%(+3.80)#4,058 |
| 77. | Connersville | 11.9% | 6.2%(+5.70)#77 | 8.3%(+3.60)#4,174 |
| 78. | Spencer | 11.9% | 6.2%(+5.70)#78 | 8.3%(+3.60)#4,204 |
| 79. | Carthage | 11.9% | 6.2%(+5.70)#79 | 8.3%(+3.60)#4,225 |
| 80. | Edwardsport | 11.7% | 6.2%(+5.50)#80 | 8.3%(+3.40)#4,369 |
| 81. | Portland | 11.6% | 6.2%(+5.40)#81 | 8.3%(+3.30)#4,388 |
| 82. | Bloomington | 11.5% | 6.2%(+5.30)#82 | 8.3%(+3.20)#4,438 |
| 83. | Bedford | 11.5% | 6.2%(+5.30)#83 | 8.3%(+3.20)#4,449 |
| 84. | Cayuga | 11.5% | 6.2%(+5.30)#84 | 8.3%(+3.20)#4,480 |
| 85. | Decker | 11.5% | 6.2%(+5.30)#85 | 8.3%(+3.20)#4,509 |
| 86. | Muncie | 11.4% | 6.2%(+5.20)#86 | 8.3%(+3.10)#4,519 |
| 87. | Wildwood | 11.4% | 6.2%(+5.20)#87 | 8.3%(+3.10)#4,567 |
| 88. | Whiting | 11.1% | 6.2%(+4.90)#88 | 8.3%(+2.80)#4,723 |
| 89. | Corunna | 11.1% | 6.2%(+4.90)#89 | 8.3%(+2.80)#4,770 |
| 90. | Lafayette | 11.0% | 6.2%(+4.80)#90 | 8.3%(+2.70)#4,784 |
| 91. | Harmony | 11.0% | 6.2%(+4.80)#91 | 8.3%(+2.70)#4,850 |
| 92. | Union City | 10.9% | 6.2%(+4.70)#92 | 8.3%(+2.60)#4,898 |
| 93. | English | 10.9% | 6.2%(+4.70)#93 | 8.3%(+2.60)#4,922 |
| 94. | Schnellville | 10.9% | 6.2%(+4.70)#94 | 8.3%(+2.60)#4,952 |
| 95. | Pittsburg | 10.9% | 6.2%(+4.70)#95 | 8.3%(+2.60)#4,960 |
| 96. | Richmond | 10.8% | 6.2%(+4.60)#96 | 8.3%(+2.50)#4,969 |
| 97. | South Bend | 10.7% | 6.2%(+4.50)#97 | 8.3%(+2.40)#5,035 |
| 98. | Anderson | 10.7% | 6.2%(+4.50)#98 | 8.3%(+2.40)#5,038 |
| 99. | Atlanta | 10.7% | 6.2%(+4.50)#99 | 8.3%(+2.40)#5,085 |
| 100. | Elkhart | 10.6% | 6.2%(+4.40)#100 | 8.3%(+2.30)#5,109 |
Common Questions
What are the Top 10 Cities with the Highest Percentage of Households Without a Vehicle in Indiana?
Top 10 Cities with the Highest Percentage of Households Without a Vehicle in Indiana are:
#1
100.0%
#2
66.7%
#3
46.4%
#4
44.7%
#5
41.5%
#6
41.5%
#7
37.3%
#8
36.6%
#9
32.3%
#10
28.0%
What city has the Highest Percentage of Households Without a Vehicle in Indiana?
Clarksburg has the Highest Percentage of Households Without a Vehicle in Indiana with 100.0%.
What is the Percentage of Households Without a Vehicle in the State of Indiana?
Percentage of Households Without a Vehicle in Indiana is 6.2%.
What is the Percentage of Households Without a Vehicle in the United States?
Percentage of Households Without a Vehicle in the United States is 8.3%.