Willowbrook, CA Map & Demographics
Willowbrook Map
Willowbrook Overview
$18,816
PER CAPITA INCOME
$61,124
AVG FAMILY INCOME
$52,384
AVG HOUSEHOLD INCOME
13.6%
WAGE / INCOME GAP [ % ]
86.4¢/ $1
WAGE / INCOME GAP [ $ ]
$9,782
FAMILY INCOME DEFICIT
0.44
INEQUALITY / GINI INDEX
22,491
TOTAL POPULATION
10,963
MALE POPULATION
11,528
FEMALE POPULATION
95.10
MALES / 100 FEMALES
105.15
FEMALES / 100 MALES
30.6
MEDIAN AGE
4.3
AVG FAMILY SIZE
3.8
AVG HOUSEHOLD SIZE
10,296
LABOR FORCE [ PEOPLE ]
61.3%
PERCENT IN LABOR FORCE
13.2%
UNEMPLOYMENT RATE
Income in Willowbrook
Income Overview in Willowbrook
Per Capita Income in Willowbrook is $18,816, while median incomes of families and households are $61,124 and $52,384 respectively.
| Characteristic | Number | Measure |
| Per Capita Income | 22,491 | $18,816 |
| Median Family Income | 4,641 | $61,124 |
| Mean Family Income | 4,641 | $74,506 |
| Median Household Income | 5,918 | $52,384 |
| Mean Household Income | 5,918 | $67,389 |
| Income Deficit | 4,641 | $9,782 |
| Wage / Income Gap (%) | 22,491 | 13.65% |
| Wage / Income Gap ($) | 22,491 | 86.35¢ per $1 |
| Gini / Inequality Index | 22,491 | 0.44 |
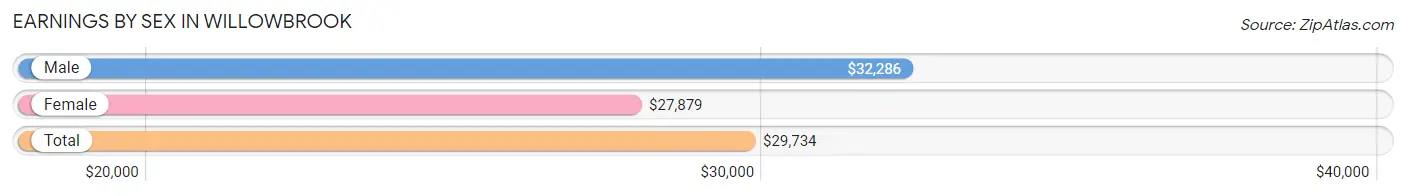
Earnings by Sex in Willowbrook
Average Earnings in Willowbrook are $29,734, $32,286 for men and $27,879 for women, a difference of 13.7%.
| Sex | Number | Average Earnings |
| Male | 5,617 (57.1%) | $32,286 |
| Female | 4,219 (42.9%) | $27,879 |
| Total | 9,836 (100.0%) | $29,734 |
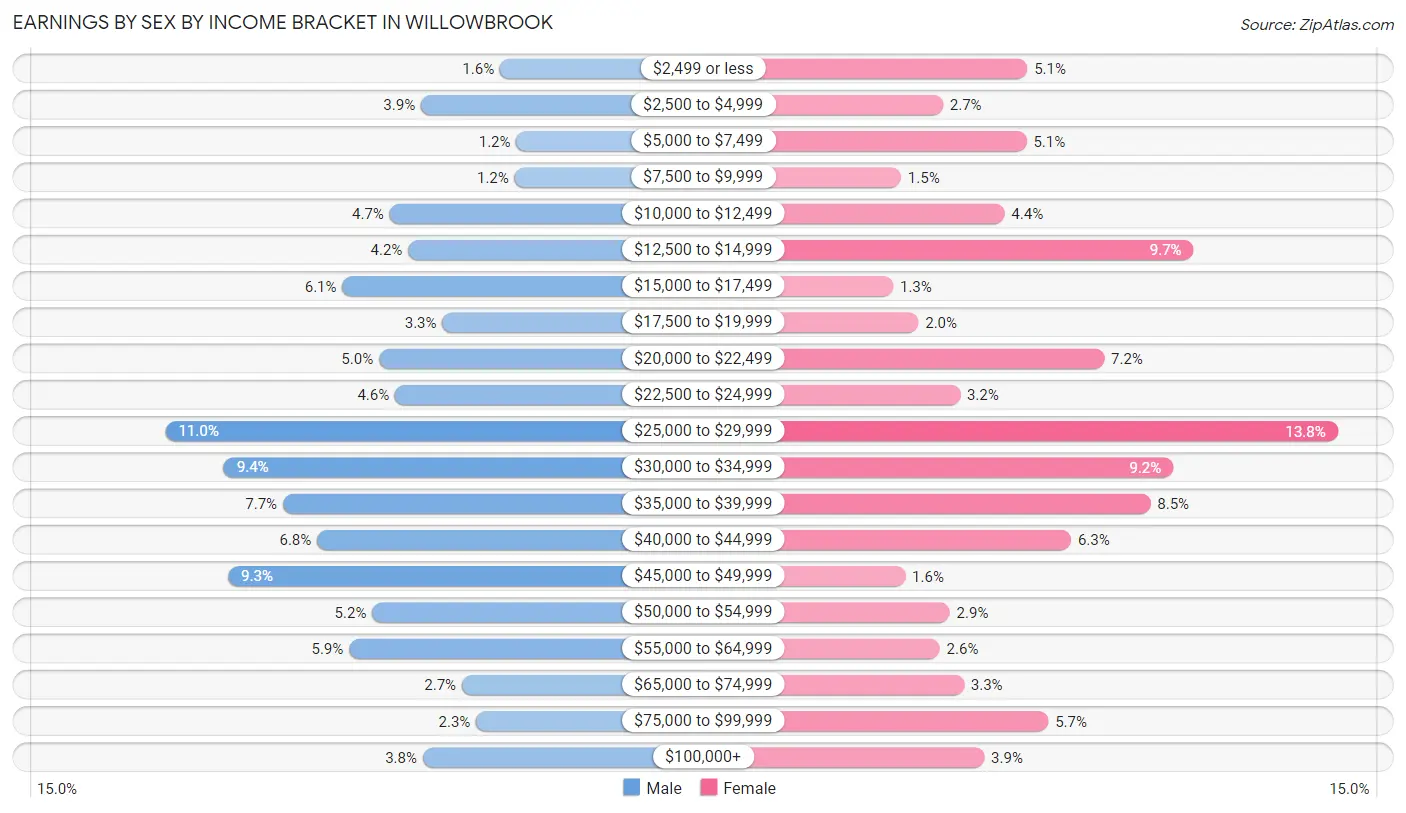
Earnings by Sex by Income Bracket in Willowbrook
The most common earnings brackets in Willowbrook are $25,000 to $29,999 for men (620 | 11.0%) and $25,000 to $29,999 for women (582 | 13.8%).
| Income | Male | Female |
| $2,499 or less | 92 (1.6%) | 214 (5.1%) |
| $2,500 to $4,999 | 217 (3.9%) | 114 (2.7%) |
| $5,000 to $7,499 | 66 (1.2%) | 213 (5.1%) |
| $7,500 to $9,999 | 69 (1.2%) | 64 (1.5%) |
| $10,000 to $12,499 | 266 (4.7%) | 187 (4.4%) |
| $12,500 to $14,999 | 237 (4.2%) | 411 (9.7%) |
| $15,000 to $17,499 | 341 (6.1%) | 55 (1.3%) |
| $17,500 to $19,999 | 183 (3.3%) | 85 (2.0%) |
| $20,000 to $22,499 | 283 (5.0%) | 305 (7.2%) |
| $22,500 to $24,999 | 258 (4.6%) | 134 (3.2%) |
| $25,000 to $29,999 | 620 (11.0%) | 582 (13.8%) |
| $30,000 to $34,999 | 528 (9.4%) | 387 (9.2%) |
| $35,000 to $39,999 | 435 (7.7%) | 360 (8.5%) |
| $40,000 to $44,999 | 381 (6.8%) | 266 (6.3%) |
| $45,000 to $49,999 | 521 (9.3%) | 69 (1.6%) |
| $50,000 to $54,999 | 294 (5.2%) | 122 (2.9%) |
| $55,000 to $64,999 | 330 (5.9%) | 110 (2.6%) |
| $65,000 to $74,999 | 152 (2.7%) | 139 (3.3%) |
| $75,000 to $99,999 | 130 (2.3%) | 239 (5.7%) |
| $100,000+ | 214 (3.8%) | 163 (3.9%) |
| Total | 5,617 (100.0%) | 4,219 (100.0%) |
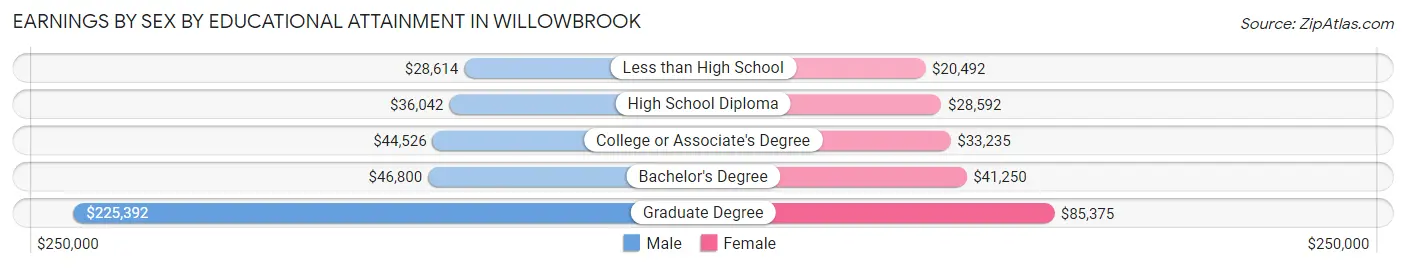
Earnings by Sex by Educational Attainment in Willowbrook
Average earnings in Willowbrook are $34,278 for men and $30,502 for women, a difference of 11.0%. Men with an educational attainment of graduate degree enjoy the highest average annual earnings of $225,392, while those with less than high school education earn the least with $28,614. Women with an educational attainment of graduate degree earn the most with the average annual earnings of $85,375, while those with less than high school education have the smallest earnings of $20,492.
| Educational Attainment | Male Income | Female Income |
| Less than High School | $28,614 | $20,492 |
| High School Diploma | $36,042 | $28,592 |
| College or Associate's Degree | $44,526 | $33,235 |
| Bachelor's Degree | $46,800 | $41,250 |
| Graduate Degree | $225,392 | $85,375 |
| Total | $34,278 | $30,502 |
Family Income in Willowbrook
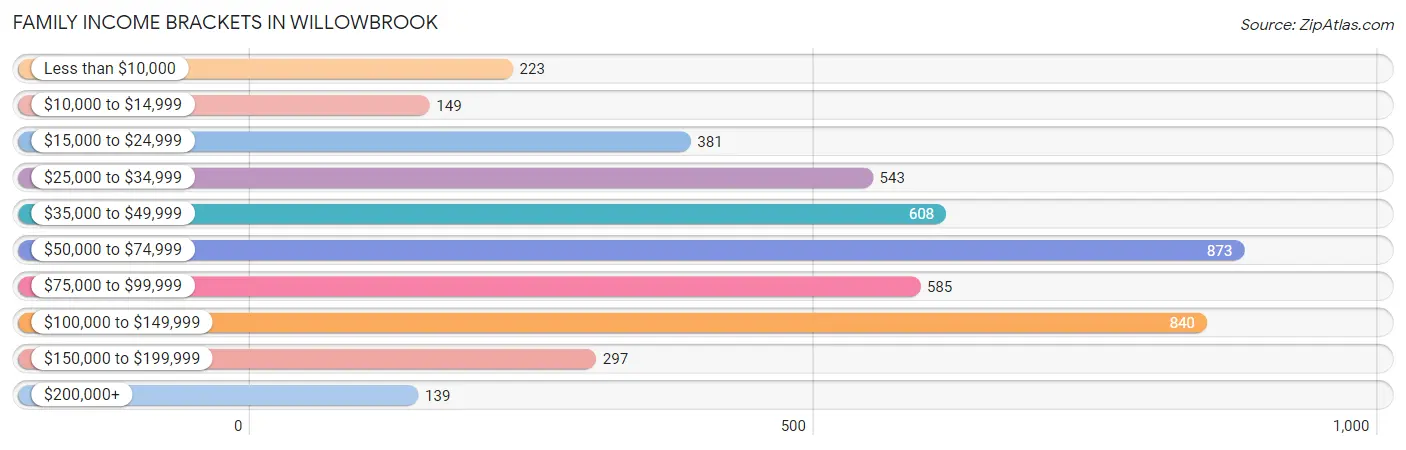
Family Income Brackets in Willowbrook
According to the Willowbrook family income data, there are 873 families falling into the $50,000 to $74,999 income range, which is the most common income bracket and makes up 18.8% of all families. Conversely, the $200,000+ income bracket is the least frequent group with only 139 families (3.0%) belonging to this category.
| Income Bracket | # Families | % Families |
| Less than $10,000 | 223 | 4.8% |
| $10,000 to $14,999 | 149 | 3.2% |
| $15,000 to $24,999 | 381 | 8.2% |
| $25,000 to $34,999 | 543 | 11.7% |
| $35,000 to $49,999 | 608 | 13.1% |
| $50,000 to $74,999 | 873 | 18.8% |
| $75,000 to $99,999 | 585 | 12.6% |
| $100,000 to $149,999 | 840 | 18.1% |
| $150,000 to $199,999 | 297 | 6.4% |
| $200,000+ | 139 | 3.0% |
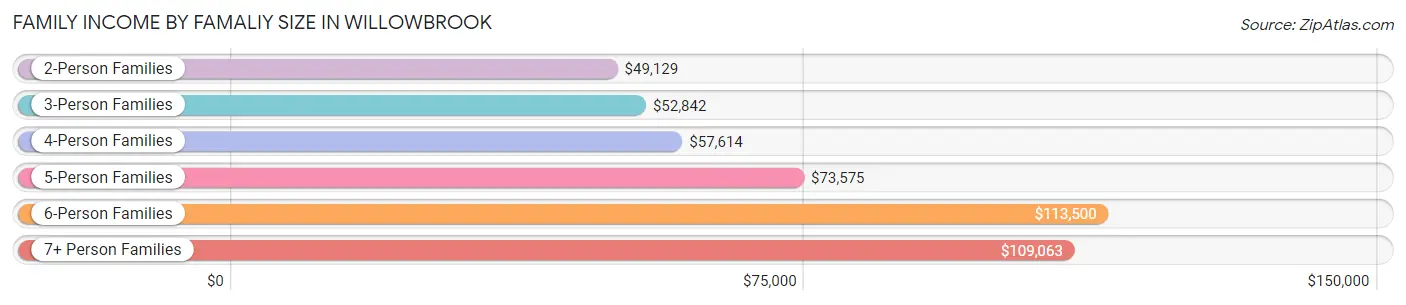
Family Income by Famaliy Size in Willowbrook
6-person families (380 | 8.2%) account for the highest median family income in Willowbrook with $113,500 per family, while 2-person families (1,138 | 24.5%) have the highest median income of $24,564 per family member.
| Income Bracket | # Families | Median Income |
| 2-Person Families | 1,138 (24.5%) | $49,129 |
| 3-Person Families | 1,074 (23.1%) | $52,842 |
| 4-Person Families | 908 (19.6%) | $57,614 |
| 5-Person Families | 709 (15.3%) | $73,575 |
| 6-Person Families | 380 (8.2%) | $113,500 |
| 7+ Person Families | 432 (9.3%) | $109,063 |
| Total | 4,641 (100.0%) | $61,124 |
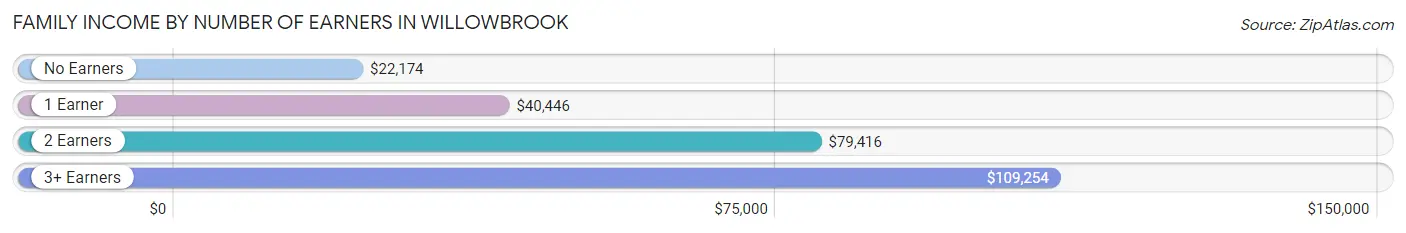
Family Income by Number of Earners in Willowbrook
The median family income in Willowbrook is $61,124, with families comprising 3+ earners (1,135) having the highest median family income of $109,254, while families with no earners (504) have the lowest median family income of $22,174, accounting for 24.5% and 10.9% of families, respectively.
| Number of Earners | # Families | Median Income |
| No Earners | 504 (10.9%) | $22,174 |
| 1 Earner | 1,942 (41.8%) | $40,446 |
| 2 Earners | 1,060 (22.8%) | $79,416 |
| 3+ Earners | 1,135 (24.5%) | $109,254 |
| Total | 4,641 (100.0%) | $61,124 |
Household Income in Willowbrook
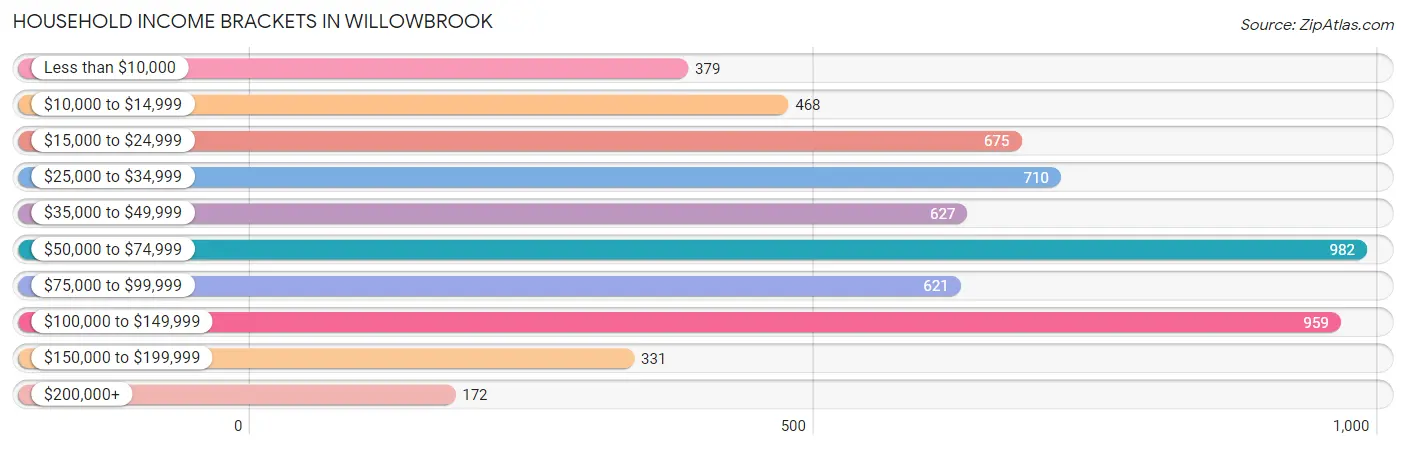
Household Income Brackets in Willowbrook
With 982 households falling in the category, the $50,000 to $74,999 income range is the most frequent in Willowbrook, accounting for 16.6% of all households. In contrast, only 172 households (2.9%) fall into the $200,000+ income bracket, making it the least populous group.
| Income Bracket | # Households | % Households |
| Less than $10,000 | 379 | 6.4% |
| $10,000 to $14,999 | 468 | 7.9% |
| $15,000 to $24,999 | 675 | 11.4% |
| $25,000 to $34,999 | 710 | 12.0% |
| $35,000 to $49,999 | 627 | 10.6% |
| $50,000 to $74,999 | 982 | 16.6% |
| $75,000 to $99,999 | 621 | 10.5% |
| $100,000 to $149,999 | 959 | 16.2% |
| $150,000 to $199,999 | 331 | 5.6% |
| $200,000+ | 172 | 2.9% |
Household Income by Householder Age in Willowbrook
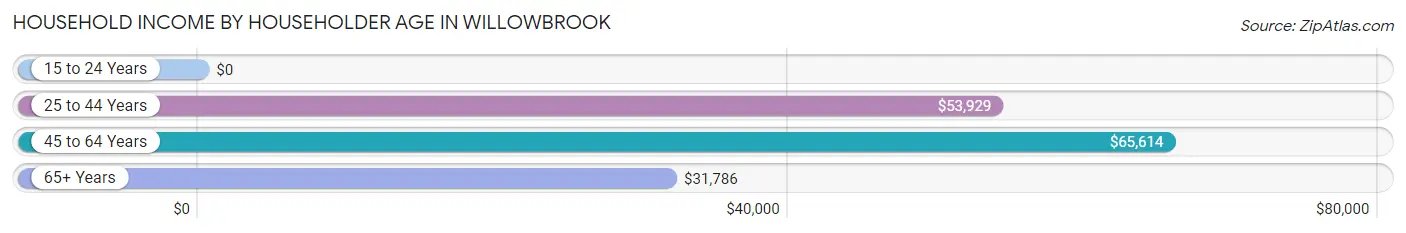
The median household income in Willowbrook is $52,384, with the highest median household income of $65,614 found in the 45 to 64 years age bracket for the primary householder. A total of 2,371 households (40.1%) fall into this category. Meanwhile, the 15 to 24 years age bracket for the primary householder has the lowest median household income of $0, with 85 households (1.4%) in this group.
| Income Bracket | # Households | Median Income |
| 15 to 24 Years | 85 (1.4%) | $0 |
| 25 to 44 Years | 2,442 (41.3%) | $53,929 |
| 45 to 64 Years | 2,371 (40.1%) | $65,614 |
| 65+ Years | 1,020 (17.2%) | $31,786 |
| Total | 5,918 (100.0%) | $52,384 |
Poverty in Willowbrook
Income Below Poverty by Sex and Age in Willowbrook
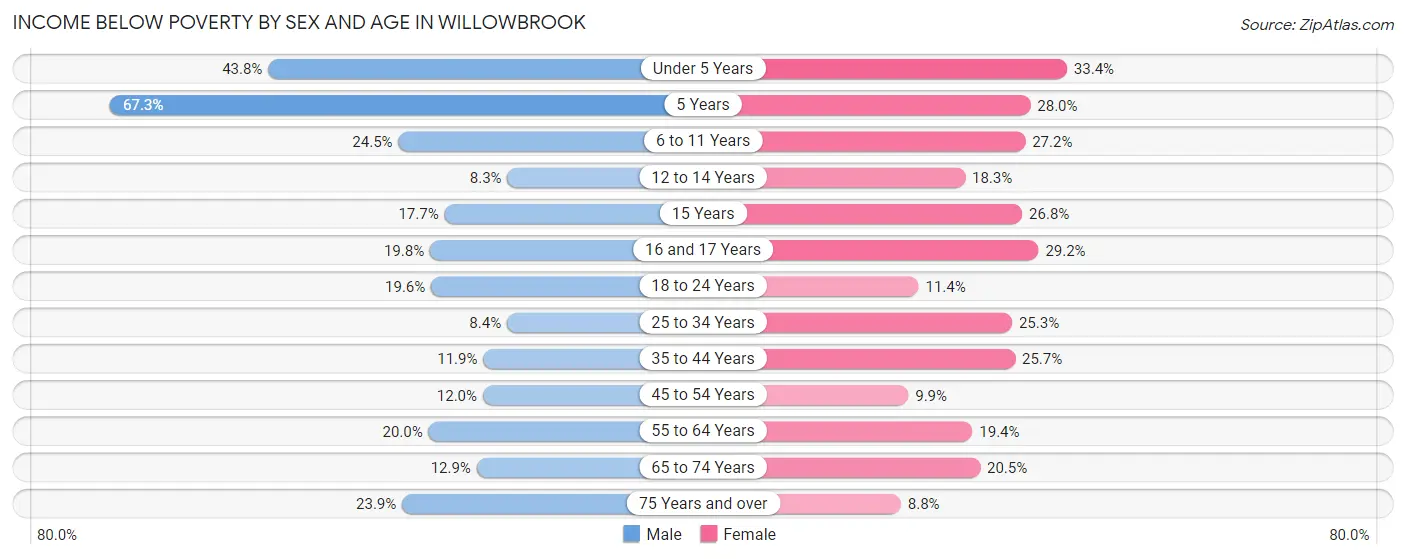
With 18.7% poverty level for males and 21.1% for females among the residents of Willowbrook, 5 year old males and under 5 year old females are the most vulnerable to poverty, with 171 males (67.3%) and 237 females (33.4%) in their respective age groups living below the poverty level.
| Age Bracket | Male | Female |
| Under 5 Years | 458 (43.8%) | 237 (33.4%) |
| 5 Years | 171 (67.3%) | 35 (28.0%) |
| 6 to 11 Years | 180 (24.5%) | 395 (27.2%) |
| 12 to 14 Years | 39 (8.3%) | 116 (18.3%) |
| 15 Years | 6 (17.6%) | 49 (26.8%) |
| 16 and 17 Years | 80 (19.8%) | 106 (29.2%) |
| 18 to 24 Years | 269 (19.6%) | 131 (11.4%) |
| 25 to 34 Years | 170 (8.4%) | 468 (25.3%) |
| 35 to 44 Years | 191 (11.9%) | 327 (25.7%) |
| 45 to 54 Years | 133 (11.9%) | 121 (9.9%) |
| 55 to 64 Years | 179 (20.0%) | 286 (19.4%) |
| 65 to 74 Years | 73 (12.9%) | 93 (20.5%) |
| 75 Years and over | 96 (23.9%) | 49 (8.8%) |
| Total | 2,045 (18.7%) | 2,413 (21.1%) |
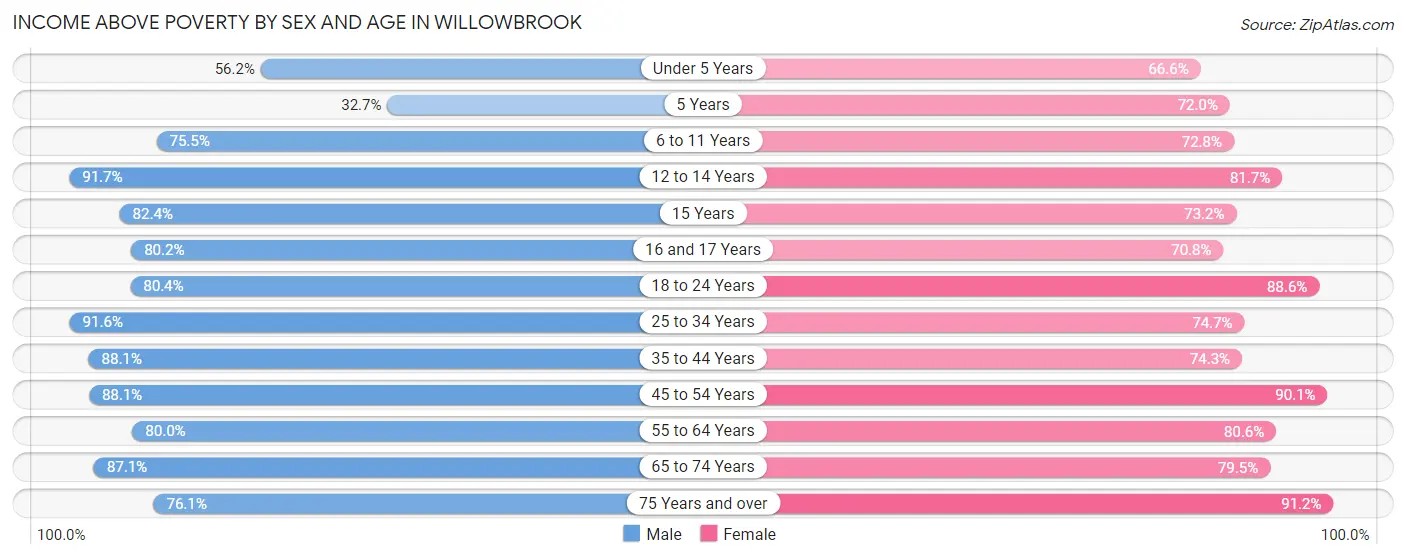
Income Above Poverty by Sex and Age in Willowbrook
According to the poverty statistics in Willowbrook, males aged 12 to 14 years and females aged 75 years and over are the age groups that are most secure financially, with 91.7% of males and 91.2% of females in these age groups living above the poverty line.
| Age Bracket | Male | Female |
| Under 5 Years | 587 (56.2%) | 472 (66.6%) |
| 5 Years | 83 (32.7%) | 90 (72.0%) |
| 6 to 11 Years | 555 (75.5%) | 1,055 (72.8%) |
| 12 to 14 Years | 431 (91.7%) | 518 (81.7%) |
| 15 Years | 28 (82.4%) | 134 (73.2%) |
| 16 and 17 Years | 324 (80.2%) | 257 (70.8%) |
| 18 to 24 Years | 1,101 (80.4%) | 1,018 (88.6%) |
| 25 to 34 Years | 1,862 (91.6%) | 1,384 (74.7%) |
| 35 to 44 Years | 1,415 (88.1%) | 944 (74.3%) |
| 45 to 54 Years | 980 (88.0%) | 1,105 (90.1%) |
| 55 to 64 Years | 715 (80.0%) | 1,189 (80.6%) |
| 65 to 74 Years | 494 (87.1%) | 360 (79.5%) |
| 75 Years and over | 305 (76.1%) | 510 (91.2%) |
| Total | 8,880 (81.3%) | 9,036 (78.9%) |
Income Below Poverty Among Married-Couple Families in Willowbrook
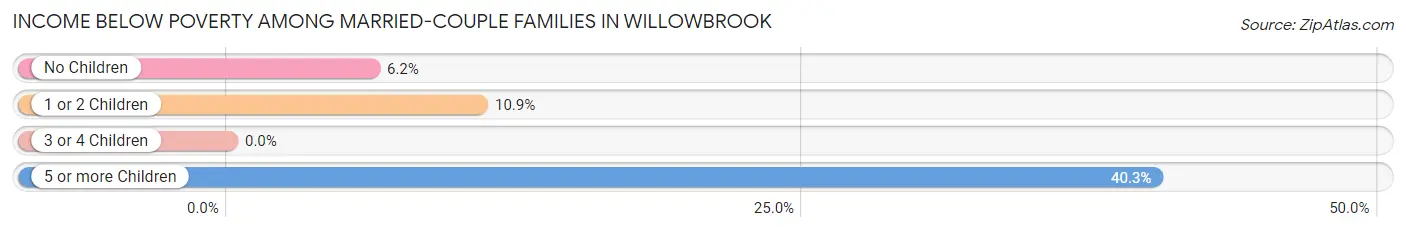
The poverty statistics for married-couple families in Willowbrook show that 8.5% or 208 of the total 2,448 families live below the poverty line. Families with 5 or more children have the highest poverty rate of 40.3%, comprising of 31 families. On the other hand, families with 3 or 4 children have the lowest poverty rate of 0.0%, which includes 0 families.
| Children | Above Poverty | Below Poverty |
| No Children | 986 (93.8%) | 65 (6.2%) |
| 1 or 2 Children | 917 (89.1%) | 112 (10.9%) |
| 3 or 4 Children | 291 (100.0%) | 0 (0.0%) |
| 5 or more Children | 46 (59.7%) | 31 (40.3%) |
| Total | 2,240 (91.5%) | 208 (8.5%) |
Income Below Poverty Among Single-Parent Households in Willowbrook
According to the poverty data in Willowbrook, 20.3% or 165 single-father households and 32.7% or 451 single-mother households are living below the poverty line. Among single-father households, those with 1 or 2 children have the highest poverty rate, with 104 households (26.2%) experiencing poverty. Likewise, among single-mother households, those with 5 or more children have the highest poverty rate, with 10 households (100.0%) falling below the poverty line.
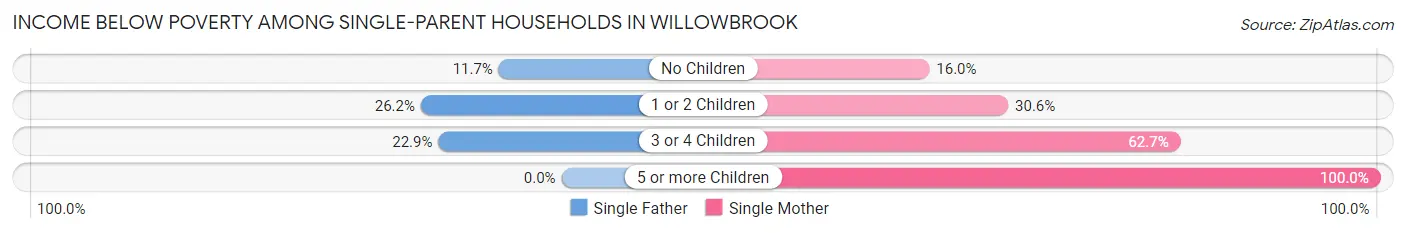
| Children | Single Father | Single Mother |
| No Children | 36 (11.7%) | 71 (16.0%) |
| 1 or 2 Children | 104 (26.2%) | 200 (30.6%) |
| 3 or 4 Children | 25 (22.9%) | 170 (62.7%) |
| 5 or more Children | 0 (0.0%) | 10 (100.0%) |
| Total | 165 (20.3%) | 451 (32.7%) |
Income Below Poverty Among Married-Couple vs Single-Parent Households in Willowbrook
The poverty data for Willowbrook shows that 208 of the married-couple family households (8.5%) and 616 of the single-parent households (28.1%) are living below the poverty level. Within the married-couple family households, those with 5 or more children have the highest poverty rate, with 31 households (40.3%) falling below the poverty line. Among the single-parent households, those with 5 or more children have the highest poverty rate, with 10 household (100.0%) living below poverty.
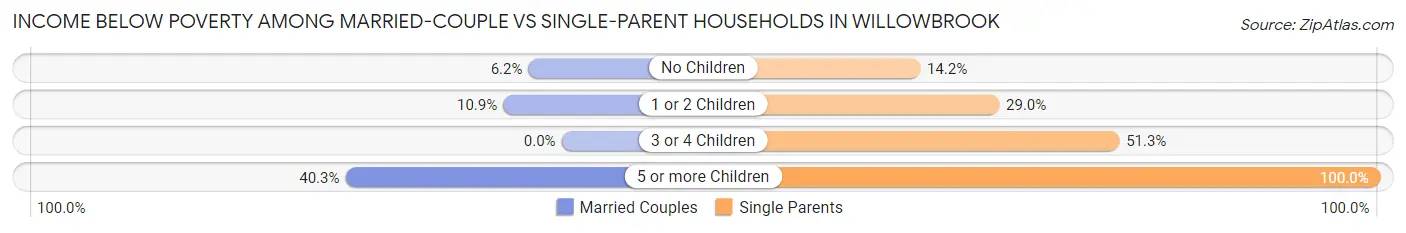
| Children | Married-Couple Families | Single-Parent Households |
| No Children | 65 (6.2%) | 107 (14.2%) |
| 1 or 2 Children | 112 (10.9%) | 304 (28.9%) |
| 3 or 4 Children | 0 (0.0%) | 195 (51.3%) |
| 5 or more Children | 31 (40.3%) | 10 (100.0%) |
| Total | 208 (8.5%) | 616 (28.1%) |
Race in Willowbrook
The most populous races in Willowbrook are Hispanic or Latino (17,774 | 79.0%), Some other Race (8,248 | 36.7%), and White / Caucasian (6,372 | 28.3%).
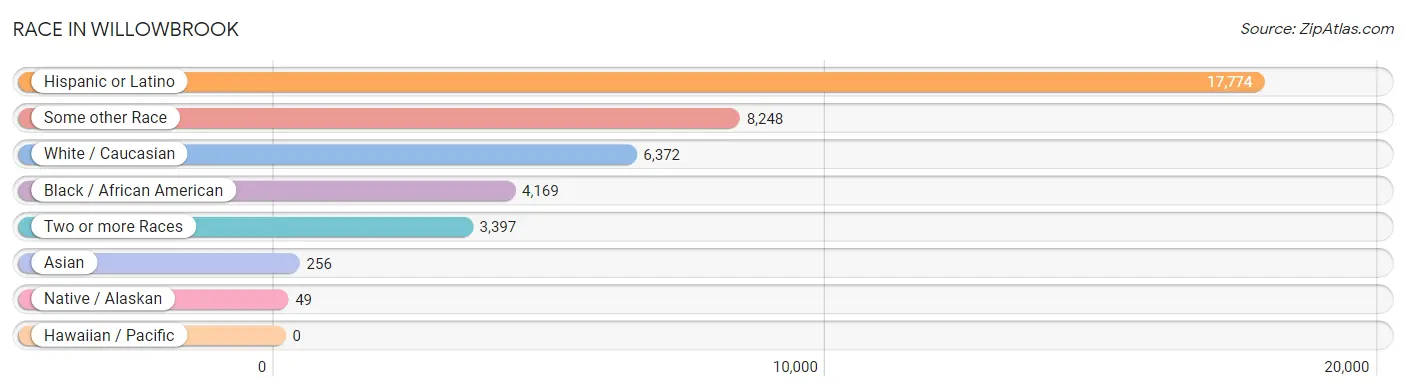
| Race | # Population | % Population |
| Asian | 256 | 1.1% |
| Black / African American | 4,169 | 18.5% |
| Hawaiian / Pacific | 0 | 0.0% |
| Hispanic or Latino | 17,774 | 79.0% |
| Native / Alaskan | 49 | 0.2% |
| White / Caucasian | 6,372 | 28.3% |
| Two or more Races | 3,397 | 15.1% |
| Some other Race | 8,248 | 36.7% |
| Total | 22,491 | 100.0% |
Ancestry in Willowbrook
The most populous ancestries reported in Willowbrook are Mexican (13,555 | 60.3%), Central American (3,499 | 15.6%), Guatemalan (1,920 | 8.5%), Salvadoran (1,262 | 5.6%), and American (645 | 2.9%), together accounting for 92.8% of all Willowbrook residents.
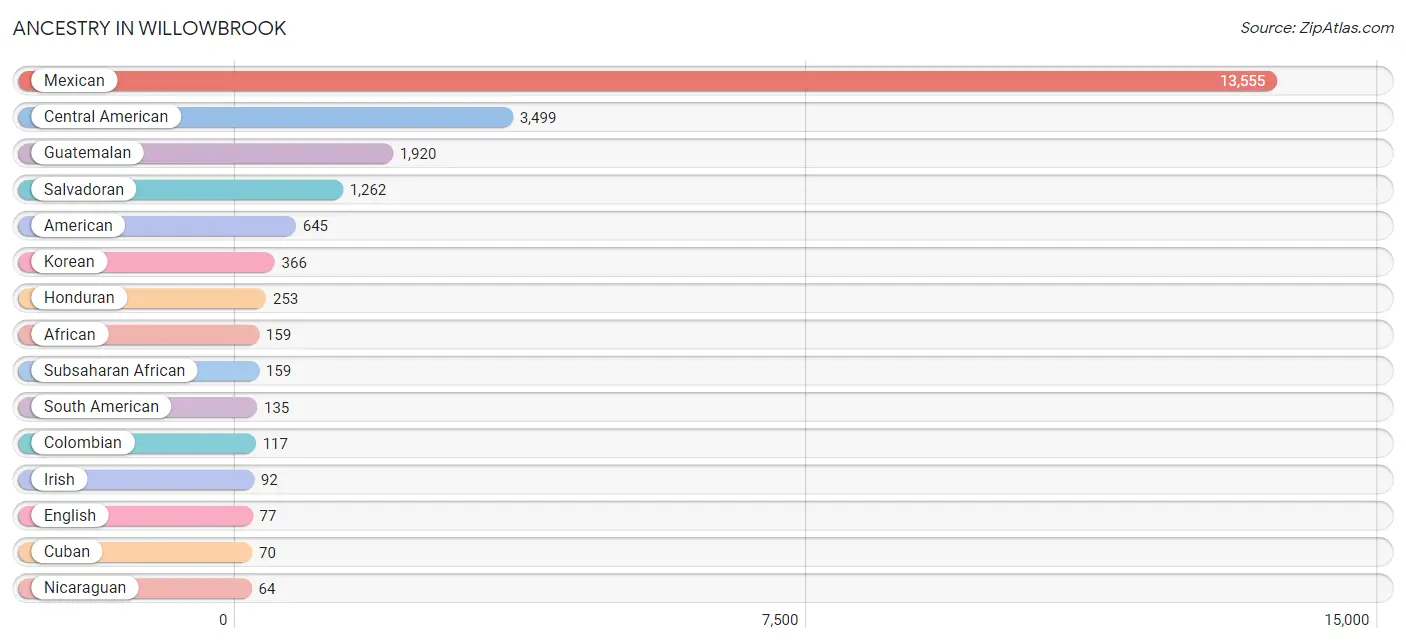
| Ancestry | # Population | % Population |
| African | 159 | 0.7% |
| American | 645 | 2.9% |
| Arab | 9 | 0.0% |
| Burmese | 27 | 0.1% |
| Central American | 3,499 | 15.6% |
| Central American Indian | 18 | 0.1% |
| Chippewa | 14 | 0.1% |
| Choctaw | 9 | 0.0% |
| Colombian | 117 | 0.5% |
| Cuban | 70 | 0.3% |
| Ecuadorian | 18 | 0.1% |
| English | 77 | 0.3% |
| European | 20 | 0.1% |
| French | 8 | 0.0% |
| German | 34 | 0.2% |
| Greek | 56 | 0.3% |
| Guatemalan | 1,920 | 8.5% |
| Honduran | 253 | 1.1% |
| Indian (Asian) | 17 | 0.1% |
| Irish | 92 | 0.4% |
| Italian | 30 | 0.1% |
| Jamaican | 5 | 0.0% |
| Korean | 366 | 1.6% |
| Mexican | 13,555 | 60.3% |
| Mexican American Indian | 35 | 0.2% |
| Navajo | 9 | 0.0% |
| Nicaraguan | 64 | 0.3% |
| Palestinian | 9 | 0.0% |
| Puerto Rican | 2 | 0.0% |
| Salvadoran | 1,262 | 5.6% |
| Scottish | 14 | 0.1% |
| South American | 135 | 0.6% |
| Spaniard | 6 | 0.0% |
| Subsaharan African | 159 | 0.7% |
| Thai | 8 | 0.0% | View All 35 Rows |
Immigrants in Willowbrook
The most numerous immigrant groups reported in Willowbrook came from Latin America (7,470 | 33.2%), Central America (7,461 | 33.2%), Mexico (4,824 | 21.4%), Guatemala (1,252 | 5.6%), and El Salvador (1,042 | 4.6%), together accounting for 98.0% of all Willowbrook residents.
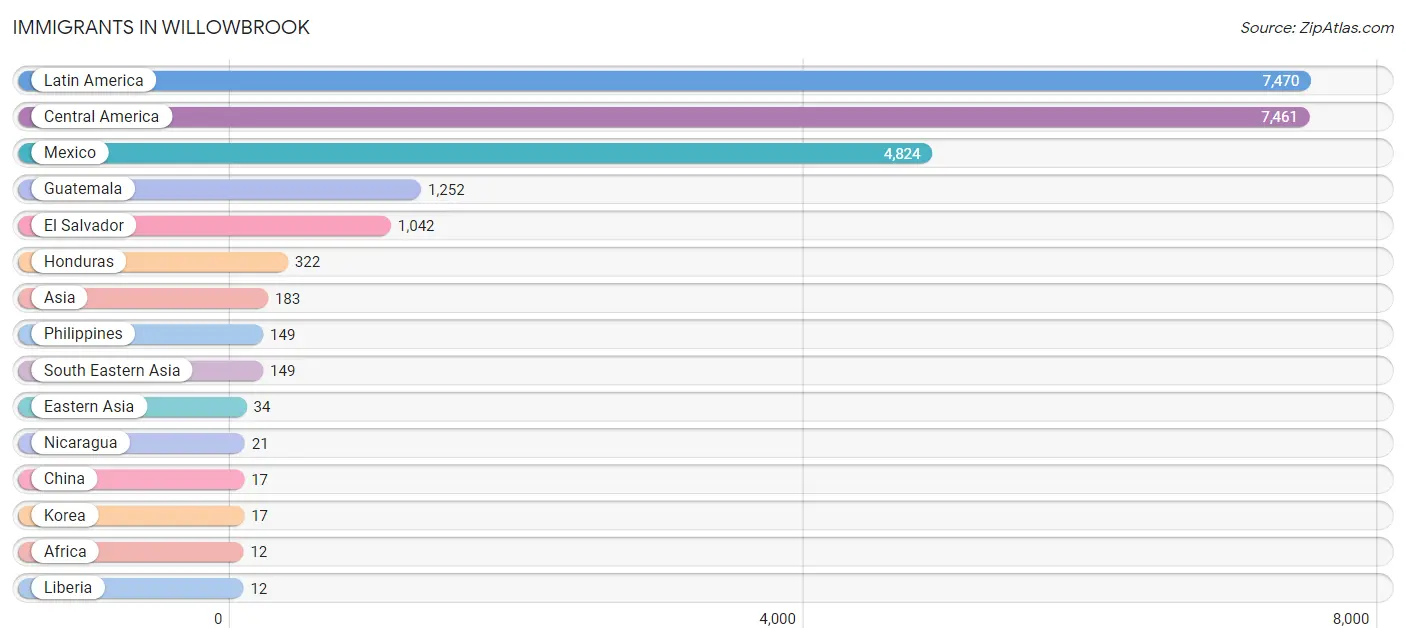
| Immigration Origin | # Population | % Population |
| Africa | 12 | 0.1% |
| Asia | 183 | 0.8% |
| Caribbean | 9 | 0.0% |
| Central America | 7,461 | 33.2% |
| China | 17 | 0.1% |
| Cuba | 9 | 0.0% |
| Eastern Asia | 34 | 0.2% |
| El Salvador | 1,042 | 4.6% |
| Guatemala | 1,252 | 5.6% |
| Honduras | 322 | 1.4% |
| Korea | 17 | 0.1% |
| Latin America | 7,470 | 33.2% |
| Liberia | 12 | 0.1% |
| Mexico | 4,824 | 21.4% |
| Nicaragua | 21 | 0.1% |
| Philippines | 149 | 0.7% |
| South Eastern Asia | 149 | 0.7% |
| Western Africa | 12 | 0.1% | View All 18 Rows |
Sex and Age in Willowbrook
Sex and Age in Willowbrook
The most populous age groups in Willowbrook are 20 to 24 Years (1,220 | 11.1%) for men and 10 to 14 Years (1,175 | 10.2%) for women.
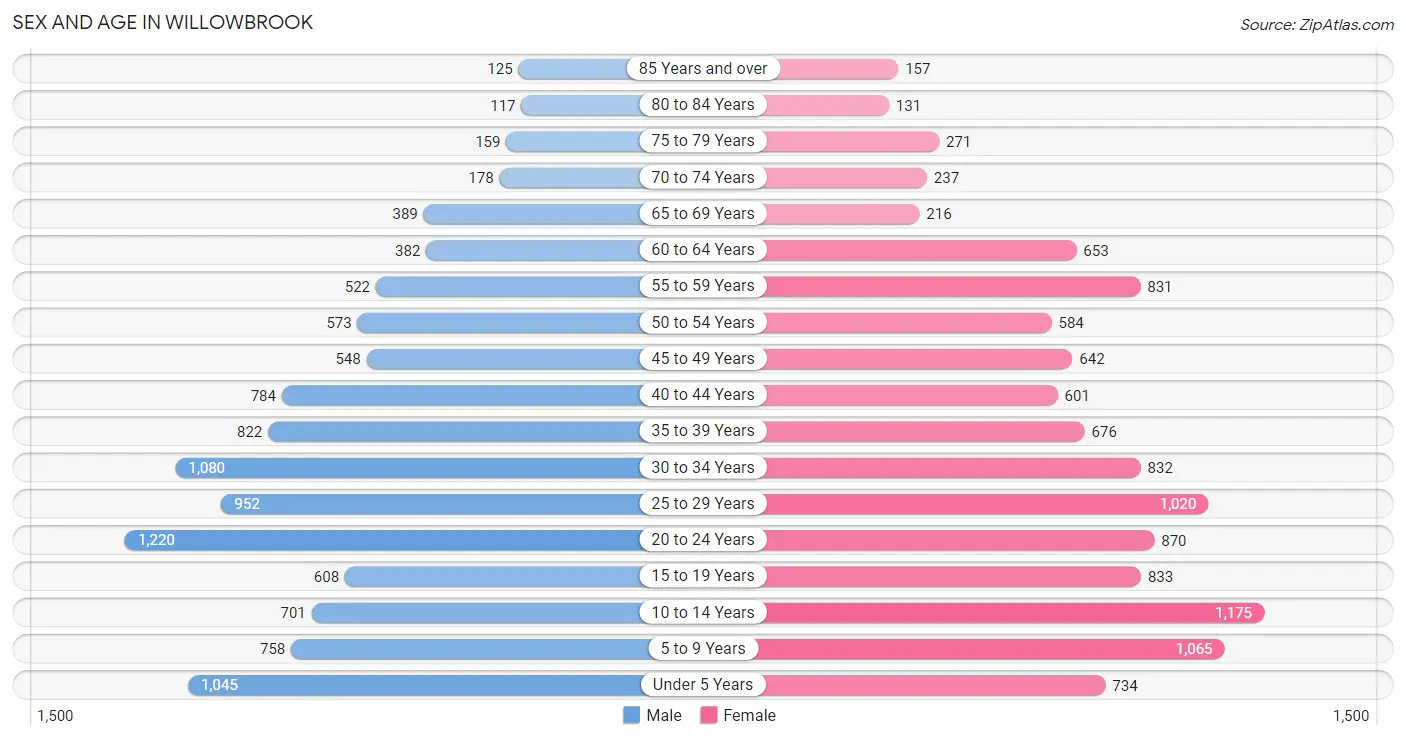
| Age Bracket | Male | Female |
| Under 5 Years | 1,045 (9.5%) | 734 (6.4%) |
| 5 to 9 Years | 758 (6.9%) | 1,065 (9.2%) |
| 10 to 14 Years | 701 (6.4%) | 1,175 (10.2%) |
| 15 to 19 Years | 608 (5.6%) | 833 (7.2%) |
| 20 to 24 Years | 1,220 (11.1%) | 870 (7.5%) |
| 25 to 29 Years | 952 (8.7%) | 1,020 (8.8%) |
| 30 to 34 Years | 1,080 (9.9%) | 832 (7.2%) |
| 35 to 39 Years | 822 (7.5%) | 676 (5.9%) |
| 40 to 44 Years | 784 (7.1%) | 601 (5.2%) |
| 45 to 49 Years | 548 (5.0%) | 642 (5.6%) |
| 50 to 54 Years | 573 (5.2%) | 584 (5.1%) |
| 55 to 59 Years | 522 (4.8%) | 831 (7.2%) |
| 60 to 64 Years | 382 (3.5%) | 653 (5.7%) |
| 65 to 69 Years | 389 (3.5%) | 216 (1.9%) |
| 70 to 74 Years | 178 (1.6%) | 237 (2.1%) |
| 75 to 79 Years | 159 (1.5%) | 271 (2.4%) |
| 80 to 84 Years | 117 (1.1%) | 131 (1.1%) |
| 85 Years and over | 125 (1.1%) | 157 (1.4%) |
| Total | 10,963 (100.0%) | 11,528 (100.0%) |
Families and Households in Willowbrook
Median Family Size in Willowbrook
The median family size in Willowbrook is 4.29 persons per family, with married-couple families (2,448 | 52.7%) accounting for the largest median family size of 4.8 persons per family. On the other hand, single male/father families (814 | 17.5%) represent the smallest median family size with 3.37 persons per family.
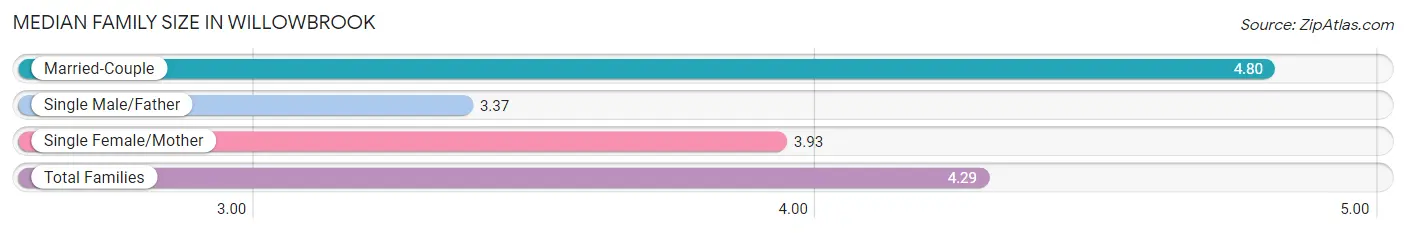
| Family Type | # Families | Family Size |
| Married-Couple | 2,448 (52.7%) | 4.80 |
| Single Male/Father | 814 (17.5%) | 3.37 |
| Single Female/Mother | 1,379 (29.7%) | 3.93 |
| Total Families | 4,641 (100.0%) | 4.29 |
Median Household Size in Willowbrook
The median household size in Willowbrook is 3.76 persons per household, with married-couple households (2,448 | 41.4%) accounting for the largest median household size of 4.86 persons per household. non-family households (1,277 | 21.6%) represent the smallest median household size with 1.15 persons per household.
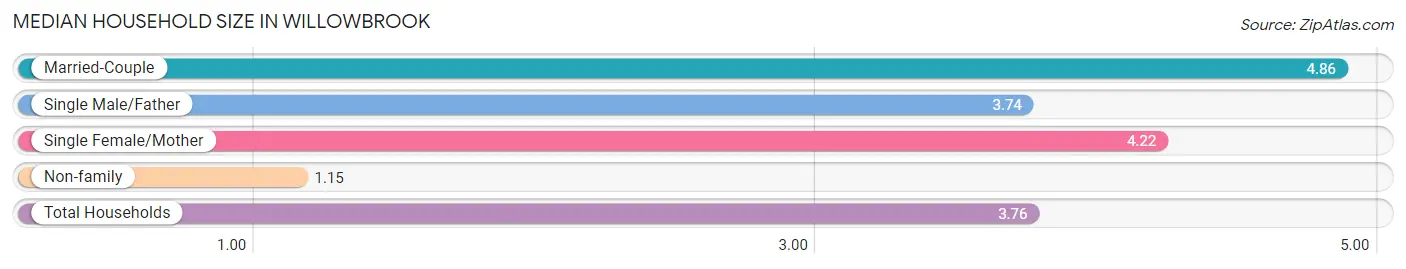
| Household Type | # Households | Household Size |
| Married-Couple | 2,448 (41.4%) | 4.86 |
| Single Male/Father | 814 (13.8%) | 3.74 |
| Single Female/Mother | 1,379 (23.3%) | 4.22 |
| Non-family | 1,277 (21.6%) | 1.15 |
| Total Households | 5,918 (100.0%) | 3.76 |
Household Size by Marriage Status in Willowbrook
Out of a total of 5,918 households in Willowbrook, 4,641 (78.4%) are family households, while 1,277 (21.6%) are nonfamily households. The most numerous type of family households are 3-person households, comprising 1,073, and the most common type of nonfamily households are 1-person households, comprising 1,139.
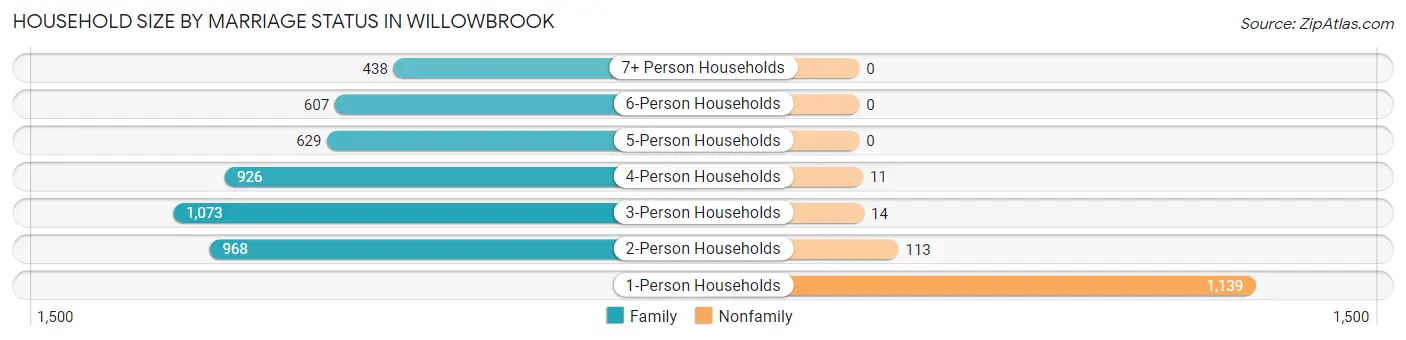
| Household Size | Family Households | Nonfamily Households |
| 1-Person Households | - | 1,139 (19.3%) |
| 2-Person Households | 968 (16.4%) | 113 (1.9%) |
| 3-Person Households | 1,073 (18.1%) | 14 (0.2%) |
| 4-Person Households | 926 (15.7%) | 11 (0.2%) |
| 5-Person Households | 629 (10.6%) | 0 (0.0%) |
| 6-Person Households | 607 (10.3%) | 0 (0.0%) |
| 7+ Person Households | 438 (7.4%) | 0 (0.0%) |
| Total | 4,641 (78.4%) | 1,277 (21.6%) |
Female Fertility in Willowbrook
Fertility by Age in Willowbrook
Average fertility rate in Willowbrook is 56.0 births per 1,000 women. Women in the age bracket of 20 to 34 years have the highest fertility rate with 95.0 births per 1,000 women. Women in the age bracket of 20 to 34 years acount for 82.5% of all women with births.
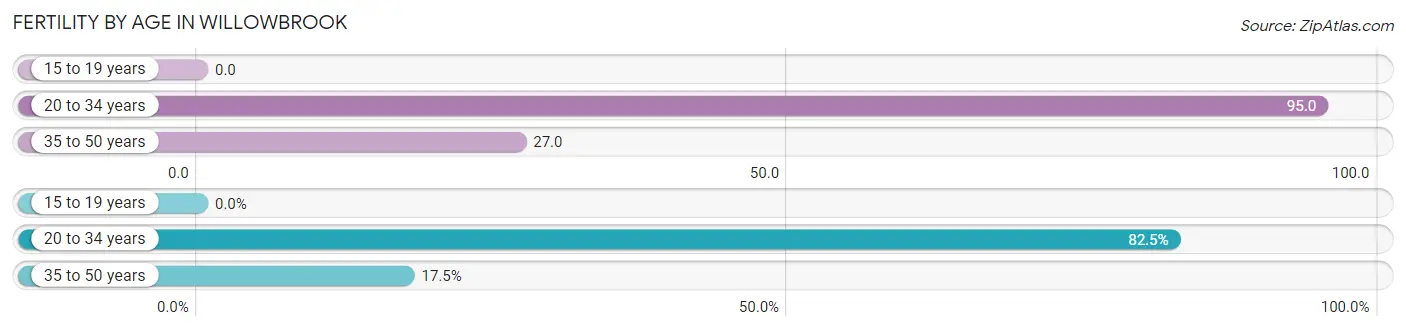
| Age Bracket | Women with Births | Births / 1,000 Women |
| 15 to 19 years | 0 (0.0%) | 0.0 |
| 20 to 34 years | 259 (82.5%) | 95.0 |
| 35 to 50 years | 55 (17.5%) | 27.0 |
| Total | 314 (100.0%) | 56.0 |
Fertility by Age by Marriage Status in Willowbrook
31.8% of women with births (314) in Willowbrook are married. The highest percentage of unmarried women with births falls into 35 to 50 years age bracket with 100.0% of them unmarried at the time of birth, while the lowest percentage of unmarried women with births belong to 20 to 34 years age bracket with 61.4% of them unmarried.
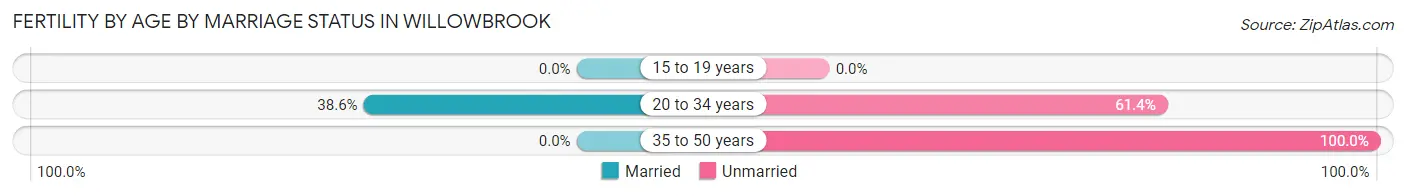
| Age Bracket | Married | Unmarried |
| 15 to 19 years | 0 (0.0%) | 0 (0.0%) |
| 20 to 34 years | 100 (38.6%) | 159 (61.4%) |
| 35 to 50 years | 0 (0.0%) | 55 (100.0%) |
| Total | 100 (31.9%) | 214 (68.1%) |
Fertility by Education in Willowbrook
Average fertility rate in Willowbrook is 56.0 births per 1,000 women. Women with the education attainment of graduate degree have the highest fertility rate of 198.0 births per 1,000 women, while women with the education attainment of college or associate's degree have the lowest fertility at 22.0 births per 1,000 women. Women with the education attainment of high school diploma represent 45.9% of all women with births.
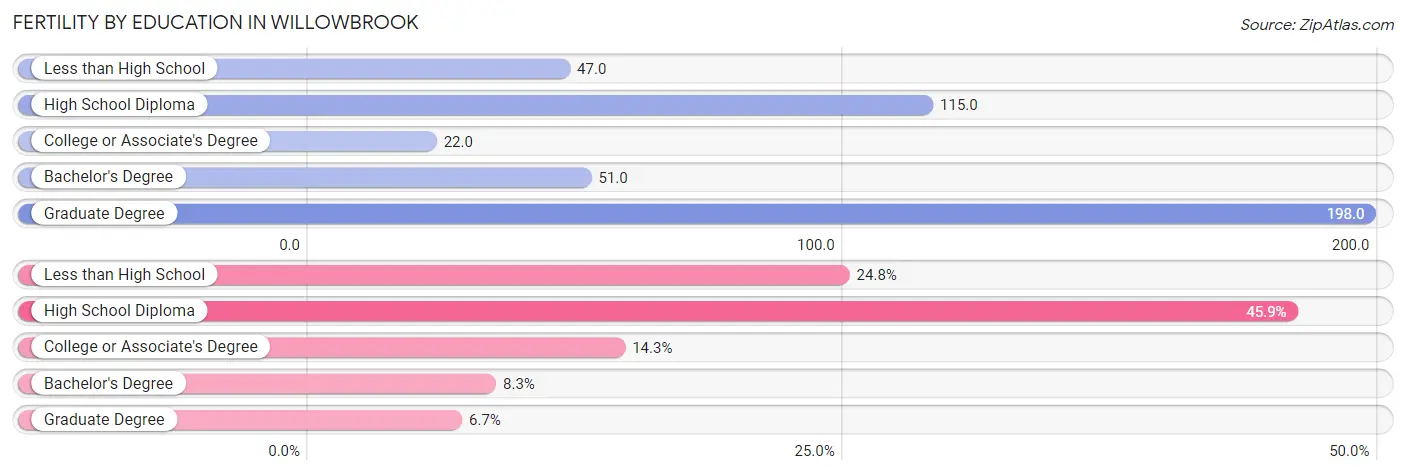
| Educational Attainment | Women with Births | Births / 1,000 Women |
| Less than High School | 78 (24.8%) | 47.0 |
| High School Diploma | 144 (45.9%) | 115.0 |
| College or Associate's Degree | 45 (14.3%) | 22.0 |
| Bachelor's Degree | 26 (8.3%) | 51.0 |
| Graduate Degree | 21 (6.7%) | 198.0 |
| Total | 314 (100.0%) | 56.0 |
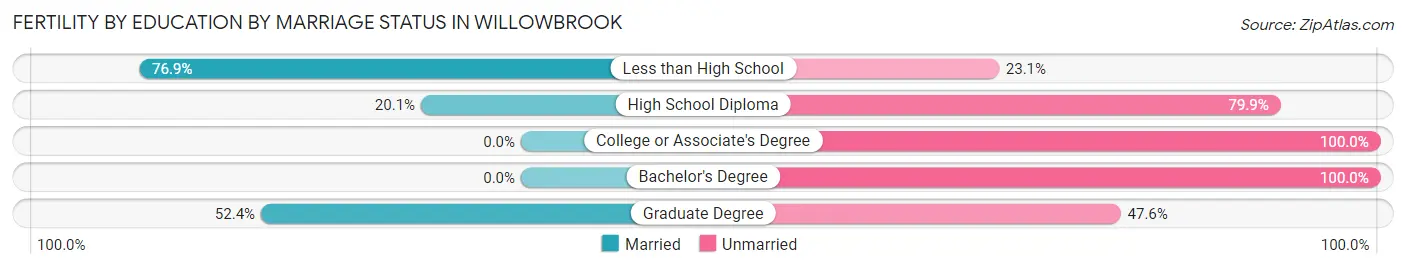
Fertility by Education by Marriage Status in Willowbrook
68.1% of women with births in Willowbrook are unmarried. Women with the educational attainment of less than high school are most likely to be married with 76.9% of them married at childbirth, while women with the educational attainment of college or associate's degree are least likely to be married with 100.0% of them unmarried at childbirth.
| Educational Attainment | Married | Unmarried |
| Less than High School | 60 (76.9%) | 18 (23.1%) |
| High School Diploma | 29 (20.1%) | 115 (79.9%) |
| College or Associate's Degree | 0 (0.0%) | 45 (100.0%) |
| Bachelor's Degree | 0 (0.0%) | 26 (100.0%) |
| Graduate Degree | 11 (52.4%) | 10 (47.6%) |
| Total | 100 (31.9%) | 214 (68.1%) |
Employment Characteristics in Willowbrook
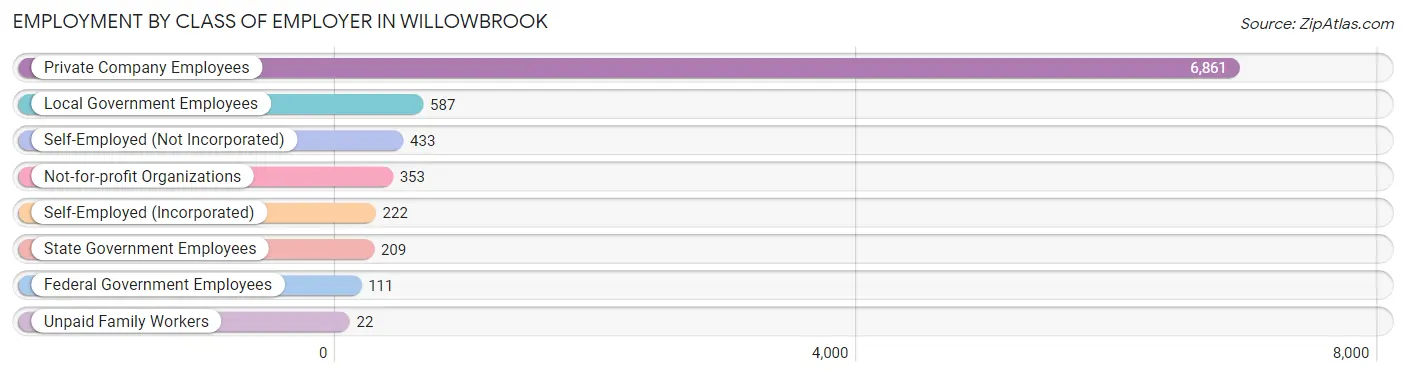
Employment by Class of Employer in Willowbrook
Among the 8,798 employed individuals in Willowbrook, private company employees (6,861 | 78.0%), local government employees (587 | 6.7%), and self-employed (not incorporated) (433 | 4.9%) make up the most common classes of employment.
| Employer Class | # Employees | % Employees |
| Private Company Employees | 6,861 | 78.0% |
| Self-Employed (Incorporated) | 222 | 2.5% |
| Self-Employed (Not Incorporated) | 433 | 4.9% |
| Not-for-profit Organizations | 353 | 4.0% |
| Local Government Employees | 587 | 6.7% |
| State Government Employees | 209 | 2.4% |
| Federal Government Employees | 111 | 1.3% |
| Unpaid Family Workers | 22 | 0.3% |
| Total | 8,798 | 100.0% |
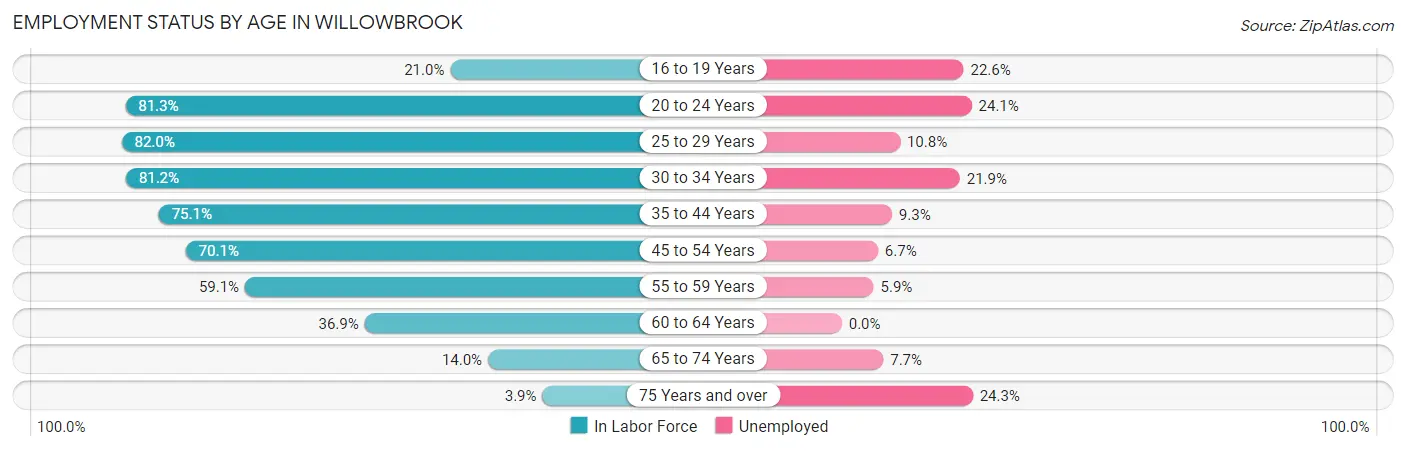
Employment Status by Age in Willowbrook
According to the labor force statistics for Willowbrook, out of the total population over 16 years of age (16,796), 61.3% or 10,296 individuals are in the labor force, with 13.2% or 1,359 of them unemployed. The age group with the highest labor force participation rate is 25 to 29 years, with 82.0% or 1,617 individuals in the labor force. Within the labor force, the 75 years and over age range has the highest percentage of unemployed individuals, with 24.3% or 9 of them being unemployed.
| Age Bracket | In Labor Force | Unemployed |
| 16 to 19 Years | 257 (21.0%) | 58 (22.6%) |
| 20 to 24 Years | 1,699 (81.3%) | 409 (24.1%) |
| 25 to 29 Years | 1,617 (82.0%) | 175 (10.8%) |
| 30 to 34 Years | 1,553 (81.2%) | 340 (21.9%) |
| 35 to 44 Years | 2,165 (75.1%) | 201 (9.3%) |
| 45 to 54 Years | 1,645 (70.1%) | 110 (6.7%) |
| 55 to 59 Years | 800 (59.1%) | 47 (5.9%) |
| 60 to 64 Years | 382 (36.9%) | 0 (0.0%) |
| 65 to 74 Years | 143 (14.0%) | 11 (7.7%) |
| 75 Years and over | 37 (3.9%) | 9 (24.3%) |
| Total | 10,296 (61.3%) | 1,359 (13.2%) |
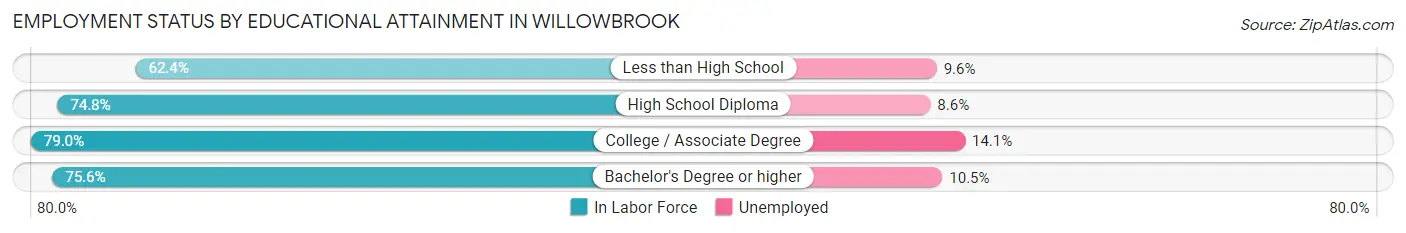
Employment Status by Educational Attainment in Willowbrook
According to labor force statistics for Willowbrook, 71.0% of individuals (8,166) out of the total population between 25 and 64 years of age (11,502) are in the labor force, with 10.7% or 874 of them being unemployed. The group with the highest labor force participation rate are those with the educational attainment of college / associate degree, with 79.0% or 2,255 individuals in the labor force. Within the labor force, individuals with college / associate degree education have the highest percentage of unemployment, with 14.1% or 318 of them being unemployed.
| Educational Attainment | In Labor Force | Unemployed |
| Less than High School | 2,880 (62.4%) | 443 (9.6%) |
| High School Diploma | 2,000 (74.8%) | 230 (8.6%) |
| College / Associate Degree | 2,255 (79.0%) | 402 (14.1%) |
| Bachelor's Degree or higher | 1,027 (75.6%) | 143 (10.5%) |
| Total | 8,166 (71.0%) | 1,231 (10.7%) |
Employment Occupations by Sex in Willowbrook
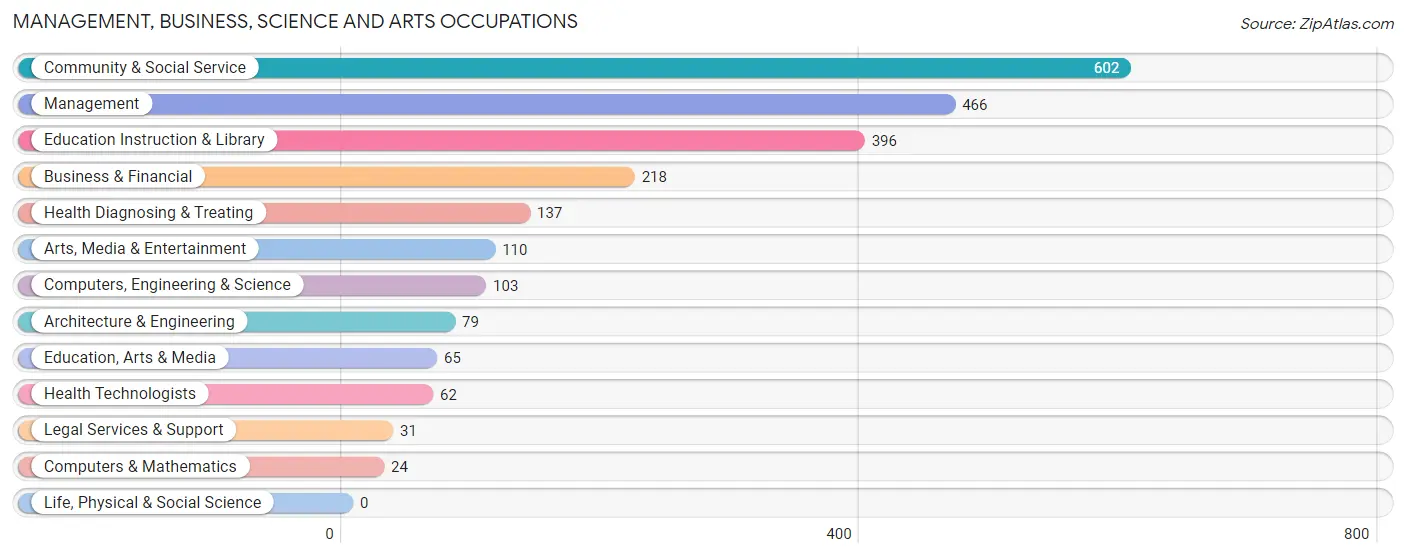
Management, Business, Science and Arts Occupations
The most common Management, Business, Science and Arts occupations in Willowbrook are Community & Social Service (602 | 6.7%), Management (466 | 5.2%), Education Instruction & Library (396 | 4.4%), Business & Financial (218 | 2.4%), and Health Diagnosing & Treating (137 | 1.5%).
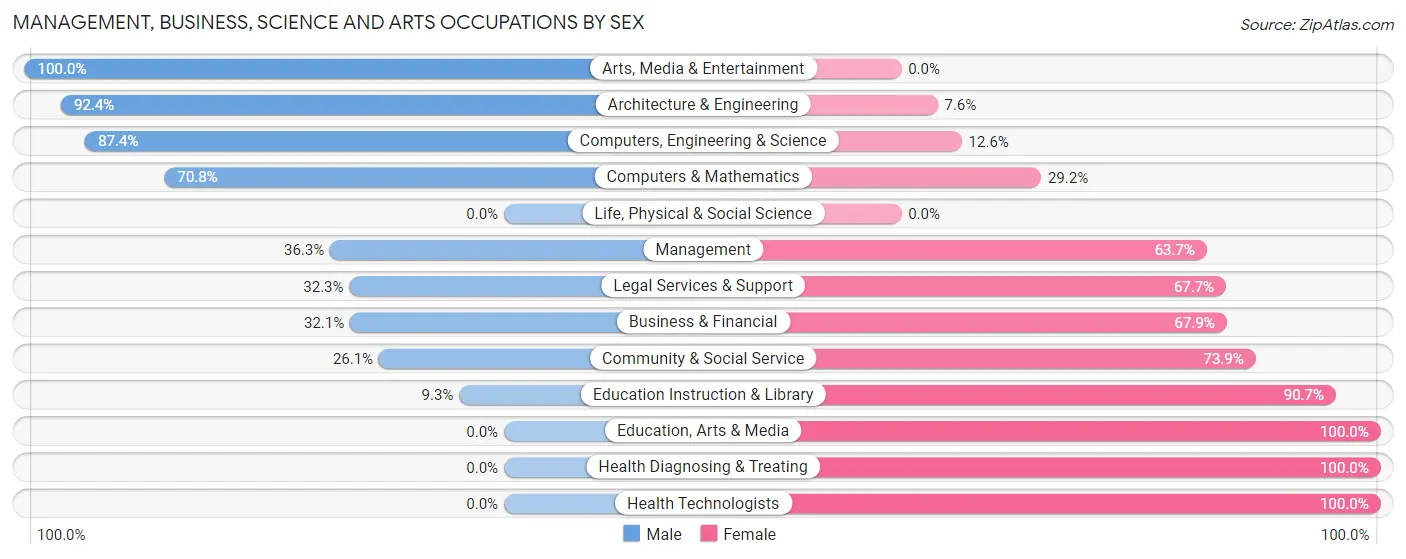
Management, Business, Science and Arts Occupations by Sex
Within the Management, Business, Science and Arts occupations in Willowbrook, the most male-oriented occupations are Arts, Media & Entertainment (100.0%), Architecture & Engineering (92.4%), and Computers, Engineering & Science (87.4%), while the most female-oriented occupations are Education, Arts & Media (100.0%), Health Diagnosing & Treating (100.0%), and Health Technologists (100.0%).
| Occupation | Male | Female |
| Management | 169 (36.3%) | 297 (63.7%) |
| Business & Financial | 70 (32.1%) | 148 (67.9%) |
| Computers, Engineering & Science | 90 (87.4%) | 13 (12.6%) |
| Computers & Mathematics | 17 (70.8%) | 7 (29.2%) |
| Architecture & Engineering | 73 (92.4%) | 6 (7.6%) |
| Life, Physical & Social Science | 0 (0.0%) | 0 (0.0%) |
| Community & Social Service | 157 (26.1%) | 445 (73.9%) |
| Education, Arts & Media | 0 (0.0%) | 65 (100.0%) |
| Legal Services & Support | 10 (32.3%) | 21 (67.7%) |
| Education Instruction & Library | 37 (9.3%) | 359 (90.7%) |
| Arts, Media & Entertainment | 110 (100.0%) | 0 (0.0%) |
| Health Diagnosing & Treating | 0 (0.0%) | 137 (100.0%) |
| Health Technologists | 0 (0.0%) | 62 (100.0%) |
| Total (Category) | 486 (31.9%) | 1,040 (68.1%) |
| Total (Overall) | 5,103 (57.1%) | 3,832 (42.9%) |
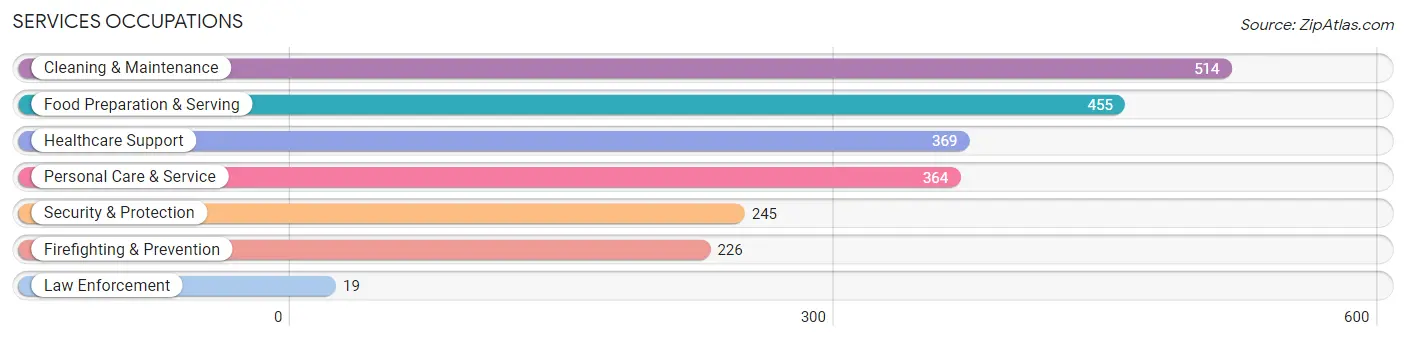
Services Occupations
The most common Services occupations in Willowbrook are Cleaning & Maintenance (514 | 5.8%), Food Preparation & Serving (455 | 5.1%), Healthcare Support (369 | 4.1%), Personal Care & Service (364 | 4.1%), and Security & Protection (245 | 2.7%).
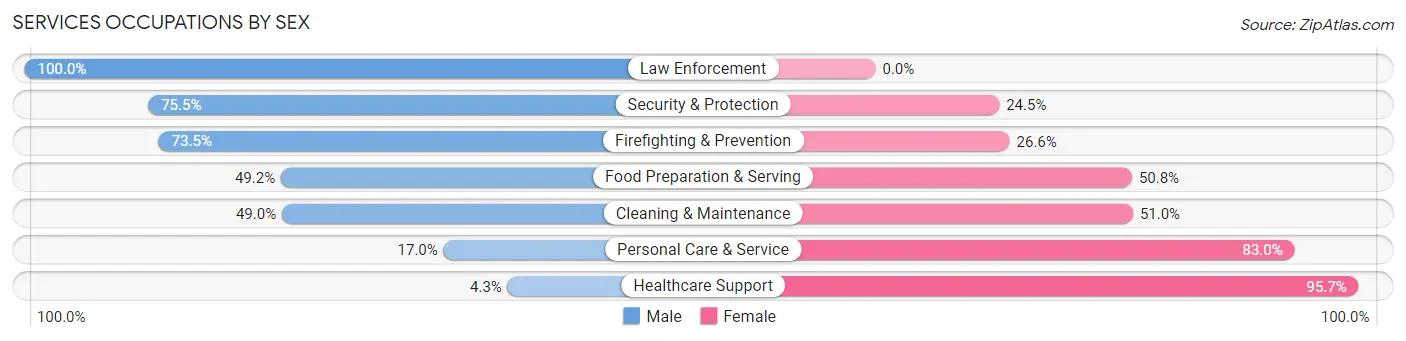
Services Occupations by Sex
Within the Services occupations in Willowbrook, the most male-oriented occupations are Law Enforcement (100.0%), Security & Protection (75.5%), and Firefighting & Prevention (73.5%), while the most female-oriented occupations are Healthcare Support (95.7%), Personal Care & Service (83.0%), and Cleaning & Maintenance (51.0%).
| Occupation | Male | Female |
| Healthcare Support | 16 (4.3%) | 353 (95.7%) |
| Security & Protection | 185 (75.5%) | 60 (24.5%) |
| Firefighting & Prevention | 166 (73.5%) | 60 (26.6%) |
| Law Enforcement | 19 (100.0%) | 0 (0.0%) |
| Food Preparation & Serving | 224 (49.2%) | 231 (50.8%) |
| Cleaning & Maintenance | 252 (49.0%) | 262 (51.0%) |
| Personal Care & Service | 62 (17.0%) | 302 (83.0%) |
| Total (Category) | 739 (38.0%) | 1,208 (62.0%) |
| Total (Overall) | 5,103 (57.1%) | 3,832 (42.9%) |
Sales and Office Occupations
The most common Sales and Office occupations in Willowbrook are Office & Administration (1,230 | 13.8%), and Sales & Related (640 | 7.2%).

Sales and Office Occupations by Sex
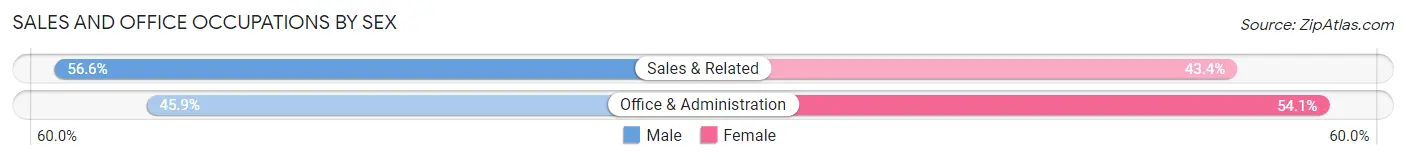
| Occupation | Male | Female |
| Sales & Related | 362 (56.6%) | 278 (43.4%) |
| Office & Administration | 565 (45.9%) | 665 (54.1%) |
| Total (Category) | 927 (49.6%) | 943 (50.4%) |
| Total (Overall) | 5,103 (57.1%) | 3,832 (42.9%) |
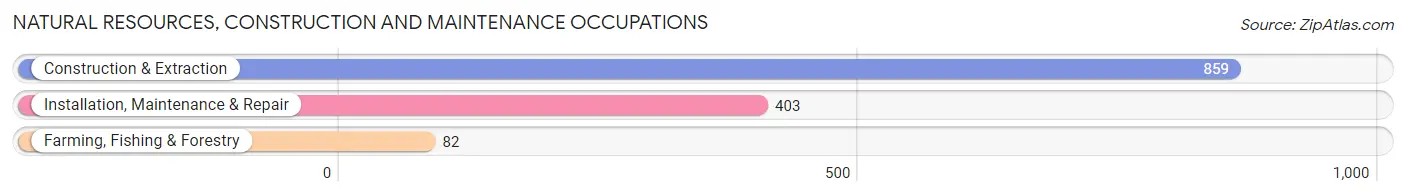
Natural Resources, Construction and Maintenance Occupations
The most common Natural Resources, Construction and Maintenance occupations in Willowbrook are Construction & Extraction (859 | 9.6%), Installation, Maintenance & Repair (403 | 4.5%), and Farming, Fishing & Forestry (82 | 0.9%).
Natural Resources, Construction and Maintenance Occupations by Sex
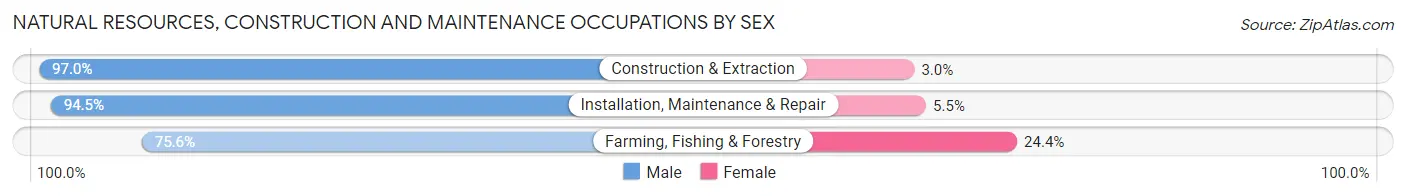
| Occupation | Male | Female |
| Farming, Fishing & Forestry | 62 (75.6%) | 20 (24.4%) |
| Construction & Extraction | 833 (97.0%) | 26 (3.0%) |
| Installation, Maintenance & Repair | 381 (94.5%) | 22 (5.5%) |
| Total (Category) | 1,276 (94.9%) | 68 (5.1%) |
| Total (Overall) | 5,103 (57.1%) | 3,832 (42.9%) |
Production, Transportation and Moving Occupations
The most common Production, Transportation and Moving occupations in Willowbrook are Material Moving (863 | 9.7%), Production (726 | 8.1%), and Transportation (659 | 7.4%).
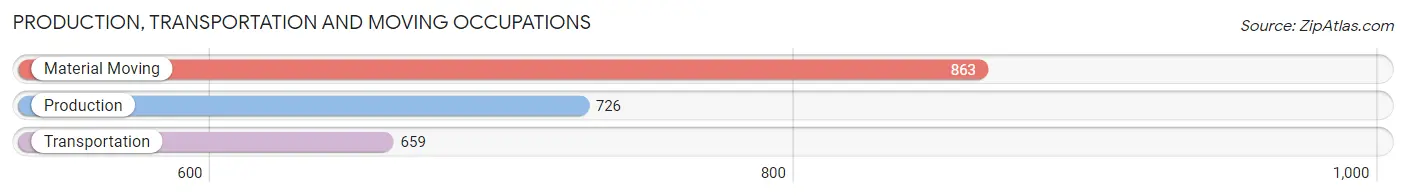
Production, Transportation and Moving Occupations by Sex
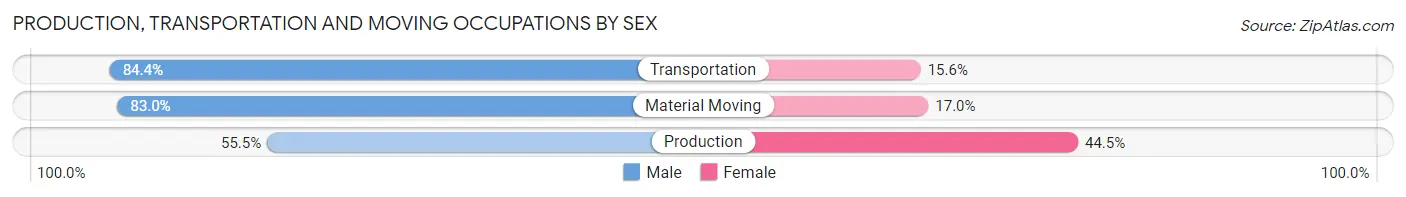
| Occupation | Male | Female |
| Production | 403 (55.5%) | 323 (44.5%) |
| Transportation | 556 (84.4%) | 103 (15.6%) |
| Material Moving | 716 (83.0%) | 147 (17.0%) |
| Total (Category) | 1,675 (74.5%) | 573 (25.5%) |
| Total (Overall) | 5,103 (57.1%) | 3,832 (42.9%) |
Employment Industries by Sex in Willowbrook
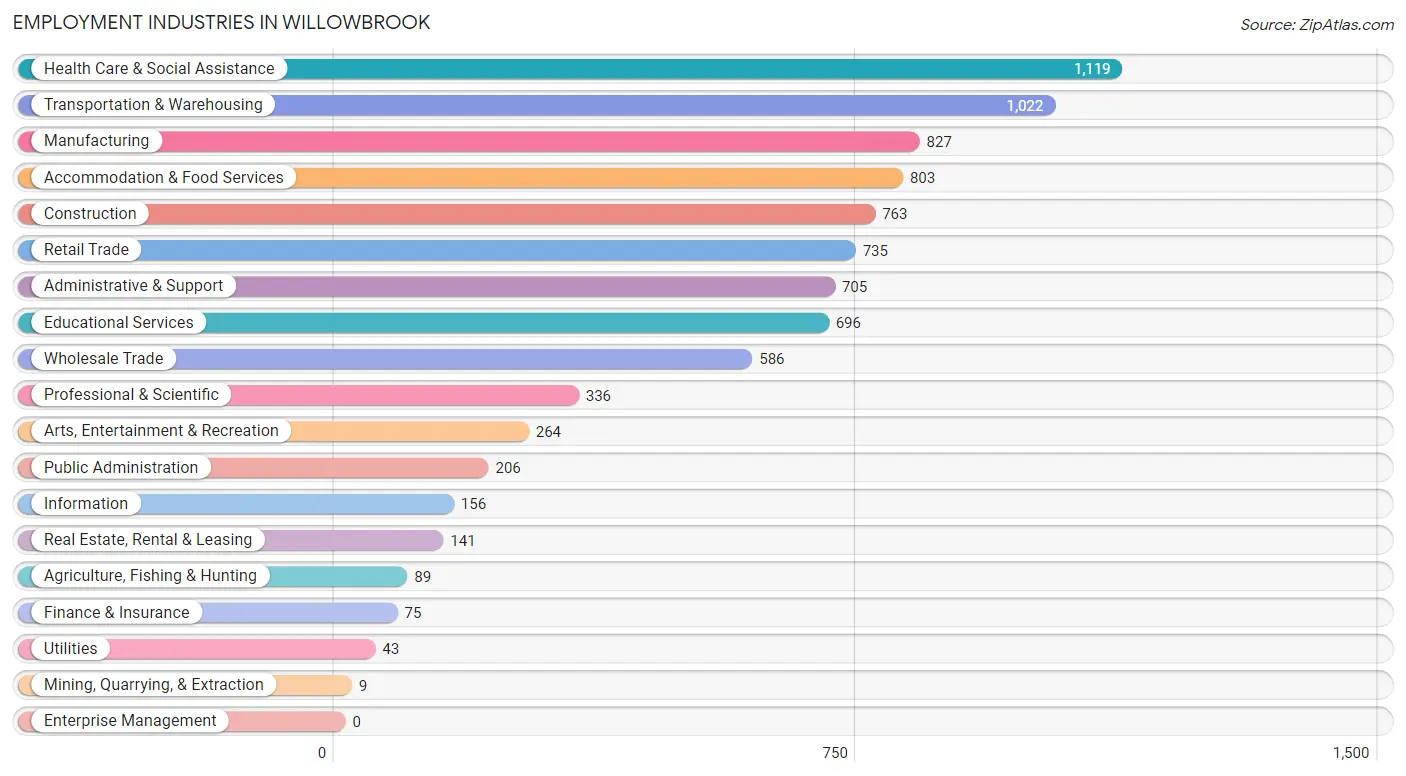
Employment Industries in Willowbrook
The major employment industries in Willowbrook include Health Care & Social Assistance (1,119 | 12.5%), Transportation & Warehousing (1,022 | 11.4%), Manufacturing (827 | 9.3%), Accommodation & Food Services (803 | 9.0%), and Construction (763 | 8.5%).
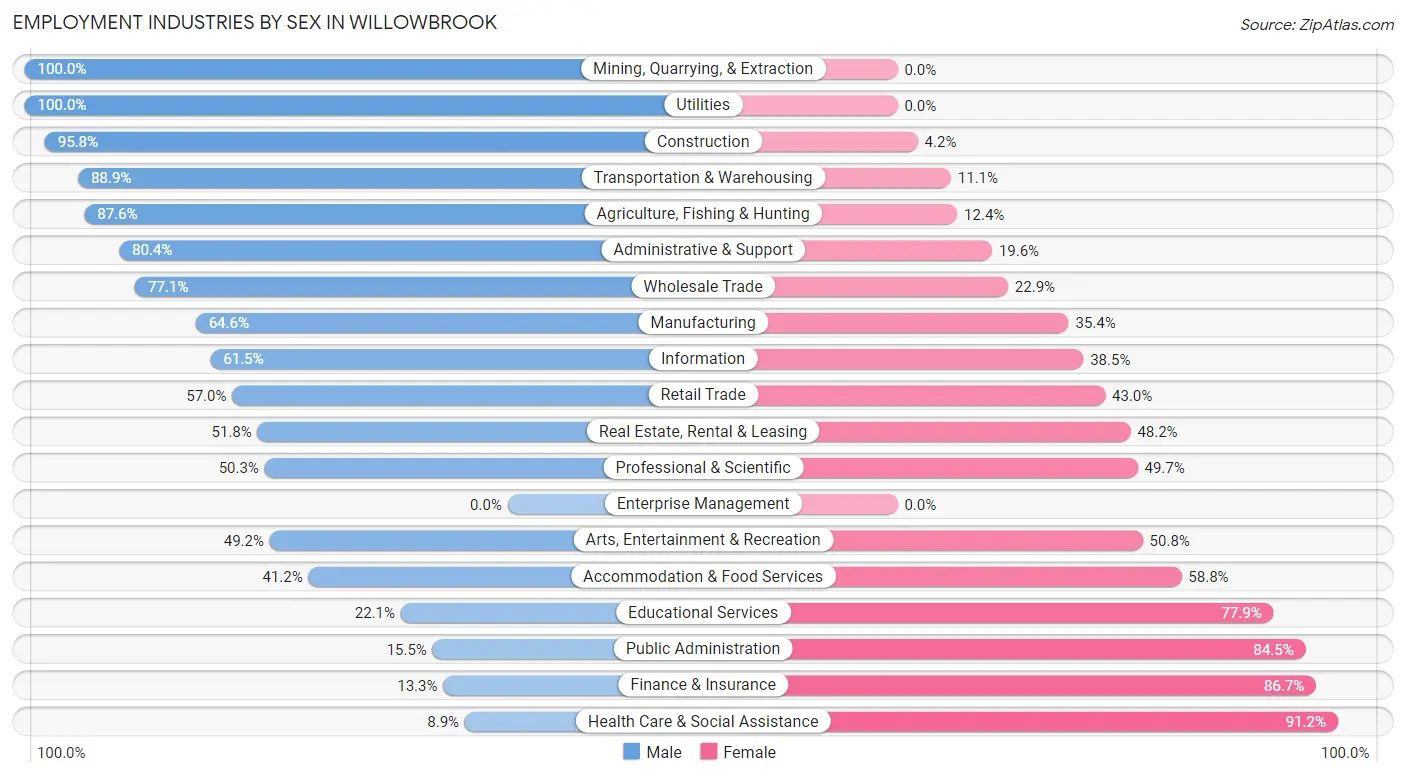
Employment Industries by Sex in Willowbrook
The Willowbrook industries that see more men than women are Mining, Quarrying, & Extraction (100.0%), Utilities (100.0%), and Construction (95.8%), whereas the industries that tend to have a higher number of women are Health Care & Social Assistance (91.1%), Finance & Insurance (86.7%), and Public Administration (84.5%).
| Industry | Male | Female |
| Agriculture, Fishing & Hunting | 78 (87.6%) | 11 (12.4%) |
| Mining, Quarrying, & Extraction | 9 (100.0%) | 0 (0.0%) |
| Construction | 731 (95.8%) | 32 (4.2%) |
| Manufacturing | 534 (64.6%) | 293 (35.4%) |
| Wholesale Trade | 452 (77.1%) | 134 (22.9%) |
| Retail Trade | 419 (57.0%) | 316 (43.0%) |
| Transportation & Warehousing | 909 (88.9%) | 113 (11.1%) |
| Utilities | 43 (100.0%) | 0 (0.0%) |
| Information | 96 (61.5%) | 60 (38.5%) |
| Finance & Insurance | 10 (13.3%) | 65 (86.7%) |
| Real Estate, Rental & Leasing | 73 (51.8%) | 68 (48.2%) |
| Professional & Scientific | 169 (50.3%) | 167 (49.7%) |
| Enterprise Management | 0 (0.0%) | 0 (0.0%) |
| Administrative & Support | 567 (80.4%) | 138 (19.6%) |
| Educational Services | 154 (22.1%) | 542 (77.9%) |
| Health Care & Social Assistance | 99 (8.8%) | 1,020 (91.1%) |
| Arts, Entertainment & Recreation | 130 (49.2%) | 134 (50.8%) |
| Accommodation & Food Services | 331 (41.2%) | 472 (58.8%) |
| Public Administration | 32 (15.5%) | 174 (84.5%) |
| Total | 5,103 (57.1%) | 3,832 (42.9%) |
Education in Willowbrook
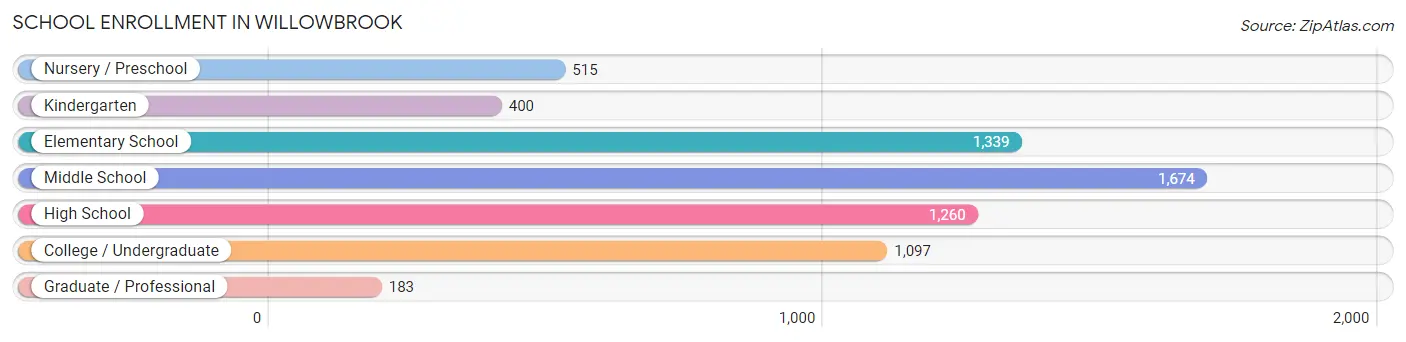
School Enrollment in Willowbrook
The most common levels of schooling among the 6,468 students in Willowbrook are middle school (1,674 | 25.9%), elementary school (1,339 | 20.7%), and high school (1,260 | 19.5%).
| School Level | # Students | % Students |
| Nursery / Preschool | 515 | 8.0% |
| Kindergarten | 400 | 6.2% |
| Elementary School | 1,339 | 20.7% |
| Middle School | 1,674 | 25.9% |
| High School | 1,260 | 19.5% |
| College / Undergraduate | 1,097 | 17.0% |
| Graduate / Professional | 183 | 2.8% |
| Total | 6,468 | 100.0% |
School Enrollment by Age by Funding Source in Willowbrook
Out of a total of 6,468 students who are enrolled in schools in Willowbrook, 285 (4.4%) attend a private institution, while the remaining 6,183 (95.6%) are enrolled in public schools. The age group of 25 to 34 year olds has the highest likelihood of being enrolled in private schools, with 90 (25.0% in the age bracket) enrolled. Conversely, the age group of 10 to 14 year olds has the lowest likelihood of being enrolled in a private school, with 1,839 (100.0% in the age bracket) attending a public institution.
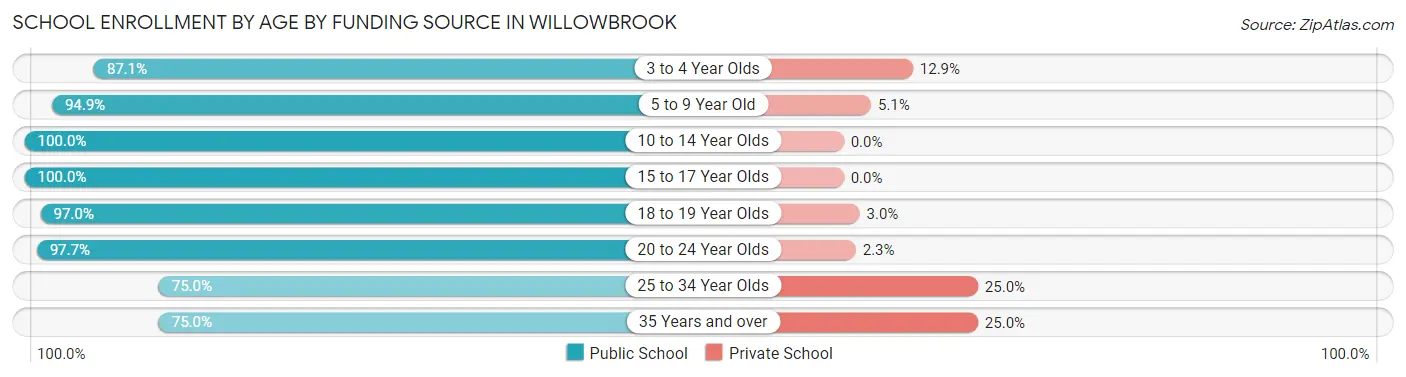
| Age Bracket | Public School | Private School |
| 3 to 4 Year Olds | 392 (87.1%) | 58 (12.9%) |
| 5 to 9 Year Old | 1,695 (94.9%) | 91 (5.1%) |
| 10 to 14 Year Olds | 1,839 (100.0%) | 0 (0.0%) |
| 15 to 17 Year Olds | 984 (100.0%) | 0 (0.0%) |
| 18 to 19 Year Olds | 327 (97.0%) | 10 (3.0%) |
| 20 to 24 Year Olds | 606 (97.7%) | 14 (2.3%) |
| 25 to 34 Year Olds | 270 (75.0%) | 90 (25.0%) |
| 35 Years and over | 69 (75.0%) | 23 (25.0%) |
| Total | 6,183 (95.6%) | 285 (4.4%) |
Educational Attainment by Field of Study in Willowbrook
Business (283 | 17.4%), arts & humanities (249 | 15.3%), science & technology (168 | 10.3%), psychology (161 | 9.9%), and social sciences (148 | 9.1%) are the most common fields of study among 1,629 individuals in Willowbrook who have obtained a bachelor's degree or higher.
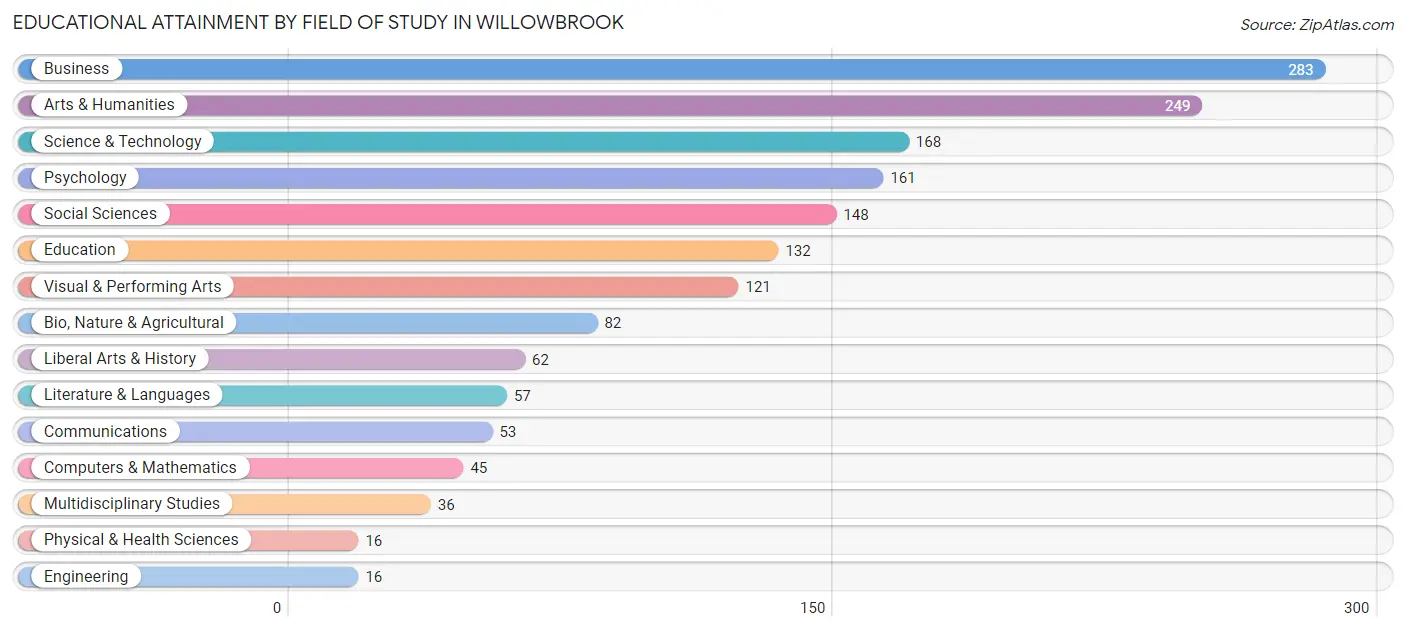
| Field of Study | # Graduates | % Graduates |
| Computers & Mathematics | 45 | 2.8% |
| Bio, Nature & Agricultural | 82 | 5.0% |
| Physical & Health Sciences | 16 | 1.0% |
| Psychology | 161 | 9.9% |
| Social Sciences | 148 | 9.1% |
| Engineering | 16 | 1.0% |
| Multidisciplinary Studies | 36 | 2.2% |
| Science & Technology | 168 | 10.3% |
| Business | 283 | 17.4% |
| Education | 132 | 8.1% |
| Literature & Languages | 57 | 3.5% |
| Liberal Arts & History | 62 | 3.8% |
| Visual & Performing Arts | 121 | 7.4% |
| Communications | 53 | 3.3% |
| Arts & Humanities | 249 | 15.3% |
| Total | 1,629 | 100.0% |
Transportation & Commute in Willowbrook
Vehicle Availability by Sex in Willowbrook
The most prevalent vehicle ownership categories in Willowbrook are males with 2 vehicles (1,847, accounting for 37.3%) and females with 2 vehicles (1,139, making up 48.7%).
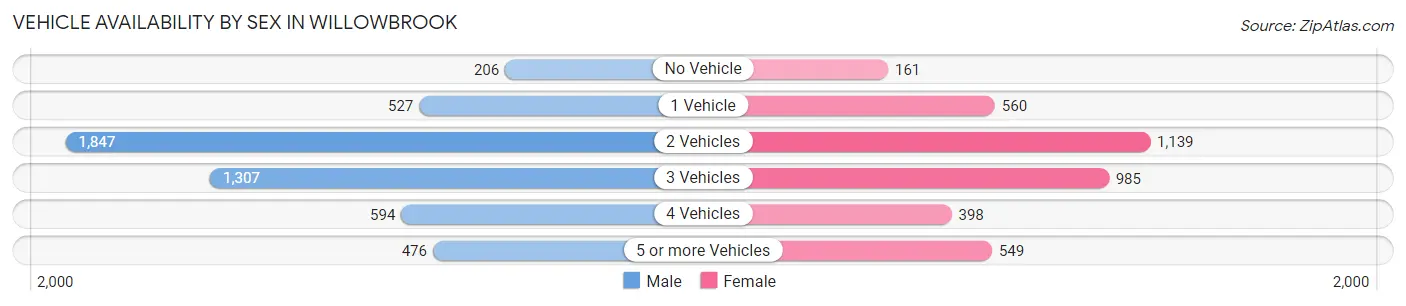
| Vehicles Available | Male | Female |
| No Vehicle | 206 (4.2%) | 161 (4.3%) |
| 1 Vehicle | 527 (10.6%) | 560 (14.8%) |
| 2 Vehicles | 1,847 (37.3%) | 1,139 (30.0%) |
| 3 Vehicles | 1,307 (26.4%) | 985 (26.0%) |
| 4 Vehicles | 594 (12.0%) | 398 (10.5%) |
| 5 or more Vehicles | 476 (9.6%) | 549 (14.5%) |
| Total | 4,957 (100.0%) | 3,792 (100.0%) |
Commute Time in Willowbrook
The most frequently occuring commute durations in Willowbrook are 30 to 34 minutes (2,063 commuters, 25.1%), 20 to 24 minutes (1,072 commuters, 13.0%), and 45 to 59 minutes (911 commuters, 11.1%).
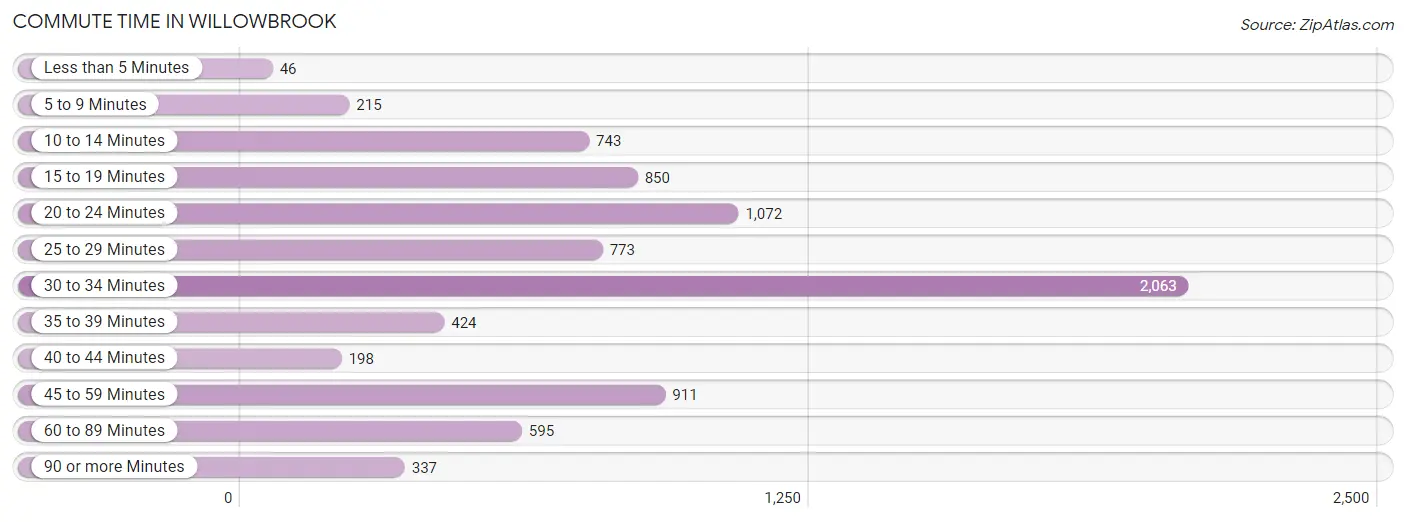
| Commute Time | # Commuters | % Commuters |
| Less than 5 Minutes | 46 | 0.6% |
| 5 to 9 Minutes | 215 | 2.6% |
| 10 to 14 Minutes | 743 | 9.0% |
| 15 to 19 Minutes | 850 | 10.3% |
| 20 to 24 Minutes | 1,072 | 13.0% |
| 25 to 29 Minutes | 773 | 9.4% |
| 30 to 34 Minutes | 2,063 | 25.1% |
| 35 to 39 Minutes | 424 | 5.1% |
| 40 to 44 Minutes | 198 | 2.4% |
| 45 to 59 Minutes | 911 | 11.1% |
| 60 to 89 Minutes | 595 | 7.2% |
| 90 or more Minutes | 337 | 4.1% |
Commute Time by Sex in Willowbrook
The most common commute times in Willowbrook are 30 to 34 minutes (1,300 commuters, 27.4%) for males and 30 to 34 minutes (763 commuters, 21.9%) for females.
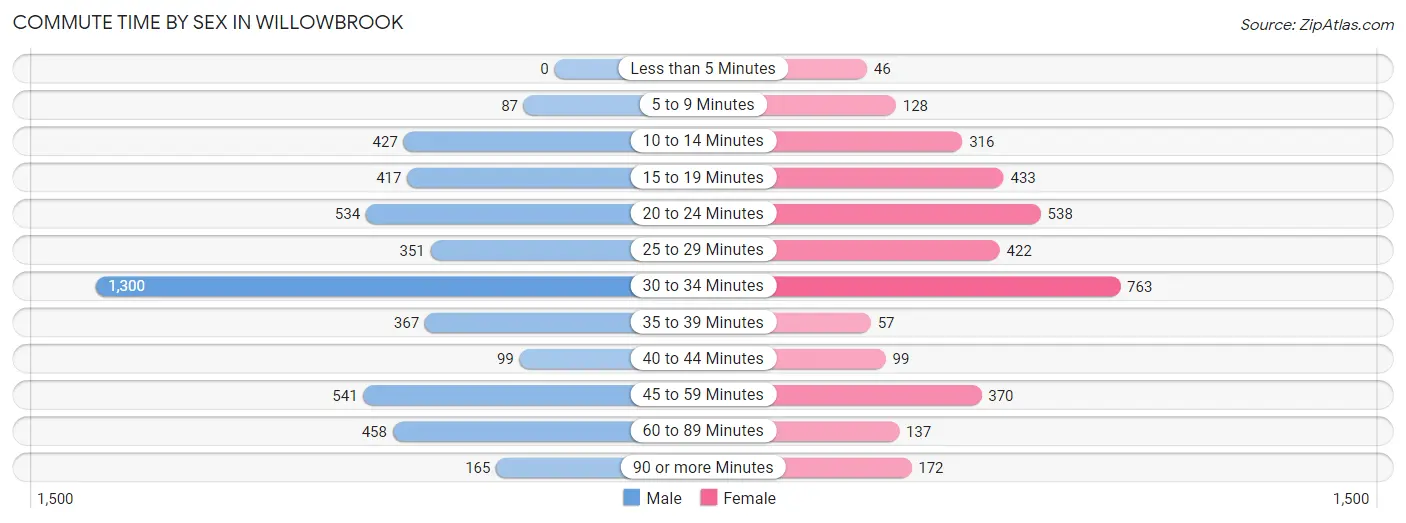
| Commute Time | Male | Female |
| Less than 5 Minutes | 0 (0.0%) | 46 (1.3%) |
| 5 to 9 Minutes | 87 (1.8%) | 128 (3.7%) |
| 10 to 14 Minutes | 427 (9.0%) | 316 (9.1%) |
| 15 to 19 Minutes | 417 (8.8%) | 433 (12.4%) |
| 20 to 24 Minutes | 534 (11.3%) | 538 (15.5%) |
| 25 to 29 Minutes | 351 (7.4%) | 422 (12.1%) |
| 30 to 34 Minutes | 1,300 (27.4%) | 763 (21.9%) |
| 35 to 39 Minutes | 367 (7.7%) | 57 (1.6%) |
| 40 to 44 Minutes | 99 (2.1%) | 99 (2.8%) |
| 45 to 59 Minutes | 541 (11.4%) | 370 (10.6%) |
| 60 to 89 Minutes | 458 (9.7%) | 137 (3.9%) |
| 90 or more Minutes | 165 (3.5%) | 172 (4.9%) |
Time of Departure to Work by Sex in Willowbrook
The most frequent times of departure to work in Willowbrook are 6:00 AM to 6:29 AM (753, 15.9%) for males and 7:00 AM to 7:29 AM (646, 18.6%) for females.
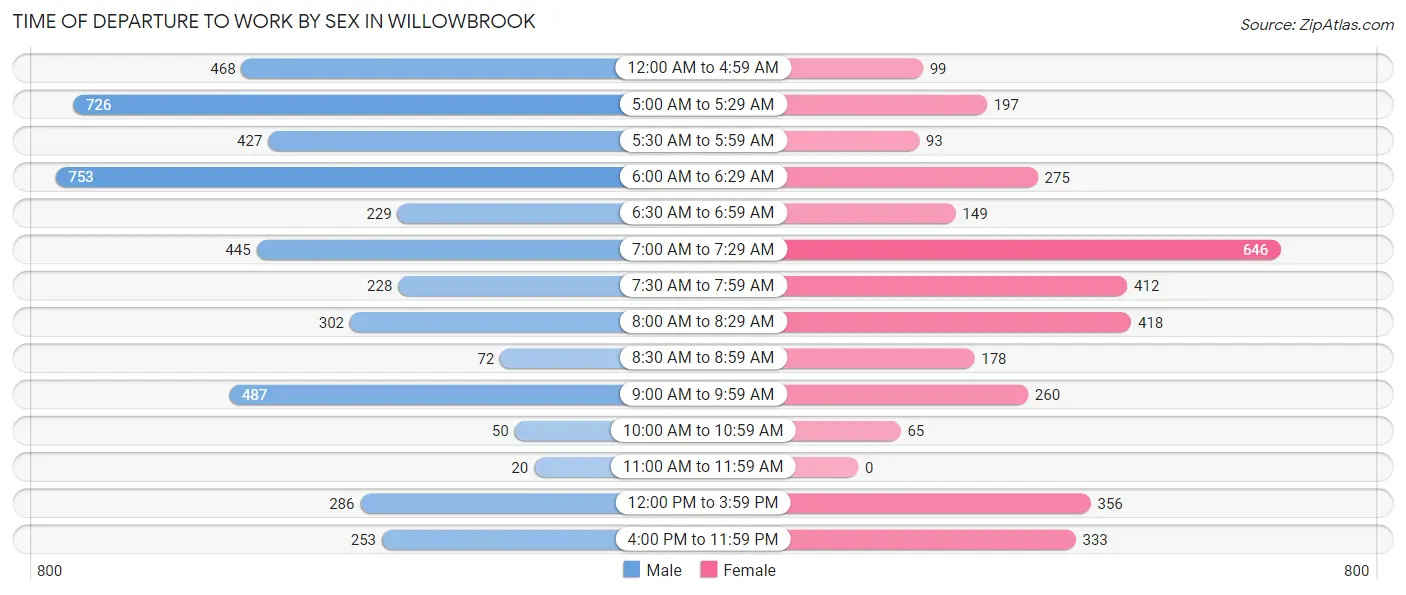
| Time of Departure | Male | Female |
| 12:00 AM to 4:59 AM | 468 (9.9%) | 99 (2.8%) |
| 5:00 AM to 5:29 AM | 726 (15.3%) | 197 (5.7%) |
| 5:30 AM to 5:59 AM | 427 (9.0%) | 93 (2.7%) |
| 6:00 AM to 6:29 AM | 753 (15.9%) | 275 (7.9%) |
| 6:30 AM to 6:59 AM | 229 (4.8%) | 149 (4.3%) |
| 7:00 AM to 7:29 AM | 445 (9.4%) | 646 (18.6%) |
| 7:30 AM to 7:59 AM | 228 (4.8%) | 412 (11.8%) |
| 8:00 AM to 8:29 AM | 302 (6.4%) | 418 (12.0%) |
| 8:30 AM to 8:59 AM | 72 (1.5%) | 178 (5.1%) |
| 9:00 AM to 9:59 AM | 487 (10.3%) | 260 (7.5%) |
| 10:00 AM to 10:59 AM | 50 (1.1%) | 65 (1.9%) |
| 11:00 AM to 11:59 AM | 20 (0.4%) | 0 (0.0%) |
| 12:00 PM to 3:59 PM | 286 (6.0%) | 356 (10.2%) |
| 4:00 PM to 11:59 PM | 253 (5.3%) | 333 (9.6%) |
| Total | 4,746 (100.0%) | 3,481 (100.0%) |
Housing Occupancy in Willowbrook
Occupancy by Ownership in Willowbrook
Of the total 5,918 dwellings in Willowbrook, owner-occupied units account for 2,409 (40.7%), while renter-occupied units make up 3,509 (59.3%).
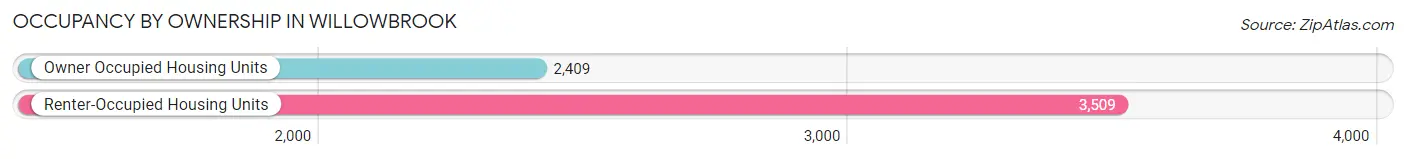
| Occupancy | # Housing Units | % Housing Units |
| Owner Occupied Housing Units | 2,409 | 40.7% |
| Renter-Occupied Housing Units | 3,509 | 59.3% |
| Total Occupied Housing Units | 5,918 | 100.0% |
Occupancy by Household Size in Willowbrook
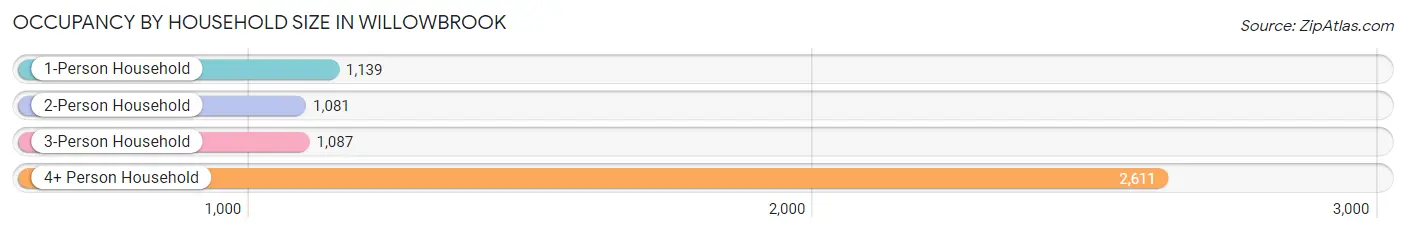
| Household Size | # Housing Units | % Housing Units |
| 1-Person Household | 1,139 | 19.3% |
| 2-Person Household | 1,081 | 18.3% |
| 3-Person Household | 1,087 | 18.4% |
| 4+ Person Household | 2,611 | 44.1% |
| Total Housing Units | 5,918 | 100.0% |
Occupancy by Ownership by Household Size in Willowbrook
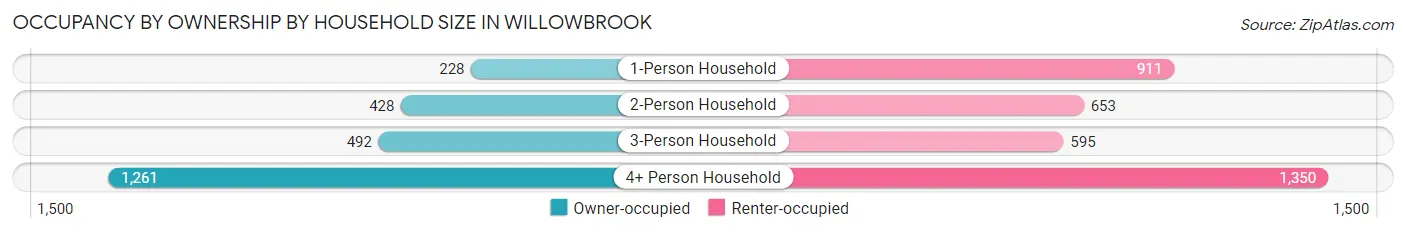
| Household Size | Owner-occupied | Renter-occupied |
| 1-Person Household | 228 (20.0%) | 911 (80.0%) |
| 2-Person Household | 428 (39.6%) | 653 (60.4%) |
| 3-Person Household | 492 (45.3%) | 595 (54.7%) |
| 4+ Person Household | 1,261 (48.3%) | 1,350 (51.7%) |
| Total Housing Units | 2,409 (40.7%) | 3,509 (59.3%) |
Occupancy by Educational Attainment in Willowbrook
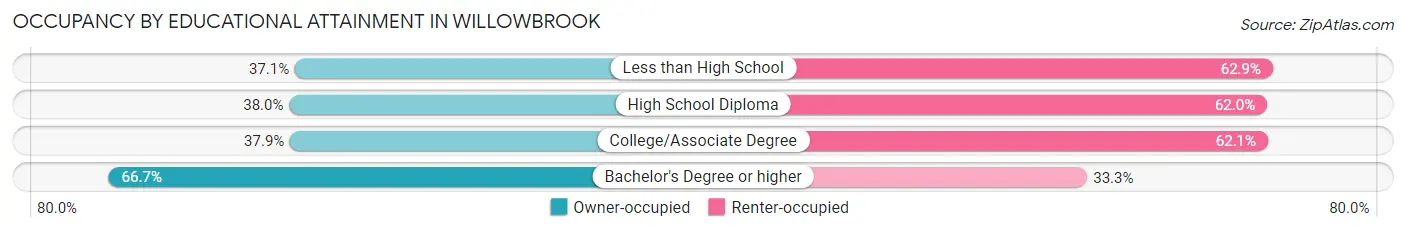
| Household Size | Owner-occupied | Renter-occupied |
| Less than High School | 805 (37.1%) | 1,365 (62.9%) |
| High School Diploma | 535 (38.0%) | 872 (62.0%) |
| College/Associate Degree | 647 (37.9%) | 1,061 (62.1%) |
| Bachelor's Degree or higher | 422 (66.7%) | 211 (33.3%) |
Occupancy by Age of Householder in Willowbrook
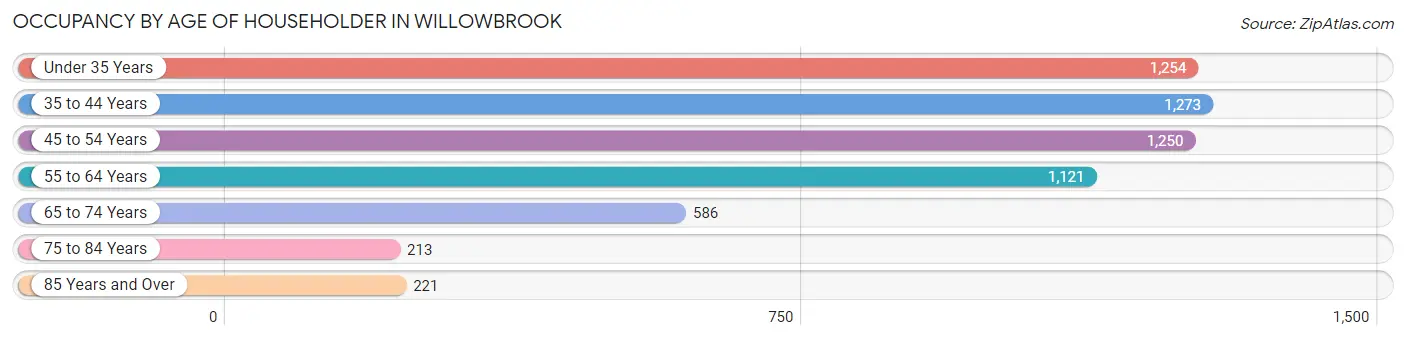
| Age Bracket | # Households | % Households |
| Under 35 Years | 1,254 | 21.2% |
| 35 to 44 Years | 1,273 | 21.5% |
| 45 to 54 Years | 1,250 | 21.1% |
| 55 to 64 Years | 1,121 | 18.9% |
| 65 to 74 Years | 586 | 9.9% |
| 75 to 84 Years | 213 | 3.6% |
| 85 Years and Over | 221 | 3.7% |
| Total | 5,918 | 100.0% |
Housing Finances in Willowbrook
Median Income by Occupancy in Willowbrook
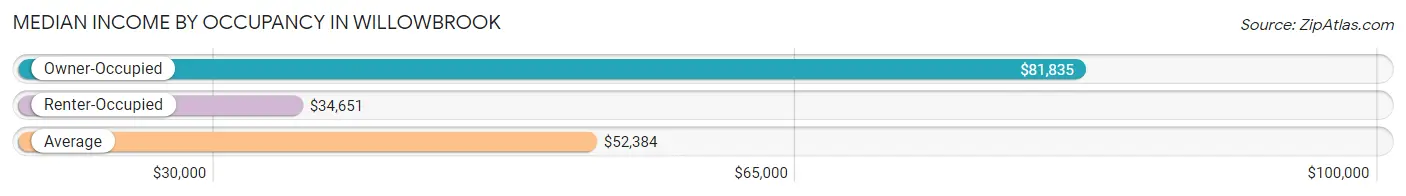
| Occupancy Type | # Households | Median Income |
| Owner-Occupied | 2,409 (40.7%) | $81,835 |
| Renter-Occupied | 3,509 (59.3%) | $34,651 |
| Average | 5,918 (100.0%) | $52,384 |
Occupancy by Householder Income Bracket in Willowbrook
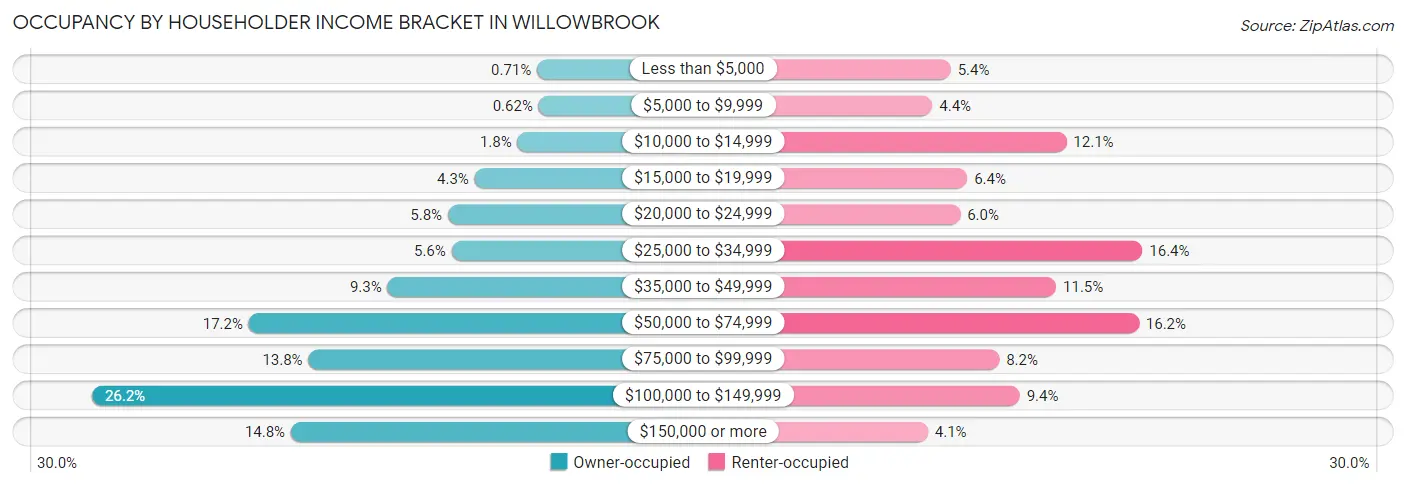
| Income Bracket | Owner-occupied | Renter-occupied |
| Less than $5,000 | 17 (0.7%) | 191 (5.4%) |
| $5,000 to $9,999 | 15 (0.6%) | 154 (4.4%) |
| $10,000 to $14,999 | 44 (1.8%) | 423 (12.0%) |
| $15,000 to $19,999 | 103 (4.3%) | 224 (6.4%) |
| $20,000 to $24,999 | 140 (5.8%) | 210 (6.0%) |
| $25,000 to $34,999 | 135 (5.6%) | 575 (16.4%) |
| $35,000 to $49,999 | 223 (9.3%) | 402 (11.5%) |
| $50,000 to $74,999 | 414 (17.2%) | 568 (16.2%) |
| $75,000 to $99,999 | 332 (13.8%) | 288 (8.2%) |
| $100,000 to $149,999 | 630 (26.2%) | 329 (9.4%) |
| $150,000 or more | 356 (14.8%) | 145 (4.1%) |
| Total | 2,409 (100.0%) | 3,509 (100.0%) |
Monthly Housing Cost Tiers in Willowbrook
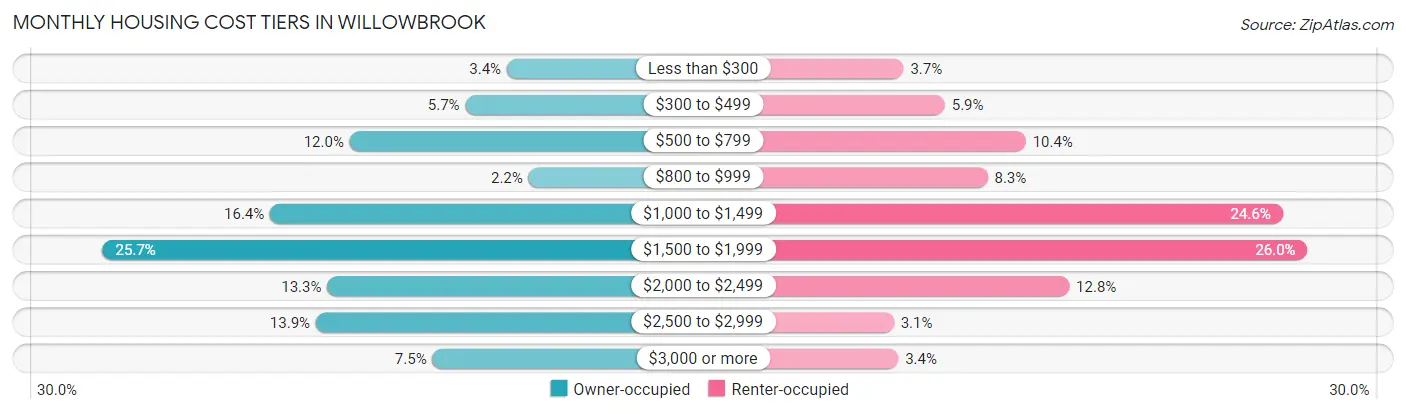
| Monthly Cost | Owner-occupied | Renter-occupied |
| Less than $300 | 81 (3.4%) | 128 (3.6%) |
| $300 to $499 | 136 (5.7%) | 208 (5.9%) |
| $500 to $799 | 290 (12.0%) | 365 (10.4%) |
| $800 to $999 | 52 (2.2%) | 291 (8.3%) |
| $1,000 to $1,499 | 396 (16.4%) | 863 (24.6%) |
| $1,500 to $1,999 | 619 (25.7%) | 911 (26.0%) |
| $2,000 to $2,499 | 320 (13.3%) | 449 (12.8%) |
| $2,500 to $2,999 | 335 (13.9%) | 109 (3.1%) |
| $3,000 or more | 180 (7.5%) | 118 (3.4%) |
| Total | 2,409 (100.0%) | 3,509 (100.0%) |
Physical Housing Characteristics in Willowbrook
Housing Structures in Willowbrook
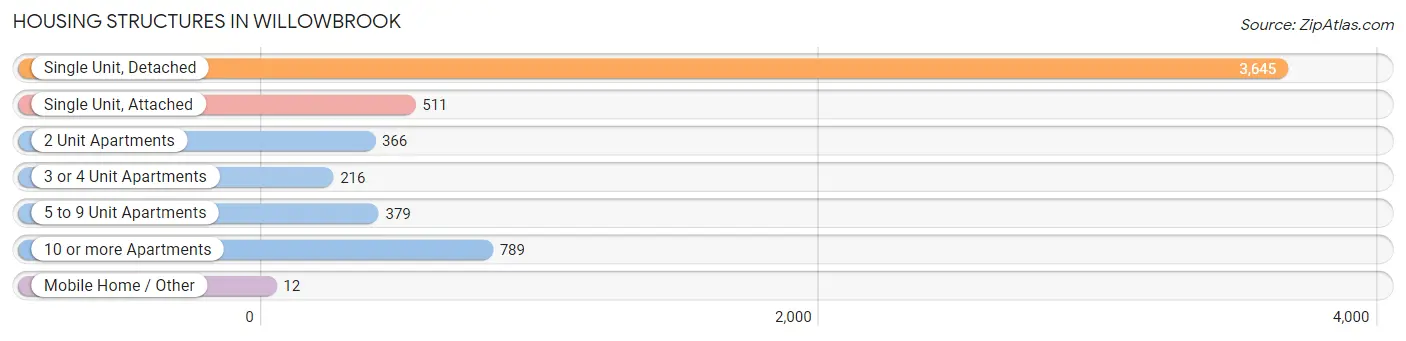
| Structure Type | # Housing Units | % Housing Units |
| Single Unit, Detached | 3,645 | 61.6% |
| Single Unit, Attached | 511 | 8.6% |
| 2 Unit Apartments | 366 | 6.2% |
| 3 or 4 Unit Apartments | 216 | 3.6% |
| 5 to 9 Unit Apartments | 379 | 6.4% |
| 10 or more Apartments | 789 | 13.3% |
| Mobile Home / Other | 12 | 0.2% |
| Total | 5,918 | 100.0% |
Housing Structures by Occupancy in Willowbrook
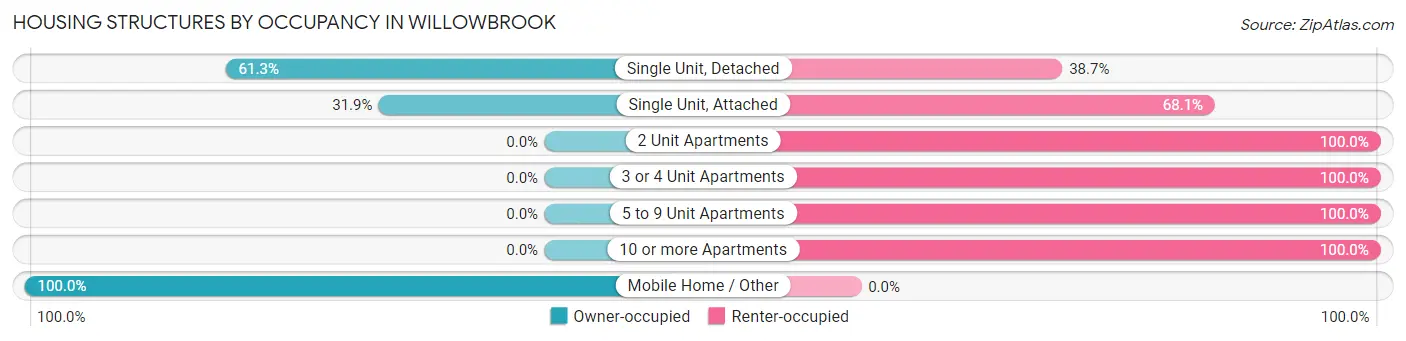
| Structure Type | Owner-occupied | Renter-occupied |
| Single Unit, Detached | 2,234 (61.3%) | 1,411 (38.7%) |
| Single Unit, Attached | 163 (31.9%) | 348 (68.1%) |
| 2 Unit Apartments | 0 (0.0%) | 366 (100.0%) |
| 3 or 4 Unit Apartments | 0 (0.0%) | 216 (100.0%) |
| 5 to 9 Unit Apartments | 0 (0.0%) | 379 (100.0%) |
| 10 or more Apartments | 0 (0.0%) | 789 (100.0%) |
| Mobile Home / Other | 12 (100.0%) | 0 (0.0%) |
| Total | 2,409 (40.7%) | 3,509 (59.3%) |
Housing Structures by Number of Rooms in Willowbrook
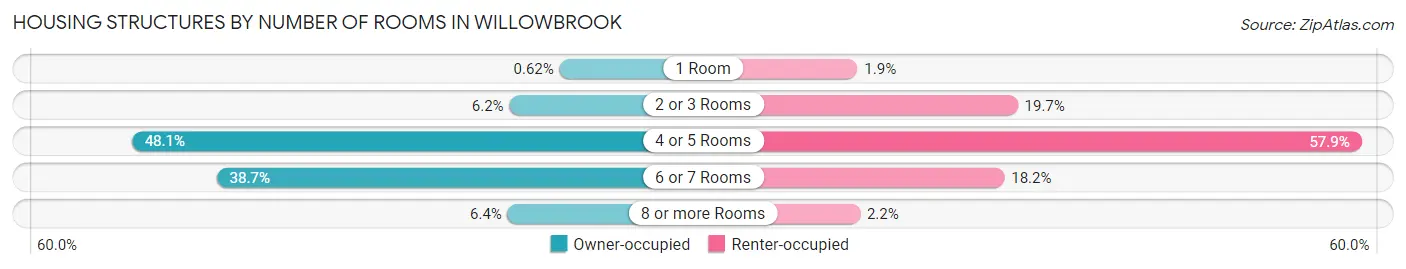
| Number of Rooms | Owner-occupied | Renter-occupied |
| 1 Room | 15 (0.6%) | 68 (1.9%) |
| 2 or 3 Rooms | 149 (6.2%) | 692 (19.7%) |
| 4 or 5 Rooms | 1,159 (48.1%) | 2,031 (57.9%) |
| 6 or 7 Rooms | 932 (38.7%) | 640 (18.2%) |
| 8 or more Rooms | 154 (6.4%) | 78 (2.2%) |
| Total | 2,409 (100.0%) | 3,509 (100.0%) |
Housing Structure by Heating Type in Willowbrook
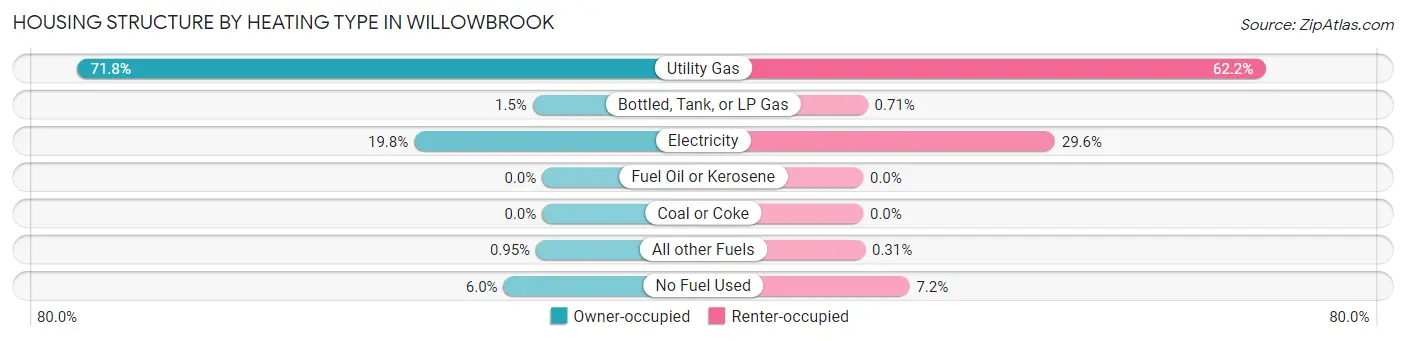
| Heating Type | Owner-occupied | Renter-occupied |
| Utility Gas | 1,730 (71.8%) | 2,181 (62.2%) |
| Bottled, Tank, or LP Gas | 35 (1.5%) | 25 (0.7%) |
| Electricity | 477 (19.8%) | 1,040 (29.6%) |
| Fuel Oil or Kerosene | 0 (0.0%) | 0 (0.0%) |
| Coal or Coke | 0 (0.0%) | 0 (0.0%) |
| All other Fuels | 23 (0.9%) | 11 (0.3%) |
| No Fuel Used | 144 (6.0%) | 252 (7.2%) |
| Total | 2,409 (100.0%) | 3,509 (100.0%) |
Household Vehicle Usage in Willowbrook
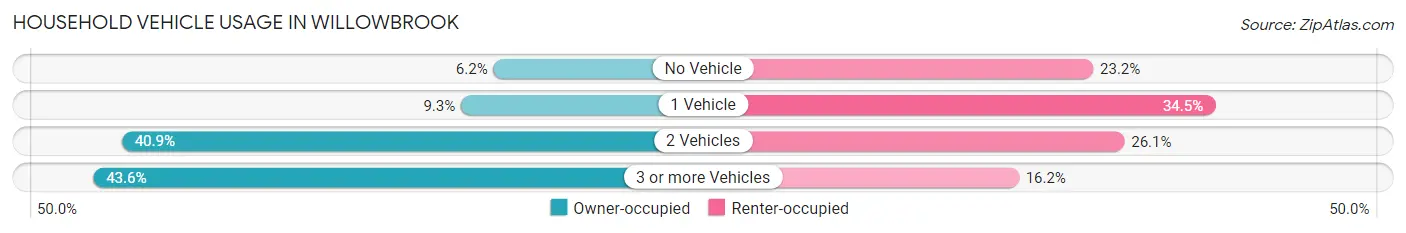
| Vehicles per Household | Owner-occupied | Renter-occupied |
| No Vehicle | 150 (6.2%) | 813 (23.2%) |
| 1 Vehicle | 223 (9.3%) | 1,212 (34.5%) |
| 2 Vehicles | 986 (40.9%) | 915 (26.1%) |
| 3 or more Vehicles | 1,050 (43.6%) | 569 (16.2%) |
| Total | 2,409 (100.0%) | 3,509 (100.0%) |
Real Estate & Mortgages in Willowbrook
Real Estate and Mortgage Overview in Willowbrook
| Characteristic | Without Mortgage | With Mortgage |
| Housing Units | 659 | 1,750 |
| Median Property Value | $490,900 | $464,600 |
| Median Household Income | $81,303 | $269 |
| Monthly Housing Costs | $589 | $180 |
| Real Estate Taxes | $3,985 | $35 |
Property Value by Mortgage Status in Willowbrook
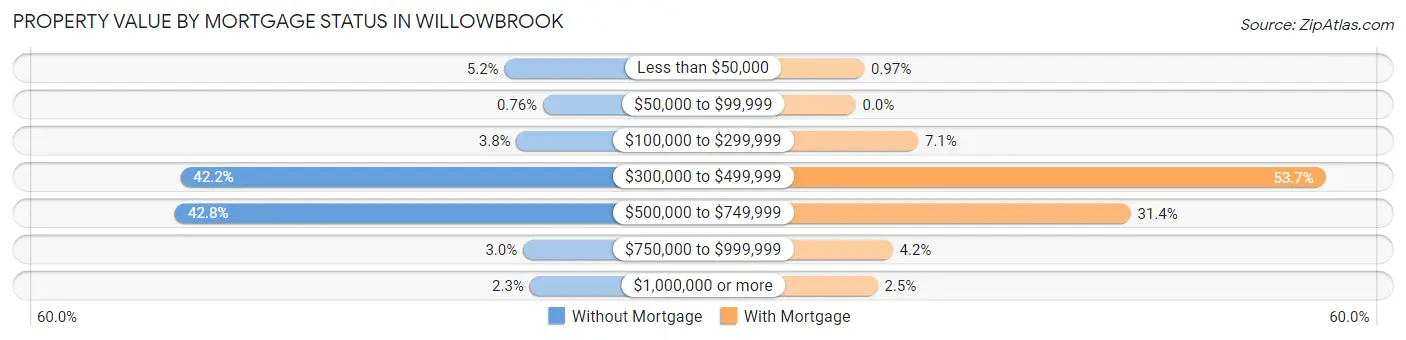
| Property Value | Without Mortgage | With Mortgage |
| Less than $50,000 | 34 (5.2%) | 17 (1.0%) |
| $50,000 to $99,999 | 5 (0.8%) | 0 (0.0%) |
| $100,000 to $299,999 | 25 (3.8%) | 125 (7.1%) |
| $300,000 to $499,999 | 278 (42.2%) | 940 (53.7%) |
| $500,000 to $749,999 | 282 (42.8%) | 550 (31.4%) |
| $750,000 to $999,999 | 20 (3.0%) | 74 (4.2%) |
| $1,000,000 or more | 15 (2.3%) | 44 (2.5%) |
| Total | 659 (100.0%) | 1,750 (100.0%) |
Household Income by Mortgage Status in Willowbrook
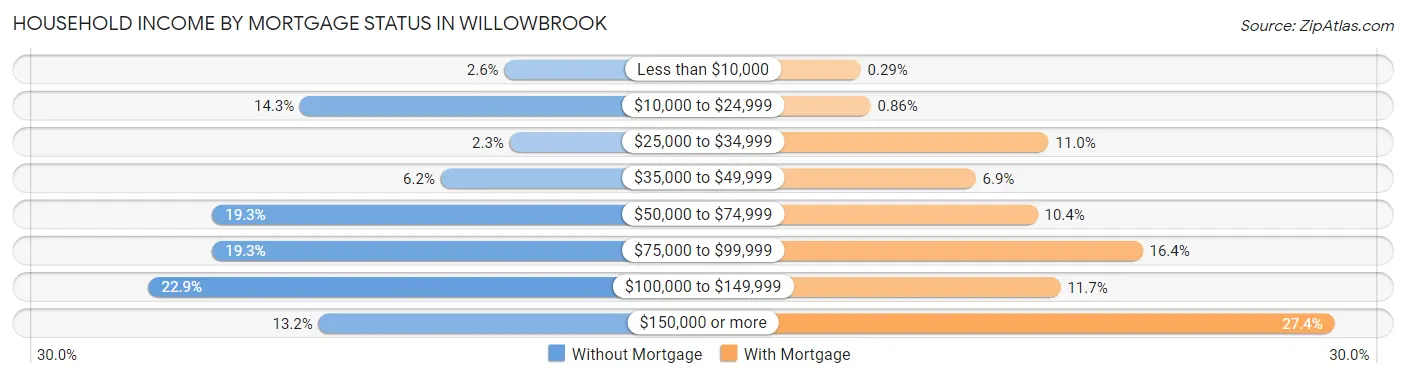
| Household Income | Without Mortgage | With Mortgage |
| Less than $10,000 | 17 (2.6%) | 5 (0.3%) |
| $10,000 to $24,999 | 94 (14.3%) | 15 (0.9%) |
| $25,000 to $34,999 | 15 (2.3%) | 193 (11.0%) |
| $35,000 to $49,999 | 41 (6.2%) | 120 (6.9%) |
| $50,000 to $74,999 | 127 (19.3%) | 182 (10.4%) |
| $75,000 to $99,999 | 127 (19.3%) | 287 (16.4%) |
| $100,000 to $149,999 | 151 (22.9%) | 205 (11.7%) |
| $150,000 or more | 87 (13.2%) | 479 (27.4%) |
| Total | 659 (100.0%) | 1,750 (100.0%) |
Property Value to Household Income Ratio in Willowbrook
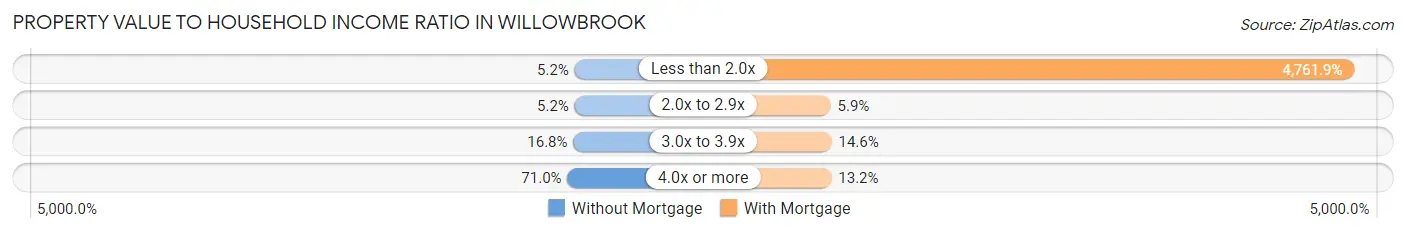
| Value-to-Income Ratio | Without Mortgage | With Mortgage |
| Less than 2.0x | 34 (5.2%) | 83,333 (4,761.9%) |
| 2.0x to 2.9x | 34 (5.2%) | 103 (5.9%) |
| 3.0x to 3.9x | 111 (16.8%) | 256 (14.6%) |
| 4.0x or more | 468 (71.0%) | 231 (13.2%) |
| Total | 659 (100.0%) | 1,750 (100.0%) |
Real Estate Taxes by Mortgage Status in Willowbrook
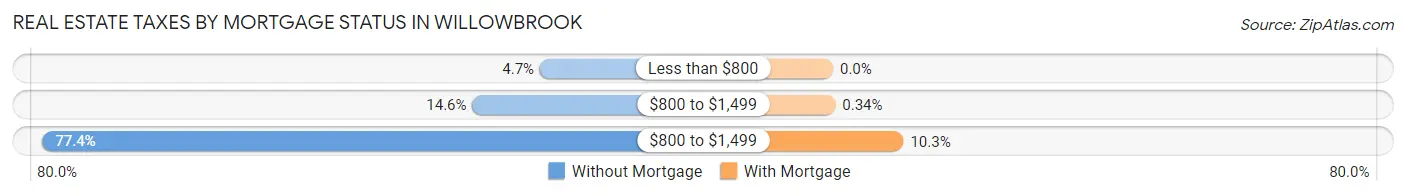
| Property Taxes | Without Mortgage | With Mortgage |
| Less than $800 | 31 (4.7%) | 0 (0.0%) |
| $800 to $1,499 | 96 (14.6%) | 6 (0.3%) |
| $800 to $1,499 | 510 (77.4%) | 180 (10.3%) |
| Total | 659 (100.0%) | 1,750 (100.0%) |
Health & Disability in Willowbrook
Health Insurance Coverage by Age in Willowbrook
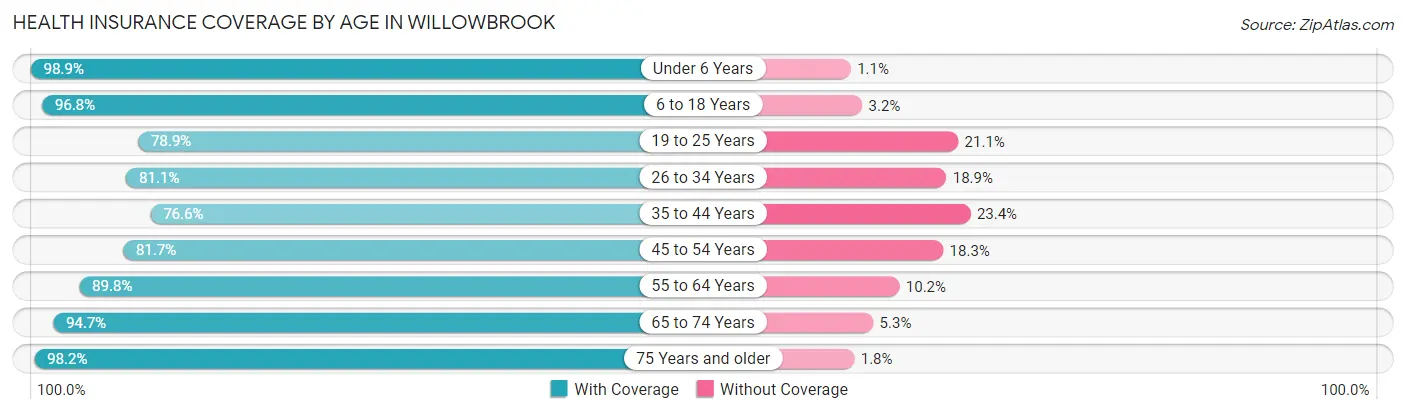
| Age Bracket | With Coverage | Without Coverage |
| Under 6 Years | 2,134 (98.9%) | 24 (1.1%) |
| 6 to 18 Years | 4,351 (96.8%) | 145 (3.2%) |
| 19 to 25 Years | 2,294 (78.9%) | 615 (21.1%) |
| 26 to 34 Years | 2,690 (81.1%) | 628 (18.9%) |
| 35 to 44 Years | 2,203 (76.6%) | 674 (23.4%) |
| 45 to 54 Years | 1,910 (81.7%) | 429 (18.3%) |
| 55 to 64 Years | 2,128 (89.8%) | 241 (10.2%) |
| 65 to 74 Years | 966 (94.7%) | 54 (5.3%) |
| 75 Years and older | 943 (98.2%) | 17 (1.8%) |
| Total | 19,619 (87.4%) | 2,827 (12.6%) |
Health Insurance Coverage by Citizenship Status in Willowbrook
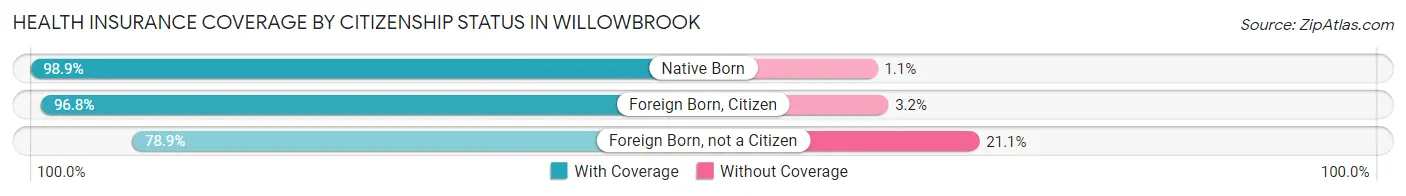
| Citizenship Status | With Coverage | Without Coverage |
| Native Born | 2,134 (98.9%) | 24 (1.1%) |
| Foreign Born, Citizen | 4,351 (96.8%) | 145 (3.2%) |
| Foreign Born, not a Citizen | 2,294 (78.9%) | 615 (21.1%) |
Health Insurance Coverage by Household Income in Willowbrook
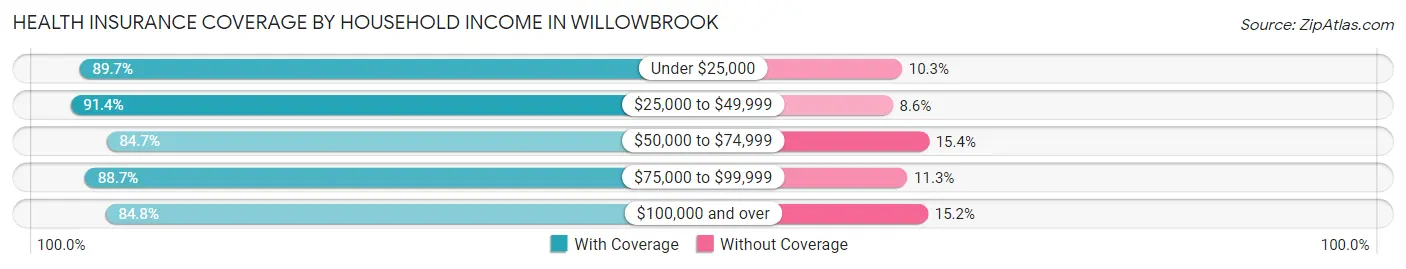
| Household Income | With Coverage | Without Coverage |
| Under $25,000 | 2,713 (89.7%) | 312 (10.3%) |
| $25,000 to $49,999 | 4,491 (91.4%) | 421 (8.6%) |
| $50,000 to $74,999 | 3,170 (84.7%) | 575 (15.3%) |
| $75,000 to $99,999 | 2,517 (88.7%) | 321 (11.3%) |
| $100,000 and over | 6,536 (84.8%) | 1,169 (15.2%) |
Public vs Private Health Insurance Coverage by Age in Willowbrook
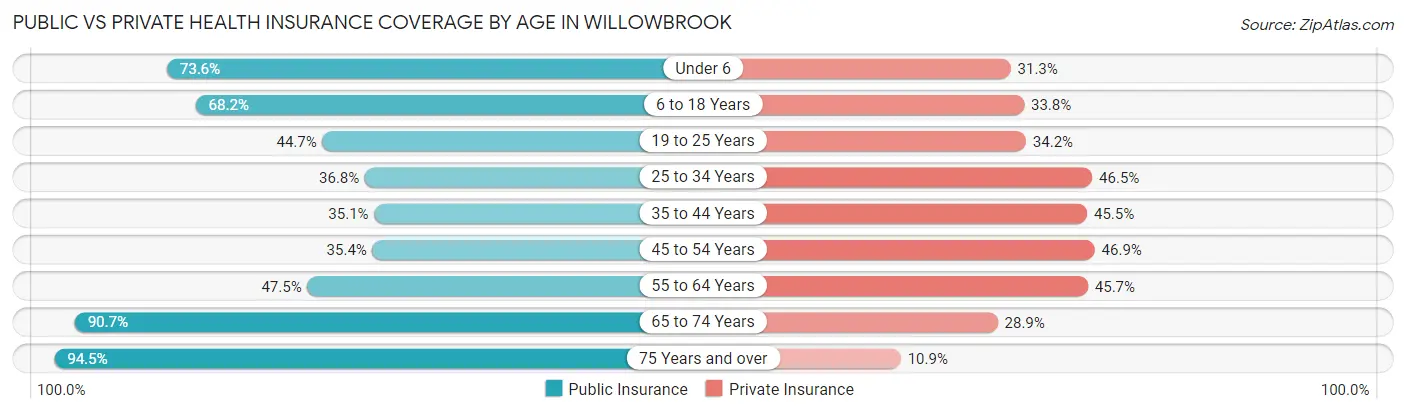
| Age Bracket | Public Insurance | Private Insurance |
| Under 6 | 1,588 (73.6%) | 676 (31.3%) |
| 6 to 18 Years | 3,068 (68.2%) | 1,521 (33.8%) |
| 19 to 25 Years | 1,300 (44.7%) | 994 (34.2%) |
| 25 to 34 Years | 1,221 (36.8%) | 1,542 (46.5%) |
| 35 to 44 Years | 1,009 (35.1%) | 1,310 (45.5%) |
| 45 to 54 Years | 828 (35.4%) | 1,098 (46.9%) |
| 55 to 64 Years | 1,125 (47.5%) | 1,082 (45.7%) |
| 65 to 74 Years | 925 (90.7%) | 295 (28.9%) |
| 75 Years and over | 907 (94.5%) | 105 (10.9%) |
| Total | 11,971 (53.3%) | 8,623 (38.4%) |
Disability Status by Sex by Age in Willowbrook
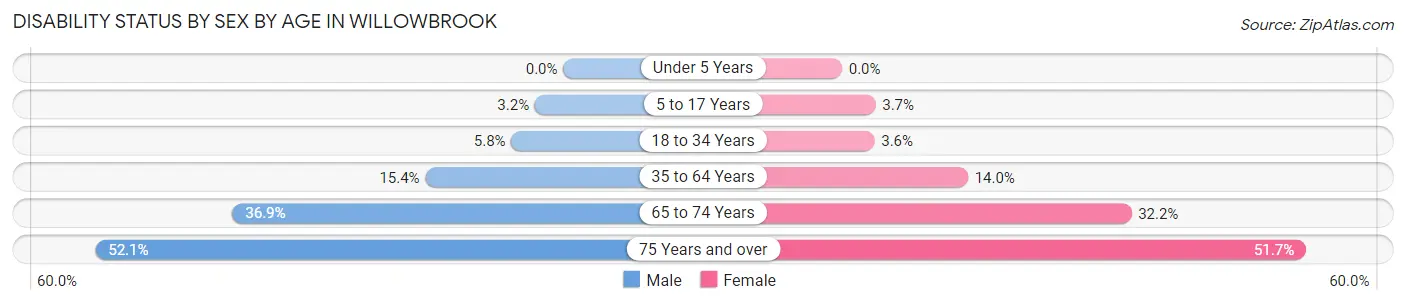
| Age Bracket | Male | Female |
| Under 5 Years | 0 (0.0%) | 0 (0.0%) |
| 5 to 17 Years | 60 (3.2%) | 104 (3.7%) |
| 18 to 34 Years | 197 (5.8%) | 109 (3.6%) |
| 35 to 64 Years | 555 (15.4%) | 557 (14.0%) |
| 65 to 74 Years | 209 (36.9%) | 146 (32.2%) |
| 75 Years and over | 209 (52.1%) | 289 (51.7%) |
Disability Class by Sex by Age in Willowbrook
Disability Class: Hearing Difficulty
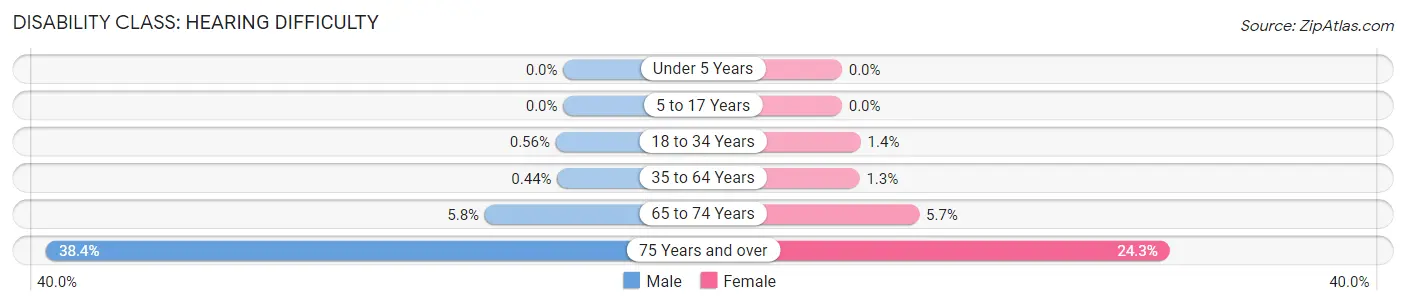
| Age Bracket | Male | Female |
| Under 5 Years | 0 (0.0%) | 0 (0.0%) |
| 5 to 17 Years | 0 (0.0%) | 0 (0.0%) |
| 18 to 34 Years | 19 (0.6%) | 42 (1.4%) |
| 35 to 64 Years | 16 (0.4%) | 52 (1.3%) |
| 65 to 74 Years | 33 (5.8%) | 26 (5.7%) |
| 75 Years and over | 154 (38.4%) | 136 (24.3%) |
Disability Class: Vision Difficulty
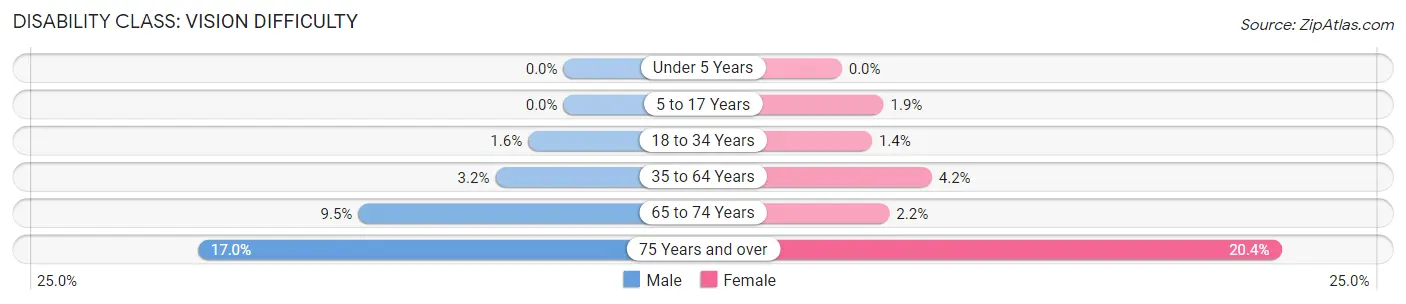
| Age Bracket | Male | Female |
| Under 5 Years | 0 (0.0%) | 0 (0.0%) |
| 5 to 17 Years | 0 (0.0%) | 54 (1.9%) |
| 18 to 34 Years | 56 (1.6%) | 42 (1.4%) |
| 35 to 64 Years | 114 (3.2%) | 166 (4.2%) |
| 65 to 74 Years | 54 (9.5%) | 10 (2.2%) |
| 75 Years and over | 68 (17.0%) | 114 (20.4%) |
Disability Class: Cognitive Difficulty
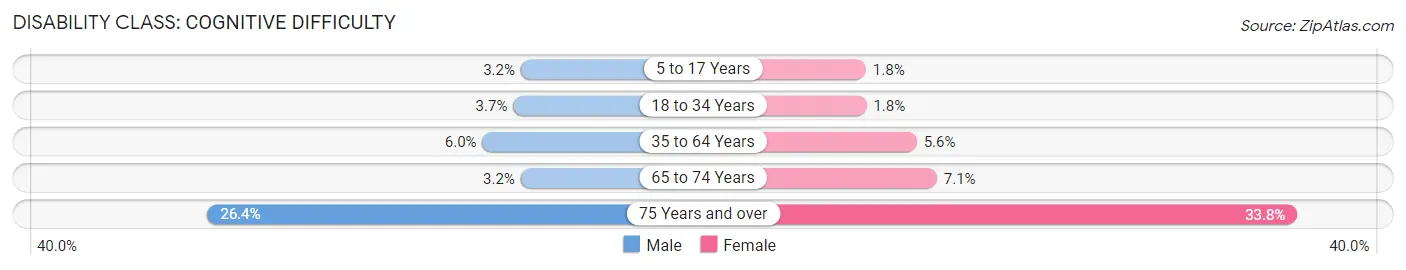
| Age Bracket | Male | Female |
| 5 to 17 Years | 60 (3.2%) | 50 (1.8%) |
| 18 to 34 Years | 127 (3.7%) | 55 (1.8%) |
| 35 to 64 Years | 217 (6.0%) | 221 (5.6%) |
| 65 to 74 Years | 18 (3.2%) | 32 (7.1%) |
| 75 Years and over | 106 (26.4%) | 189 (33.8%) |
Disability Class: Ambulatory Difficulty
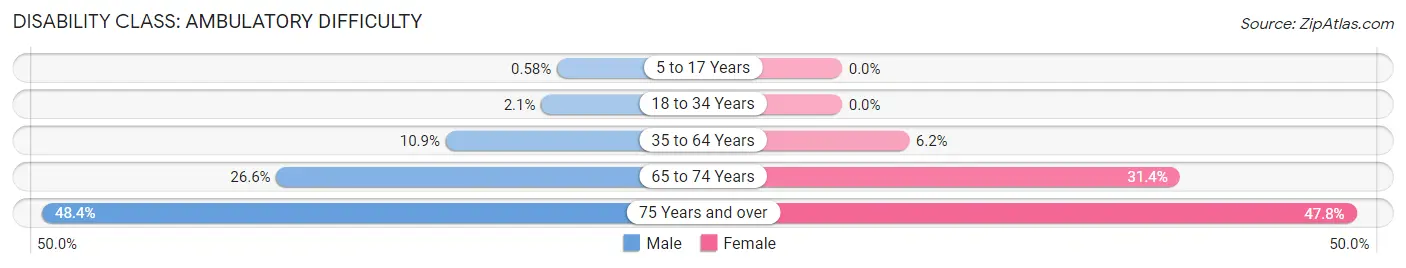
| Age Bracket | Male | Female |
| 5 to 17 Years | 11 (0.6%) | 0 (0.0%) |
| 18 to 34 Years | 70 (2.1%) | 0 (0.0%) |
| 35 to 64 Years | 394 (10.9%) | 247 (6.2%) |
| 65 to 74 Years | 151 (26.6%) | 142 (31.4%) |
| 75 Years and over | 194 (48.4%) | 267 (47.8%) |
Disability Class: Self-Care Difficulty
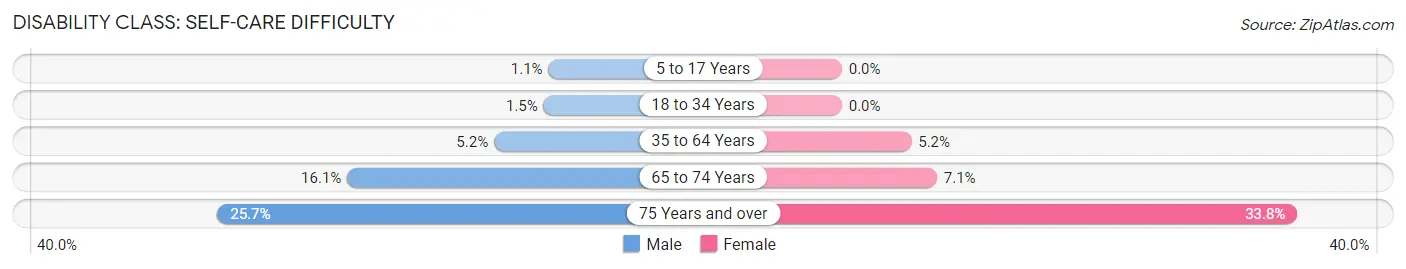
| Age Bracket | Male | Female |
| 5 to 17 Years | 21 (1.1%) | 0 (0.0%) |
| 18 to 34 Years | 50 (1.5%) | 0 (0.0%) |
| 35 to 64 Years | 186 (5.1%) | 205 (5.2%) |
| 65 to 74 Years | 91 (16.1%) | 32 (7.1%) |
| 75 Years and over | 103 (25.7%) | 189 (33.8%) |
Technology Access in Willowbrook
Computing Device Access in Willowbrook
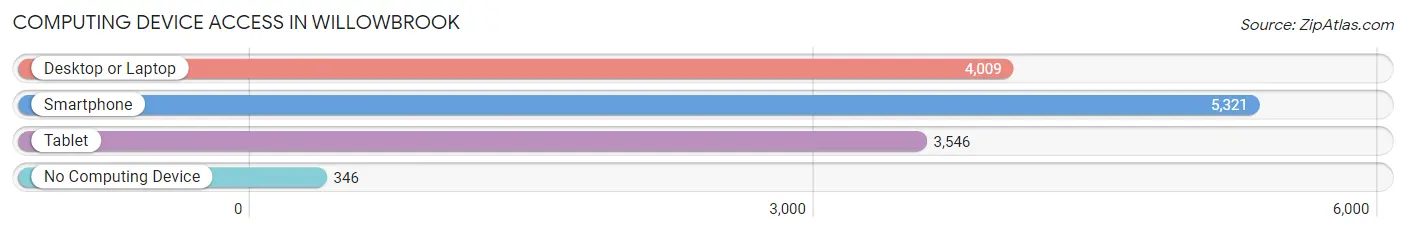
| Device Type | # Households | % Households |
| Desktop or Laptop | 4,009 | 67.7% |
| Smartphone | 5,321 | 89.9% |
| Tablet | 3,546 | 59.9% |
| No Computing Device | 346 | 5.9% |
| Total | 5,918 | 100.0% |
Internet Access in Willowbrook
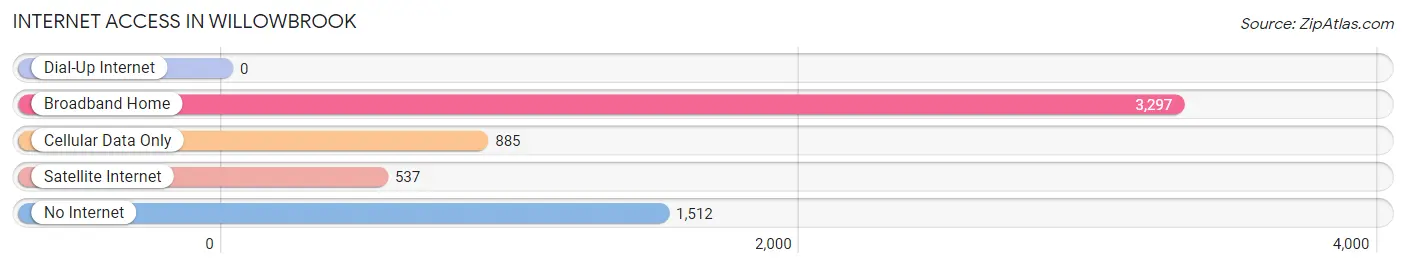
| Internet Type | # Households | % Households |
| Dial-Up Internet | 0 | 0.0% |
| Broadband Home | 3,297 | 55.7% |
| Cellular Data Only | 885 | 14.9% |
| Satellite Internet | 537 | 9.1% |
| No Internet | 1,512 | 25.6% |
| Total | 5,918 | 100.0% |
Willowbrook Summary
Willowbrook is a census-designated place (CDP) located in Los Angeles County, California. It is located in the South Los Angeles region of the county, and is bordered by the cities of Compton, Lynwood, and South Gate. The population of Willowbrook was 24,988 at the 2010 census.
History
Willowbrook was originally part of the Rancho San Antonio land grant, which was granted to Antonio Maria Lugo in 1845. The area was later developed as a farming community in the late 19th century. In the early 20th century, the area was annexed by the City of Compton. In the 1950s, the area was developed as a residential community, and the Willowbrook name was adopted in the 1960s.
Geography
Willowbrook is located at 33°54'25"N 118°14'17"W (33.906890, -118.237945). According to the United States Census Bureau, the CDP has a total area of 1.3 square miles (3.4 km2), all of it land.
Economy
Willowbrook is primarily a residential community, with a few small businesses located in the area. The largest employer in the area is the Los Angeles County Department of Health Services, which operates the Martin Luther King Jr. Medical Center in Willowbrook. Other employers include the Los Angeles Unified School District, the Los Angeles County Sheriff's Department, and the Los Angeles County Fire Department.
Demographics
As of the 2010 census, there were 24,988 people, 6,945 households, and 5,717 families residing in the CDP. The population density was 19,093.3 people per square mile (7,364.2/km2). There were 7,541 housing units at an average density of 5,741.3 per square mile (2,219.7/km2). The racial makeup of the CDP was 11.2% White, 11.2% African American, 0.7% Native American, 0.7% Asian, 0.1% Pacific Islander, 73.3% from other races, and 3.0% from two or more races. Hispanic or Latino of any race were 87.2% of the population.
There were 6,945 households, out of which 48.2% had children under the age of 18 living with them, 44.2% were married couples living together, 28.2% had a female householder with no husband present, and 19.2% were non-families. 15.2% of all households were made up of individuals, and 5.2% had someone living alone who was 65 years of age or older. The average household size was 3.6 and the average family size was 3.9.
In the CDP, the population was spread out, with 33.2% under the age of 18, 11.2% from 18 to 24, 30.2% from 25 to 44, 17.2% from 45 to 64, and 8.2% who were 65 years of age or older. The median age was 28 years. For every 100 females, there were 97.2 males. For every 100 females age 18 and over, there were 94.2 males.
The median income for a household in the CDP was $30,917, and the median income for a family was $31,917. Males had a median income of $25,917 versus $20,917 for females. The per capita income for the CDP was $11,917. About 24.2% of families and 27.2% of the population were below the poverty line, including 36.2% of those under age 18 and 15.2% of those age 65 or over.
Common Questions
What is Per Capita Income in Willowbrook?
Per Capita income in Willowbrook is $18,816.
What is the Median Family Income in Willowbrook?
Median Family Income in Willowbrook is $61,124.
What is the Median Household income in Willowbrook?
Median Household Income in Willowbrook is $52,384.
What is Income or Wage Gap in Willowbrook?
Income or Wage Gap in Willowbrook is 13.6%.
Women in Willowbrook earn 86.4 cents for every dollar earned by a man.
What is Family Income Deficit in Willowbrook?
Family Income Deficit in Willowbrook is $9,782.
Families that are below poverty line in Willowbrook earn $9,782 less on average than the poverty threshold level.
What is Inequality or Gini Index in Willowbrook?
Inequality or Gini Index in Willowbrook is 0.44.
What is the Total Population of Willowbrook?
Total Population of Willowbrook is 22,491.
What is the Total Male Population of Willowbrook?
Total Male Population of Willowbrook is 10,963.
What is the Total Female Population of Willowbrook?
Total Female Population of Willowbrook is 11,528.
What is the Ratio of Males per 100 Females in Willowbrook?
There are 95.10 Males per 100 Females in Willowbrook.
What is the Ratio of Females per 100 Males in Willowbrook?
There are 105.15 Females per 100 Males in Willowbrook.
What is the Median Population Age in Willowbrook?
Median Population Age in Willowbrook is 30.6 Years.
What is the Average Family Size in Willowbrook
Average Family Size in Willowbrook is 4.3 People.
What is the Average Household Size in Willowbrook
Average Household Size in Willowbrook is 3.8 People.
How Large is the Labor Force in Willowbrook?
There are 10,296 People in the Labor Forcein in Willowbrook.
What is the Percentage of People in the Labor Force in Willowbrook?
61.3% of People are in the Labor Force in Willowbrook.
What is the Unemployment Rate in Willowbrook?
Unemployment Rate in Willowbrook is 13.2%.