Lodoga, CA Map & Demographics
Lodoga Map
Lodoga Overview
$33,371
PER CAPITA INCOME
$77,625
AVG FAMILY INCOME
97.4%
WAGE / INCOME GAP [ % ]
2.6¢/ $1
WAGE / INCOME GAP [ $ ]
0.51
INEQUALITY / GINI INDEX
201
TOTAL POPULATION
114
MALE POPULATION
87
FEMALE POPULATION
131.03
MALES / 100 FEMALES
76.32
FEMALES / 100 MALES
58.8
MEDIAN AGE
3.6
AVG FAMILY SIZE
2.5
AVG HOUSEHOLD SIZE
83
LABOR FORCE [ PEOPLE ]
46.6%
PERCENT IN LABOR FORCE
Income in Lodoga
Income Overview in Lodoga
| Characteristic | Number | Measure |
| Per Capita Income | 201 | $33,371 |
| Median Family Income | 43 | $77,625 |
| Mean Family Income | 43 | $67,593 |
| Median Household Income | 82 | $0 |
| Mean Household Income | 82 | $41,761 |
| Income Deficit | 43 | $0 |
| Wage / Income Gap (%) | 201 | 97.40% |
| Wage / Income Gap ($) | 201 | 2.60¢ per $1 |
| Gini / Inequality Index | 201 | 0.51 |
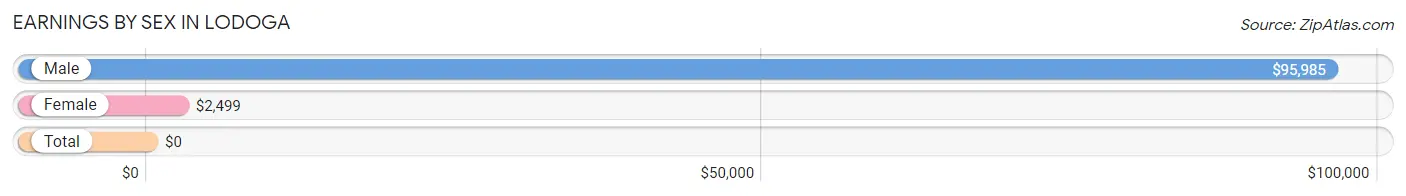
Earnings by Sex in Lodoga
| Sex | Number | Average Earnings |
| Male | 40 (48.2%) | $95,985 |
| Female | 43 (51.8%) | $2,499 |
| Total | 83 (100.0%) | $0 |
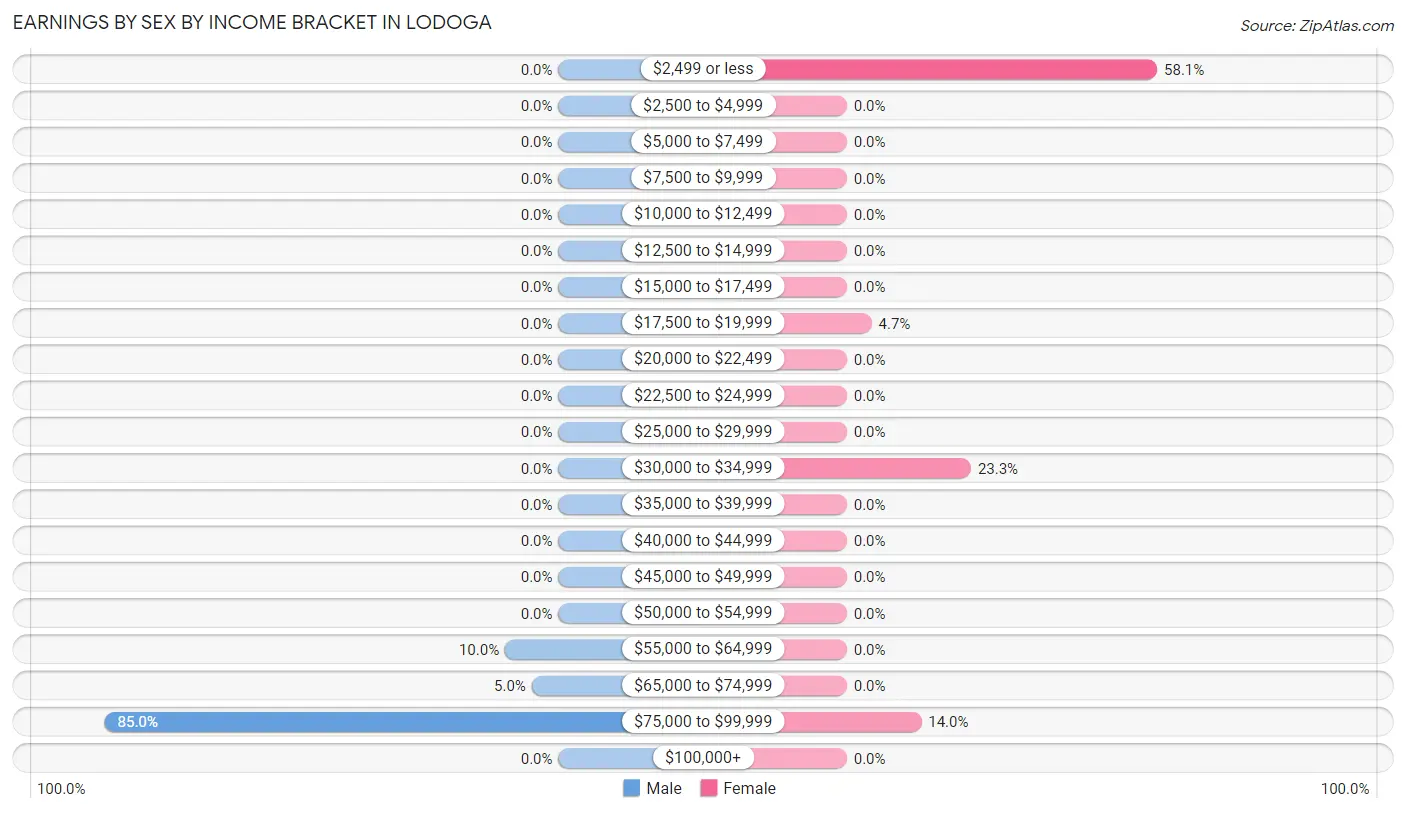
Earnings by Sex by Income Bracket in Lodoga
The most common earnings brackets in Lodoga are $75,000 to $99,999 for men (34 | 85.0%) and $2,499 or less for women (25 | 58.1%).
| Income | Male | Female |
| $2,499 or less | 0 (0.0%) | 25 (58.1%) |
| $2,500 to $4,999 | 0 (0.0%) | 0 (0.0%) |
| $5,000 to $7,499 | 0 (0.0%) | 0 (0.0%) |
| $7,500 to $9,999 | 0 (0.0%) | 0 (0.0%) |
| $10,000 to $12,499 | 0 (0.0%) | 0 (0.0%) |
| $12,500 to $14,999 | 0 (0.0%) | 0 (0.0%) |
| $15,000 to $17,499 | 0 (0.0%) | 0 (0.0%) |
| $17,500 to $19,999 | 0 (0.0%) | 2 (4.6%) |
| $20,000 to $22,499 | 0 (0.0%) | 0 (0.0%) |
| $22,500 to $24,999 | 0 (0.0%) | 0 (0.0%) |
| $25,000 to $29,999 | 0 (0.0%) | 0 (0.0%) |
| $30,000 to $34,999 | 0 (0.0%) | 10 (23.3%) |
| $35,000 to $39,999 | 0 (0.0%) | 0 (0.0%) |
| $40,000 to $44,999 | 0 (0.0%) | 0 (0.0%) |
| $45,000 to $49,999 | 0 (0.0%) | 0 (0.0%) |
| $50,000 to $54,999 | 0 (0.0%) | 0 (0.0%) |
| $55,000 to $64,999 | 4 (10.0%) | 0 (0.0%) |
| $65,000 to $74,999 | 2 (5.0%) | 0 (0.0%) |
| $75,000 to $99,999 | 34 (85.0%) | 6 (14.0%) |
| $100,000+ | 0 (0.0%) | 0 (0.0%) |
| Total | 40 (100.0%) | 43 (100.0%) |
Earnings by Sex by Educational Attainment in Lodoga
| Educational Attainment | Male Income | Female Income |
| Less than High School | - | - |
| High School Diploma | - | - |
| College or Associate's Degree | - | - |
| Bachelor's Degree | - | - |
| Graduate Degree | - | - |
| Total | $95,985 | $2,499 |
Family Income in Lodoga
Family Income Brackets in Lodoga
According to the Lodoga family income data, there are 18 families falling into the $75,000 to $99,999 income range, which is the most common income bracket and makes up 41.9% of all families.
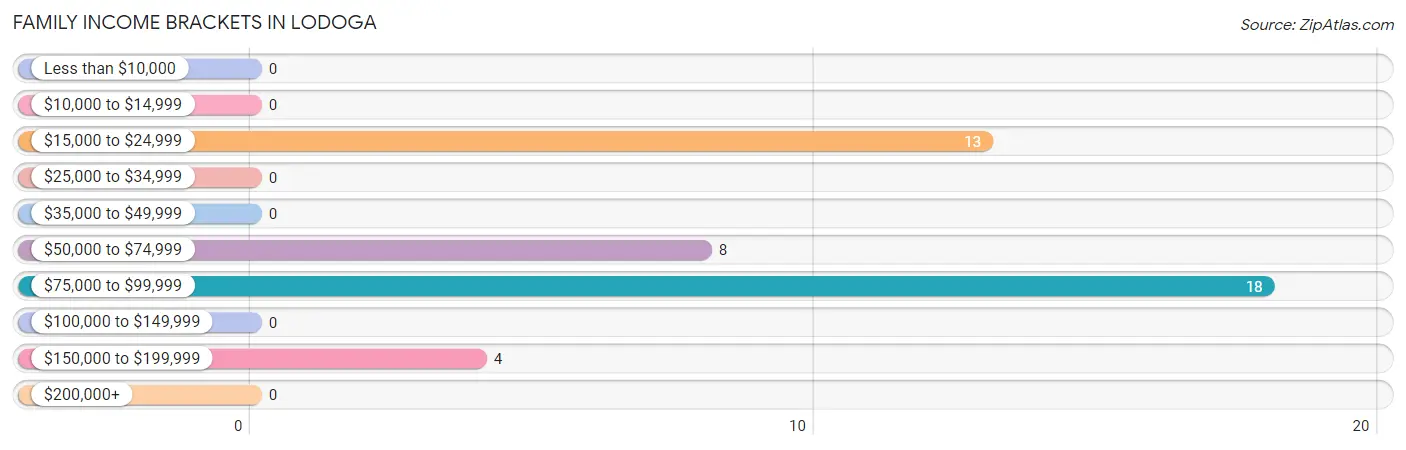
| Income Bracket | # Families | % Families |
| Less than $10,000 | 0 | 0.0% |
| $10,000 to $14,999 | 0 | 0.0% |
| $15,000 to $24,999 | 13 | 30.2% |
| $25,000 to $34,999 | 0 | 0.0% |
| $35,000 to $49,999 | 0 | 0.0% |
| $50,000 to $74,999 | 8 | 18.6% |
| $75,000 to $99,999 | 18 | 41.9% |
| $100,000 to $149,999 | 0 | 0.0% |
| $150,000 to $199,999 | 4 | 9.3% |
| $200,000+ | 0 | 0.0% |
Family Income by Famaliy Size in Lodoga
2-person families (17 | 39.5%) account for the highest median family income in Lodoga with $90,179 per family, while 2-person families (17 | 39.5%) have the highest median income of $45,090 per family member.
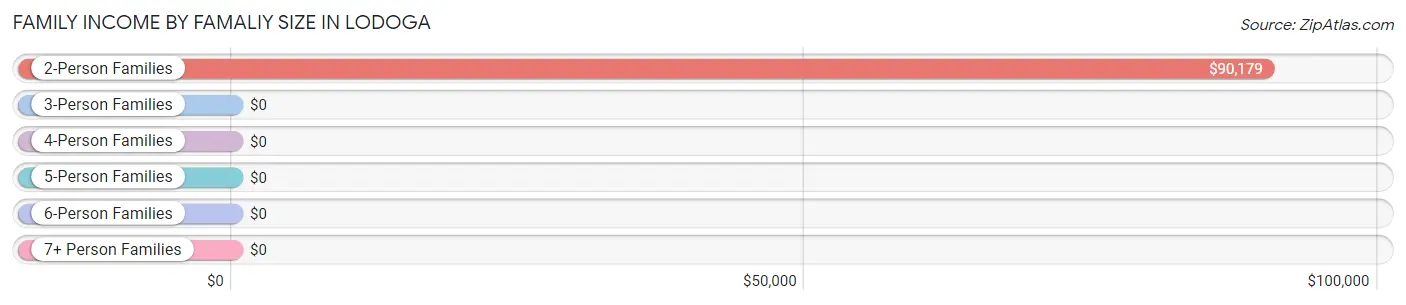
| Income Bracket | # Families | Median Income |
| 2-Person Families | 17 (39.5%) | $90,179 |
| 3-Person Families | 23 (53.5%) | $0 |
| 4-Person Families | 3 (7.0%) | $0 |
| 5-Person Families | 0 (0.0%) | $0 |
| 6-Person Families | 0 (0.0%) | $0 |
| 7+ Person Families | 0 (0.0%) | $0 |
| Total | 43 (100.0%) | $77,625 |
Family Income by Number of Earners in Lodoga
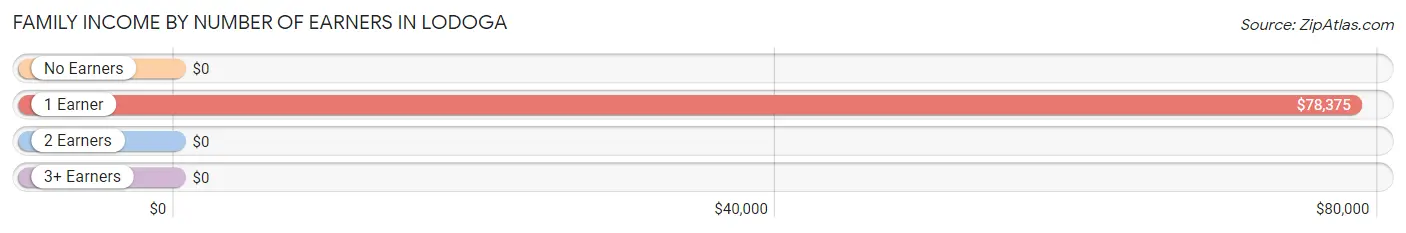
| Number of Earners | # Families | Median Income |
| No Earners | 24 (55.8%) | $0 |
| 1 Earner | 15 (34.9%) | $78,375 |
| 2 Earners | 2 (4.6%) | $0 |
| 3+ Earners | 2 (4.6%) | $0 |
| Total | 43 (100.0%) | $77,625 |
Household Income in Lodoga
Household Income Brackets in Lodoga
With 25 households falling in the category, the $10,000 to $14,999 income range is the most frequent in Lodoga, accounting for 30.5% of all households.
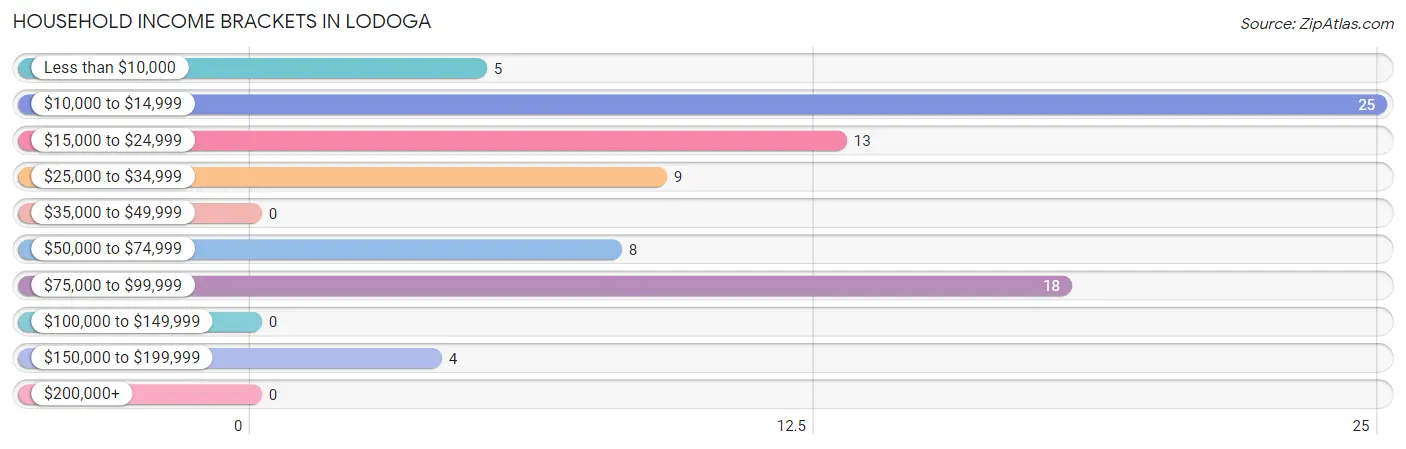
| Income Bracket | # Households | % Households |
| Less than $10,000 | 5 | 6.1% |
| $10,000 to $14,999 | 25 | 30.5% |
| $15,000 to $24,999 | 13 | 15.9% |
| $25,000 to $34,999 | 9 | 11.0% |
| $35,000 to $49,999 | 0 | 0.0% |
| $50,000 to $74,999 | 8 | 9.8% |
| $75,000 to $99,999 | 18 | 22.0% |
| $100,000 to $149,999 | 0 | 0.0% |
| $150,000 to $199,999 | 4 | 4.9% |
| $200,000+ | 0 | 0.0% |
Household Income by Householder Age in Lodoga
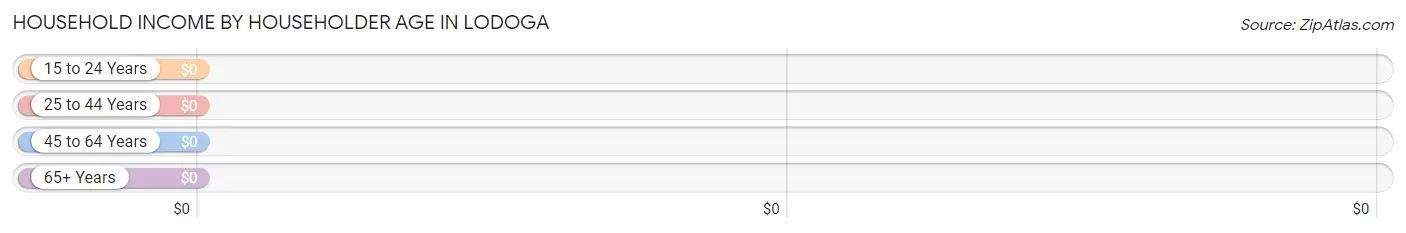
| Income Bracket | # Households | Median Income |
| 15 to 24 Years | 1 (1.2%) | $0 |
| 25 to 44 Years | 2 (2.4%) | $0 |
| 45 to 64 Years | 18 (22.0%) | $0 |
| 65+ Years | 61 (74.4%) | $0 |
| Total | 82 (100.0%) | $0 |
Poverty in Lodoga
Income Below Poverty by Sex and Age in Lodoga
With 36.0% poverty level for males and 50.6% for females among the residents of Lodoga, 15 year old males and 65 to 74 year old females are the most vulnerable to poverty, with 7 males (100.0%) and 35 females (77.8%) in their respective age groups living below the poverty level.
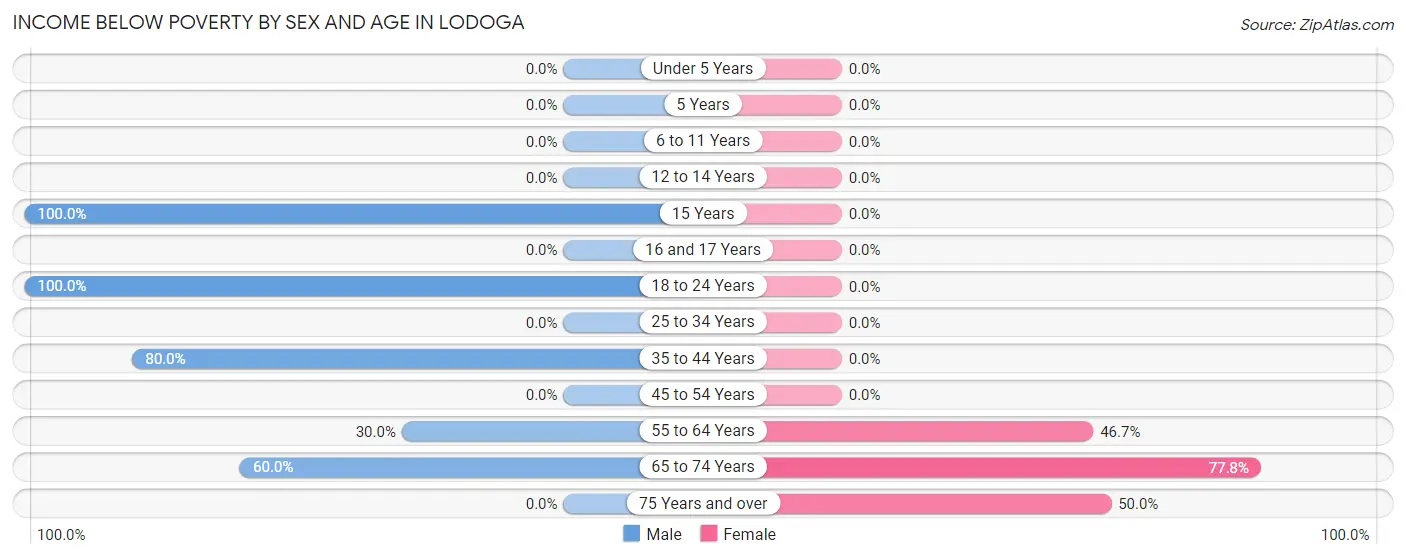
| Age Bracket | Male | Female |
| Under 5 Years | 0 (0.0%) | 0 (0.0%) |
| 5 Years | 0 (0.0%) | 0 (0.0%) |
| 6 to 11 Years | 0 (0.0%) | 0 (0.0%) |
| 12 to 14 Years | 0 (0.0%) | 0 (0.0%) |
| 15 Years | 7 (100.0%) | 0 (0.0%) |
| 16 and 17 Years | 0 (0.0%) | 0 (0.0%) |
| 18 to 24 Years | 8 (100.0%) | 0 (0.0%) |
| 25 to 34 Years | 0 (0.0%) | 0 (0.0%) |
| 35 to 44 Years | 8 (80.0%) | 0 (0.0%) |
| 45 to 54 Years | 0 (0.0%) | 0 (0.0%) |
| 55 to 64 Years | 3 (30.0%) | 7 (46.7%) |
| 65 to 74 Years | 15 (60.0%) | 35 (77.8%) |
| 75 Years and over | 0 (0.0%) | 2 (50.0%) |
| Total | 41 (36.0%) | 44 (50.6%) |
Income Above Poverty by Sex and Age in Lodoga
According to the poverty statistics in Lodoga, males aged 12 to 14 years and females aged under 5 years are the age groups that are most secure financially, with 100.0% of males and 100.0% of females in these age groups living above the poverty line.
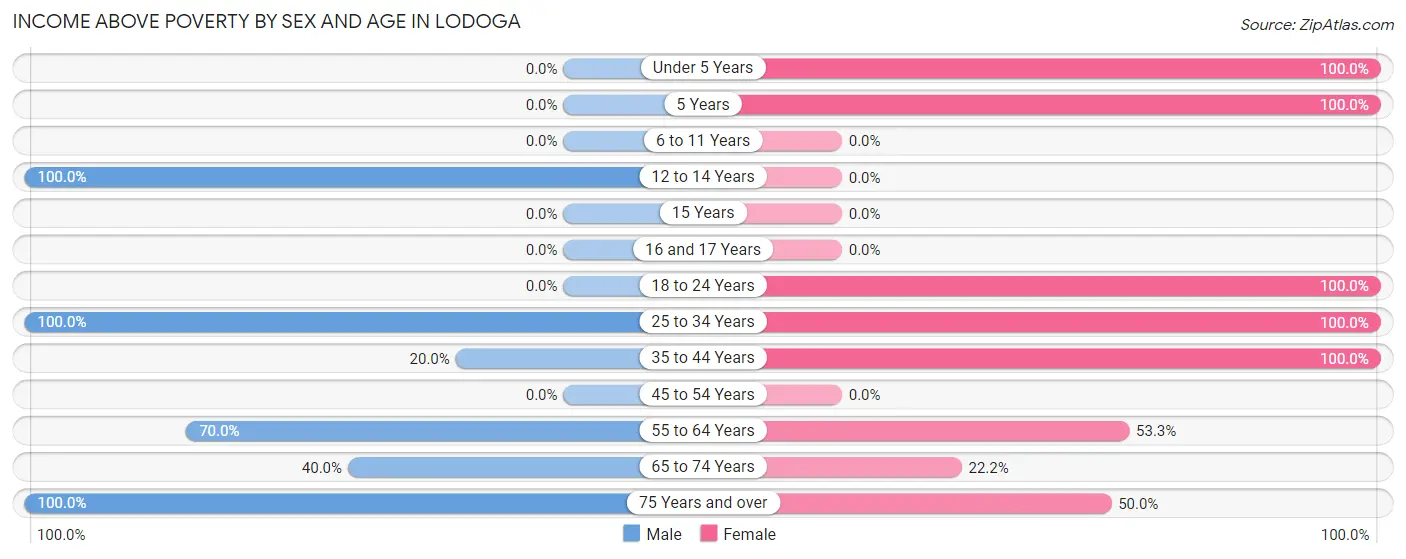
| Age Bracket | Male | Female |
| Under 5 Years | 0 (0.0%) | 2 (100.0%) |
| 5 Years | 0 (0.0%) | 2 (100.0%) |
| 6 to 11 Years | 0 (0.0%) | 0 (0.0%) |
| 12 to 14 Years | 12 (100.0%) | 0 (0.0%) |
| 15 Years | 0 (0.0%) | 0 (0.0%) |
| 16 and 17 Years | 0 (0.0%) | 0 (0.0%) |
| 18 to 24 Years | 0 (0.0%) | 1 (100.0%) |
| 25 to 34 Years | 33 (100.0%) | 2 (100.0%) |
| 35 to 44 Years | 2 (20.0%) | 16 (100.0%) |
| 45 to 54 Years | 0 (0.0%) | 0 (0.0%) |
| 55 to 64 Years | 7 (70.0%) | 8 (53.3%) |
| 65 to 74 Years | 10 (40.0%) | 10 (22.2%) |
| 75 Years and over | 9 (100.0%) | 2 (50.0%) |
| Total | 73 (64.0%) | 43 (49.4%) |
Income Below Poverty Among Married-Couple Families in Lodoga
The poverty statistics for married-couple families in Lodoga show that 25.9% or 7 of the total 27 families live below the poverty line. Families with no children have the highest poverty rate of 29.2%, comprising of 7 families. On the other hand, families with 1 or 2 children have the lowest poverty rate of 0.0%, which includes 0 families.
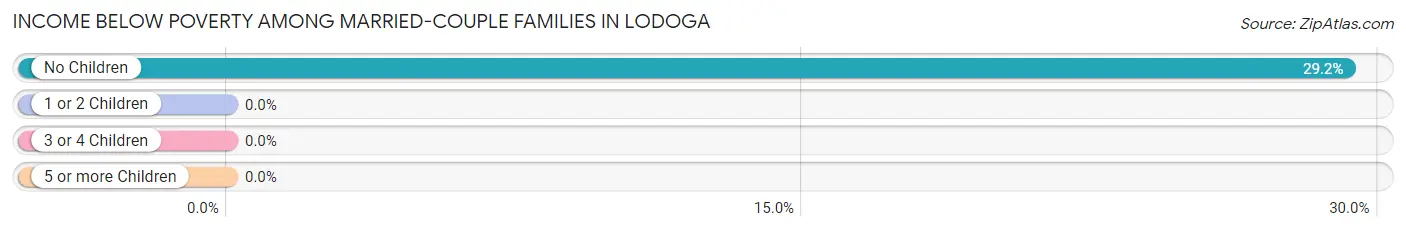
| Children | Above Poverty | Below Poverty |
| No Children | 17 (70.8%) | 7 (29.2%) |
| 1 or 2 Children | 3 (100.0%) | 0 (0.0%) |
| 3 or 4 Children | 0 (0.0%) | 0 (0.0%) |
| 5 or more Children | 0 (0.0%) | 0 (0.0%) |
| Total | 20 (74.1%) | 7 (25.9%) |
Income Below Poverty Among Single-Parent Households in Lodoga
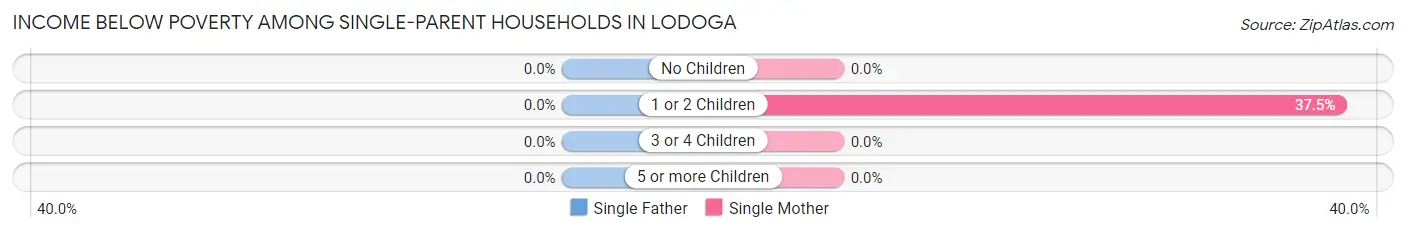
| Children | Single Father | Single Mother |
| No Children | 0 (0.0%) | 0 (0.0%) |
| 1 or 2 Children | 0 (0.0%) | 6 (37.5%) |
| 3 or 4 Children | 0 (0.0%) | 0 (0.0%) |
| 5 or more Children | 0 (0.0%) | 0 (0.0%) |
| Total | 0 (0.0%) | 6 (37.5%) |
Income Below Poverty Among Married-Couple vs Single-Parent Households in Lodoga
The poverty data for Lodoga shows that 7 of the married-couple family households (25.9%) and 6 of the single-parent households (37.5%) are living below the poverty level. Within the married-couple family households, those with no children have the highest poverty rate, with 7 households (29.2%) falling below the poverty line. Among the single-parent households, those with 1 or 2 children have the highest poverty rate, with 6 household (37.5%) living below poverty.
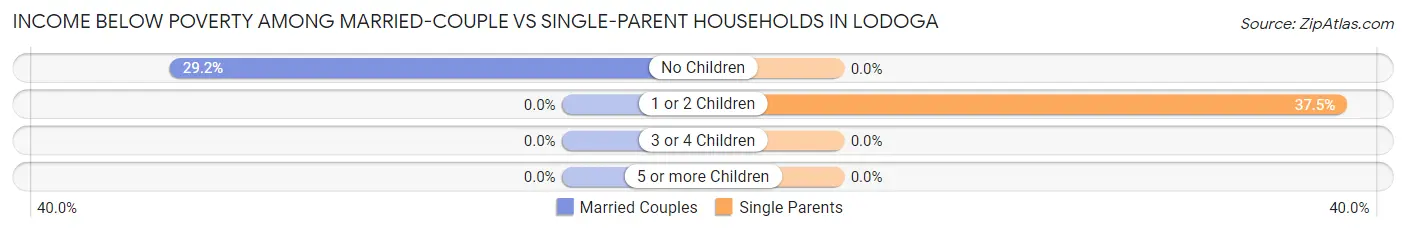
| Children | Married-Couple Families | Single-Parent Households |
| No Children | 7 (29.2%) | 0 (0.0%) |
| 1 or 2 Children | 0 (0.0%) | 6 (37.5%) |
| 3 or 4 Children | 0 (0.0%) | 0 (0.0%) |
| 5 or more Children | 0 (0.0%) | 0 (0.0%) |
| Total | 7 (25.9%) | 6 (37.5%) |
Race in Lodoga
The most populous races in Lodoga are White / Caucasian (138 | 68.7%), Black / African American (40 | 19.9%), and Hispanic or Latino (36 | 17.9%).
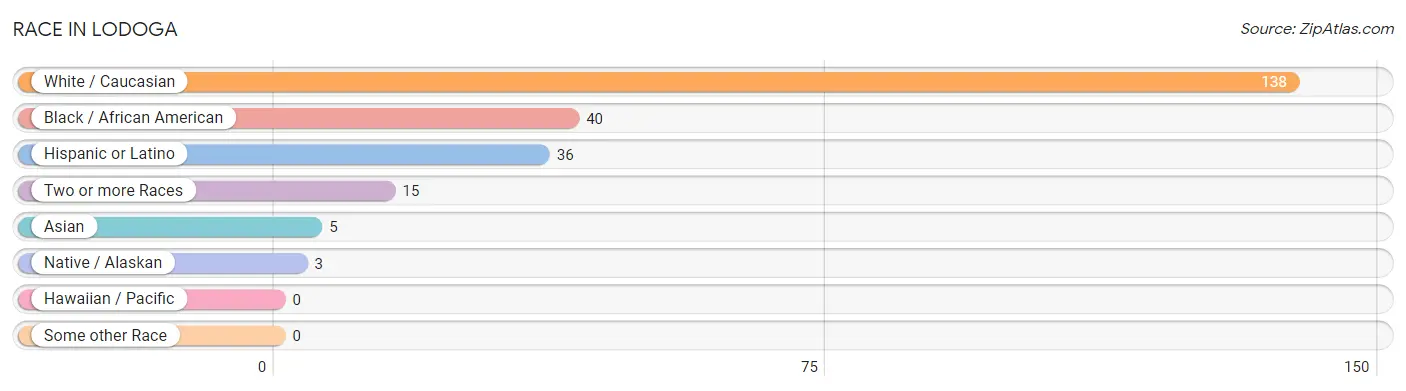
| Race | # Population | % Population |
| Asian | 5 | 2.5% |
| Black / African American | 40 | 19.9% |
| Hawaiian / Pacific | 0 | 0.0% |
| Hispanic or Latino | 36 | 17.9% |
| Native / Alaskan | 3 | 1.5% |
| White / Caucasian | 138 | 68.7% |
| Two or more Races | 15 | 7.5% |
| Some other Race | 0 | 0.0% |
| Total | 201 | 100.0% |
Ancestry in Lodoga
The most populous ancestries reported in Lodoga are Mexican (36 | 17.9%), Jamaican (25 | 12.4%), German (18 | 9.0%), Blackfeet (15 | 7.5%), and European (13 | 6.5%), together accounting for 53.2% of all Lodoga residents.
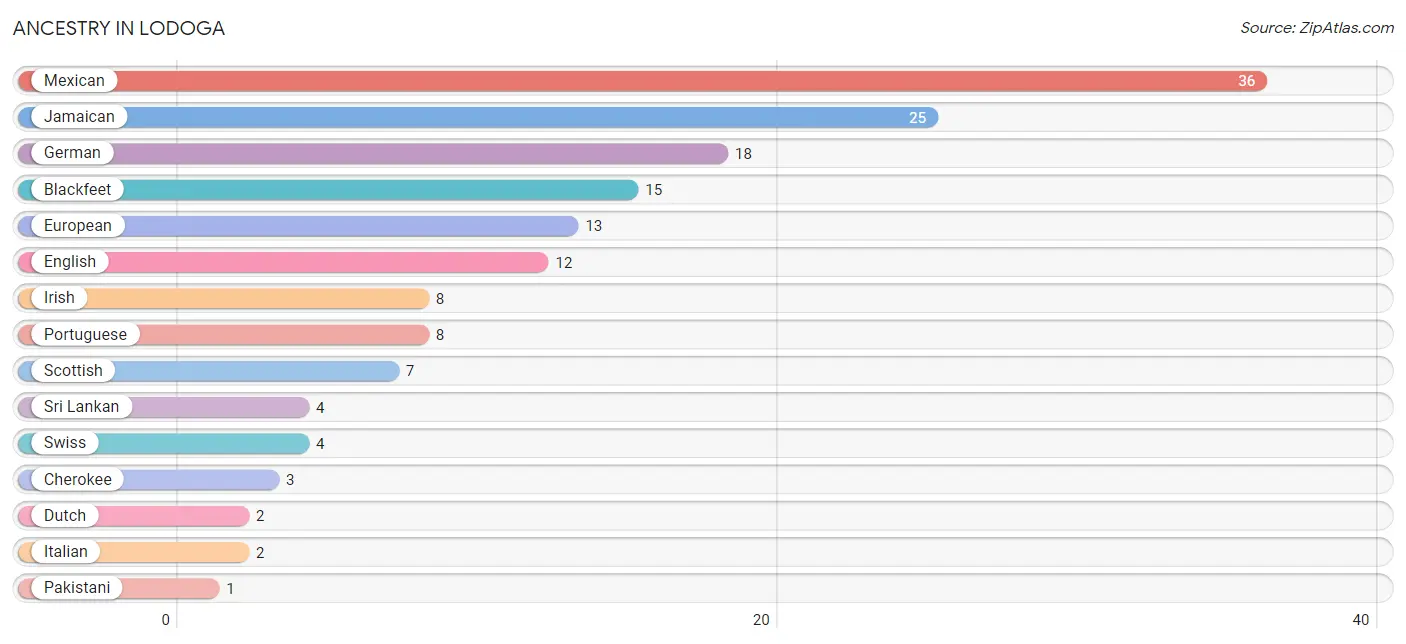
| Ancestry | # Population | % Population |
| Blackfeet | 15 | 7.5% |
| Cherokee | 3 | 1.5% |
| Dutch | 2 | 1.0% |
| English | 12 | 6.0% |
| European | 13 | 6.5% |
| German | 18 | 9.0% |
| Irish | 8 | 4.0% |
| Italian | 2 | 1.0% |
| Jamaican | 25 | 12.4% |
| Mexican | 36 | 17.9% |
| Pakistani | 1 | 0.5% |
| Portuguese | 8 | 4.0% |
| Scottish | 7 | 3.5% |
| Sri Lankan | 4 | 2.0% |
| Swiss | 4 | 2.0% | View All 15 Rows |
Immigrants in Lodoga
The most numerous immigrant groups reported in Lodoga came from Caribbean (25 | 12.4%), Jamaica (25 | 12.4%), Latin America (25 | 12.4%), Asia (1 | 0.5%), and South Eastern Asia (1 | 0.5%), together accounting for 38.3% of all Lodoga residents.
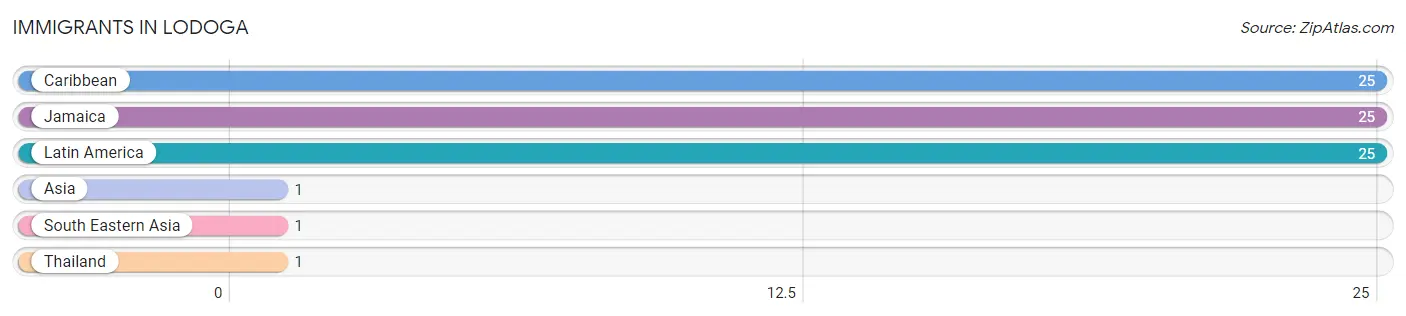
| Immigration Origin | # Population | % Population |
| Asia | 1 | 0.5% |
| Caribbean | 25 | 12.4% |
| Jamaica | 25 | 12.4% |
| Latin America | 25 | 12.4% |
| South Eastern Asia | 1 | 0.5% |
| Thailand | 1 | 0.5% | View All 6 Rows |
Sex and Age in Lodoga
Sex and Age in Lodoga
The most populous age groups in Lodoga are 25 to 29 Years (33 | 28.9%) for men and 65 to 69 Years (39 | 44.8%) for women.
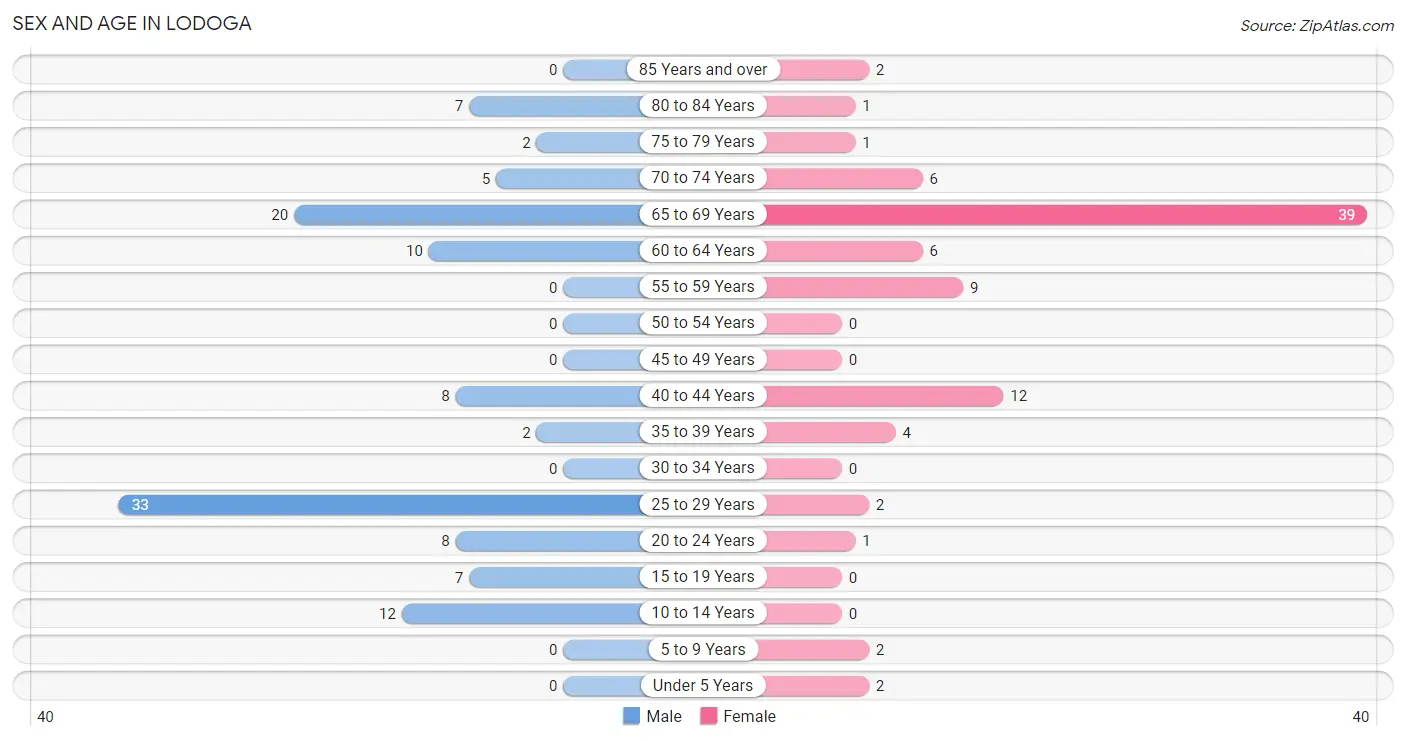
| Age Bracket | Male | Female |
| Under 5 Years | 0 (0.0%) | 2 (2.3%) |
| 5 to 9 Years | 0 (0.0%) | 2 (2.3%) |
| 10 to 14 Years | 12 (10.5%) | 0 (0.0%) |
| 15 to 19 Years | 7 (6.1%) | 0 (0.0%) |
| 20 to 24 Years | 8 (7.0%) | 1 (1.1%) |
| 25 to 29 Years | 33 (28.9%) | 2 (2.3%) |
| 30 to 34 Years | 0 (0.0%) | 0 (0.0%) |
| 35 to 39 Years | 2 (1.8%) | 4 (4.6%) |
| 40 to 44 Years | 8 (7.0%) | 12 (13.8%) |
| 45 to 49 Years | 0 (0.0%) | 0 (0.0%) |
| 50 to 54 Years | 0 (0.0%) | 0 (0.0%) |
| 55 to 59 Years | 0 (0.0%) | 9 (10.3%) |
| 60 to 64 Years | 10 (8.8%) | 6 (6.9%) |
| 65 to 69 Years | 20 (17.5%) | 39 (44.8%) |
| 70 to 74 Years | 5 (4.4%) | 6 (6.9%) |
| 75 to 79 Years | 2 (1.8%) | 1 (1.1%) |
| 80 to 84 Years | 7 (6.1%) | 1 (1.1%) |
| 85 Years and over | 0 (0.0%) | 2 (2.3%) |
| Total | 114 (100.0%) | 87 (100.0%) |
Families and Households in Lodoga
Median Family Size in Lodoga
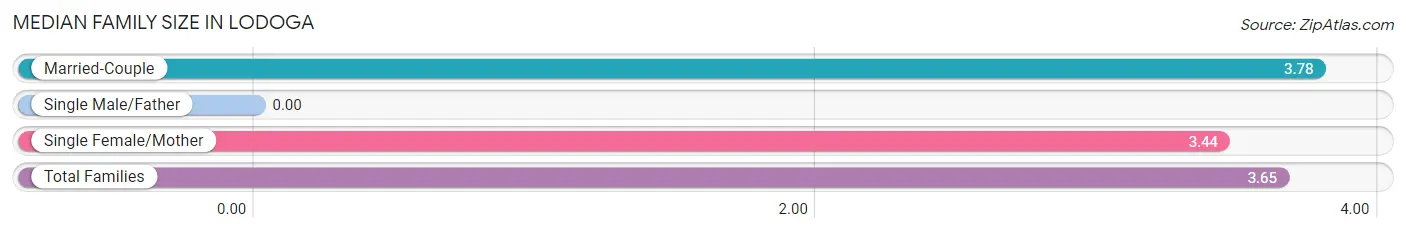
| Family Type | # Families | Family Size |
| Married-Couple | 27 (62.8%) | 3.78 |
| Single Male/Father | 0 (0.0%) | - |
| Single Female/Mother | 16 (37.2%) | 3.44 |
| Total Families | 43 (100.0%) | 3.65 |
Median Household Size in Lodoga
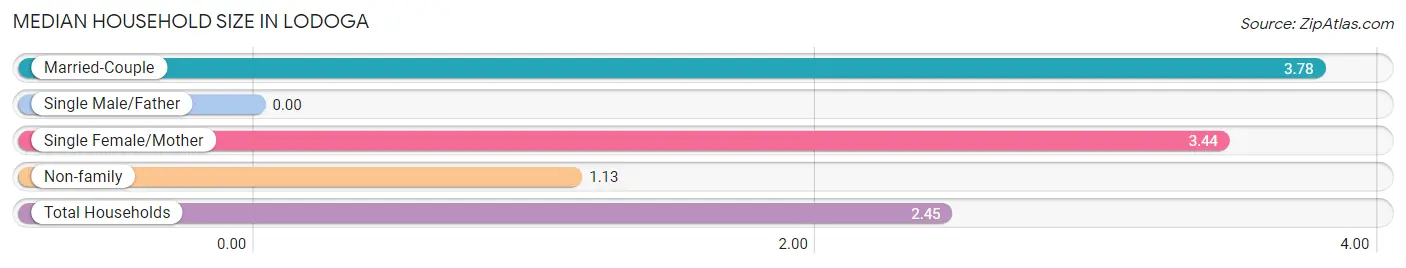
| Household Type | # Households | Household Size |
| Married-Couple | 27 (32.9%) | 3.78 |
| Single Male/Father | 0 (0.0%) | - |
| Single Female/Mother | 16 (19.5%) | 3.44 |
| Non-family | 39 (47.6%) | 1.13 |
| Total Households | 82 (100.0%) | 2.45 |
Household Size by Marriage Status in Lodoga
Out of a total of 82 households in Lodoga, 43 (52.4%) are family households, while 39 (47.6%) are nonfamily households. The most numerous type of family households are 3-person households, comprising 23, and the most common type of nonfamily households are 1-person households, comprising 35.
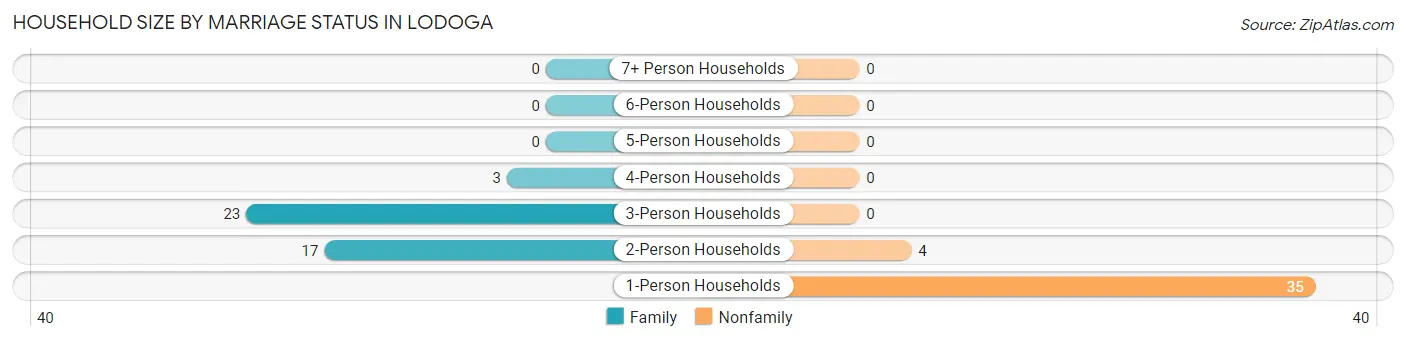
| Household Size | Family Households | Nonfamily Households |
| 1-Person Households | - | 35 (42.7%) |
| 2-Person Households | 17 (20.7%) | 4 (4.9%) |
| 3-Person Households | 23 (28.1%) | 0 (0.0%) |
| 4-Person Households | 3 (3.7%) | 0 (0.0%) |
| 5-Person Households | 0 (0.0%) | 0 (0.0%) |
| 6-Person Households | 0 (0.0%) | 0 (0.0%) |
| 7+ Person Households | 0 (0.0%) | 0 (0.0%) |
| Total | 43 (52.4%) | 39 (47.6%) |
Female Fertility in Lodoga
Fertility by Age in Lodoga
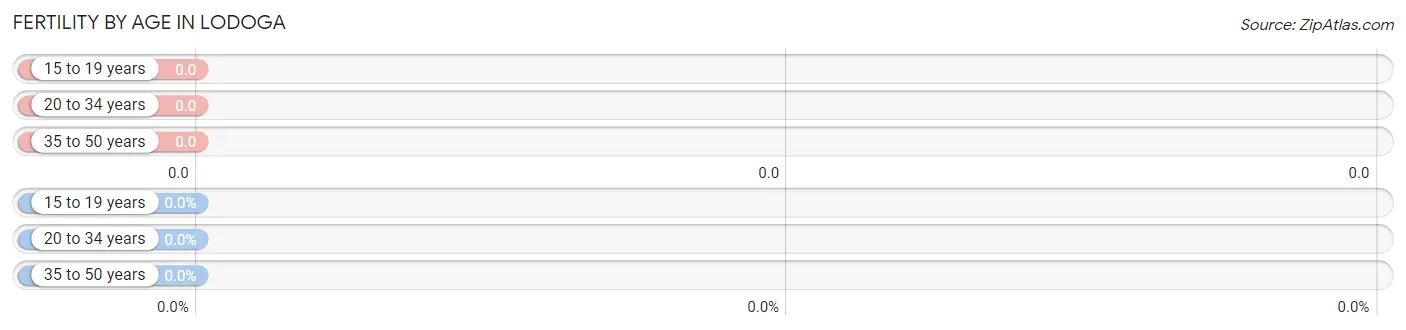
| Age Bracket | Women with Births | Births / 1,000 Women |
| 15 to 19 years | 0 (0.0%) | 0.0 |
| 20 to 34 years | 0 (0.0%) | 0.0 |
| 35 to 50 years | 0 (0.0%) | 0.0 |
| Total | 0 (0.0%) | 0.0 |
Fertility by Age by Marriage Status in Lodoga
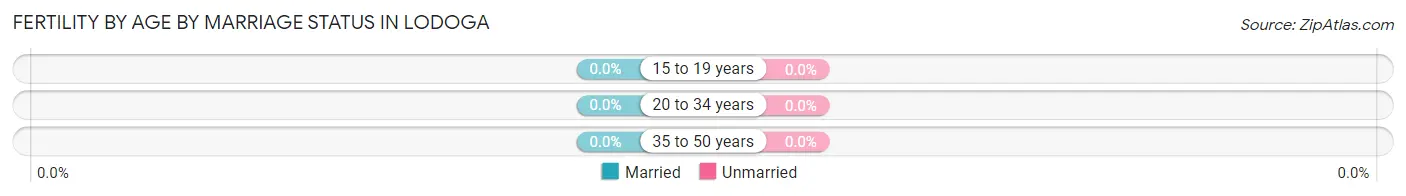
| Age Bracket | Married | Unmarried |
| 15 to 19 years | 0 (0.0%) | 0 (0.0%) |
| 20 to 34 years | 0 (0.0%) | 0 (0.0%) |
| 35 to 50 years | 0 (0.0%) | 0 (0.0%) |
| Total | 0 (0.0%) | 0 (0.0%) |
Fertility by Education in Lodoga
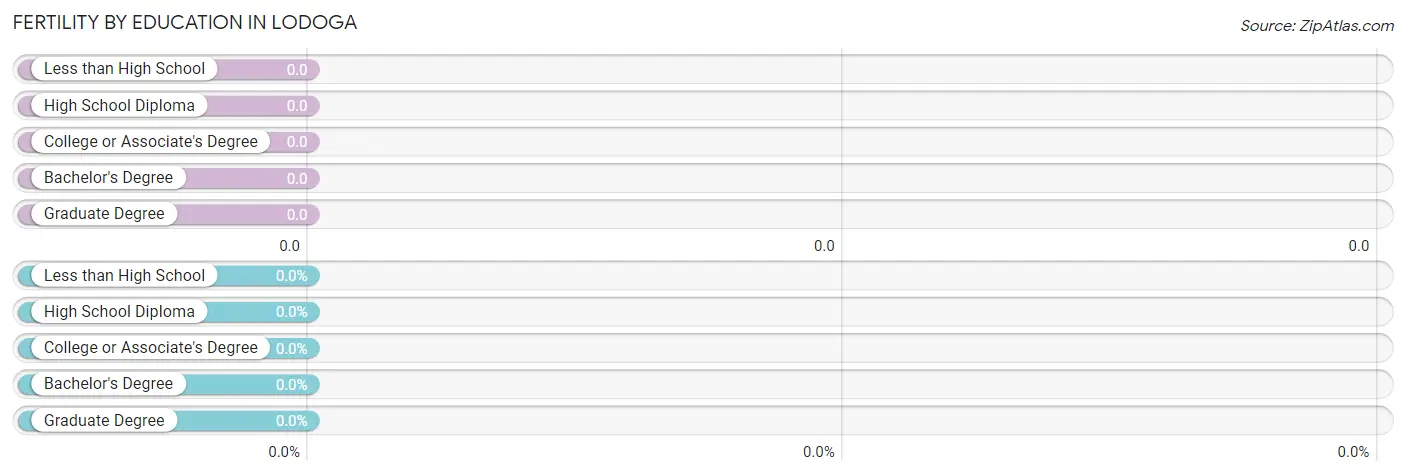
| Educational Attainment | Women with Births | Births / 1,000 Women |
| Less than High School | 0 (0.0%) | 0.0 |
| High School Diploma | 0 (0.0%) | 0.0 |
| College or Associate's Degree | 0 (0.0%) | 0.0 |
| Bachelor's Degree | 0 (0.0%) | 0.0 |
| Graduate Degree | 0 (0.0%) | 0.0 |
| Total | 0 (0.0%) | 0.0 |
Fertility by Education by Marriage Status in Lodoga
| Educational Attainment | Married | Unmarried |
| Less than High School | 0 (0.0%) | 0 (0.0%) |
| High School Diploma | 0 (0.0%) | 0 (0.0%) |
| College or Associate's Degree | 0 (0.0%) | 0 (0.0%) |
| Bachelor's Degree | 0 (0.0%) | 0 (0.0%) |
| Graduate Degree | 0 (0.0%) | 0 (0.0%) |
| Total | 0 (0.0%) | 0 (0.0%) |
Employment Characteristics in Lodoga
Employment by Class of Employer in Lodoga
Among the 83 employed individuals in Lodoga, private company employees (45 | 54.2%), self-employed (not incorporated) (32 | 38.6%), and federal government employees (6 | 7.2%) make up the most common classes of employment.
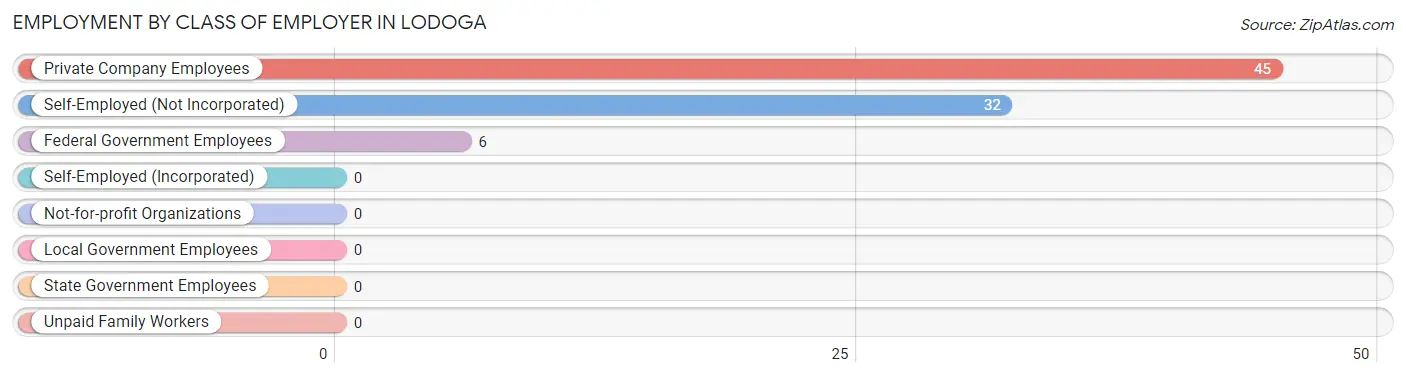
| Employer Class | # Employees | % Employees |
| Private Company Employees | 45 | 54.2% |
| Self-Employed (Incorporated) | 0 | 0.0% |
| Self-Employed (Not Incorporated) | 32 | 38.6% |
| Not-for-profit Organizations | 0 | 0.0% |
| Local Government Employees | 0 | 0.0% |
| State Government Employees | 0 | 0.0% |
| Federal Government Employees | 6 | 7.2% |
| Unpaid Family Workers | 0 | 0.0% |
| Total | 83 | 100.0% |
Employment Status by Age in Lodoga
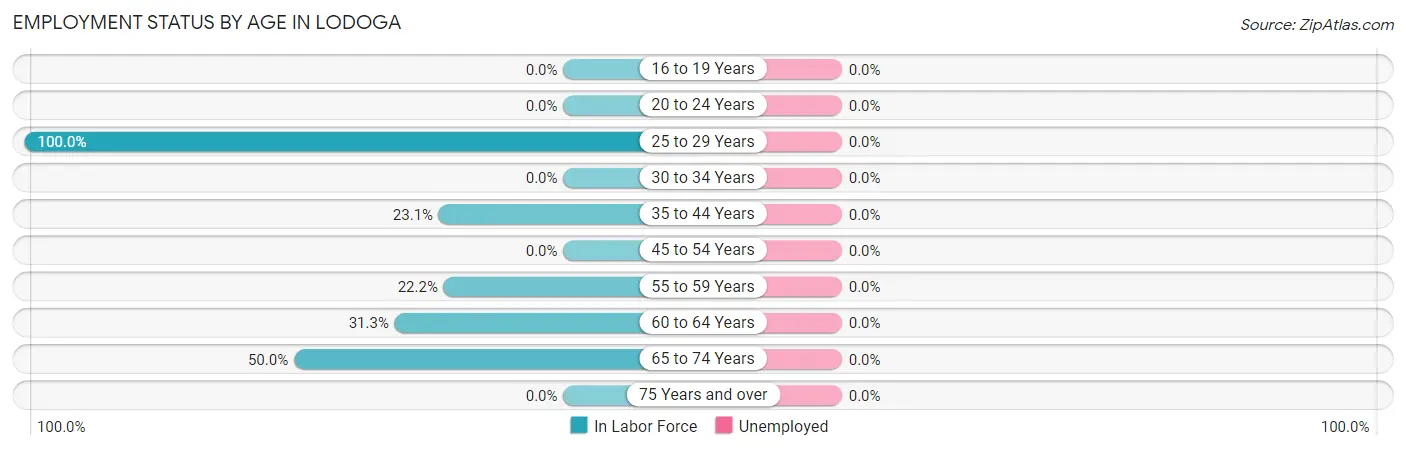
| Age Bracket | In Labor Force | Unemployed |
| 16 to 19 Years | 0 (0.0%) | 0 (0.0%) |
| 20 to 24 Years | 0 (0.0%) | 0 (0.0%) |
| 25 to 29 Years | 35 (100.0%) | 0 (0.0%) |
| 30 to 34 Years | 0 (0.0%) | 0 (0.0%) |
| 35 to 44 Years | 6 (23.1%) | 0 (0.0%) |
| 45 to 54 Years | 0 (0.0%) | 0 (0.0%) |
| 55 to 59 Years | 2 (22.2%) | 0 (0.0%) |
| 60 to 64 Years | 5 (31.3%) | 0 (0.0%) |
| 65 to 74 Years | 35 (50.0%) | 0 (0.0%) |
| 75 Years and over | 0 (0.0%) | 0 (0.0%) |
| Total | 83 (46.6%) | 0 (0.0%) |
Employment Status by Educational Attainment in Lodoga
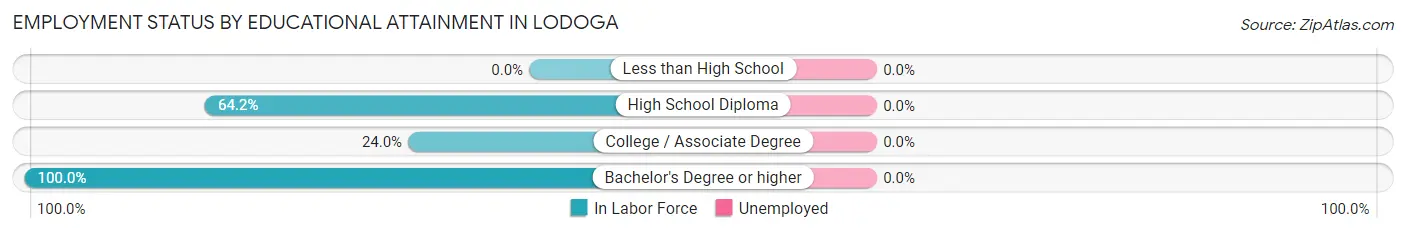
| Educational Attainment | In Labor Force | Unemployed |
| Less than High School | 0 (0.0%) | 0 (0.0%) |
| High School Diploma | 34 (64.2%) | 0 (0.0%) |
| College / Associate Degree | 6 (24.0%) | 0 (0.0%) |
| Bachelor's Degree or higher | 8 (100.0%) | 0 (0.0%) |
| Total | 48 (55.8%) | 0 (0.0%) |
Employment Occupations by Sex in Lodoga
Management, Business, Science and Arts Occupations
The most common Management, Business, Science and Arts occupations in Lodoga are Health Diagnosing & Treating (4 | 4.8%), Health Technologists (4 | 4.8%), Management (2 | 2.4%), Community & Social Service (2 | 2.4%), and Education, Arts & Media (2 | 2.4%).
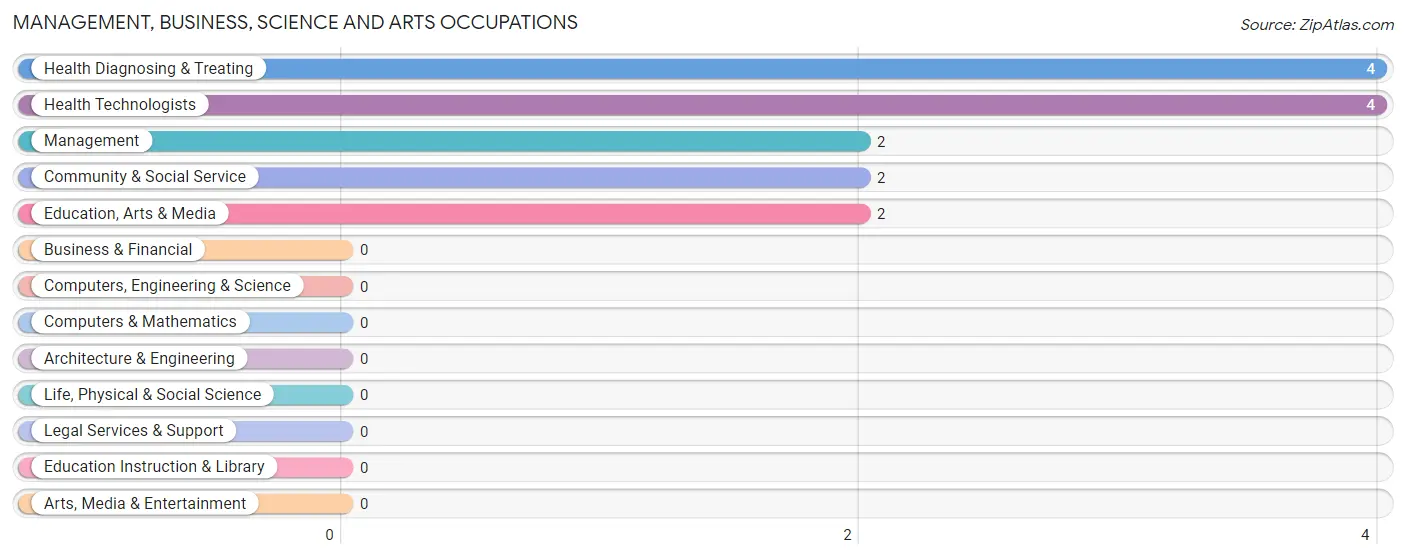
Management, Business, Science and Arts Occupations by Sex
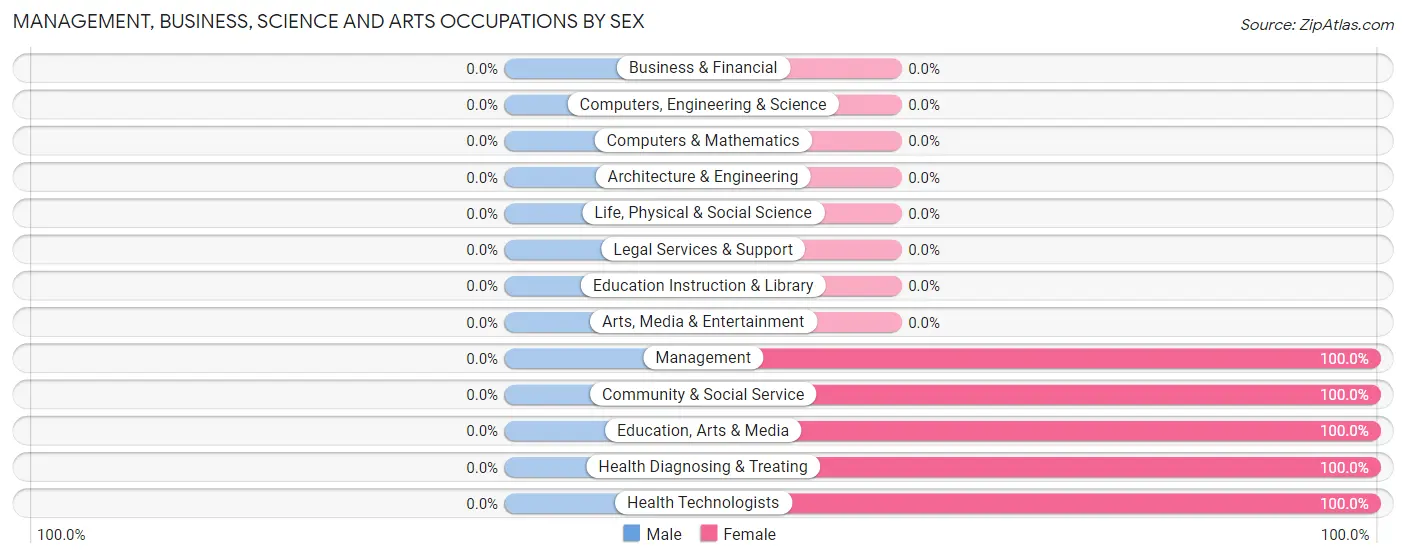
| Occupation | Male | Female |
| Management | 0 (0.0%) | 2 (100.0%) |
| Business & Financial | 0 (0.0%) | 0 (0.0%) |
| Computers, Engineering & Science | 0 (0.0%) | 0 (0.0%) |
| Computers & Mathematics | 0 (0.0%) | 0 (0.0%) |
| Architecture & Engineering | 0 (0.0%) | 0 (0.0%) |
| Life, Physical & Social Science | 0 (0.0%) | 0 (0.0%) |
| Community & Social Service | 0 (0.0%) | 2 (100.0%) |
| Education, Arts & Media | 0 (0.0%) | 2 (100.0%) |
| Legal Services & Support | 0 (0.0%) | 0 (0.0%) |
| Education Instruction & Library | 0 (0.0%) | 0 (0.0%) |
| Arts, Media & Entertainment | 0 (0.0%) | 0 (0.0%) |
| Health Diagnosing & Treating | 0 (0.0%) | 4 (100.0%) |
| Health Technologists | 0 (0.0%) | 4 (100.0%) |
| Total (Category) | 0 (0.0%) | 8 (100.0%) |
| Total (Overall) | 40 (48.2%) | 43 (51.8%) |
Services Occupations
The most common Services occupations in Lodoga are , and Cleaning & Maintenance (29 | 34.9%).
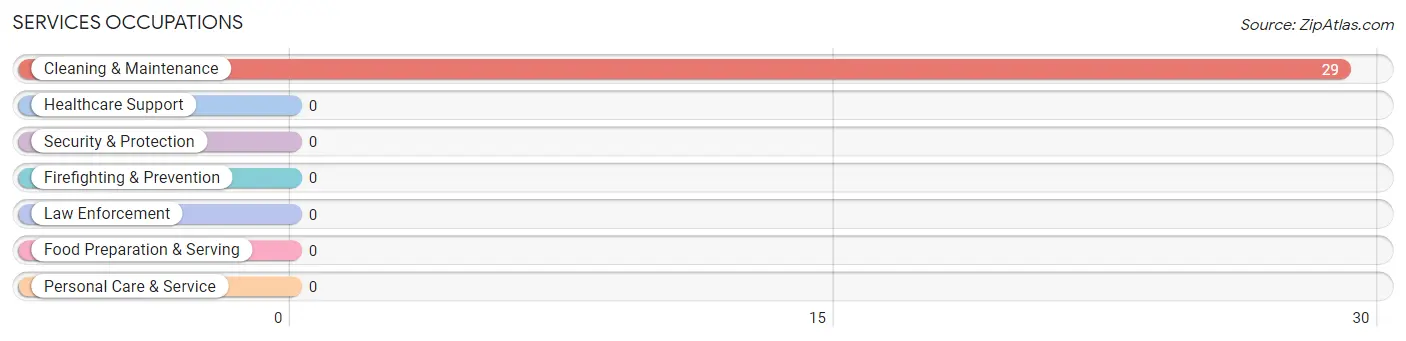
Services Occupations by Sex
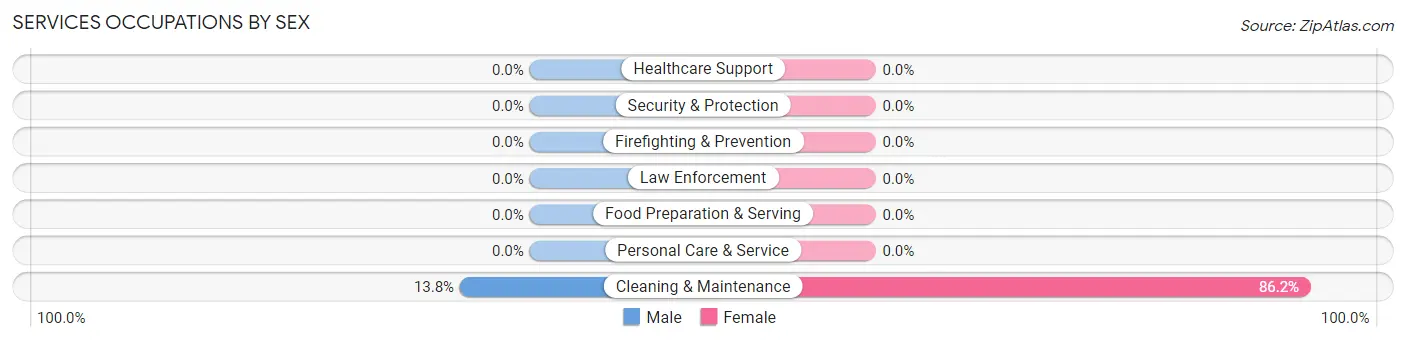
| Occupation | Male | Female |
| Healthcare Support | 0 (0.0%) | 0 (0.0%) |
| Security & Protection | 0 (0.0%) | 0 (0.0%) |
| Firefighting & Prevention | 0 (0.0%) | 0 (0.0%) |
| Law Enforcement | 0 (0.0%) | 0 (0.0%) |
| Food Preparation & Serving | 0 (0.0%) | 0 (0.0%) |
| Cleaning & Maintenance | 4 (13.8%) | 25 (86.2%) |
| Personal Care & Service | 0 (0.0%) | 0 (0.0%) |
| Total (Category) | 4 (13.8%) | 25 (86.2%) |
| Total (Overall) | 40 (48.2%) | 43 (51.8%) |
Sales and Office Occupations
The most common Sales and Office occupations in Lodoga are , and Office & Administration (2 | 2.4%).
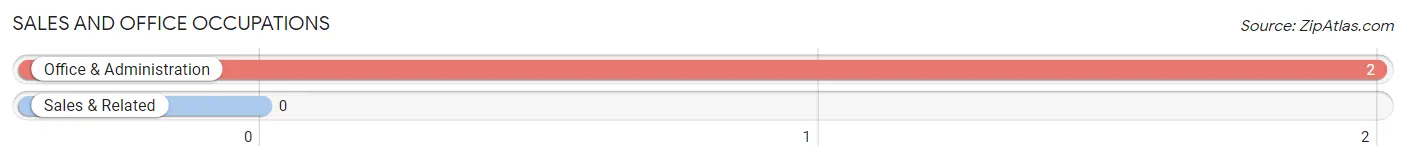
Sales and Office Occupations by Sex

| Occupation | Male | Female |
| Sales & Related | 0 (0.0%) | 0 (0.0%) |
| Office & Administration | 2 (100.0%) | 0 (0.0%) |
| Total (Category) | 2 (100.0%) | 0 (0.0%) |
| Total (Overall) | 40 (48.2%) | 43 (51.8%) |
Natural Resources, Construction and Maintenance Occupations
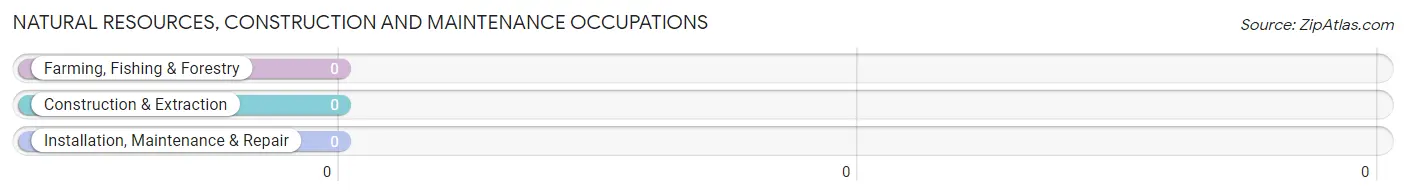
Natural Resources, Construction and Maintenance Occupations by Sex
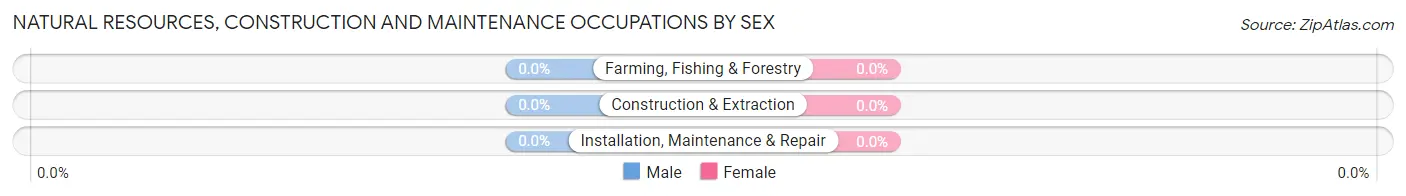
| Occupation | Male | Female |
| Farming, Fishing & Forestry | 0 (0.0%) | 0 (0.0%) |
| Construction & Extraction | 0 (0.0%) | 0 (0.0%) |
| Installation, Maintenance & Repair | 0 (0.0%) | 0 (0.0%) |
| Total (Category) | 0 (0.0%) | 0 (0.0%) |
| Total (Overall) | 40 (48.2%) | 43 (51.8%) |
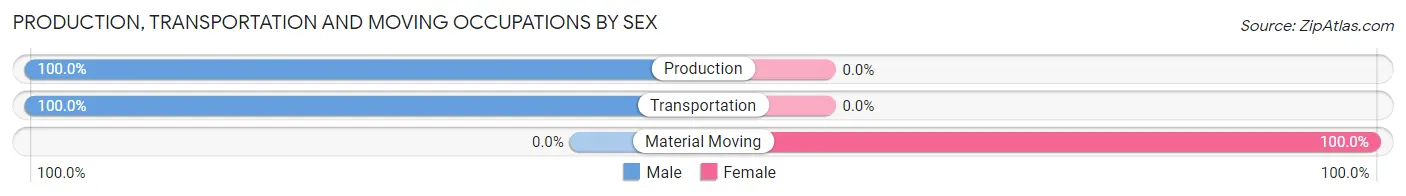
Production, Transportation and Moving Occupations
The most common Production, Transportation and Moving occupations in Lodoga are Production (33 | 39.8%), Material Moving (10 | 12.0%), and Transportation (1 | 1.2%).
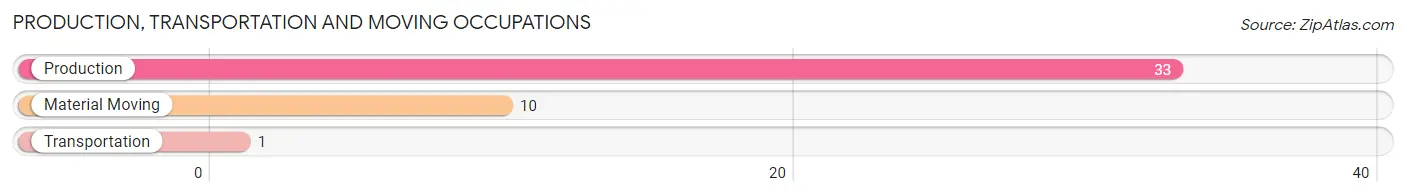
Production, Transportation and Moving Occupations by Sex
| Occupation | Male | Female |
| Production | 33 (100.0%) | 0 (0.0%) |
| Transportation | 1 (100.0%) | 0 (0.0%) |
| Material Moving | 0 (0.0%) | 10 (100.0%) |
| Total (Category) | 34 (77.3%) | 10 (22.7%) |
| Total (Overall) | 40 (48.2%) | 43 (51.8%) |
Employment Industries by Sex in Lodoga
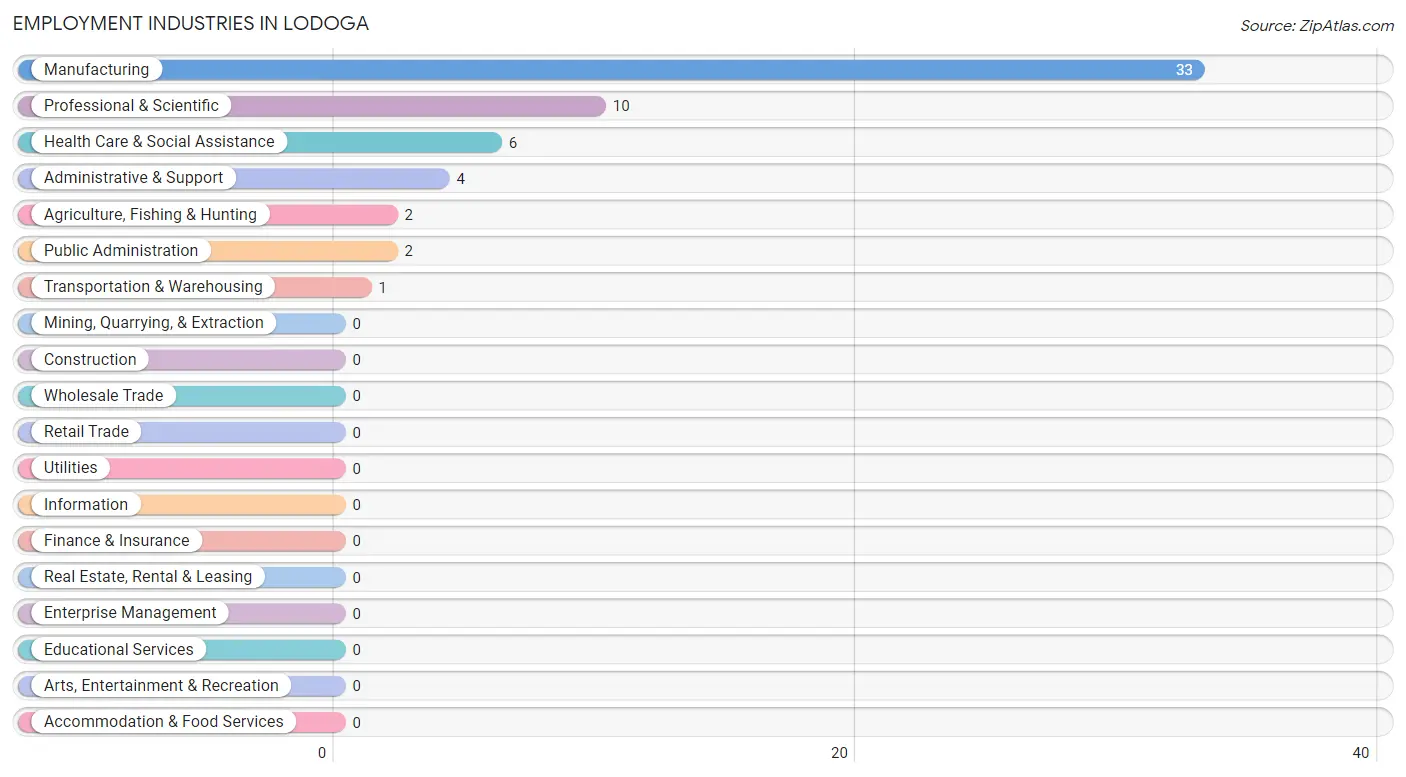
Employment Industries in Lodoga
The major employment industries in Lodoga include Manufacturing (33 | 39.8%), Professional & Scientific (10 | 12.0%), Health Care & Social Assistance (6 | 7.2%), Administrative & Support (4 | 4.8%), and Agriculture, Fishing & Hunting (2 | 2.4%).
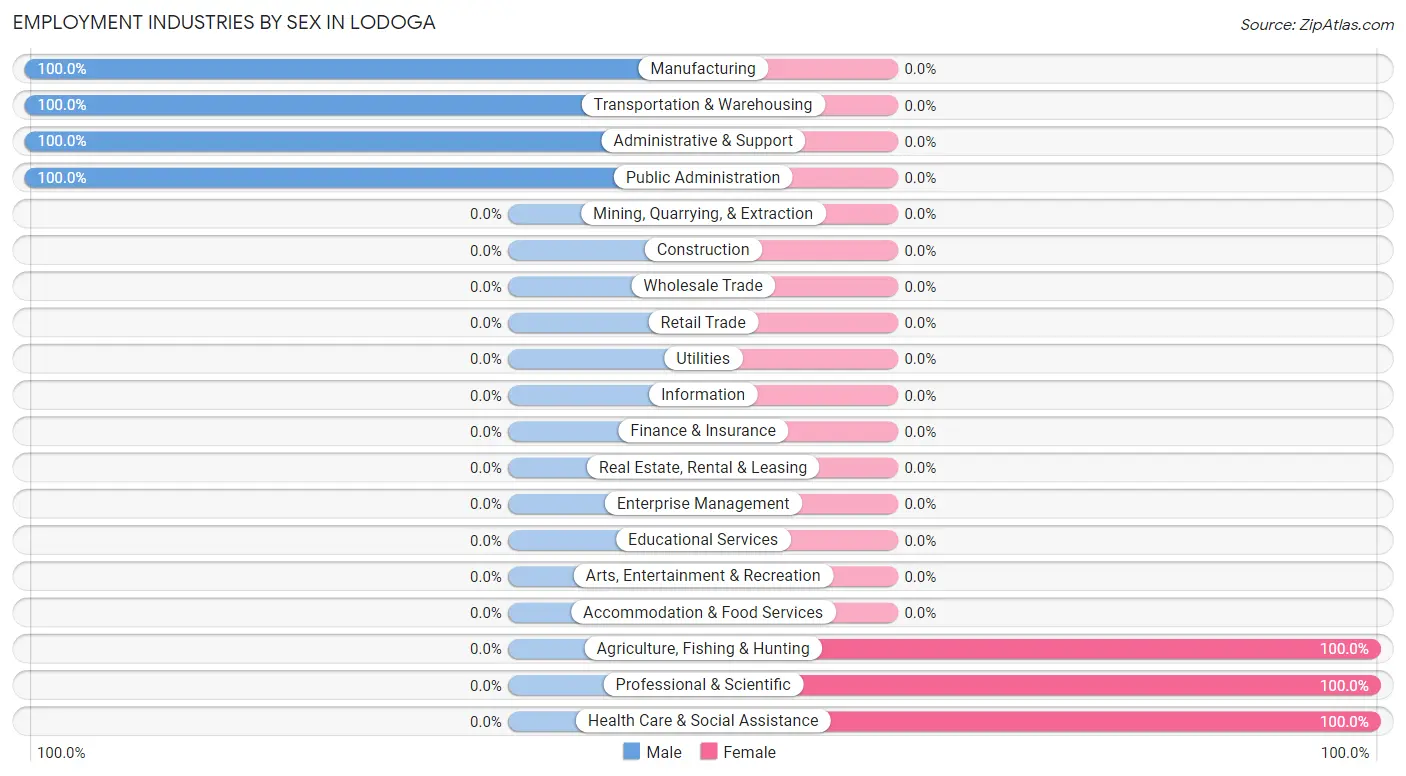
Employment Industries by Sex in Lodoga
The Lodoga industries that see more men than women are Manufacturing (100.0%), Transportation & Warehousing (100.0%), and Administrative & Support (100.0%), whereas the industries that tend to have a higher number of women are Agriculture, Fishing & Hunting (100.0%), Professional & Scientific (100.0%), and Health Care & Social Assistance (100.0%).
| Industry | Male | Female |
| Agriculture, Fishing & Hunting | 0 (0.0%) | 2 (100.0%) |
| Mining, Quarrying, & Extraction | 0 (0.0%) | 0 (0.0%) |
| Construction | 0 (0.0%) | 0 (0.0%) |
| Manufacturing | 33 (100.0%) | 0 (0.0%) |
| Wholesale Trade | 0 (0.0%) | 0 (0.0%) |
| Retail Trade | 0 (0.0%) | 0 (0.0%) |
| Transportation & Warehousing | 1 (100.0%) | 0 (0.0%) |
| Utilities | 0 (0.0%) | 0 (0.0%) |
| Information | 0 (0.0%) | 0 (0.0%) |
| Finance & Insurance | 0 (0.0%) | 0 (0.0%) |
| Real Estate, Rental & Leasing | 0 (0.0%) | 0 (0.0%) |
| Professional & Scientific | 0 (0.0%) | 10 (100.0%) |
| Enterprise Management | 0 (0.0%) | 0 (0.0%) |
| Administrative & Support | 4 (100.0%) | 0 (0.0%) |
| Educational Services | 0 (0.0%) | 0 (0.0%) |
| Health Care & Social Assistance | 0 (0.0%) | 6 (100.0%) |
| Arts, Entertainment & Recreation | 0 (0.0%) | 0 (0.0%) |
| Accommodation & Food Services | 0 (0.0%) | 0 (0.0%) |
| Public Administration | 2 (100.0%) | 0 (0.0%) |
| Total | 40 (48.2%) | 43 (51.8%) |
Education in Lodoga
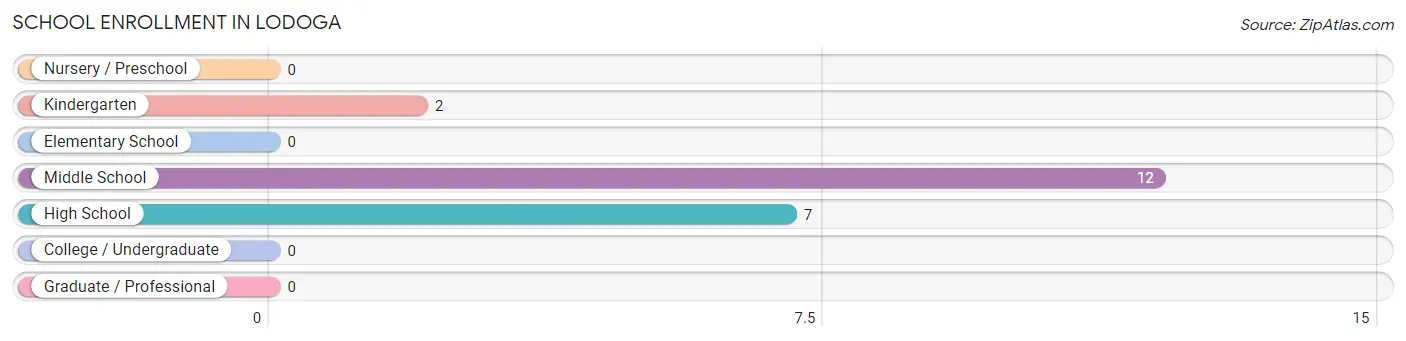
School Enrollment in Lodoga
The most common levels of schooling among the 21 students in Lodoga are middle school (12 | 57.1%), high school (7 | 33.3%), and kindergarten (2 | 9.5%).
| School Level | # Students | % Students |
| Nursery / Preschool | 0 | 0.0% |
| Kindergarten | 2 | 9.5% |
| Elementary School | 0 | 0.0% |
| Middle School | 12 | 57.1% |
| High School | 7 | 33.3% |
| College / Undergraduate | 0 | 0.0% |
| Graduate / Professional | 0 | 0.0% |
| Total | 21 | 100.0% |
School Enrollment by Age by Funding Source in Lodoga
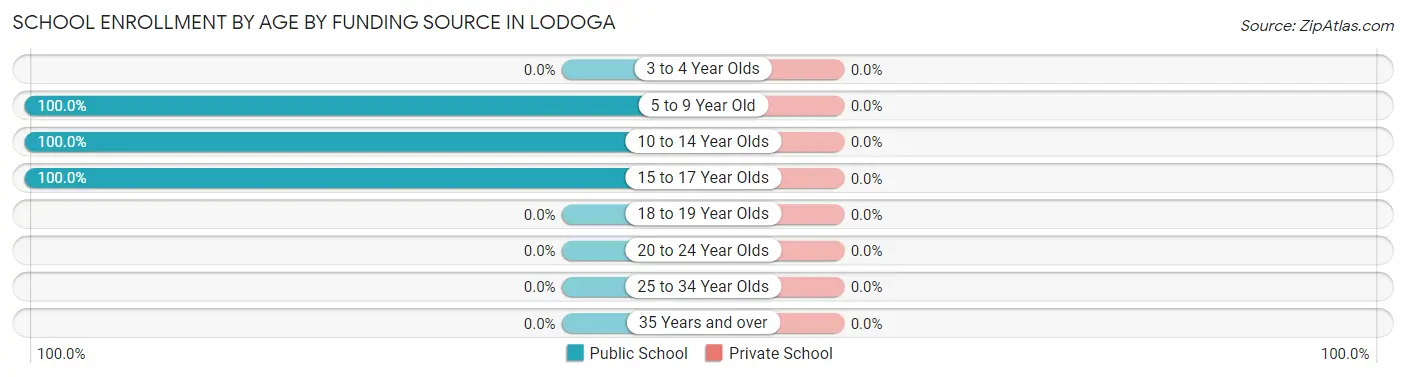
| Age Bracket | Public School | Private School |
| 3 to 4 Year Olds | 0 (0.0%) | 0 (0.0%) |
| 5 to 9 Year Old | 2 (100.0%) | 0 (0.0%) |
| 10 to 14 Year Olds | 12 (100.0%) | 0 (0.0%) |
| 15 to 17 Year Olds | 7 (100.0%) | 0 (0.0%) |
| 18 to 19 Year Olds | 0 (0.0%) | 0 (0.0%) |
| 20 to 24 Year Olds | 0 (0.0%) | 0 (0.0%) |
| 25 to 34 Year Olds | 0 (0.0%) | 0 (0.0%) |
| 35 Years and over | 0 (0.0%) | 0 (0.0%) |
| Total | 21 (100.0%) | 0 (0.0%) |
Educational Attainment by Field of Study in Lodoga
Literature & languages (7 | 46.7%), social sciences (4 | 26.7%), liberal arts & history (2 | 13.3%), and arts & humanities (2 | 13.3%) are the most common fields of study among 15 individuals in Lodoga who have obtained a bachelor's degree or higher.
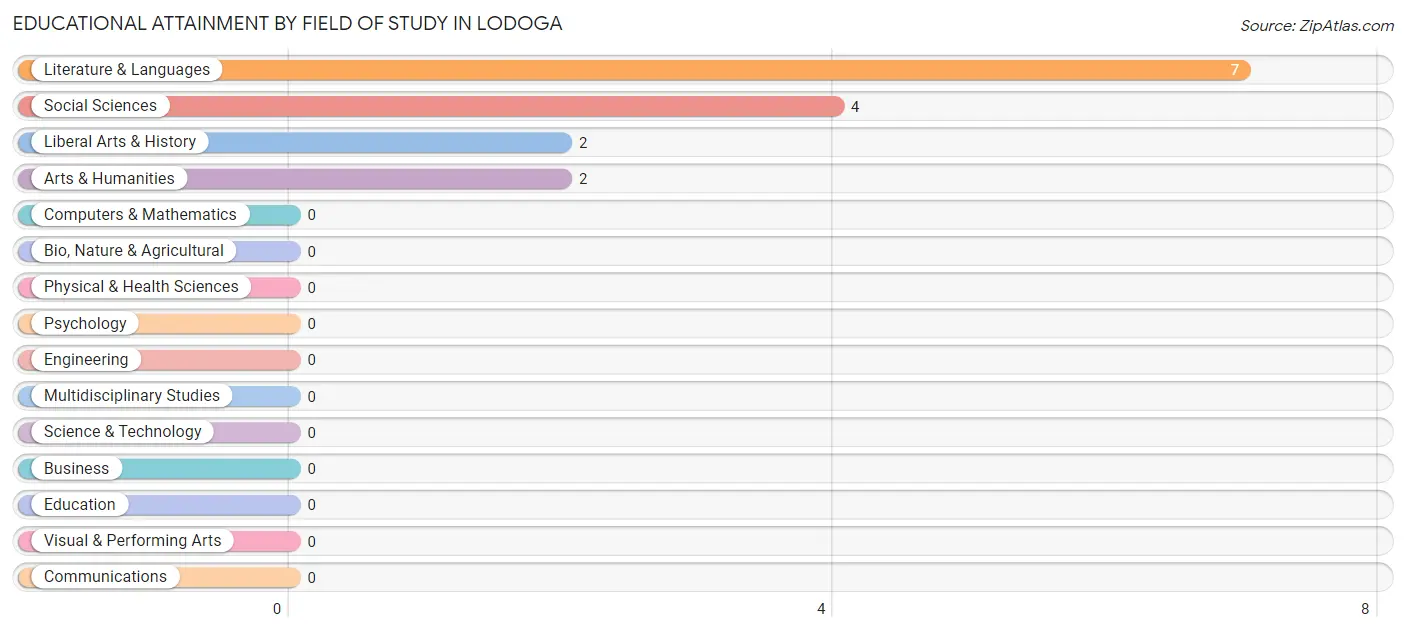
| Field of Study | # Graduates | % Graduates |
| Computers & Mathematics | 0 | 0.0% |
| Bio, Nature & Agricultural | 0 | 0.0% |
| Physical & Health Sciences | 0 | 0.0% |
| Psychology | 0 | 0.0% |
| Social Sciences | 4 | 26.7% |
| Engineering | 0 | 0.0% |
| Multidisciplinary Studies | 0 | 0.0% |
| Science & Technology | 0 | 0.0% |
| Business | 0 | 0.0% |
| Education | 0 | 0.0% |
| Literature & Languages | 7 | 46.7% |
| Liberal Arts & History | 2 | 13.3% |
| Visual & Performing Arts | 0 | 0.0% |
| Communications | 0 | 0.0% |
| Arts & Humanities | 2 | 13.3% |
| Total | 15 | 100.0% |
Transportation & Commute in Lodoga
Vehicle Availability by Sex in Lodoga
The most prevalent vehicle ownership categories in Lodoga are males with 2 vehicles (35, accounting for 87.5%) and females with 2 vehicles (4, making up 81.4%).
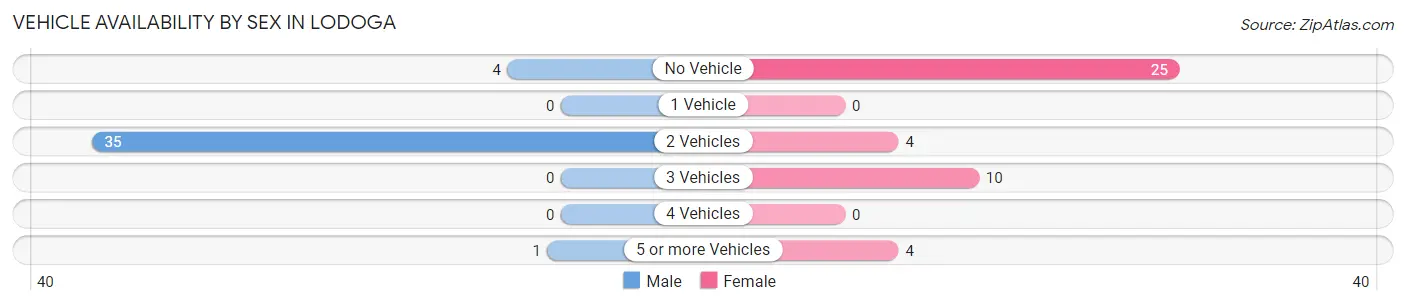
| Vehicles Available | Male | Female |
| No Vehicle | 4 (10.0%) | 25 (58.1%) |
| 1 Vehicle | 0 (0.0%) | 0 (0.0%) |
| 2 Vehicles | 35 (87.5%) | 4 (9.3%) |
| 3 Vehicles | 0 (0.0%) | 10 (23.3%) |
| 4 Vehicles | 0 (0.0%) | 0 (0.0%) |
| 5 or more Vehicles | 1 (2.5%) | 4 (9.3%) |
| Total | 40 (100.0%) | 43 (100.0%) |
Commute Time in Lodoga
The most frequently occuring commute durations in Lodoga are 60 to 89 minutes (43 commuters, 74.1%), 45 to 59 minutes (6 commuters, 10.3%), and less than 5 minutes (4 commuters, 6.9%).
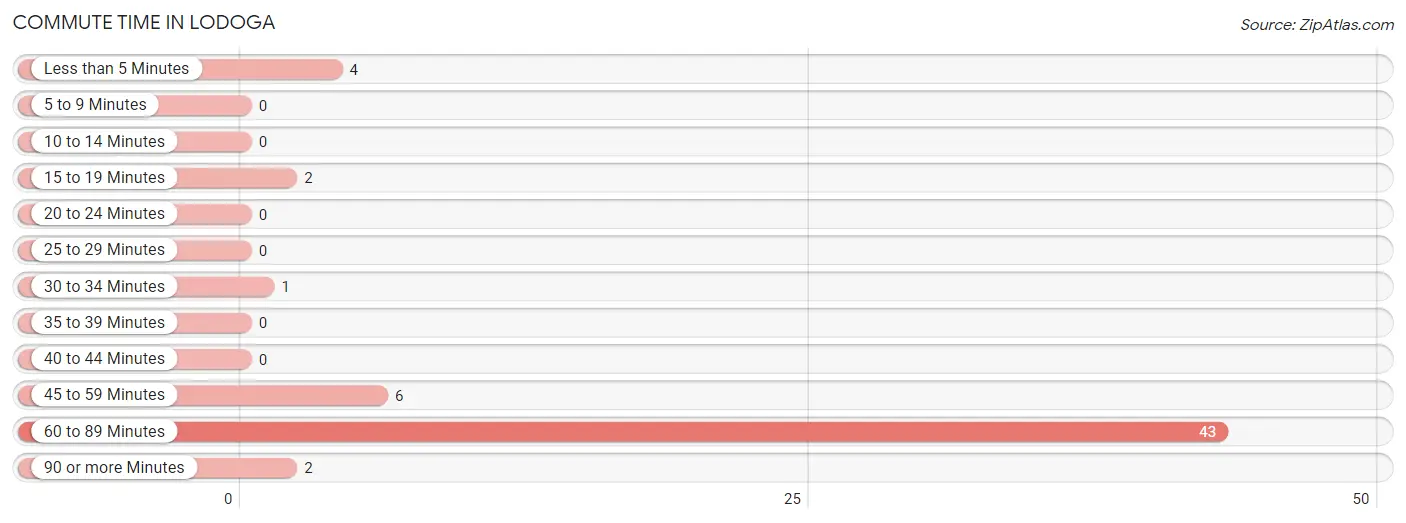
| Commute Time | # Commuters | % Commuters |
| Less than 5 Minutes | 4 | 6.9% |
| 5 to 9 Minutes | 0 | 0.0% |
| 10 to 14 Minutes | 0 | 0.0% |
| 15 to 19 Minutes | 2 | 3.5% |
| 20 to 24 Minutes | 0 | 0.0% |
| 25 to 29 Minutes | 0 | 0.0% |
| 30 to 34 Minutes | 1 | 1.7% |
| 35 to 39 Minutes | 0 | 0.0% |
| 40 to 44 Minutes | 0 | 0.0% |
| 45 to 59 Minutes | 6 | 10.3% |
| 60 to 89 Minutes | 43 | 74.1% |
| 90 or more Minutes | 2 | 3.5% |
Commute Time by Sex in Lodoga
The most common commute times in Lodoga are 60 to 89 minutes (33 commuters, 82.5%) for males and 60 to 89 minutes (10 commuters, 55.6%) for females.
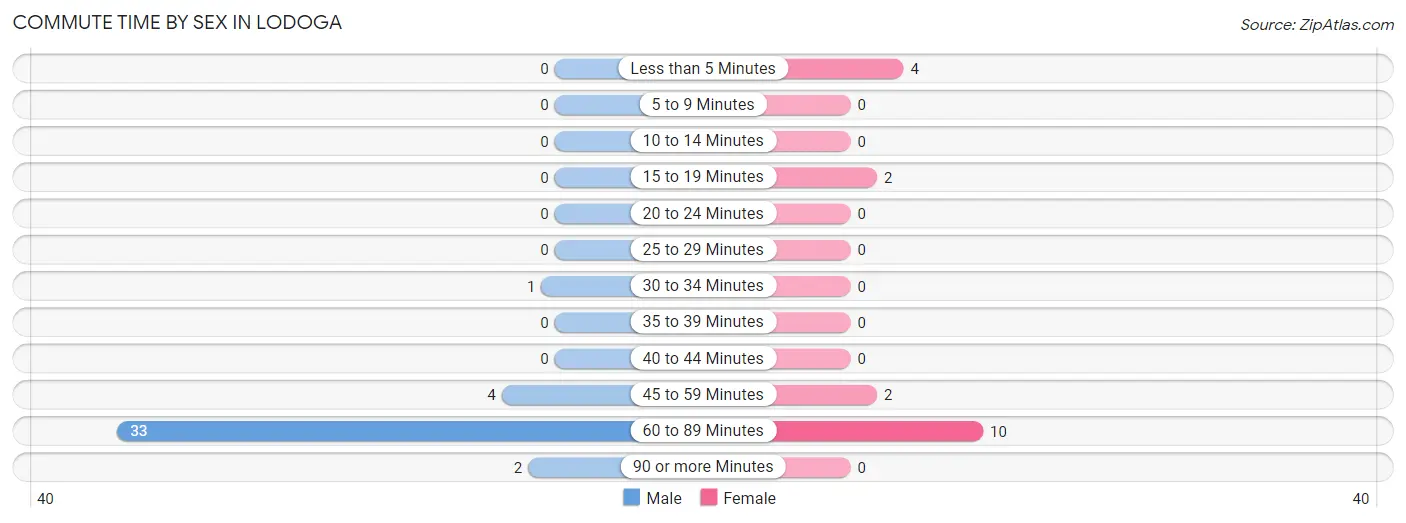
| Commute Time | Male | Female |
| Less than 5 Minutes | 0 (0.0%) | 4 (22.2%) |
| 5 to 9 Minutes | 0 (0.0%) | 0 (0.0%) |
| 10 to 14 Minutes | 0 (0.0%) | 0 (0.0%) |
| 15 to 19 Minutes | 0 (0.0%) | 2 (11.1%) |
| 20 to 24 Minutes | 0 (0.0%) | 0 (0.0%) |
| 25 to 29 Minutes | 0 (0.0%) | 0 (0.0%) |
| 30 to 34 Minutes | 1 (2.5%) | 0 (0.0%) |
| 35 to 39 Minutes | 0 (0.0%) | 0 (0.0%) |
| 40 to 44 Minutes | 0 (0.0%) | 0 (0.0%) |
| 45 to 59 Minutes | 4 (10.0%) | 2 (11.1%) |
| 60 to 89 Minutes | 33 (82.5%) | 10 (55.6%) |
| 90 or more Minutes | 2 (5.0%) | 0 (0.0%) |
Time of Departure to Work by Sex in Lodoga
The most frequent times of departure to work in Lodoga are 5:00 AM to 5:29 AM (33, 82.5%) for males and 7:00 AM to 7:29 AM (10, 55.6%) for females.
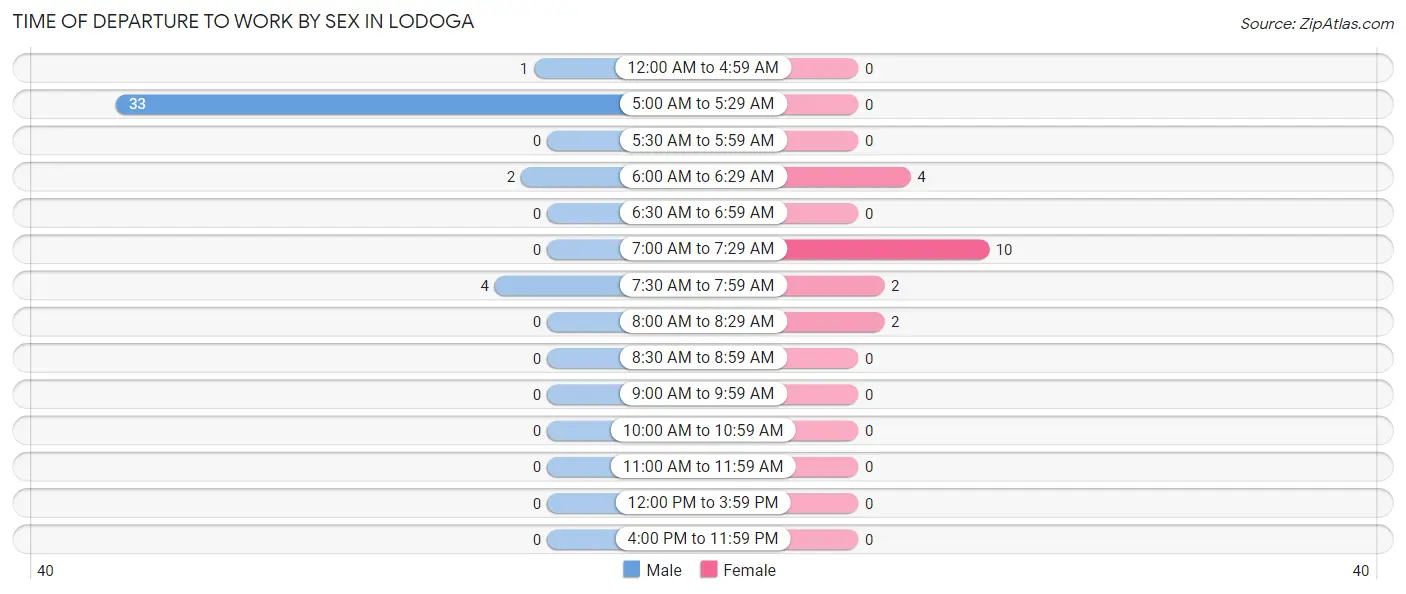
| Time of Departure | Male | Female |
| 12:00 AM to 4:59 AM | 1 (2.5%) | 0 (0.0%) |
| 5:00 AM to 5:29 AM | 33 (82.5%) | 0 (0.0%) |
| 5:30 AM to 5:59 AM | 0 (0.0%) | 0 (0.0%) |
| 6:00 AM to 6:29 AM | 2 (5.0%) | 4 (22.2%) |
| 6:30 AM to 6:59 AM | 0 (0.0%) | 0 (0.0%) |
| 7:00 AM to 7:29 AM | 0 (0.0%) | 10 (55.6%) |
| 7:30 AM to 7:59 AM | 4 (10.0%) | 2 (11.1%) |
| 8:00 AM to 8:29 AM | 0 (0.0%) | 2 (11.1%) |
| 8:30 AM to 8:59 AM | 0 (0.0%) | 0 (0.0%) |
| 9:00 AM to 9:59 AM | 0 (0.0%) | 0 (0.0%) |
| 10:00 AM to 10:59 AM | 0 (0.0%) | 0 (0.0%) |
| 11:00 AM to 11:59 AM | 0 (0.0%) | 0 (0.0%) |
| 12:00 PM to 3:59 PM | 0 (0.0%) | 0 (0.0%) |
| 4:00 PM to 11:59 PM | 0 (0.0%) | 0 (0.0%) |
| Total | 40 (100.0%) | 18 (100.0%) |
Housing Occupancy in Lodoga
Occupancy by Ownership in Lodoga
Of the total 82 dwellings in Lodoga, owner-occupied units account for 54 (65.8%), while renter-occupied units make up 28 (34.2%).
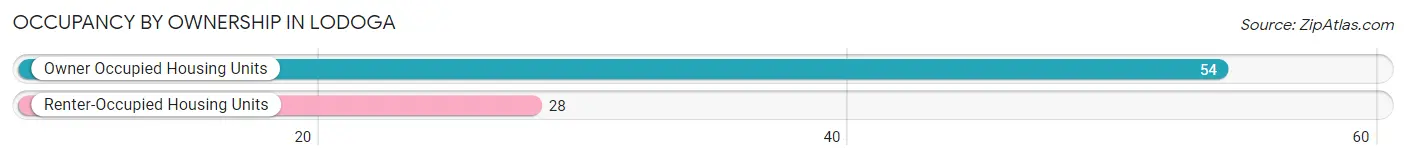
| Occupancy | # Housing Units | % Housing Units |
| Owner Occupied Housing Units | 54 | 65.8% |
| Renter-Occupied Housing Units | 28 | 34.2% |
| Total Occupied Housing Units | 82 | 100.0% |
Occupancy by Household Size in Lodoga
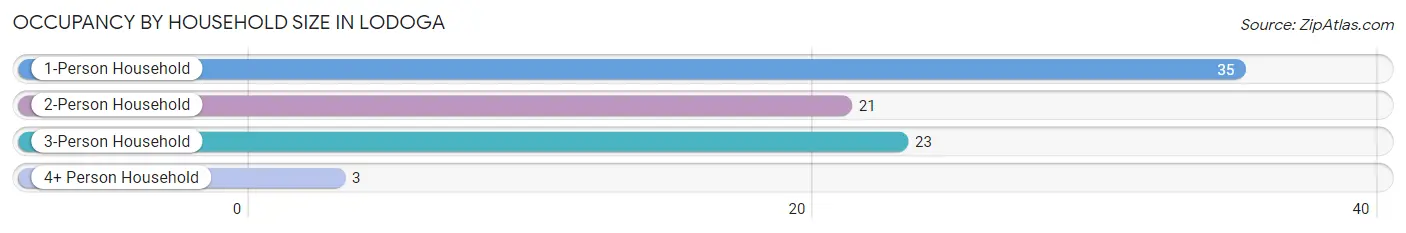
| Household Size | # Housing Units | % Housing Units |
| 1-Person Household | 35 | 42.7% |
| 2-Person Household | 21 | 25.6% |
| 3-Person Household | 23 | 28.1% |
| 4+ Person Household | 3 | 3.7% |
| Total Housing Units | 82 | 100.0% |
Occupancy by Ownership by Household Size in Lodoga
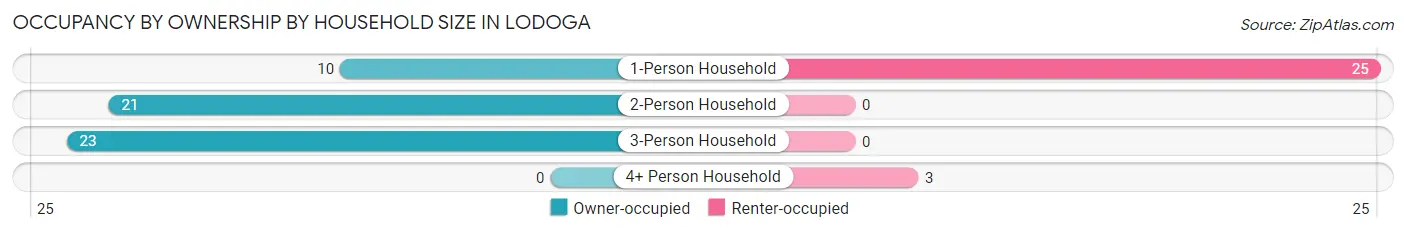
| Household Size | Owner-occupied | Renter-occupied |
| 1-Person Household | 10 (28.6%) | 25 (71.4%) |
| 2-Person Household | 21 (100.0%) | 0 (0.0%) |
| 3-Person Household | 23 (100.0%) | 0 (0.0%) |
| 4+ Person Household | 0 (0.0%) | 3 (100.0%) |
| Total Housing Units | 54 (65.8%) | 28 (34.2%) |
Occupancy by Educational Attainment in Lodoga
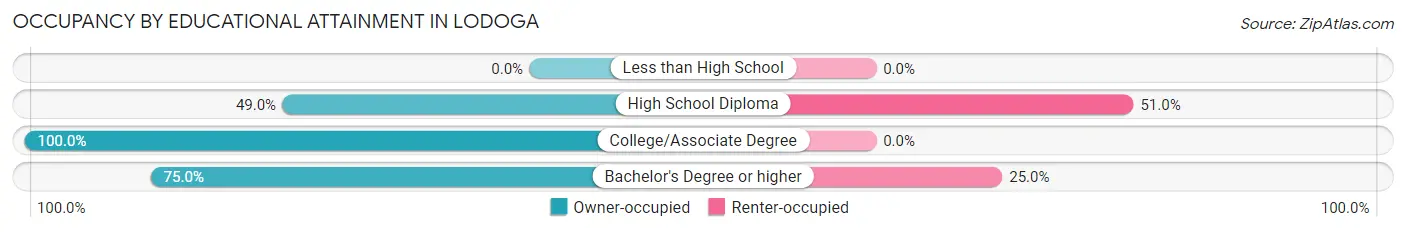
| Household Size | Owner-occupied | Renter-occupied |
| Less than High School | 0 (0.0%) | 0 (0.0%) |
| High School Diploma | 24 (49.0%) | 25 (51.0%) |
| College/Associate Degree | 21 (100.0%) | 0 (0.0%) |
| Bachelor's Degree or higher | 9 (75.0%) | 3 (25.0%) |
Occupancy by Age of Householder in Lodoga
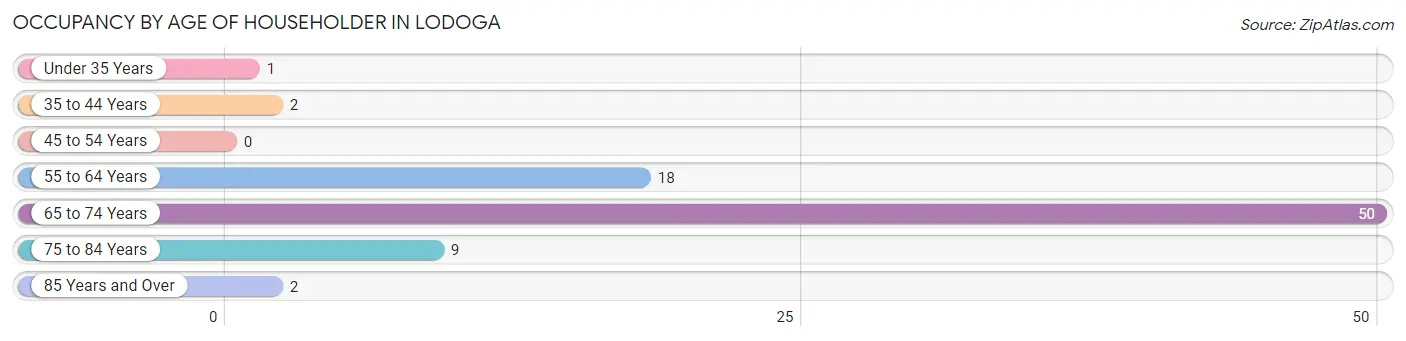
| Age Bracket | # Households | % Households |
| Under 35 Years | 1 | 1.2% |
| 35 to 44 Years | 2 | 2.4% |
| 45 to 54 Years | 0 | 0.0% |
| 55 to 64 Years | 18 | 22.0% |
| 65 to 74 Years | 50 | 61.0% |
| 75 to 84 Years | 9 | 11.0% |
| 85 Years and Over | 2 | 2.4% |
| Total | 82 | 100.0% |
Housing Finances in Lodoga
Median Income by Occupancy in Lodoga
| Occupancy Type | # Households | Median Income |
| Owner-Occupied | 54 (65.8%) | $0 |
| Renter-Occupied | 28 (34.2%) | $0 |
| Average | 82 (100.0%) | $0 |
Occupancy by Householder Income Bracket in Lodoga
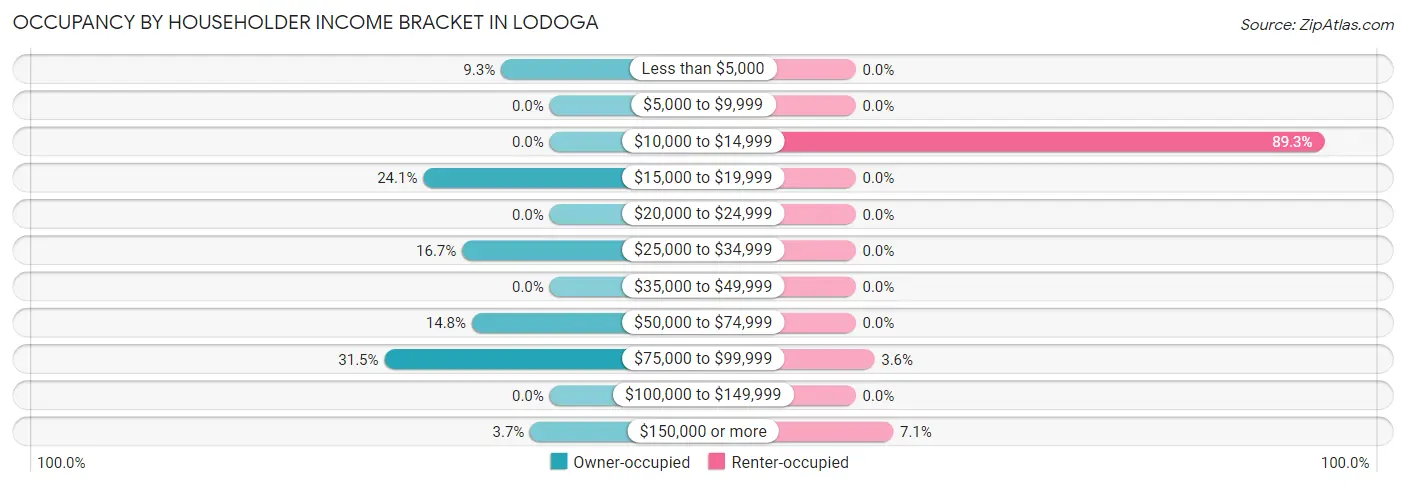
| Income Bracket | Owner-occupied | Renter-occupied |
| Less than $5,000 | 5 (9.3%) | 0 (0.0%) |
| $5,000 to $9,999 | 0 (0.0%) | 0 (0.0%) |
| $10,000 to $14,999 | 0 (0.0%) | 25 (89.3%) |
| $15,000 to $19,999 | 13 (24.1%) | 0 (0.0%) |
| $20,000 to $24,999 | 0 (0.0%) | 0 (0.0%) |
| $25,000 to $34,999 | 9 (16.7%) | 0 (0.0%) |
| $35,000 to $49,999 | 0 (0.0%) | 0 (0.0%) |
| $50,000 to $74,999 | 8 (14.8%) | 0 (0.0%) |
| $75,000 to $99,999 | 17 (31.5%) | 1 (3.6%) |
| $100,000 to $149,999 | 0 (0.0%) | 0 (0.0%) |
| $150,000 or more | 2 (3.7%) | 2 (7.1%) |
| Total | 54 (100.0%) | 28 (100.0%) |
Monthly Housing Cost Tiers in Lodoga
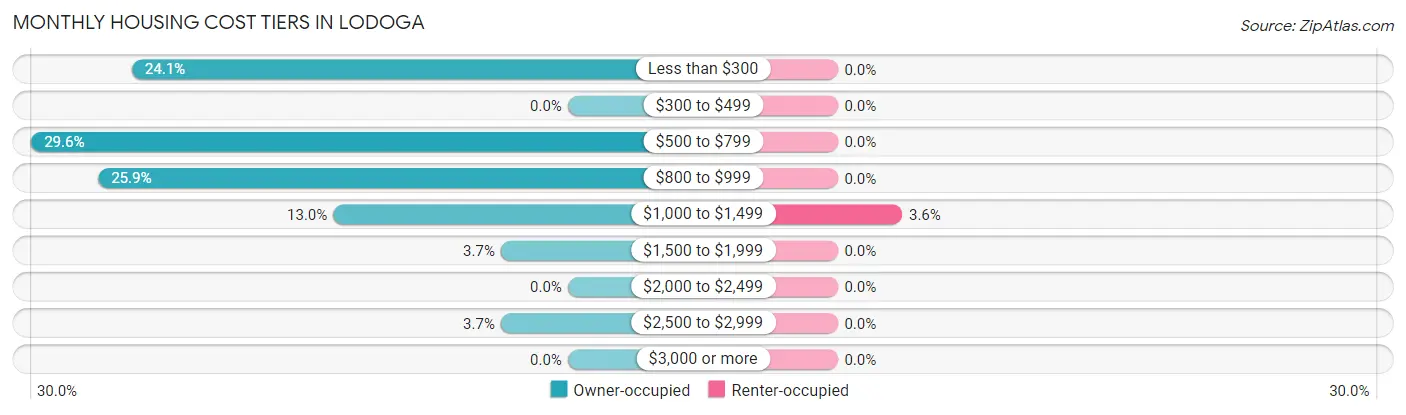
| Monthly Cost | Owner-occupied | Renter-occupied |
| Less than $300 | 13 (24.1%) | 0 (0.0%) |
| $300 to $499 | 0 (0.0%) | 0 (0.0%) |
| $500 to $799 | 16 (29.6%) | 0 (0.0%) |
| $800 to $999 | 14 (25.9%) | 0 (0.0%) |
| $1,000 to $1,499 | 7 (13.0%) | 1 (3.6%) |
| $1,500 to $1,999 | 2 (3.7%) | 0 (0.0%) |
| $2,000 to $2,499 | 0 (0.0%) | 0 (0.0%) |
| $2,500 to $2,999 | 2 (3.7%) | 0 (0.0%) |
| $3,000 or more | 0 (0.0%) | 0 (0.0%) |
| Total | 54 (100.0%) | 28 (100.0%) |
Physical Housing Characteristics in Lodoga
Housing Structures in Lodoga
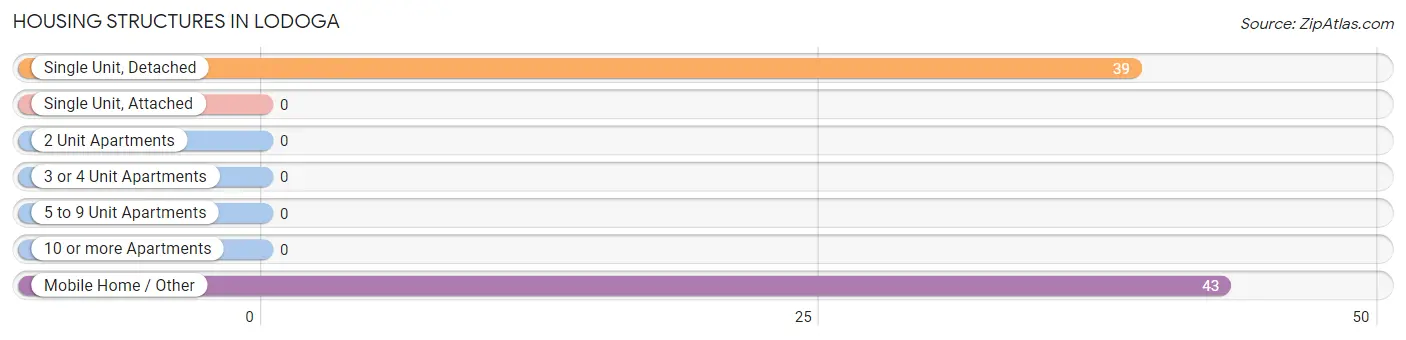
| Structure Type | # Housing Units | % Housing Units |
| Single Unit, Detached | 39 | 47.6% |
| Single Unit, Attached | 0 | 0.0% |
| 2 Unit Apartments | 0 | 0.0% |
| 3 or 4 Unit Apartments | 0 | 0.0% |
| 5 to 9 Unit Apartments | 0 | 0.0% |
| 10 or more Apartments | 0 | 0.0% |
| Mobile Home / Other | 43 | 52.4% |
| Total | 82 | 100.0% |
Housing Structures by Occupancy in Lodoga
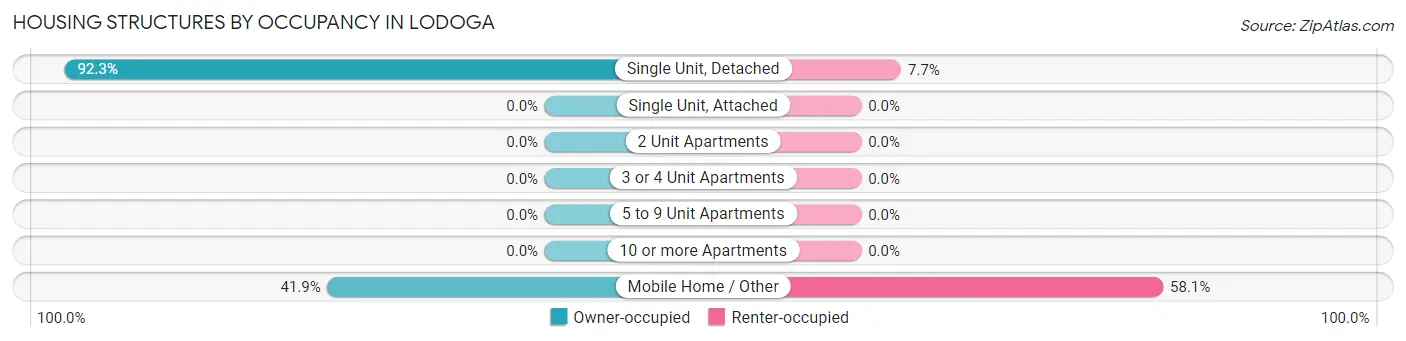
| Structure Type | Owner-occupied | Renter-occupied |
| Single Unit, Detached | 36 (92.3%) | 3 (7.7%) |
| Single Unit, Attached | 0 (0.0%) | 0 (0.0%) |
| 2 Unit Apartments | 0 (0.0%) | 0 (0.0%) |
| 3 or 4 Unit Apartments | 0 (0.0%) | 0 (0.0%) |
| 5 to 9 Unit Apartments | 0 (0.0%) | 0 (0.0%) |
| 10 or more Apartments | 0 (0.0%) | 0 (0.0%) |
| Mobile Home / Other | 18 (41.9%) | 25 (58.1%) |
| Total | 54 (65.8%) | 28 (34.2%) |
Housing Structures by Number of Rooms in Lodoga
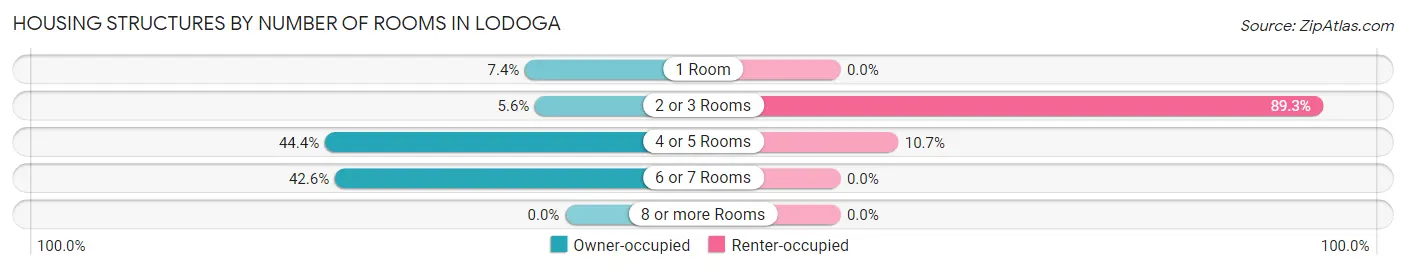
| Number of Rooms | Owner-occupied | Renter-occupied |
| 1 Room | 4 (7.4%) | 0 (0.0%) |
| 2 or 3 Rooms | 3 (5.6%) | 25 (89.3%) |
| 4 or 5 Rooms | 24 (44.4%) | 3 (10.7%) |
| 6 or 7 Rooms | 23 (42.6%) | 0 (0.0%) |
| 8 or more Rooms | 0 (0.0%) | 0 (0.0%) |
| Total | 54 (100.0%) | 28 (100.0%) |
Housing Structure by Heating Type in Lodoga
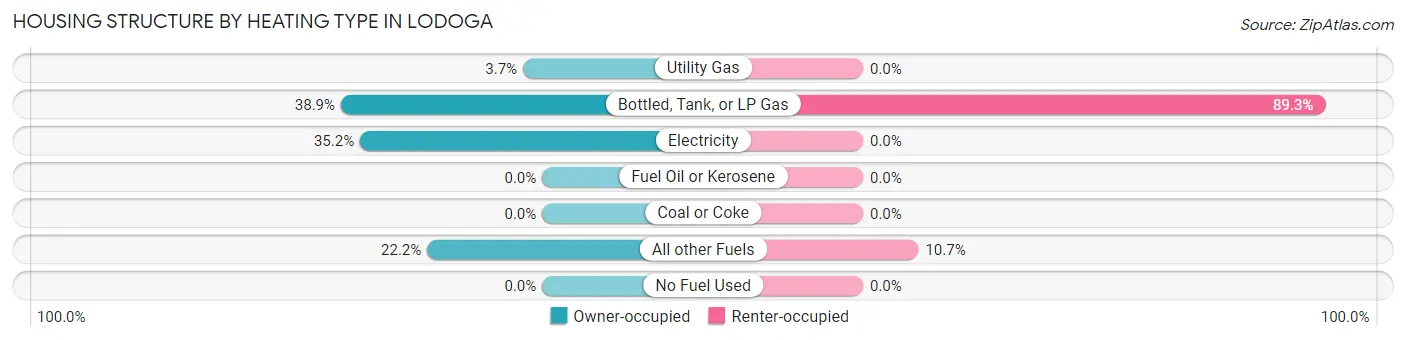
| Heating Type | Owner-occupied | Renter-occupied |
| Utility Gas | 2 (3.7%) | 0 (0.0%) |
| Bottled, Tank, or LP Gas | 21 (38.9%) | 25 (89.3%) |
| Electricity | 19 (35.2%) | 0 (0.0%) |
| Fuel Oil or Kerosene | 0 (0.0%) | 0 (0.0%) |
| Coal or Coke | 0 (0.0%) | 0 (0.0%) |
| All other Fuels | 12 (22.2%) | 3 (10.7%) |
| No Fuel Used | 0 (0.0%) | 0 (0.0%) |
| Total | 54 (100.0%) | 28 (100.0%) |
Household Vehicle Usage in Lodoga
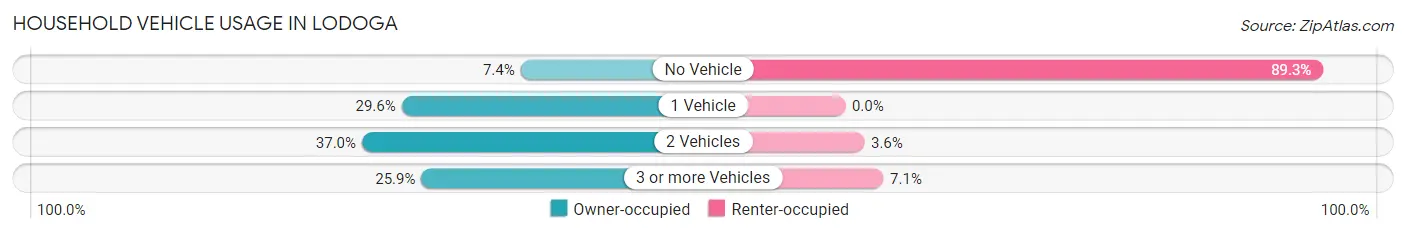
| Vehicles per Household | Owner-occupied | Renter-occupied |
| No Vehicle | 4 (7.4%) | 25 (89.3%) |
| 1 Vehicle | 16 (29.6%) | 0 (0.0%) |
| 2 Vehicles | 20 (37.0%) | 1 (3.6%) |
| 3 or more Vehicles | 14 (25.9%) | 2 (7.1%) |
| Total | 54 (100.0%) | 28 (100.0%) |
Real Estate & Mortgages in Lodoga
Real Estate and Mortgage Overview in Lodoga
| Characteristic | Without Mortgage | With Mortgage |
| Housing Units | 28 | 26 |
| Median Property Value | $162,500 | $230,000 |
| Median Household Income | - | - |
| Monthly Housing Costs | $509 | $0 |
| Real Estate Taxes | - | - |
Property Value by Mortgage Status in Lodoga
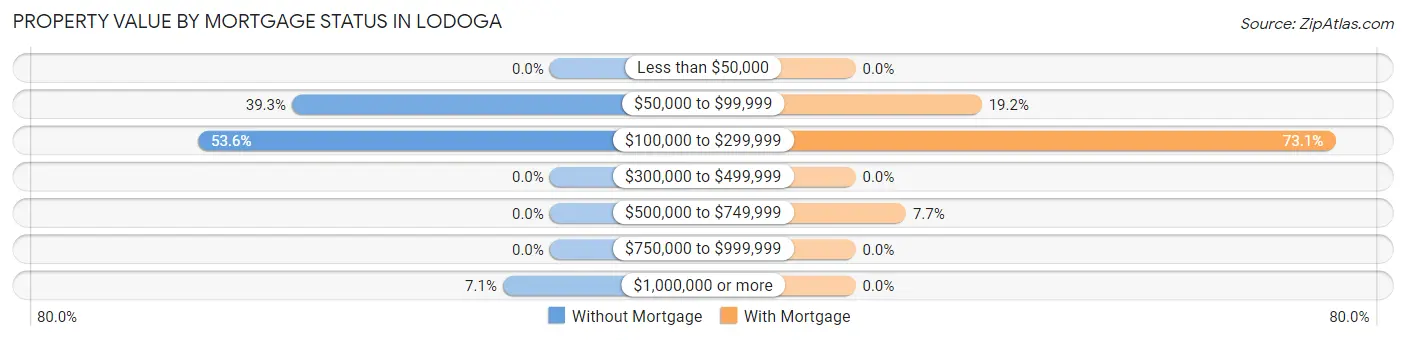
| Property Value | Without Mortgage | With Mortgage |
| Less than $50,000 | 0 (0.0%) | 0 (0.0%) |
| $50,000 to $99,999 | 11 (39.3%) | 5 (19.2%) |
| $100,000 to $299,999 | 15 (53.6%) | 19 (73.1%) |
| $300,000 to $499,999 | 0 (0.0%) | 0 (0.0%) |
| $500,000 to $749,999 | 0 (0.0%) | 2 (7.7%) |
| $750,000 to $999,999 | 0 (0.0%) | 0 (0.0%) |
| $1,000,000 or more | 2 (7.1%) | 0 (0.0%) |
| Total | 28 (100.0%) | 26 (100.0%) |
Household Income by Mortgage Status in Lodoga
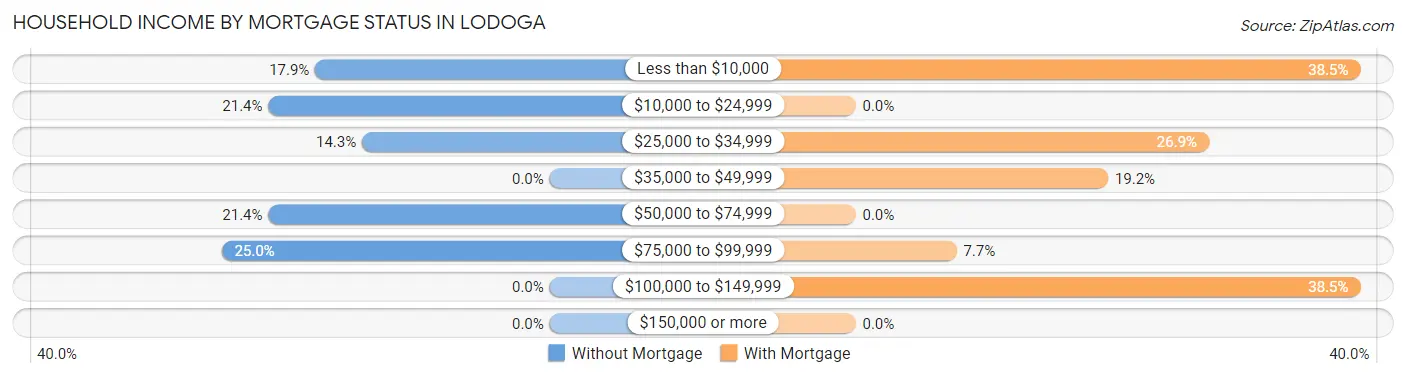
| Household Income | Without Mortgage | With Mortgage |
| Less than $10,000 | 5 (17.9%) | 10 (38.5%) |
| $10,000 to $24,999 | 6 (21.4%) | 0 (0.0%) |
| $25,000 to $34,999 | 4 (14.3%) | 7 (26.9%) |
| $35,000 to $49,999 | 0 (0.0%) | 5 (19.2%) |
| $50,000 to $74,999 | 6 (21.4%) | 0 (0.0%) |
| $75,000 to $99,999 | 7 (25.0%) | 2 (7.7%) |
| $100,000 to $149,999 | 0 (0.0%) | 10 (38.5%) |
| $150,000 or more | 0 (0.0%) | 0 (0.0%) |
| Total | 28 (100.0%) | 26 (100.0%) |
Property Value to Household Income Ratio in Lodoga
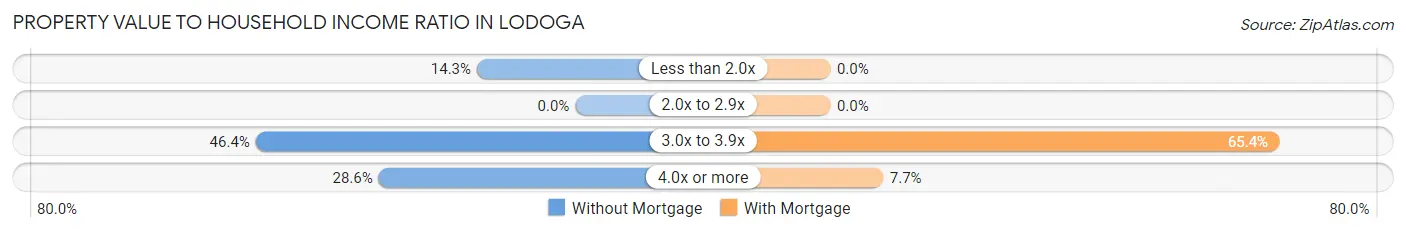
| Value-to-Income Ratio | Without Mortgage | With Mortgage |
| Less than 2.0x | 4 (14.3%) | 0 (0.0%) |
| 2.0x to 2.9x | 0 (0.0%) | 0 (0.0%) |
| 3.0x to 3.9x | 13 (46.4%) | 17 (65.4%) |
| 4.0x or more | 8 (28.6%) | 2 (7.7%) |
| Total | 28 (100.0%) | 26 (100.0%) |
Real Estate Taxes by Mortgage Status in Lodoga
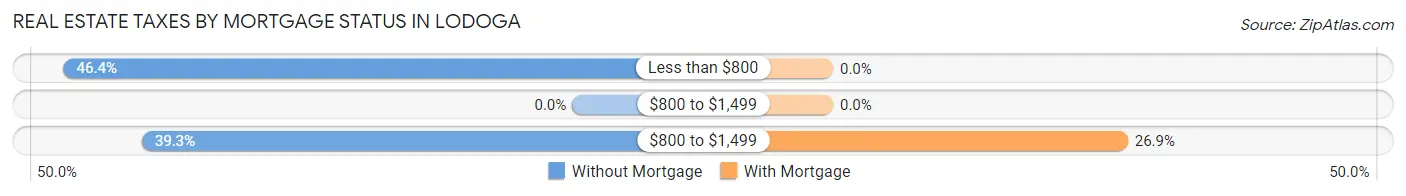
| Property Taxes | Without Mortgage | With Mortgage |
| Less than $800 | 13 (46.4%) | 0 (0.0%) |
| $800 to $1,499 | 0 (0.0%) | 0 (0.0%) |
| $800 to $1,499 | 11 (39.3%) | 7 (26.9%) |
| Total | 28 (100.0%) | 26 (100.0%) |
Health & Disability in Lodoga
Health Insurance Coverage by Age in Lodoga
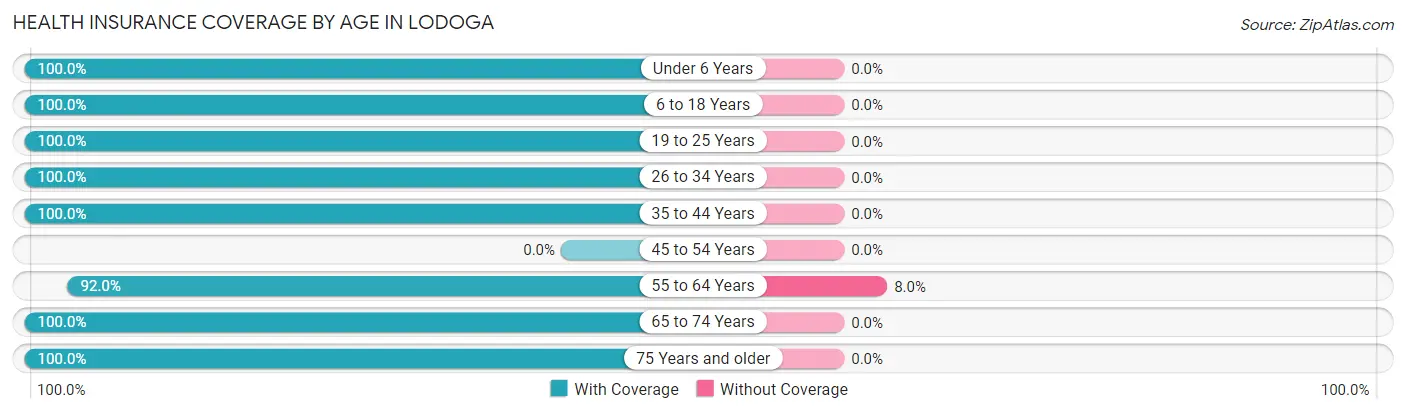
| Age Bracket | With Coverage | Without Coverage |
| Under 6 Years | 4 (100.0%) | 0 (0.0%) |
| 6 to 18 Years | 19 (100.0%) | 0 (0.0%) |
| 19 to 25 Years | 42 (100.0%) | 0 (0.0%) |
| 26 to 34 Years | 2 (100.0%) | 0 (0.0%) |
| 35 to 44 Years | 26 (100.0%) | 0 (0.0%) |
| 45 to 54 Years | 0 (0.0%) | 0 (0.0%) |
| 55 to 64 Years | 23 (92.0%) | 2 (8.0%) |
| 65 to 74 Years | 70 (100.0%) | 0 (0.0%) |
| 75 Years and older | 13 (100.0%) | 0 (0.0%) |
| Total | 199 (99.0%) | 2 (1.0%) |
Health Insurance Coverage by Citizenship Status in Lodoga
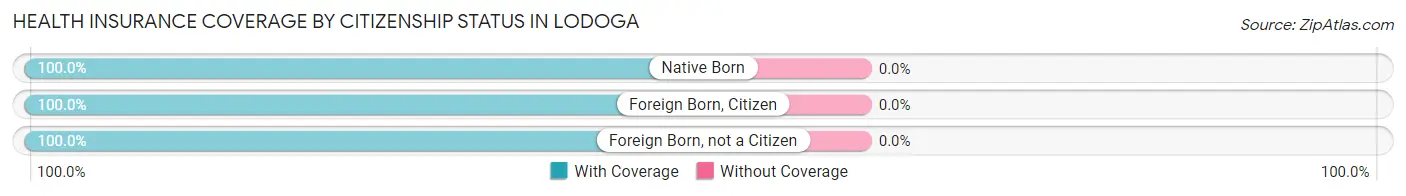
| Citizenship Status | With Coverage | Without Coverage |
| Native Born | 4 (100.0%) | 0 (0.0%) |
| Foreign Born, Citizen | 19 (100.0%) | 0 (0.0%) |
| Foreign Born, not a Citizen | 42 (100.0%) | 0 (0.0%) |
Health Insurance Coverage by Household Income in Lodoga
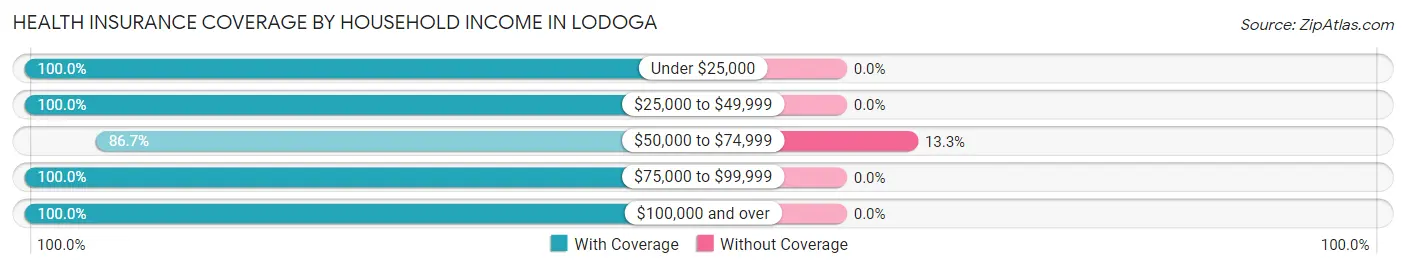
| Household Income | With Coverage | Without Coverage |
| Under $25,000 | 81 (100.0%) | 0 (0.0%) |
| $25,000 to $49,999 | 14 (100.0%) | 0 (0.0%) |
| $50,000 to $74,999 | 13 (86.7%) | 2 (13.3%) |
| $75,000 to $99,999 | 78 (100.0%) | 0 (0.0%) |
| $100,000 and over | 13 (100.0%) | 0 (0.0%) |
Public vs Private Health Insurance Coverage by Age in Lodoga
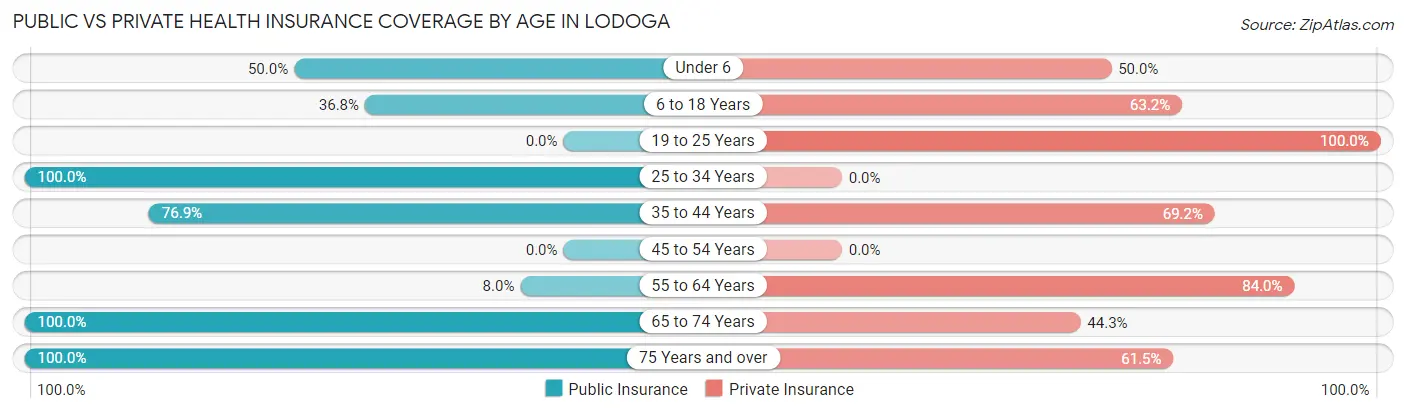
| Age Bracket | Public Insurance | Private Insurance |
| Under 6 | 2 (50.0%) | 2 (50.0%) |
| 6 to 18 Years | 7 (36.8%) | 12 (63.2%) |
| 19 to 25 Years | 0 (0.0%) | 42 (100.0%) |
| 25 to 34 Years | 2 (100.0%) | 0 (0.0%) |
| 35 to 44 Years | 20 (76.9%) | 18 (69.2%) |
| 45 to 54 Years | 0 (0.0%) | 0 (0.0%) |
| 55 to 64 Years | 2 (8.0%) | 21 (84.0%) |
| 65 to 74 Years | 70 (100.0%) | 31 (44.3%) |
| 75 Years and over | 13 (100.0%) | 8 (61.5%) |
| Total | 116 (57.7%) | 134 (66.7%) |
Disability Status by Sex by Age in Lodoga
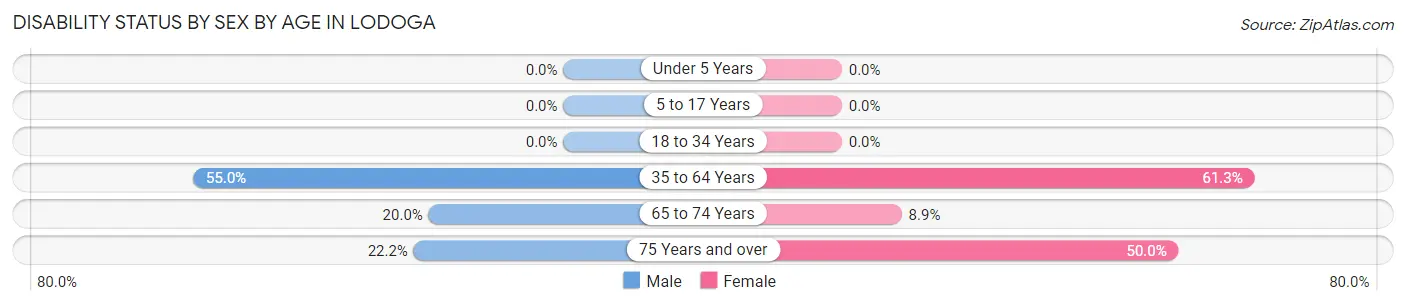
| Age Bracket | Male | Female |
| Under 5 Years | 0 (0.0%) | 0 (0.0%) |
| 5 to 17 Years | 0 (0.0%) | 0 (0.0%) |
| 18 to 34 Years | 0 (0.0%) | 0 (0.0%) |
| 35 to 64 Years | 11 (55.0%) | 19 (61.3%) |
| 65 to 74 Years | 5 (20.0%) | 4 (8.9%) |
| 75 Years and over | 2 (22.2%) | 2 (50.0%) |
Disability Class by Sex by Age in Lodoga
Disability Class: Hearing Difficulty
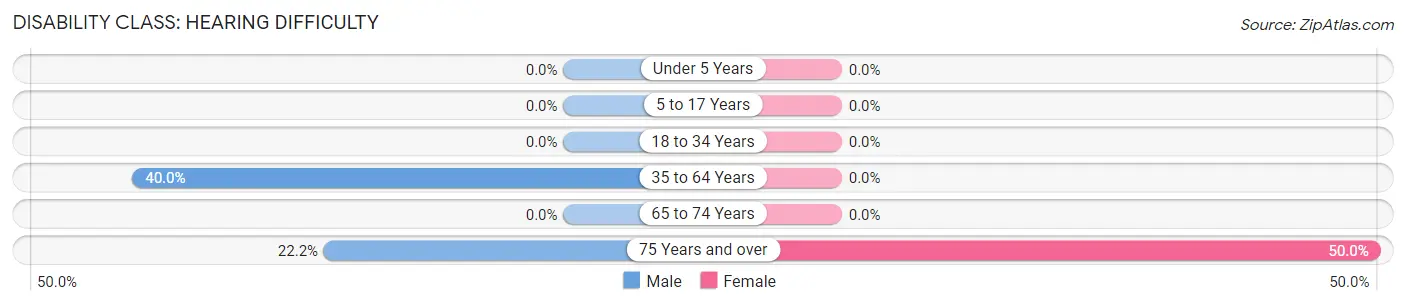
| Age Bracket | Male | Female |
| Under 5 Years | 0 (0.0%) | 0 (0.0%) |
| 5 to 17 Years | 0 (0.0%) | 0 (0.0%) |
| 18 to 34 Years | 0 (0.0%) | 0 (0.0%) |
| 35 to 64 Years | 8 (40.0%) | 0 (0.0%) |
| 65 to 74 Years | 0 (0.0%) | 0 (0.0%) |
| 75 Years and over | 2 (22.2%) | 2 (50.0%) |
Disability Class: Vision Difficulty
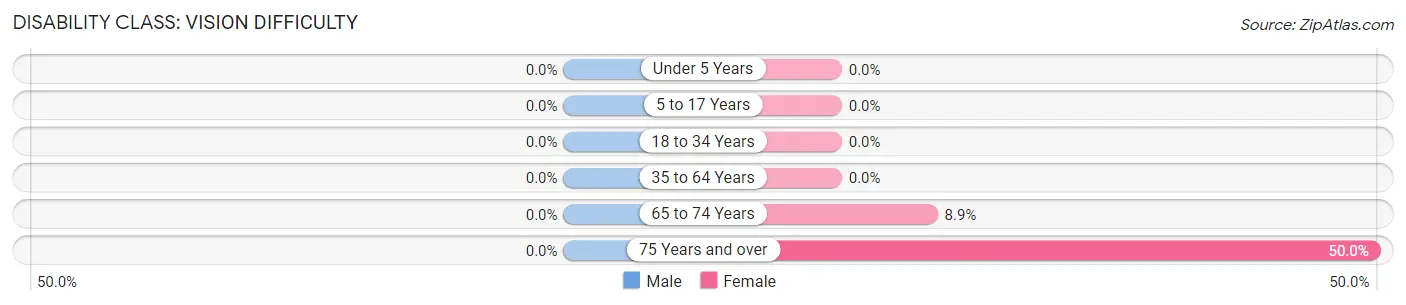
| Age Bracket | Male | Female |
| Under 5 Years | 0 (0.0%) | 0 (0.0%) |
| 5 to 17 Years | 0 (0.0%) | 0 (0.0%) |
| 18 to 34 Years | 0 (0.0%) | 0 (0.0%) |
| 35 to 64 Years | 0 (0.0%) | 0 (0.0%) |
| 65 to 74 Years | 0 (0.0%) | 4 (8.9%) |
| 75 Years and over | 0 (0.0%) | 2 (50.0%) |
Disability Class: Cognitive Difficulty
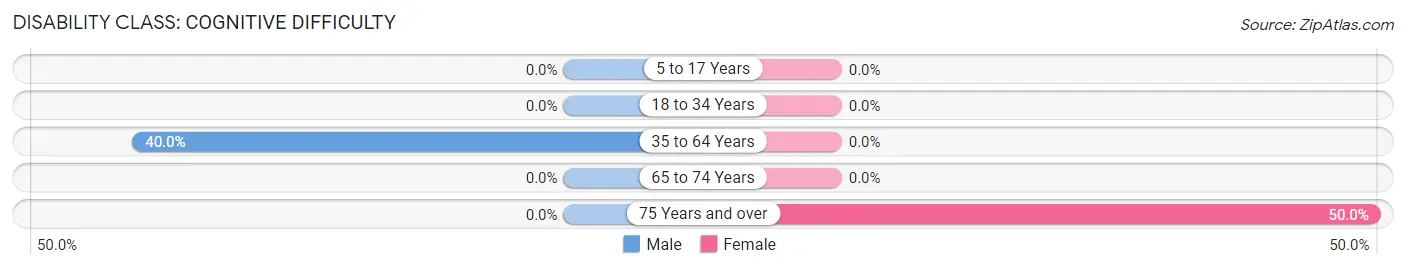
| Age Bracket | Male | Female |
| 5 to 17 Years | 0 (0.0%) | 0 (0.0%) |
| 18 to 34 Years | 0 (0.0%) | 0 (0.0%) |
| 35 to 64 Years | 8 (40.0%) | 0 (0.0%) |
| 65 to 74 Years | 0 (0.0%) | 0 (0.0%) |
| 75 Years and over | 0 (0.0%) | 2 (50.0%) |
Disability Class: Ambulatory Difficulty
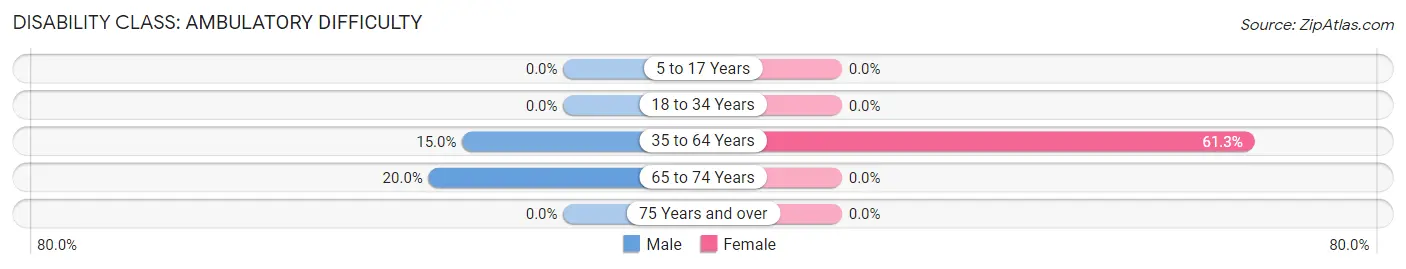
| Age Bracket | Male | Female |
| 5 to 17 Years | 0 (0.0%) | 0 (0.0%) |
| 18 to 34 Years | 0 (0.0%) | 0 (0.0%) |
| 35 to 64 Years | 3 (15.0%) | 19 (61.3%) |
| 65 to 74 Years | 5 (20.0%) | 0 (0.0%) |
| 75 Years and over | 0 (0.0%) | 0 (0.0%) |
Disability Class: Self-Care Difficulty
| Age Bracket | Male | Female |
| 5 to 17 Years | 0 (0.0%) | 0 (0.0%) |
| 18 to 34 Years | 0 (0.0%) | 0 (0.0%) |
| 35 to 64 Years | 0 (0.0%) | 0 (0.0%) |
| 65 to 74 Years | 0 (0.0%) | 0 (0.0%) |
| 75 Years and over | 0 (0.0%) | 0 (0.0%) |
Technology Access in Lodoga
Computing Device Access in Lodoga
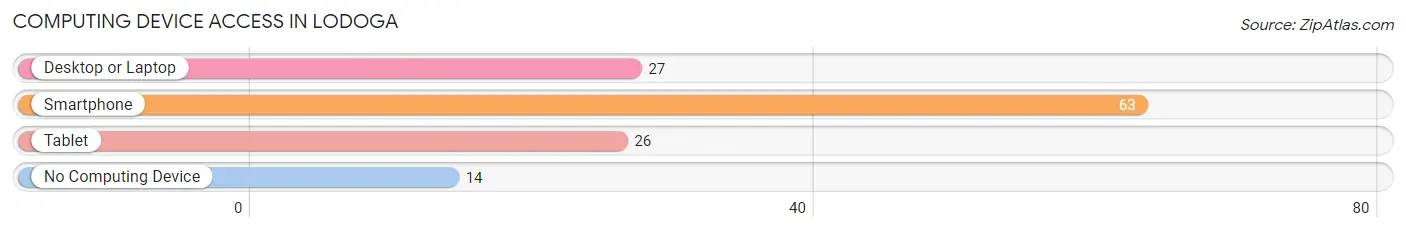
| Device Type | # Households | % Households |
| Desktop or Laptop | 27 | 32.9% |
| Smartphone | 63 | 76.8% |
| Tablet | 26 | 31.7% |
| No Computing Device | 14 | 17.1% |
| Total | 82 | 100.0% |
Internet Access in Lodoga
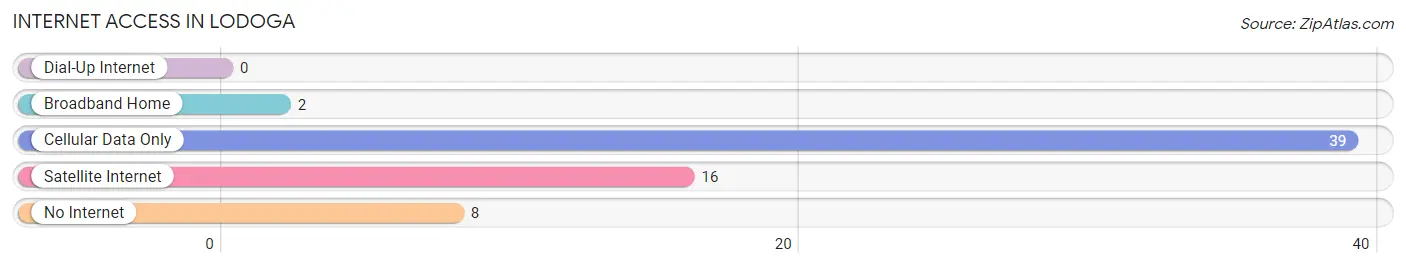
| Internet Type | # Households | % Households |
| Dial-Up Internet | 0 | 0.0% |
| Broadband Home | 2 | 2.4% |
| Cellular Data Only | 39 | 47.6% |
| Satellite Internet | 16 | 19.5% |
| No Internet | 8 | 9.8% |
| Total | 82 | 100.0% |
Lodoga Summary
Lodoga is a small unincorporated community located in Colusa County, California. It is situated in the foothills of the Sierra Nevada Mountains, approximately 20 miles east of the city of Williams. The population of Lodoga was estimated to be around 200 people in 2000.
History
Lodoga was founded in 1858 by a group of settlers from the Midwest. The town was named after the nearby creek, which was named after a Native American chief. The settlers were attracted to the area due to its fertile soil and abundant water supply. The town quickly grew and by the late 1800s, Lodoga had become a thriving agricultural community.
The town was home to a variety of businesses, including a general store, a blacksmith shop, a hotel, and a saloon. Lodoga also had its own post office, which opened in 1876. The town was also home to a school, which was built in 1883.
In the early 1900s, Lodoga began to decline as the population shifted to larger cities. By the 1950s, the town had become a virtual ghost town. However, in the late 1970s, the town began to experience a resurgence as people began to move back to the area.
Geography
Lodoga is located in the foothills of the Sierra Nevada Mountains, approximately 20 miles east of the city of Williams. The town is situated at an elevation of 1,400 feet above sea level. The climate in Lodoga is generally mild, with hot summers and cool winters.
The town is surrounded by rolling hills and open fields. The nearby creek, which is named after the town, is a popular spot for fishing and swimming.
Economy
The economy of Lodoga is largely based on agriculture. The town is home to several farms, which produce a variety of crops, including wheat, corn, and hay. The town is also home to a number of small businesses, including a general store, a gas station, and a restaurant.
Demographics
As of the 2000 census, the population of Lodoga was estimated to be around 200 people. The racial makeup of the town was 94.5% White, 0.5% African American, 0.5% Native American, 0.5% Asian, and 4% from other races. The median household income was $30,000.
Conclusion
Lodoga is a small unincorporated community located in Colusa County, California. It is situated in the foothills of the Sierra Nevada Mountains, approximately 20 miles east of the city of Williams. The population of Lodoga was estimated to be around 200 people in 2000. The town is largely based on agriculture, with several farms producing a variety of crops. The racial makeup of the town was 94.5% White, 0.5% African American, 0.5% Native American, 0.5% Asian, and 4% from other races. The median household income was $30,000.
Common Questions
What is Per Capita Income in Lodoga?
Per Capita income in Lodoga is $33,371.
What is the Median Family Income in Lodoga?
Median Family Income in Lodoga is $77,625.
What is Income or Wage Gap in Lodoga?
Income or Wage Gap in Lodoga is 97.4%.
Women in Lodoga earn 2.6 cents for every dollar earned by a man.
What is Inequality or Gini Index in Lodoga?
Inequality or Gini Index in Lodoga is 0.51.
What is the Total Population of Lodoga?
Total Population of Lodoga is 201.
What is the Total Male Population of Lodoga?
Total Male Population of Lodoga is 114.
What is the Total Female Population of Lodoga?
Total Female Population of Lodoga is 87.
What is the Ratio of Males per 100 Females in Lodoga?
There are 131.03 Males per 100 Females in Lodoga.
What is the Ratio of Females per 100 Males in Lodoga?
There are 76.32 Females per 100 Males in Lodoga.
What is the Median Population Age in Lodoga?
Median Population Age in Lodoga is 58.8 Years.
What is the Average Family Size in Lodoga
Average Family Size in Lodoga is 3.6 People.
What is the Average Household Size in Lodoga
Average Household Size in Lodoga is 2.5 People.
How Large is the Labor Force in Lodoga?
There are 83 People in the Labor Forcein in Lodoga.
What is the Percentage of People in the Labor Force in Lodoga?
46.6% of People are in the Labor Force in Lodoga.