Crescent City, CA Map & Demographics
Crescent City Map
Crescent City Overview
$16,379
PER CAPITA INCOME
$44,848
AVG FAMILY INCOME
$39,812
AVG HOUSEHOLD INCOME
19.7%
WAGE / INCOME GAP [ % ]
80.3¢/ $1
WAGE / INCOME GAP [ $ ]
0.45
INEQUALITY / GINI INDEX
6,379
TOTAL POPULATION
4,052
MALE POPULATION
2,327
FEMALE POPULATION
174.13
MALES / 100 FEMALES
57.43
FEMALES / 100 MALES
37.1
MEDIAN AGE
2.9
AVG FAMILY SIZE
2.1
AVG HOUSEHOLD SIZE
1,839
LABOR FORCE [ PEOPLE ]
32.3%
PERCENT IN LABOR FORCE
7.9%
UNEMPLOYMENT RATE
Crescent City Zip Codes
Crescent City Area Codes
Income in Crescent City
Income Overview in Crescent City
Per Capita Income in Crescent City is $16,379, while median incomes of families and households are $44,848 and $39,812 respectively.
| Characteristic | Number | Measure |
| Per Capita Income | 6,379 | $16,379 |
| Median Family Income | 1,032 | $44,848 |
| Mean Family Income | 1,032 | $52,672 |
| Median Household Income | 2,029 | $39,812 |
| Mean Household Income | 2,029 | $51,019 |
| Income Deficit | 1,032 | $0 |
| Wage / Income Gap (%) | 6,379 | 19.70% |
| Wage / Income Gap ($) | 6,379 | 80.30¢ per $1 |
| Gini / Inequality Index | 6,379 | 0.45 |
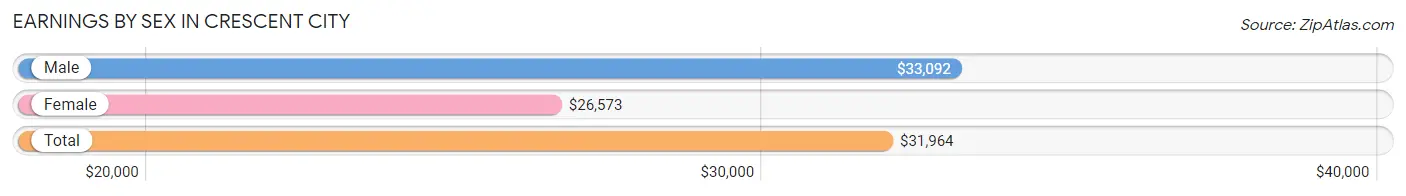
Earnings by Sex in Crescent City
Average Earnings in Crescent City are $31,964, $33,092 for men and $26,573 for women, a difference of 19.7%.
| Sex | Number | Average Earnings |
| Male | 1,033 (54.9%) | $33,092 |
| Female | 849 (45.1%) | $26,573 |
| Total | 1,882 (100.0%) | $31,964 |
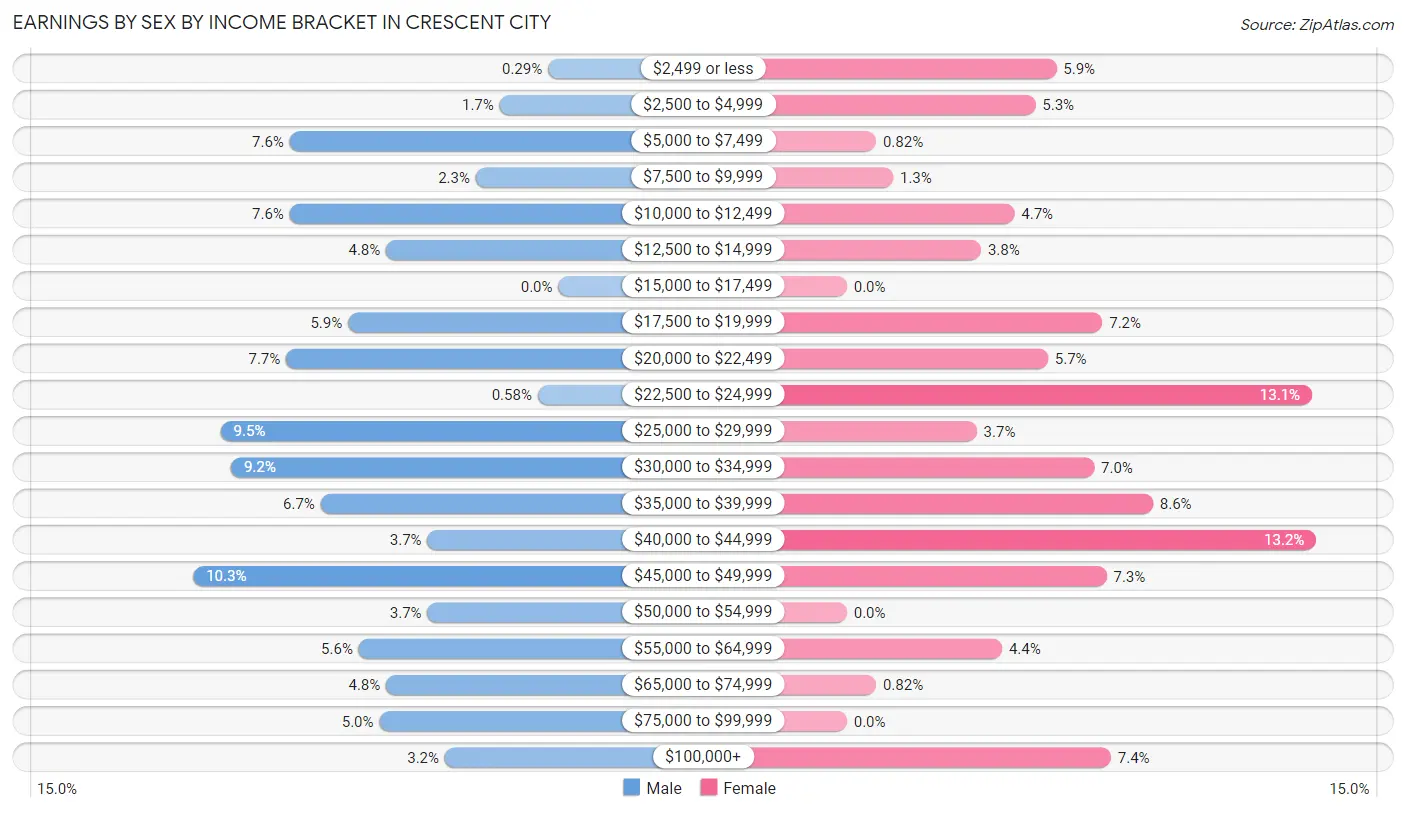
Earnings by Sex by Income Bracket in Crescent City
The most common earnings brackets in Crescent City are $45,000 to $49,999 for men (106 | 10.3%) and $40,000 to $44,999 for women (112 | 13.2%).
| Income | Male | Female |
| $2,499 or less | 3 (0.3%) | 50 (5.9%) |
| $2,500 to $4,999 | 17 (1.7%) | 45 (5.3%) |
| $5,000 to $7,499 | 78 (7.5%) | 7 (0.8%) |
| $7,500 to $9,999 | 24 (2.3%) | 11 (1.3%) |
| $10,000 to $12,499 | 78 (7.5%) | 40 (4.7%) |
| $12,500 to $14,999 | 50 (4.8%) | 32 (3.8%) |
| $15,000 to $17,499 | 0 (0.0%) | 0 (0.0%) |
| $17,500 to $19,999 | 61 (5.9%) | 61 (7.2%) |
| $20,000 to $22,499 | 79 (7.6%) | 48 (5.7%) |
| $22,500 to $24,999 | 6 (0.6%) | 111 (13.1%) |
| $25,000 to $29,999 | 98 (9.5%) | 31 (3.6%) |
| $30,000 to $34,999 | 95 (9.2%) | 59 (7.0%) |
| $35,000 to $39,999 | 69 (6.7%) | 73 (8.6%) |
| $40,000 to $44,999 | 38 (3.7%) | 112 (13.2%) |
| $45,000 to $49,999 | 106 (10.3%) | 62 (7.3%) |
| $50,000 to $54,999 | 38 (3.7%) | 0 (0.0%) |
| $55,000 to $64,999 | 58 (5.6%) | 37 (4.4%) |
| $65,000 to $74,999 | 50 (4.8%) | 7 (0.8%) |
| $75,000 to $99,999 | 52 (5.0%) | 0 (0.0%) |
| $100,000+ | 33 (3.2%) | 63 (7.4%) |
| Total | 1,033 (100.0%) | 849 (100.0%) |
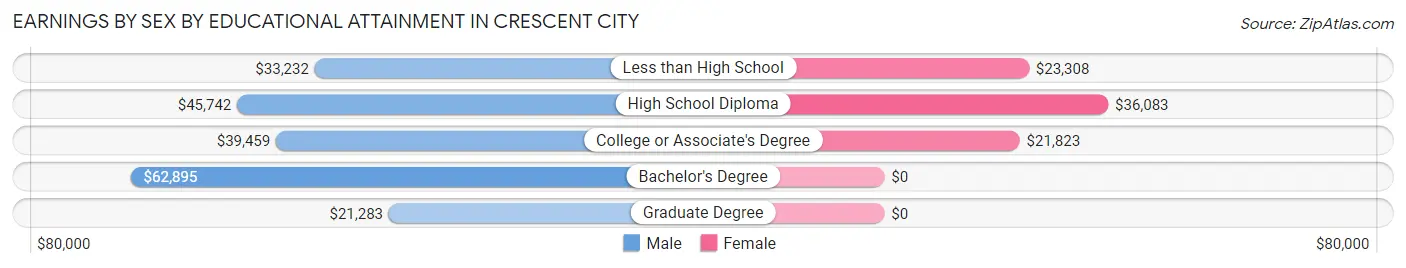
Earnings by Sex by Educational Attainment in Crescent City
Average earnings in Crescent City are $33,961 for men and $32,835 for women, a difference of 3.3%. Men with an educational attainment of bachelor's degree enjoy the highest average annual earnings of $62,895, while those with graduate degree education earn the least with $21,283. Women with an educational attainment of high school diploma earn the most with the average annual earnings of $36,083, while those with college or associate's degree education have the smallest earnings of $21,823.
| Educational Attainment | Male Income | Female Income |
| Less than High School | $33,232 | $23,308 |
| High School Diploma | $45,742 | $36,083 |
| College or Associate's Degree | $39,459 | $21,823 |
| Bachelor's Degree | $62,895 | $0 |
| Graduate Degree | $21,283 | $0 |
| Total | $33,961 | $32,835 |
Family Income in Crescent City
Family Income Brackets in Crescent City
According to the Crescent City family income data, there are 249 families falling into the $35,000 to $49,999 income range, which is the most common income bracket and makes up 24.1% of all families.
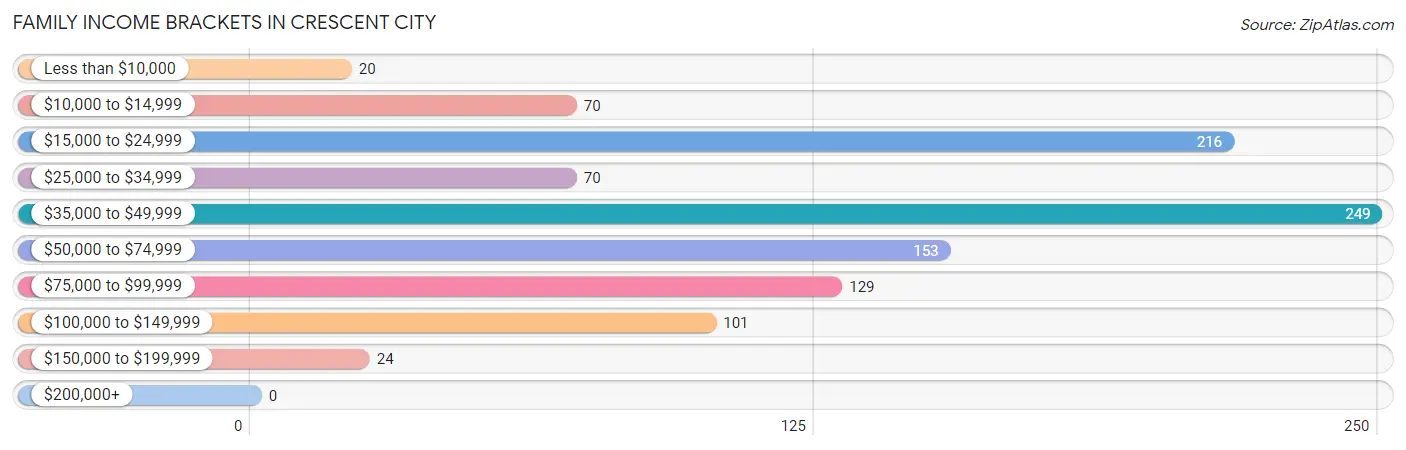
| Income Bracket | # Families | % Families |
| Less than $10,000 | 20 | 1.9% |
| $10,000 to $14,999 | 70 | 6.8% |
| $15,000 to $24,999 | 216 | 20.9% |
| $25,000 to $34,999 | 70 | 6.8% |
| $35,000 to $49,999 | 249 | 24.1% |
| $50,000 to $74,999 | 153 | 14.8% |
| $75,000 to $99,999 | 129 | 12.5% |
| $100,000 to $149,999 | 101 | 9.8% |
| $150,000 to $199,999 | 24 | 2.3% |
| $200,000+ | 0 | 0.0% |
Family Income by Famaliy Size in Crescent City
3-person families (264 | 25.6%) account for the highest median family income in Crescent City with $50,000 per family, while 2-person families (535 | 51.8%) have the highest median income of $19,007 per family member.
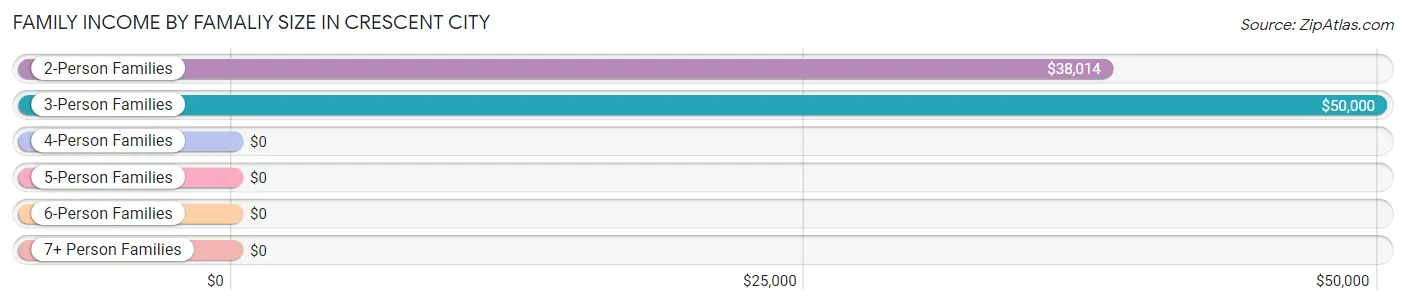
| Income Bracket | # Families | Median Income |
| 2-Person Families | 535 (51.8%) | $38,014 |
| 3-Person Families | 264 (25.6%) | $50,000 |
| 4-Person Families | 107 (10.4%) | $0 |
| 5-Person Families | 79 (7.7%) | $0 |
| 6-Person Families | 34 (3.3%) | $0 |
| 7+ Person Families | 13 (1.3%) | $0 |
| Total | 1,032 (100.0%) | $44,848 |
Family Income by Number of Earners in Crescent City
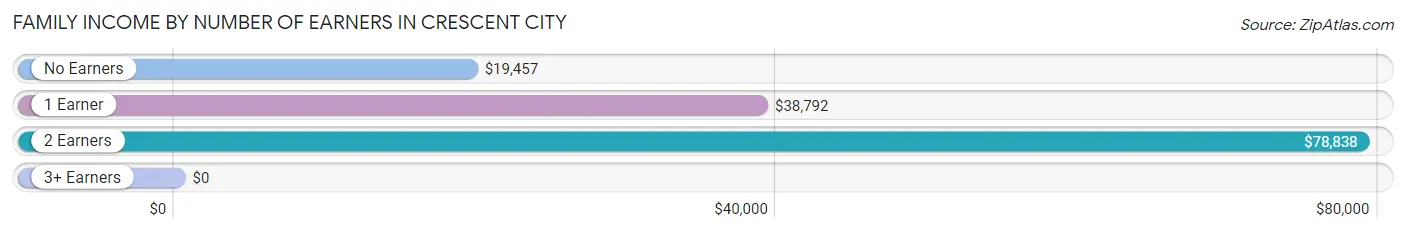
| Number of Earners | # Families | Median Income |
| No Earners | 259 (25.1%) | $19,457 |
| 1 Earner | 427 (41.4%) | $38,792 |
| 2 Earners | 281 (27.2%) | $78,838 |
| 3+ Earners | 65 (6.3%) | $0 |
| Total | 1,032 (100.0%) | $44,848 |
Household Income in Crescent City
Household Income Brackets in Crescent City
With 414 households falling in the category, the $35,000 to $49,999 income range is the most frequent in Crescent City, accounting for 20.4% of all households. In contrast, only 24 households (1.2%) fall into the $200,000+ income bracket, making it the least populous group.
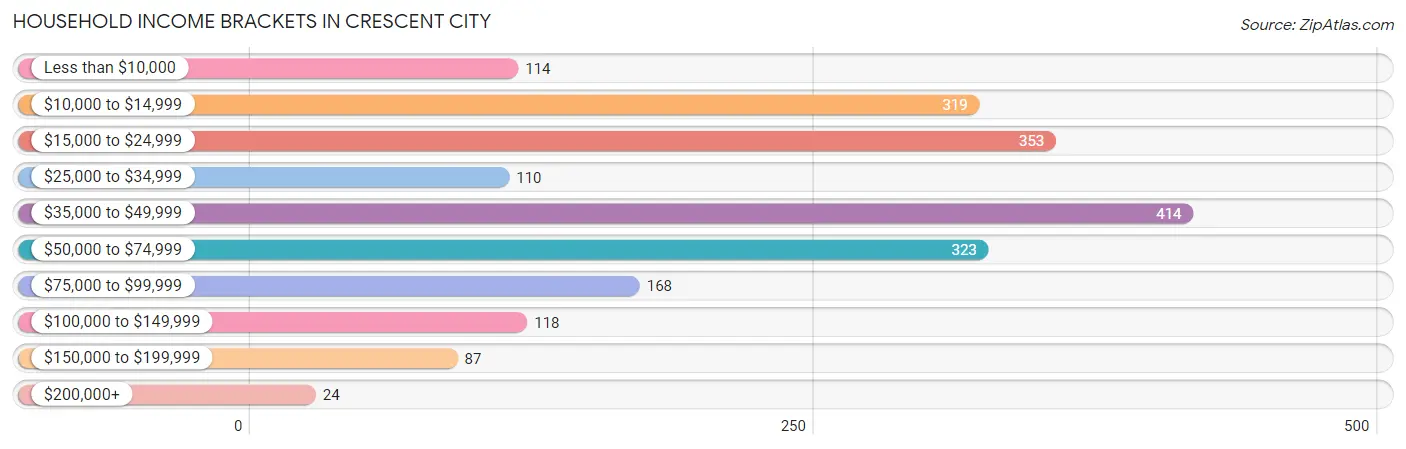
| Income Bracket | # Households | % Households |
| Less than $10,000 | 114 | 5.6% |
| $10,000 to $14,999 | 319 | 15.7% |
| $15,000 to $24,999 | 353 | 17.4% |
| $25,000 to $34,999 | 110 | 5.4% |
| $35,000 to $49,999 | 414 | 20.4% |
| $50,000 to $74,999 | 323 | 15.9% |
| $75,000 to $99,999 | 168 | 8.3% |
| $100,000 to $149,999 | 118 | 5.8% |
| $150,000 to $199,999 | 87 | 4.3% |
| $200,000+ | 24 | 1.2% |
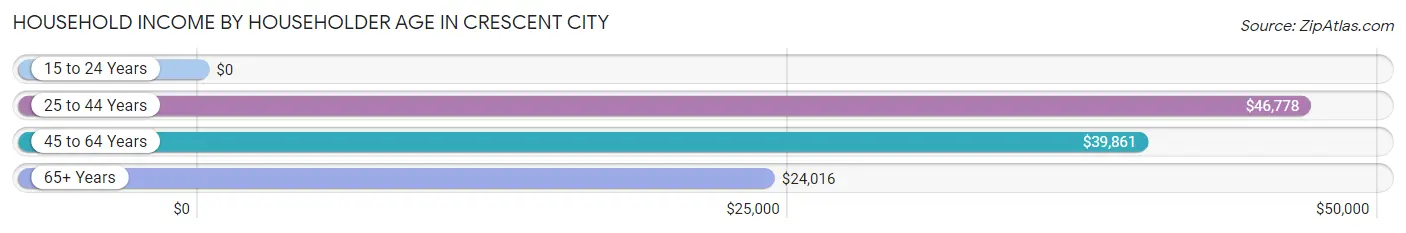
Household Income by Householder Age in Crescent City
The median household income in Crescent City is $39,812, with the highest median household income of $46,778 found in the 25 to 44 years age bracket for the primary householder. A total of 668 households (32.9%) fall into this category. Meanwhile, the 15 to 24 years age bracket for the primary householder has the lowest median household income of $0, with 60 households (3.0%) in this group.
| Income Bracket | # Households | Median Income |
| 15 to 24 Years | 60 (3.0%) | $0 |
| 25 to 44 Years | 668 (32.9%) | $46,778 |
| 45 to 64 Years | 724 (35.7%) | $39,861 |
| 65+ Years | 577 (28.4%) | $24,016 |
| Total | 2,029 (100.0%) | $39,812 |
Poverty in Crescent City
Income Below Poverty by Sex and Age in Crescent City
With 16.3% poverty level for males and 28.3% for females among the residents of Crescent City, 15 year old males and 12 to 14 year old females are the most vulnerable to poverty, with 14 males (100.0%) and 112 females (88.9%) in their respective age groups living below the poverty level.
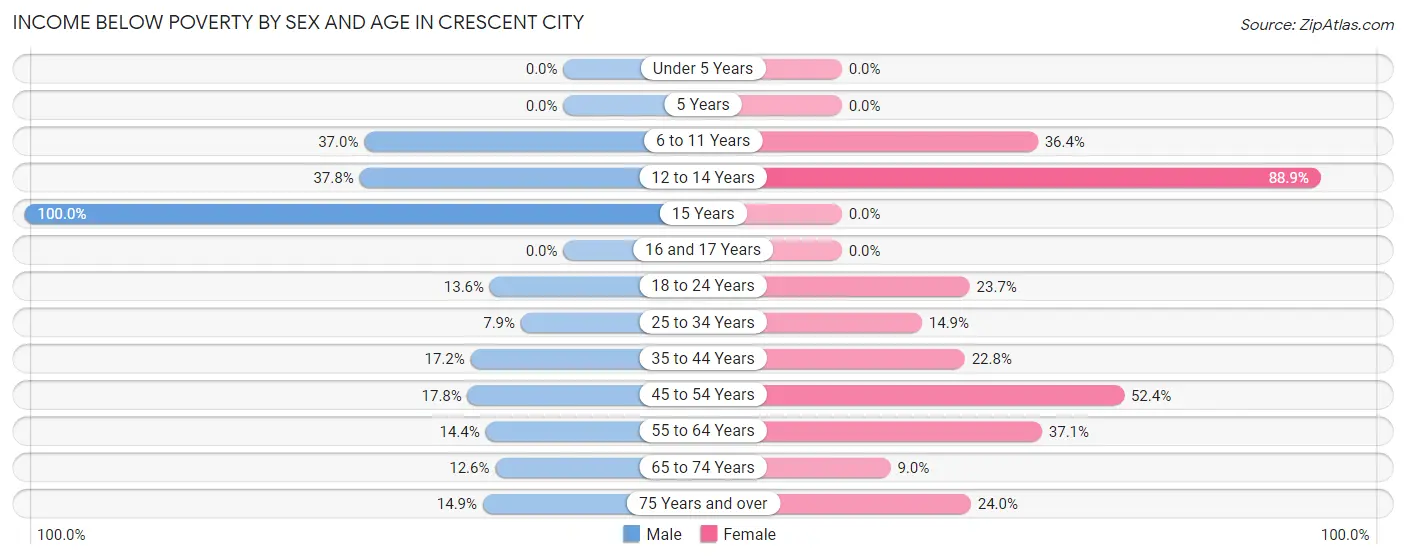
| Age Bracket | Male | Female |
| Under 5 Years | 0 (0.0%) | 0 (0.0%) |
| 5 Years | 0 (0.0%) | 0 (0.0%) |
| 6 to 11 Years | 68 (37.0%) | 44 (36.4%) |
| 12 to 14 Years | 14 (37.8%) | 112 (88.9%) |
| 15 Years | 14 (100.0%) | 0 (0.0%) |
| 16 and 17 Years | 0 (0.0%) | 0 (0.0%) |
| 18 to 24 Years | 27 (13.6%) | 28 (23.7%) |
| 25 to 34 Years | 21 (7.9%) | 33 (14.9%) |
| 35 to 44 Years | 46 (17.2%) | 89 (22.8%) |
| 45 to 54 Years | 59 (17.8%) | 110 (52.4%) |
| 55 to 64 Years | 39 (14.4%) | 153 (37.1%) |
| 65 to 74 Years | 24 (12.6%) | 31 (9.0%) |
| 75 Years and over | 13 (14.9%) | 40 (23.9%) |
| Total | 325 (16.3%) | 640 (28.3%) |
Income Above Poverty by Sex and Age in Crescent City
According to the poverty statistics in Crescent City, males aged under 5 years and females aged under 5 years are the age groups that are most secure financially, with 100.0% of males and 100.0% of females in these age groups living above the poverty line.
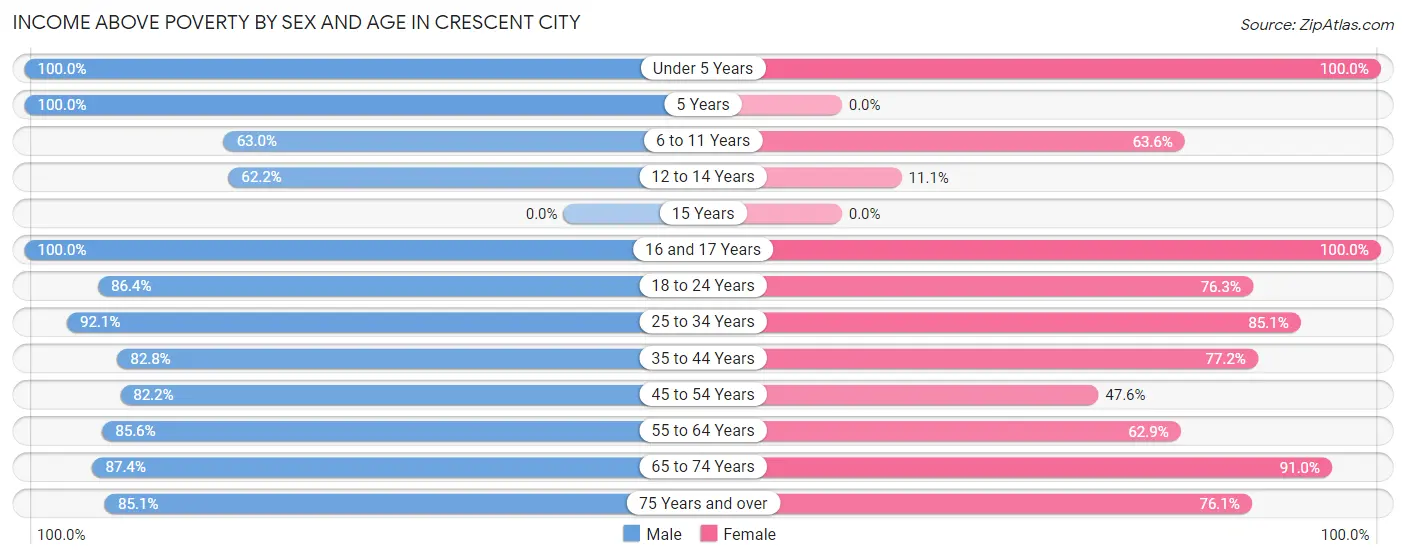
| Age Bracket | Male | Female |
| Under 5 Years | 61 (100.0%) | 122 (100.0%) |
| 5 Years | 17 (100.0%) | 0 (0.0%) |
| 6 to 11 Years | 116 (63.0%) | 77 (63.6%) |
| 12 to 14 Years | 23 (62.2%) | 14 (11.1%) |
| 15 Years | 0 (0.0%) | 0 (0.0%) |
| 16 and 17 Years | 67 (100.0%) | 30 (100.0%) |
| 18 to 24 Years | 171 (86.4%) | 90 (76.3%) |
| 25 to 34 Years | 245 (92.1%) | 189 (85.1%) |
| 35 to 44 Years | 221 (82.8%) | 301 (77.2%) |
| 45 to 54 Years | 273 (82.2%) | 100 (47.6%) |
| 55 to 64 Years | 231 (85.6%) | 259 (62.9%) |
| 65 to 74 Years | 166 (87.4%) | 312 (91.0%) |
| 75 Years and over | 74 (85.1%) | 127 (76.0%) |
| Total | 1,665 (83.7%) | 1,621 (71.7%) |
Income Below Poverty Among Married-Couple Families in Crescent City
The poverty statistics for married-couple families in Crescent City show that 8.7% or 48 of the total 549 families live below the poverty line. Families with 1 or 2 children have the highest poverty rate of 40.3%, comprising of 48 families. On the other hand, families with no children have the lowest poverty rate of 0.0%, which includes 0 families.
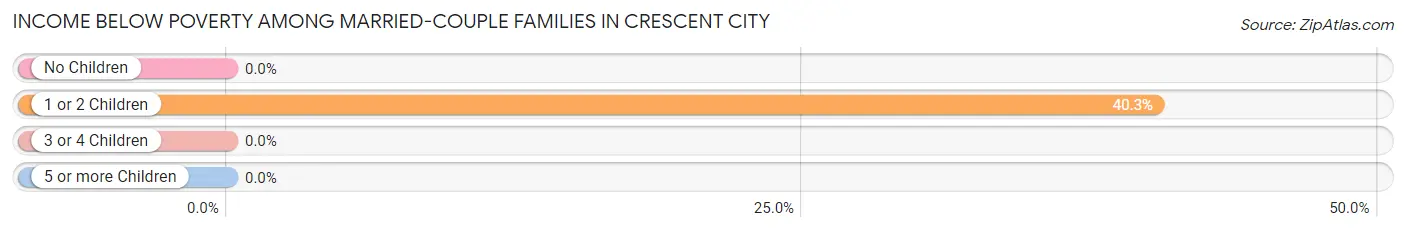
| Children | Above Poverty | Below Poverty |
| No Children | 336 (100.0%) | 0 (0.0%) |
| 1 or 2 Children | 71 (59.7%) | 48 (40.3%) |
| 3 or 4 Children | 94 (100.0%) | 0 (0.0%) |
| 5 or more Children | 0 (0.0%) | 0 (0.0%) |
| Total | 501 (91.3%) | 48 (8.7%) |
Income Below Poverty Among Single-Parent Households in Crescent City
According to the poverty data in Crescent City, 43.1% or 59 single-father households and 17.1% or 59 single-mother households are living below the poverty line. Among single-father households, those with 1 or 2 children have the highest poverty rate, with 59 households (100.0%) experiencing poverty. Likewise, among single-mother households, those with 3 or 4 children have the highest poverty rate, with 20 households (74.1%) falling below the poverty line.
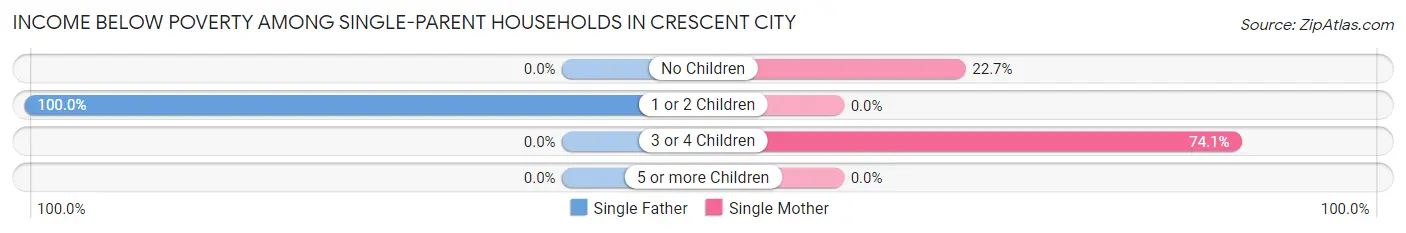
| Children | Single Father | Single Mother |
| No Children | 0 (0.0%) | 39 (22.7%) |
| 1 or 2 Children | 59 (100.0%) | 0 (0.0%) |
| 3 or 4 Children | 0 (0.0%) | 20 (74.1%) |
| 5 or more Children | 0 (0.0%) | 0 (0.0%) |
| Total | 59 (43.1%) | 59 (17.1%) |
Income Below Poverty Among Married-Couple vs Single-Parent Households in Crescent City
The poverty data for Crescent City shows that 48 of the married-couple family households (8.7%) and 118 of the single-parent households (24.4%) are living below the poverty level. Within the married-couple family households, those with 1 or 2 children have the highest poverty rate, with 48 households (40.3%) falling below the poverty line. Among the single-parent households, those with 3 or 4 children have the highest poverty rate, with 20 household (74.1%) living below poverty.
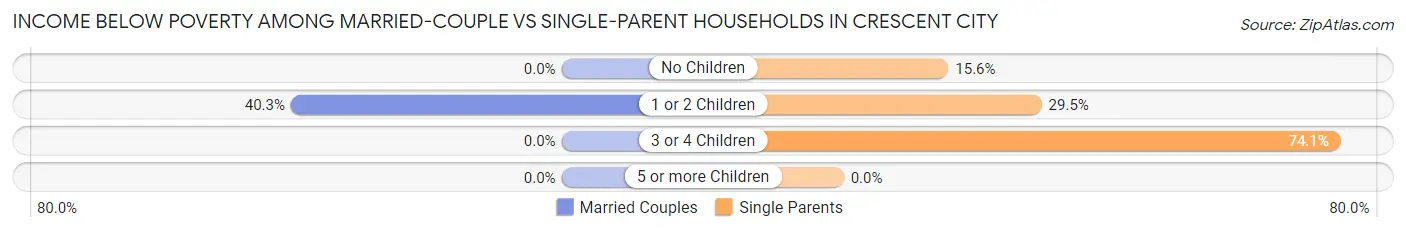
| Children | Married-Couple Families | Single-Parent Households |
| No Children | 0 (0.0%) | 39 (15.6%) |
| 1 or 2 Children | 48 (40.3%) | 59 (29.5%) |
| 3 or 4 Children | 0 (0.0%) | 20 (74.1%) |
| 5 or more Children | 0 (0.0%) | 0 (0.0%) |
| Total | 48 (8.7%) | 118 (24.4%) |
Race in Crescent City
The most populous races in Crescent City are White / Caucasian (4,205 | 65.9%), Hispanic or Latino (2,017 | 31.6%), and Two or more Races (597 | 9.4%).
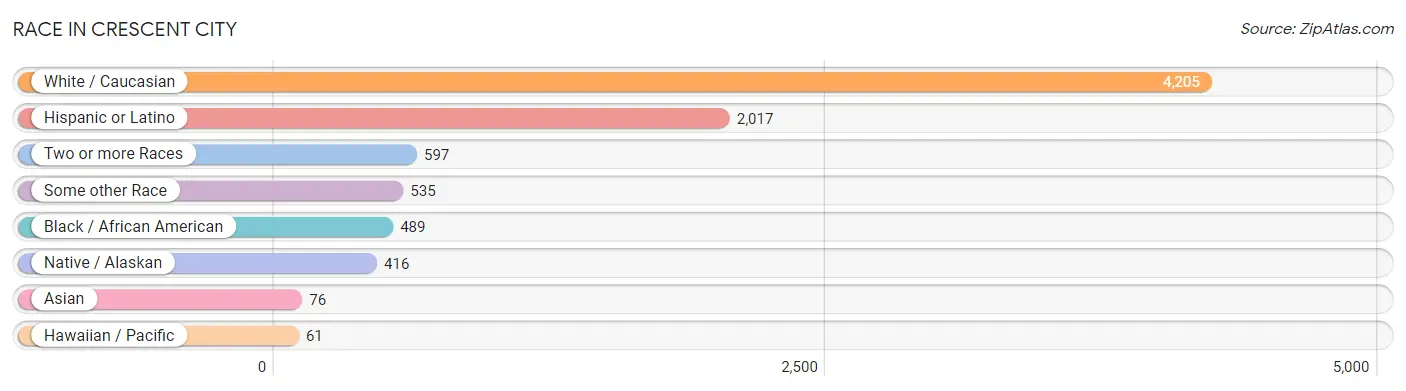
| Race | # Population | % Population |
| Asian | 76 | 1.2% |
| Black / African American | 489 | 7.7% |
| Hawaiian / Pacific | 61 | 1.0% |
| Hispanic or Latino | 2,017 | 31.6% |
| Native / Alaskan | 416 | 6.5% |
| White / Caucasian | 4,205 | 65.9% |
| Two or more Races | 597 | 9.4% |
| Some other Race | 535 | 8.4% |
| Total | 6,379 | 100.0% |
Ancestry in Crescent City
The most populous ancestries reported in Crescent City are Mexican (1,109 | 17.4%), English (676 | 10.6%), German (435 | 6.8%), American (420 | 6.6%), and Irish (370 | 5.8%), together accounting for 47.2% of all Crescent City residents.
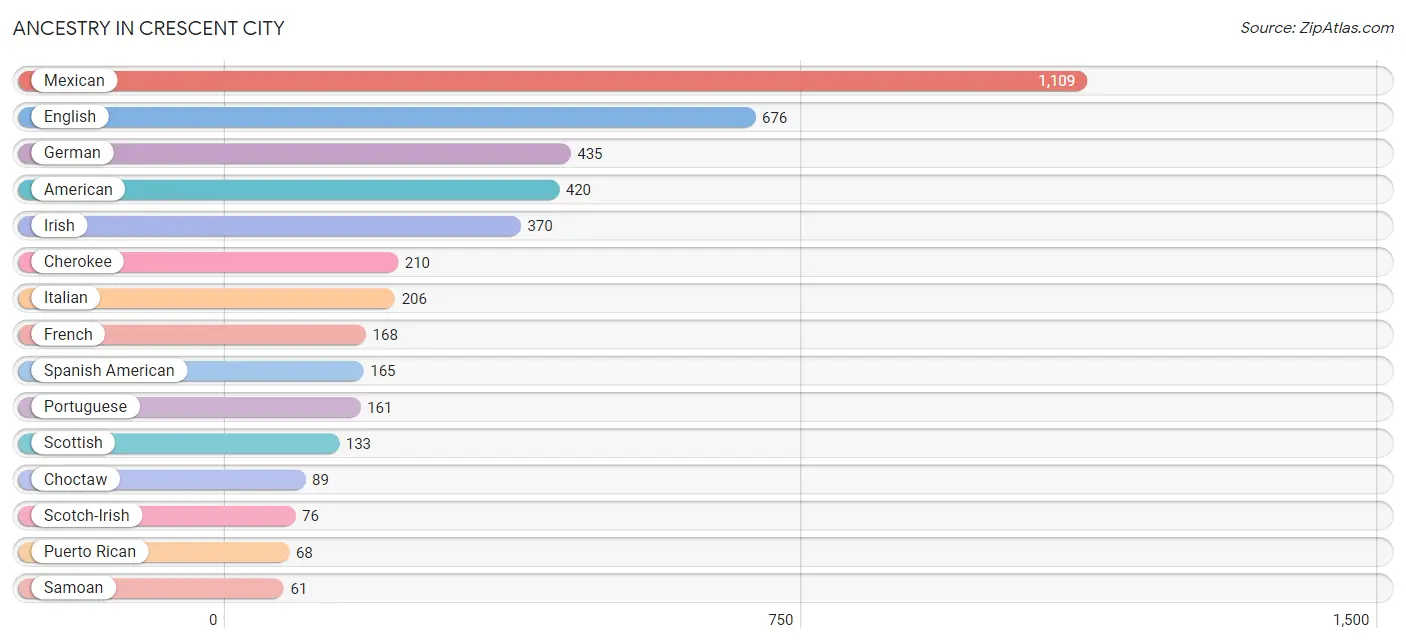
| Ancestry | # Population | % Population |
| African | 12 | 0.2% |
| American | 420 | 6.6% |
| Bangladeshi | 25 | 0.4% |
| Blackfeet | 3 | 0.1% |
| Central American | 32 | 0.5% |
| Cherokee | 210 | 3.3% |
| Chilean | 6 | 0.1% |
| Choctaw | 89 | 1.4% |
| Czechoslovakian | 29 | 0.4% |
| Dutch | 15 | 0.2% |
| English | 676 | 10.6% |
| European | 16 | 0.3% |
| French | 168 | 2.6% |
| German | 435 | 6.8% |
| Indian (Asian) | 4 | 0.1% |
| Irish | 370 | 5.8% |
| Italian | 206 | 3.2% |
| Korean | 14 | 0.2% |
| Malaysian | 9 | 0.1% |
| Mexican | 1,109 | 17.4% |
| Norwegian | 3 | 0.1% |
| Pakistani | 7 | 0.1% |
| Polish | 9 | 0.1% |
| Portuguese | 161 | 2.5% |
| Puerto Rican | 68 | 1.1% |
| Romanian | 3 | 0.1% |
| Russian | 16 | 0.3% |
| Salvadoran | 32 | 0.5% |
| Samoan | 61 | 1.0% |
| Scandinavian | 5 | 0.1% |
| Scotch-Irish | 76 | 1.2% |
| Scottish | 133 | 2.1% |
| South American | 6 | 0.1% |
| Spaniard | 55 | 0.9% |
| Spanish American | 165 | 2.6% |
| Sri Lankan | 4 | 0.1% |
| Subsaharan African | 12 | 0.2% |
| Swedish | 55 | 0.9% |
| Swiss | 10 | 0.2% |
| Thai | 10 | 0.2% |
| Welsh | 37 | 0.6% | View All 41 Rows |
Immigrants in Crescent City
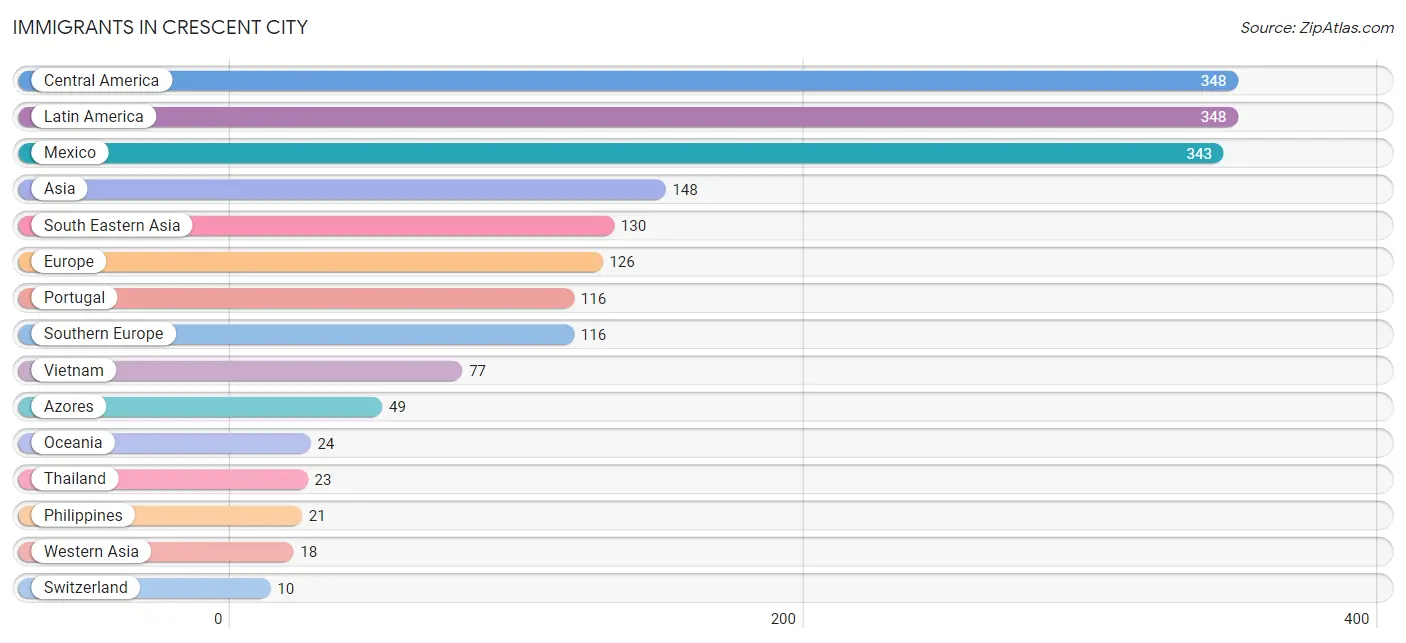
The most numerous immigrant groups reported in Crescent City came from Central America (348 | 5.5%), Latin America (348 | 5.5%), Mexico (343 | 5.4%), Asia (148 | 2.3%), and South Eastern Asia (130 | 2.0%), together accounting for 20.7% of all Crescent City residents.
| Immigration Origin | # Population | % Population |
| Asia | 148 | 2.3% |
| Azores | 49 | 0.8% |
| Central America | 348 | 5.5% |
| El Salvador | 2 | 0.0% |
| Europe | 126 | 2.0% |
| Honduras | 3 | 0.1% |
| Laos | 9 | 0.1% |
| Latin America | 348 | 5.5% |
| Mexico | 343 | 5.4% |
| Oceania | 24 | 0.4% |
| Philippines | 21 | 0.3% |
| Portugal | 116 | 1.8% |
| South Eastern Asia | 130 | 2.0% |
| Southern Europe | 116 | 1.8% |
| Switzerland | 10 | 0.2% |
| Thailand | 23 | 0.4% |
| Vietnam | 77 | 1.2% |
| Western Asia | 18 | 0.3% |
| Western Europe | 10 | 0.2% | View All 19 Rows |
Sex and Age in Crescent City
Sex and Age in Crescent City
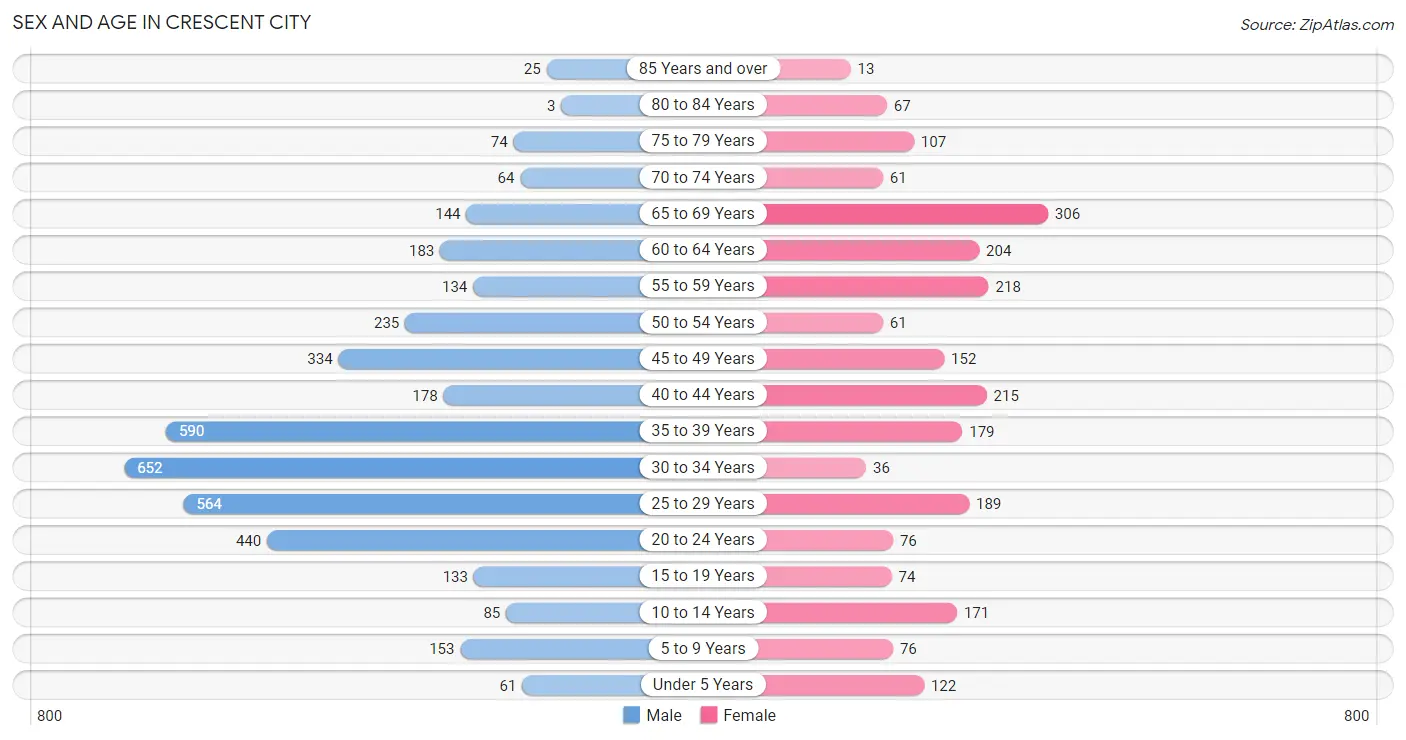
The most populous age groups in Crescent City are 30 to 34 Years (652 | 16.1%) for men and 65 to 69 Years (306 | 13.2%) for women.
| Age Bracket | Male | Female |
| Under 5 Years | 61 (1.5%) | 122 (5.2%) |
| 5 to 9 Years | 153 (3.8%) | 76 (3.3%) |
| 10 to 14 Years | 85 (2.1%) | 171 (7.3%) |
| 15 to 19 Years | 133 (3.3%) | 74 (3.2%) |
| 20 to 24 Years | 440 (10.9%) | 76 (3.3%) |
| 25 to 29 Years | 564 (13.9%) | 189 (8.1%) |
| 30 to 34 Years | 652 (16.1%) | 36 (1.5%) |
| 35 to 39 Years | 590 (14.6%) | 179 (7.7%) |
| 40 to 44 Years | 178 (4.4%) | 215 (9.2%) |
| 45 to 49 Years | 334 (8.2%) | 152 (6.5%) |
| 50 to 54 Years | 235 (5.8%) | 61 (2.6%) |
| 55 to 59 Years | 134 (3.3%) | 218 (9.4%) |
| 60 to 64 Years | 183 (4.5%) | 204 (8.8%) |
| 65 to 69 Years | 144 (3.5%) | 306 (13.2%) |
| 70 to 74 Years | 64 (1.6%) | 61 (2.6%) |
| 75 to 79 Years | 74 (1.8%) | 107 (4.6%) |
| 80 to 84 Years | 3 (0.1%) | 67 (2.9%) |
| 85 Years and over | 25 (0.6%) | 13 (0.6%) |
| Total | 4,052 (100.0%) | 2,327 (100.0%) |
Families and Households in Crescent City
Median Family Size in Crescent City
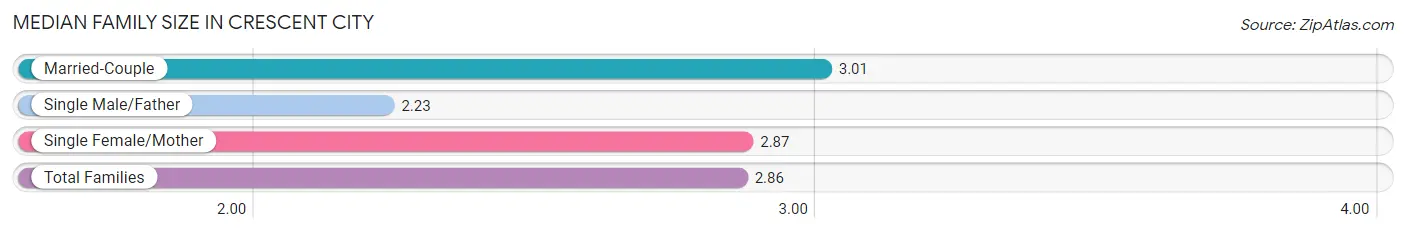
The median family size in Crescent City is 2.86 persons per family, with married-couple families (549 | 53.2%) accounting for the largest median family size of 3.01 persons per family. On the other hand, single male/father families (137 | 13.3%) represent the smallest median family size with 2.23 persons per family.
| Family Type | # Families | Family Size |
| Married-Couple | 549 (53.2%) | 3.01 |
| Single Male/Father | 137 (13.3%) | 2.23 |
| Single Female/Mother | 346 (33.5%) | 2.87 |
| Total Families | 1,032 (100.0%) | 2.86 |
Median Household Size in Crescent City
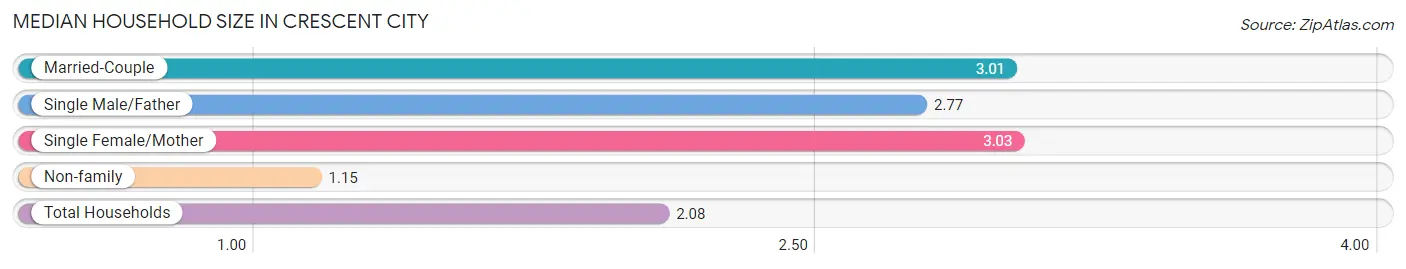
The median household size in Crescent City is 2.08 persons per household, with single female/mother households (346 | 17.1%) accounting for the largest median household size of 3.03 persons per household. non-family households (997 | 49.1%) represent the smallest median household size with 1.15 persons per household.
| Household Type | # Households | Household Size |
| Married-Couple | 549 (27.1%) | 3.01 |
| Single Male/Father | 137 (6.8%) | 2.77 |
| Single Female/Mother | 346 (17.1%) | 3.03 |
| Non-family | 997 (49.1%) | 1.15 |
| Total Households | 2,029 (100.0%) | 2.08 |
Household Size by Marriage Status in Crescent City
Out of a total of 2,029 households in Crescent City, 1,032 (50.9%) are family households, while 997 (49.1%) are nonfamily households. The most numerous type of family households are 2-person households, comprising 508, and the most common type of nonfamily households are 1-person households, comprising 862.
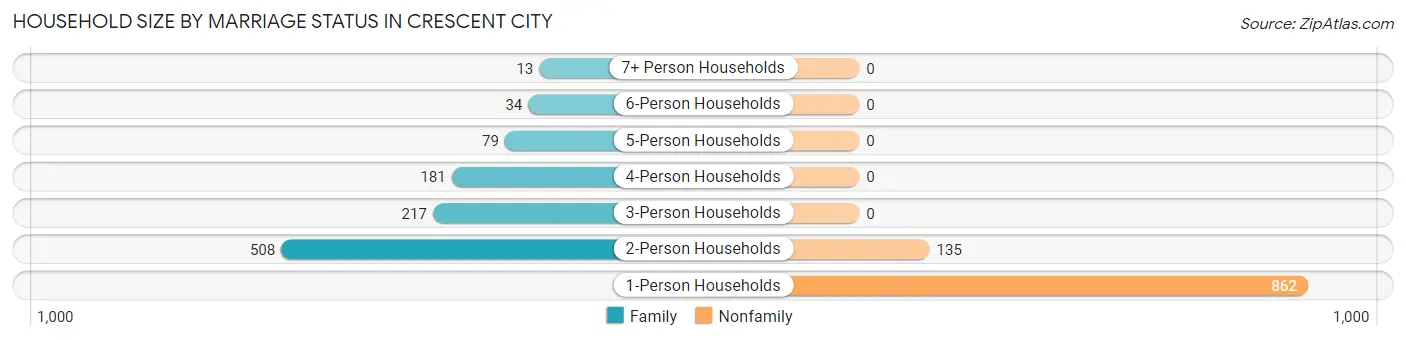
| Household Size | Family Households | Nonfamily Households |
| 1-Person Households | - | 862 (42.5%) |
| 2-Person Households | 508 (25.0%) | 135 (6.7%) |
| 3-Person Households | 217 (10.7%) | 0 (0.0%) |
| 4-Person Households | 181 (8.9%) | 0 (0.0%) |
| 5-Person Households | 79 (3.9%) | 0 (0.0%) |
| 6-Person Households | 34 (1.7%) | 0 (0.0%) |
| 7+ Person Households | 13 (0.6%) | 0 (0.0%) |
| Total | 1,032 (50.9%) | 997 (49.1%) |
Female Fertility in Crescent City
Fertility by Age in Crescent City
Average fertility rate in Crescent City is 35.0 births per 1,000 women. Women in the age bracket of 20 to 34 years have the highest fertility rate with 60.0 births per 1,000 women. Women in the age bracket of 20 to 34 years acount for 54.5% of all women with births.
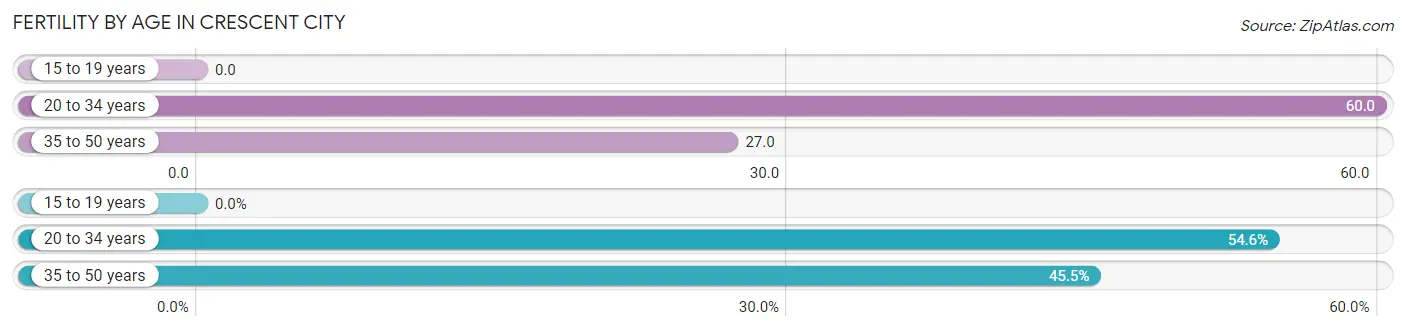
| Age Bracket | Women with Births | Births / 1,000 Women |
| 15 to 19 years | 0 (0.0%) | 0.0 |
| 20 to 34 years | 18 (54.5%) | 60.0 |
| 35 to 50 years | 15 (45.5%) | 27.0 |
| Total | 33 (100.0%) | 35.0 |
Fertility by Age by Marriage Status in Crescent City
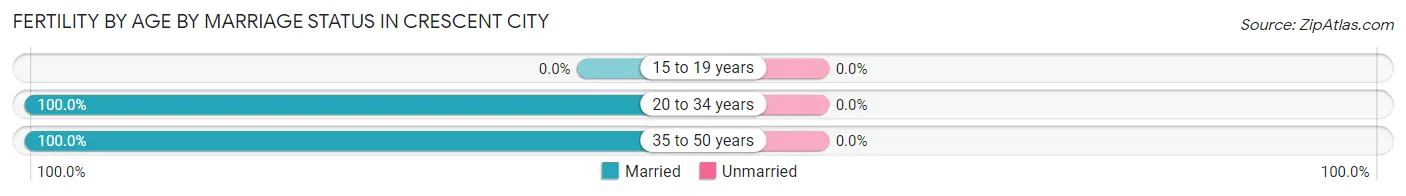
| Age Bracket | Married | Unmarried |
| 15 to 19 years | 0 (0.0%) | 0 (0.0%) |
| 20 to 34 years | 18 (100.0%) | 0 (0.0%) |
| 35 to 50 years | 15 (100.0%) | 0 (0.0%) |
| Total | 33 (100.0%) | 0 (0.0%) |
Fertility by Education in Crescent City
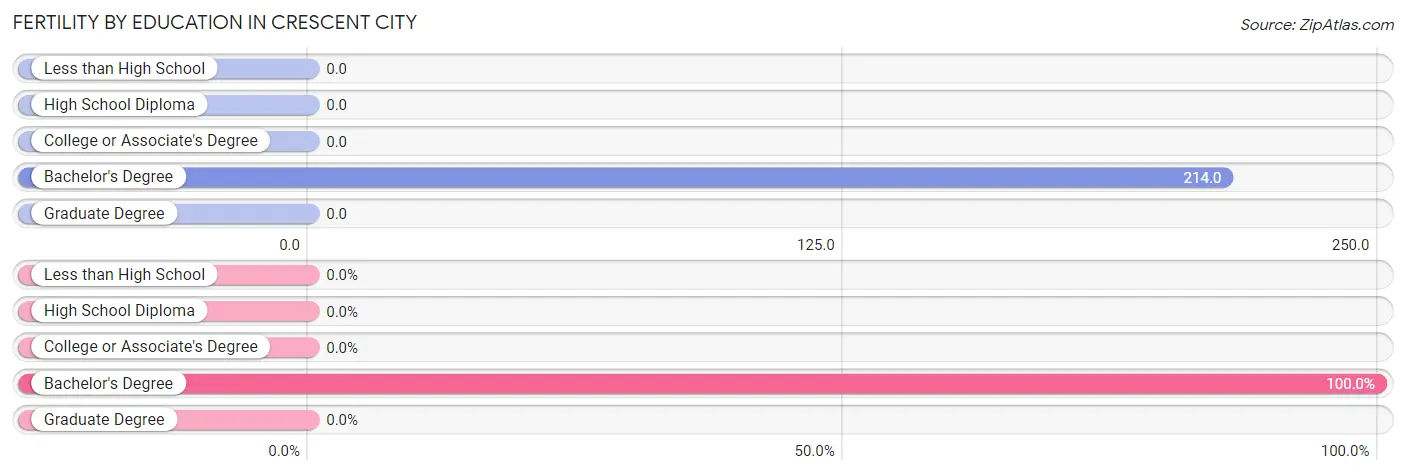
| Educational Attainment | Women with Births | Births / 1,000 Women |
| Less than High School | 0 (0.0%) | 0.0 |
| High School Diploma | 0 (0.0%) | 0.0 |
| College or Associate's Degree | 0 (0.0%) | 0.0 |
| Bachelor's Degree | 33 (100.0%) | 214.0 |
| Graduate Degree | 0 (0.0%) | 0.0 |
| Total | 33 (100.0%) | 35.0 |
Fertility by Education by Marriage Status in Crescent City
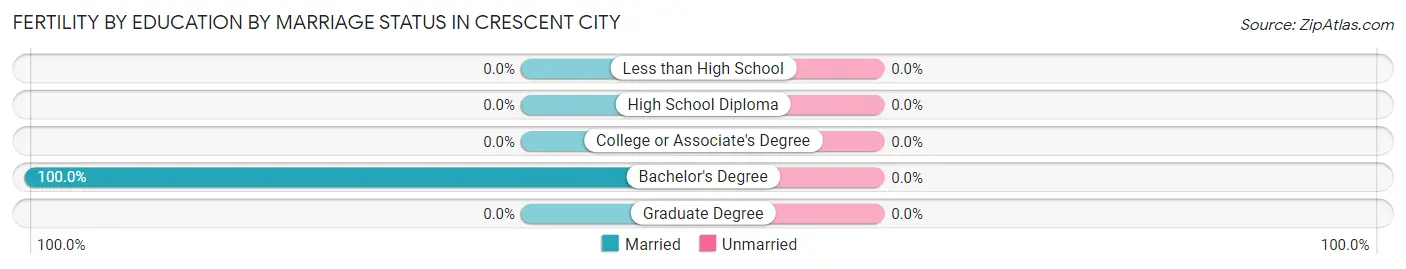
| Educational Attainment | Married | Unmarried |
| Less than High School | 0 (0.0%) | 0 (0.0%) |
| High School Diploma | 0 (0.0%) | 0 (0.0%) |
| College or Associate's Degree | 0 (0.0%) | 0 (0.0%) |
| Bachelor's Degree | 33 (100.0%) | 0 (0.0%) |
| Graduate Degree | 0 (0.0%) | 0 (0.0%) |
| Total | 33 (100.0%) | 0 (0.0%) |
Employment Characteristics in Crescent City
Employment by Class of Employer in Crescent City
Among the 1,641 employed individuals in Crescent City, private company employees (877 | 53.4%), local government employees (292 | 17.8%), and self-employed (not incorporated) (189 | 11.5%) make up the most common classes of employment.
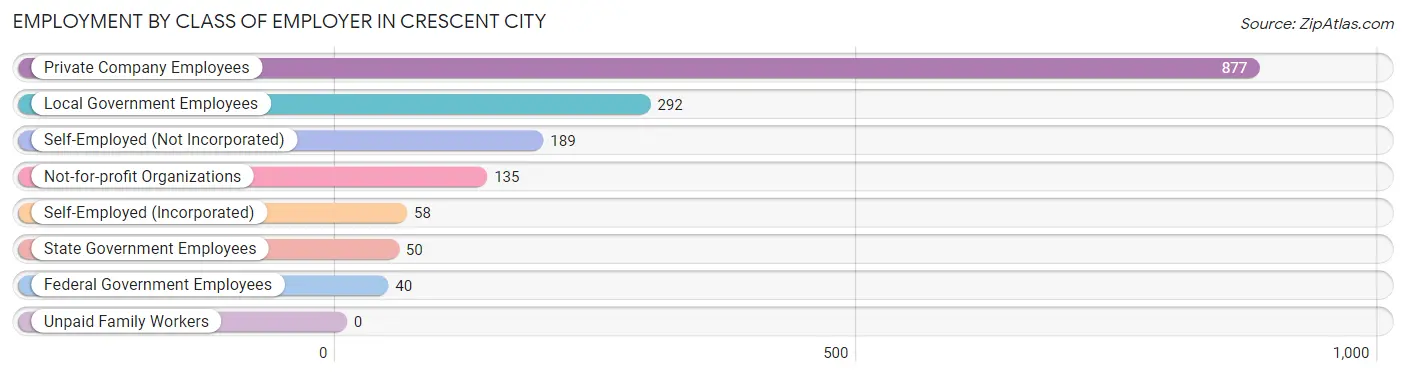
| Employer Class | # Employees | % Employees |
| Private Company Employees | 877 | 53.4% |
| Self-Employed (Incorporated) | 58 | 3.5% |
| Self-Employed (Not Incorporated) | 189 | 11.5% |
| Not-for-profit Organizations | 135 | 8.2% |
| Local Government Employees | 292 | 17.8% |
| State Government Employees | 50 | 3.0% |
| Federal Government Employees | 40 | 2.4% |
| Unpaid Family Workers | 0 | 0.0% |
| Total | 1,641 | 100.0% |
Employment Status by Age in Crescent City
According to the labor force statistics for Crescent City, out of the total population over 16 years of age (5,695), 32.3% or 1,839 individuals are in the labor force, with 7.9% or 145 of them unemployed. The age group with the highest labor force participation rate is 55 to 59 years, with 52.6% or 185 individuals in the labor force. Within the labor force, the 16 to 19 years age range has the highest percentage of unemployed individuals, with 75.0% or 45 of them being unemployed.
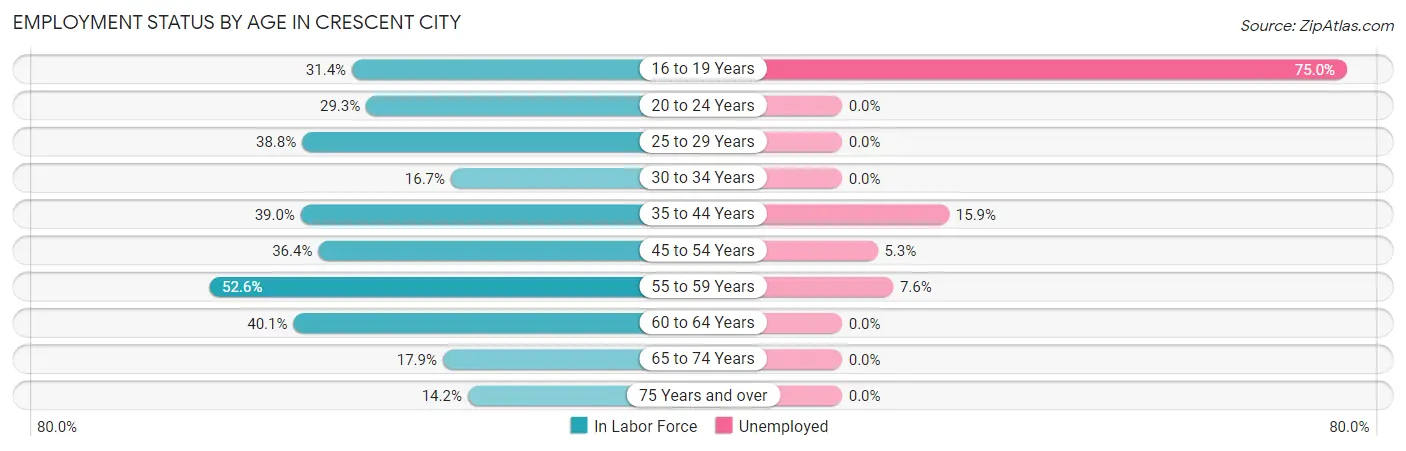
| Age Bracket | In Labor Force | Unemployed |
| 16 to 19 Years | 60 (31.4%) | 45 (75.0%) |
| 20 to 24 Years | 151 (29.3%) | 0 (0.0%) |
| 25 to 29 Years | 292 (38.8%) | 0 (0.0%) |
| 30 to 34 Years | 115 (16.7%) | 0 (0.0%) |
| 35 to 44 Years | 453 (39.0%) | 72 (15.9%) |
| 45 to 54 Years | 285 (36.4%) | 15 (5.3%) |
| 55 to 59 Years | 185 (52.6%) | 14 (7.6%) |
| 60 to 64 Years | 155 (40.1%) | 0 (0.0%) |
| 65 to 74 Years | 103 (17.9%) | 0 (0.0%) |
| 75 Years and over | 41 (14.2%) | 0 (0.0%) |
| Total | 1,839 (32.3%) | 145 (7.9%) |
Employment Status by Educational Attainment in Crescent City
According to labor force statistics for Crescent City, 36.0% of individuals (1,485) out of the total population between 25 and 64 years of age (4,124) are in the labor force, with 6.8% or 101 of them being unemployed. The group with the highest labor force participation rate are those with the educational attainment of bachelor's degree or higher, with 80.7% or 381 individuals in the labor force. Within the labor force, individuals with high school diploma education have the highest percentage of unemployment, with 18.0% or 57 of them being unemployed.
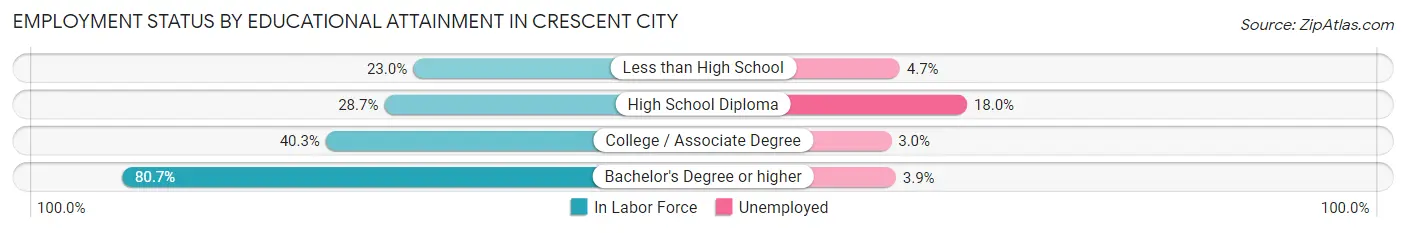
| Educational Attainment | In Labor Force | Unemployed |
| Less than High School | 319 (23.0%) | 65 (4.7%) |
| High School Diploma | 317 (28.7%) | 199 (18.0%) |
| College / Associate Degree | 469 (40.3%) | 35 (3.0%) |
| Bachelor's Degree or higher | 381 (80.7%) | 18 (3.9%) |
| Total | 1,485 (36.0%) | 280 (6.8%) |
Employment Occupations by Sex in Crescent City
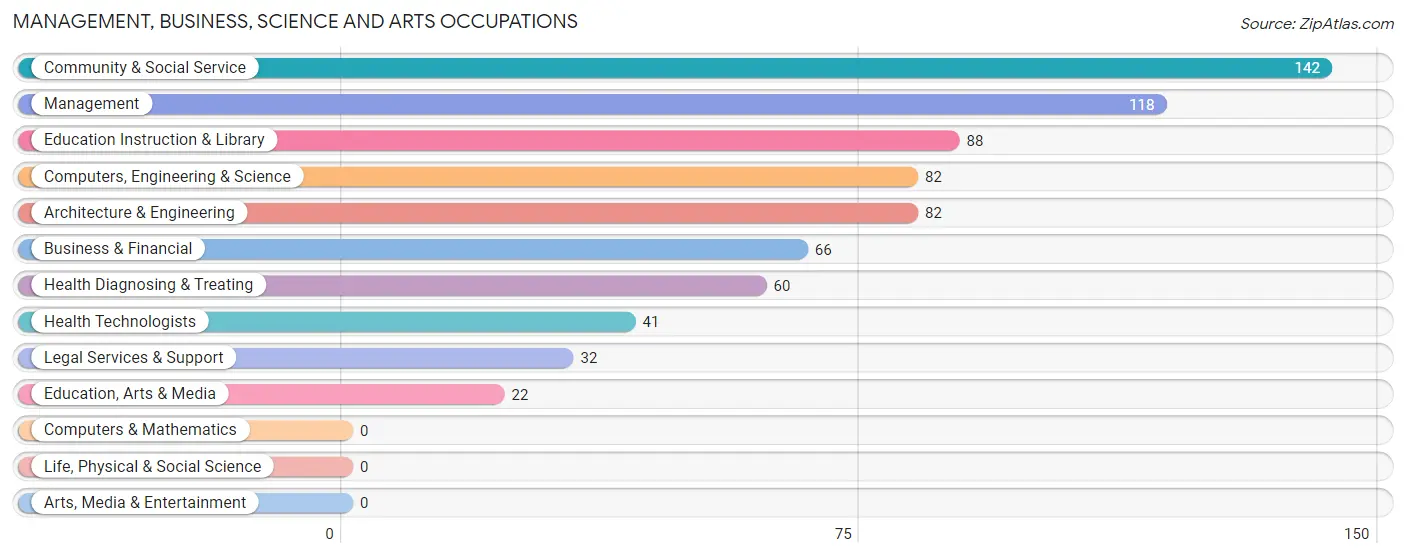
Management, Business, Science and Arts Occupations
The most common Management, Business, Science and Arts occupations in Crescent City are Community & Social Service (142 | 8.4%), Management (118 | 7.0%), Education Instruction & Library (88 | 5.2%), Computers, Engineering & Science (82 | 4.8%), and Architecture & Engineering (82 | 4.8%).
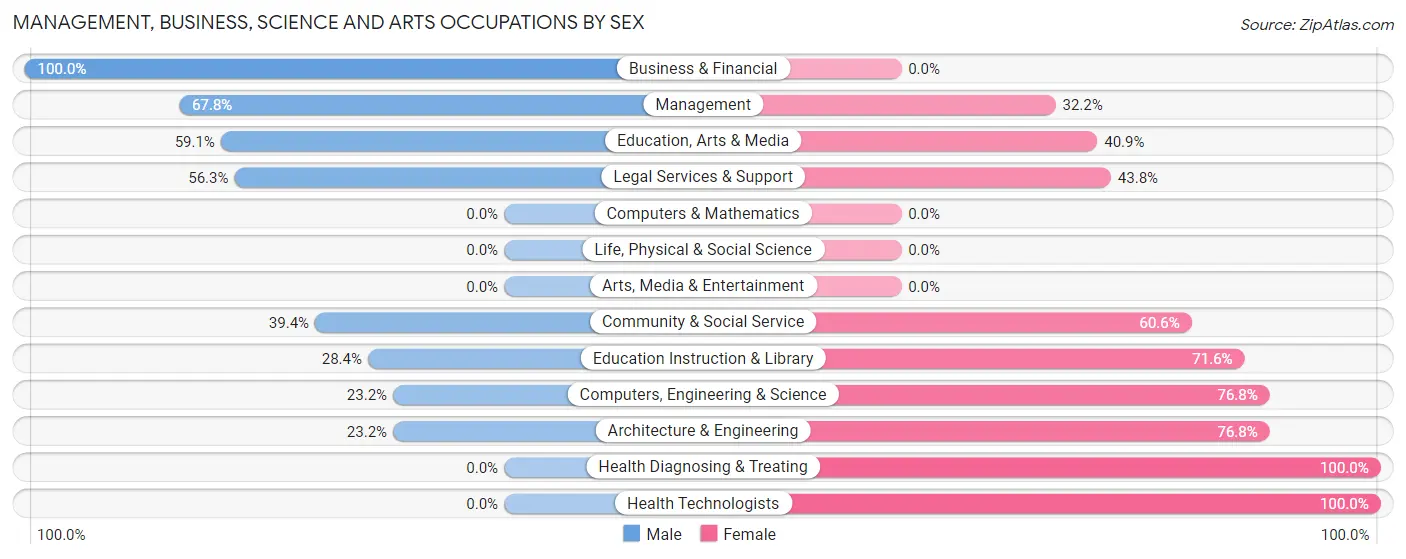
Management, Business, Science and Arts Occupations by Sex
Within the Management, Business, Science and Arts occupations in Crescent City, the most male-oriented occupations are Business & Financial (100.0%), Management (67.8%), and Education, Arts & Media (59.1%), while the most female-oriented occupations are Health Diagnosing & Treating (100.0%), Health Technologists (100.0%), and Computers, Engineering & Science (76.8%).
| Occupation | Male | Female |
| Management | 80 (67.8%) | 38 (32.2%) |
| Business & Financial | 66 (100.0%) | 0 (0.0%) |
| Computers, Engineering & Science | 19 (23.2%) | 63 (76.8%) |
| Computers & Mathematics | 0 (0.0%) | 0 (0.0%) |
| Architecture & Engineering | 19 (23.2%) | 63 (76.8%) |
| Life, Physical & Social Science | 0 (0.0%) | 0 (0.0%) |
| Community & Social Service | 56 (39.4%) | 86 (60.6%) |
| Education, Arts & Media | 13 (59.1%) | 9 (40.9%) |
| Legal Services & Support | 18 (56.2%) | 14 (43.8%) |
| Education Instruction & Library | 25 (28.4%) | 63 (71.6%) |
| Arts, Media & Entertainment | 0 (0.0%) | 0 (0.0%) |
| Health Diagnosing & Treating | 0 (0.0%) | 60 (100.0%) |
| Health Technologists | 0 (0.0%) | 41 (100.0%) |
| Total (Category) | 221 (47.2%) | 247 (52.8%) |
| Total (Overall) | 959 (56.6%) | 735 (43.4%) |
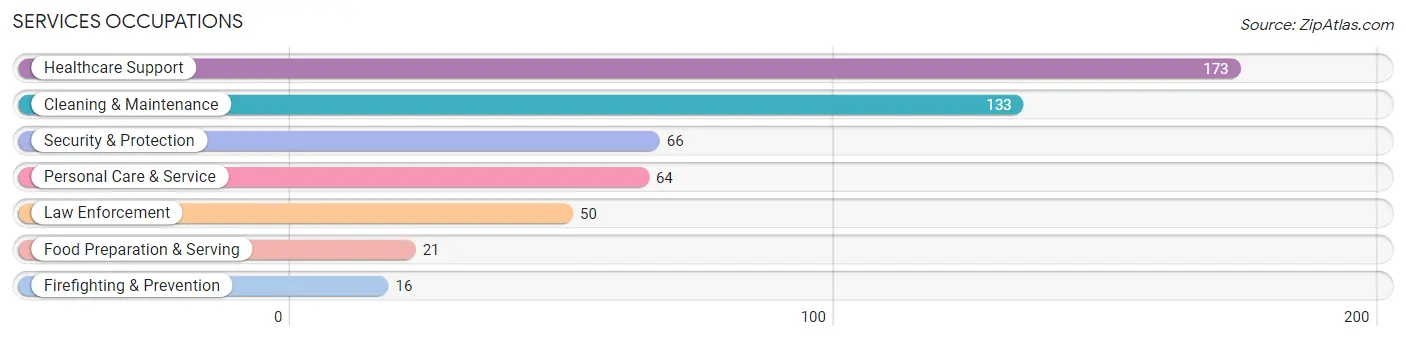
Services Occupations
The most common Services occupations in Crescent City are Healthcare Support (173 | 10.2%), Cleaning & Maintenance (133 | 7.9%), Security & Protection (66 | 3.9%), Personal Care & Service (64 | 3.8%), and Law Enforcement (50 | 2.9%).
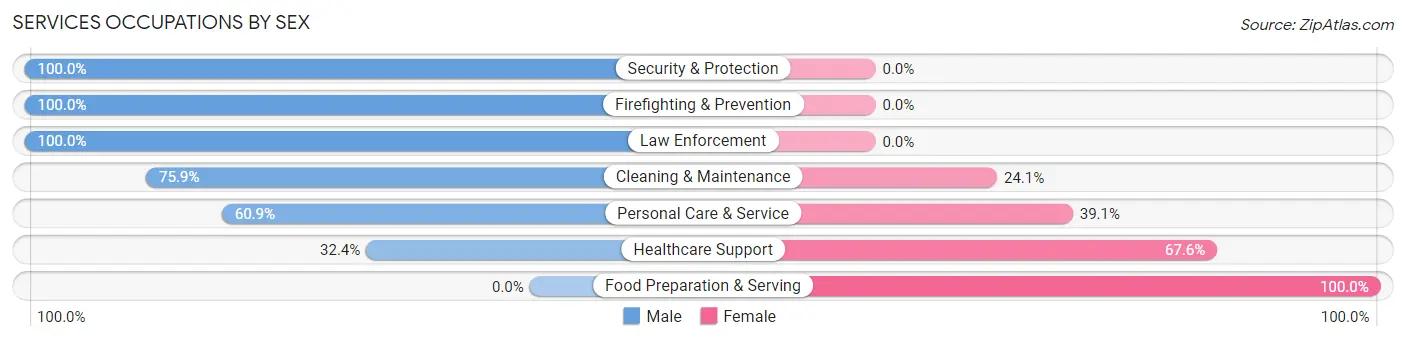
Services Occupations by Sex
Within the Services occupations in Crescent City, the most male-oriented occupations are Security & Protection (100.0%), Firefighting & Prevention (100.0%), and Law Enforcement (100.0%), while the most female-oriented occupations are Food Preparation & Serving (100.0%), Healthcare Support (67.6%), and Personal Care & Service (39.1%).
| Occupation | Male | Female |
| Healthcare Support | 56 (32.4%) | 117 (67.6%) |
| Security & Protection | 66 (100.0%) | 0 (0.0%) |
| Firefighting & Prevention | 16 (100.0%) | 0 (0.0%) |
| Law Enforcement | 50 (100.0%) | 0 (0.0%) |
| Food Preparation & Serving | 0 (0.0%) | 21 (100.0%) |
| Cleaning & Maintenance | 101 (75.9%) | 32 (24.1%) |
| Personal Care & Service | 39 (60.9%) | 25 (39.1%) |
| Total (Category) | 262 (57.3%) | 195 (42.7%) |
| Total (Overall) | 959 (56.6%) | 735 (43.4%) |
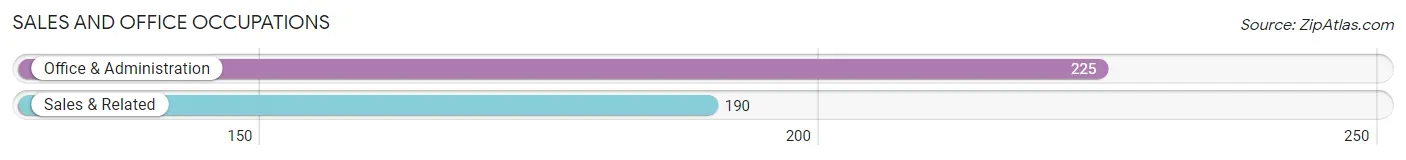
Sales and Office Occupations
The most common Sales and Office occupations in Crescent City are Office & Administration (225 | 13.3%), and Sales & Related (190 | 11.2%).
Sales and Office Occupations by Sex
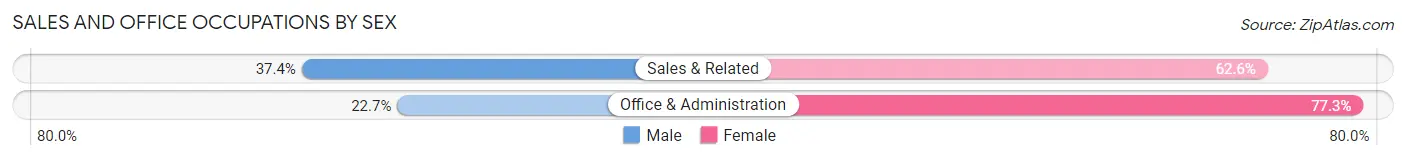
| Occupation | Male | Female |
| Sales & Related | 71 (37.4%) | 119 (62.6%) |
| Office & Administration | 51 (22.7%) | 174 (77.3%) |
| Total (Category) | 122 (29.4%) | 293 (70.6%) |
| Total (Overall) | 959 (56.6%) | 735 (43.4%) |
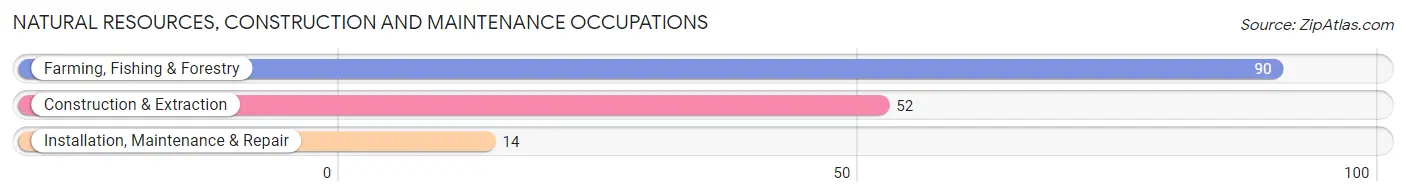
Natural Resources, Construction and Maintenance Occupations
The most common Natural Resources, Construction and Maintenance occupations in Crescent City are Farming, Fishing & Forestry (90 | 5.3%), Construction & Extraction (52 | 3.1%), and Installation, Maintenance & Repair (14 | 0.8%).
Natural Resources, Construction and Maintenance Occupations by Sex
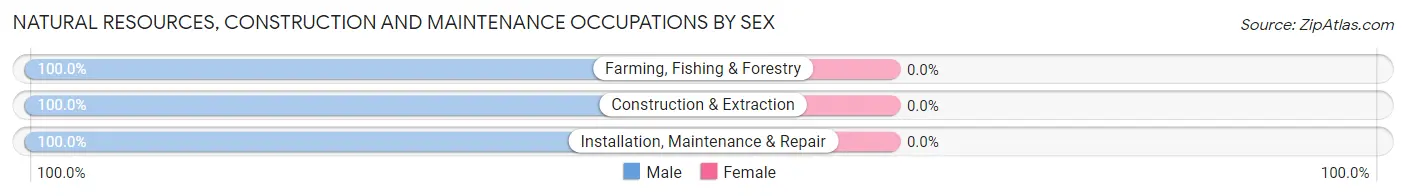
| Occupation | Male | Female |
| Farming, Fishing & Forestry | 90 (100.0%) | 0 (0.0%) |
| Construction & Extraction | 52 (100.0%) | 0 (0.0%) |
| Installation, Maintenance & Repair | 14 (100.0%) | 0 (0.0%) |
| Total (Category) | 156 (100.0%) | 0 (0.0%) |
| Total (Overall) | 959 (56.6%) | 735 (43.4%) |
Production, Transportation and Moving Occupations
The most common Production, Transportation and Moving occupations in Crescent City are Material Moving (84 | 5.0%), Transportation (77 | 4.5%), and Production (37 | 2.2%).
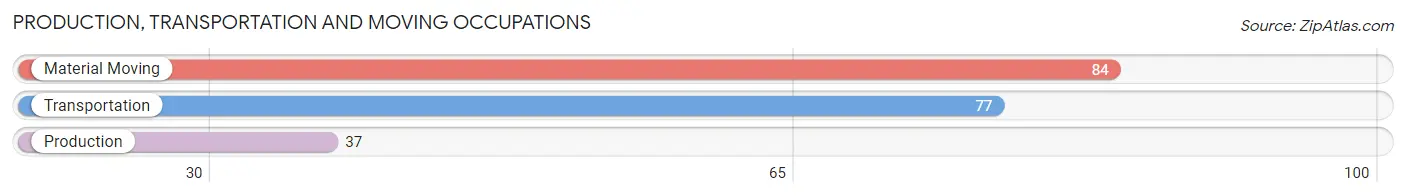
Production, Transportation and Moving Occupations by Sex
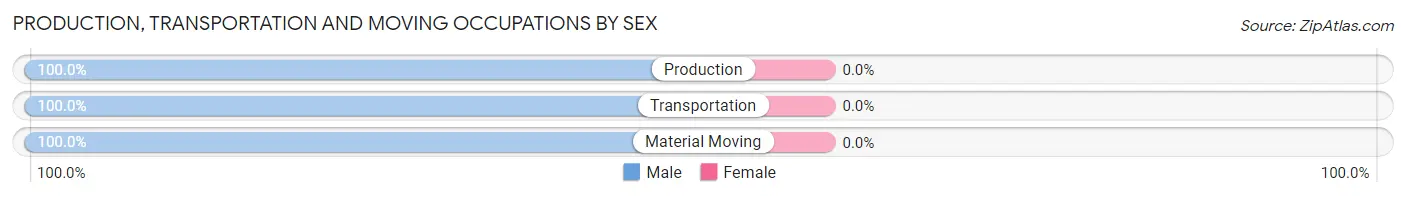
| Occupation | Male | Female |
| Production | 37 (100.0%) | 0 (0.0%) |
| Transportation | 77 (100.0%) | 0 (0.0%) |
| Material Moving | 84 (100.0%) | 0 (0.0%) |
| Total (Category) | 198 (100.0%) | 0 (0.0%) |
| Total (Overall) | 959 (56.6%) | 735 (43.4%) |
Employment Industries by Sex in Crescent City
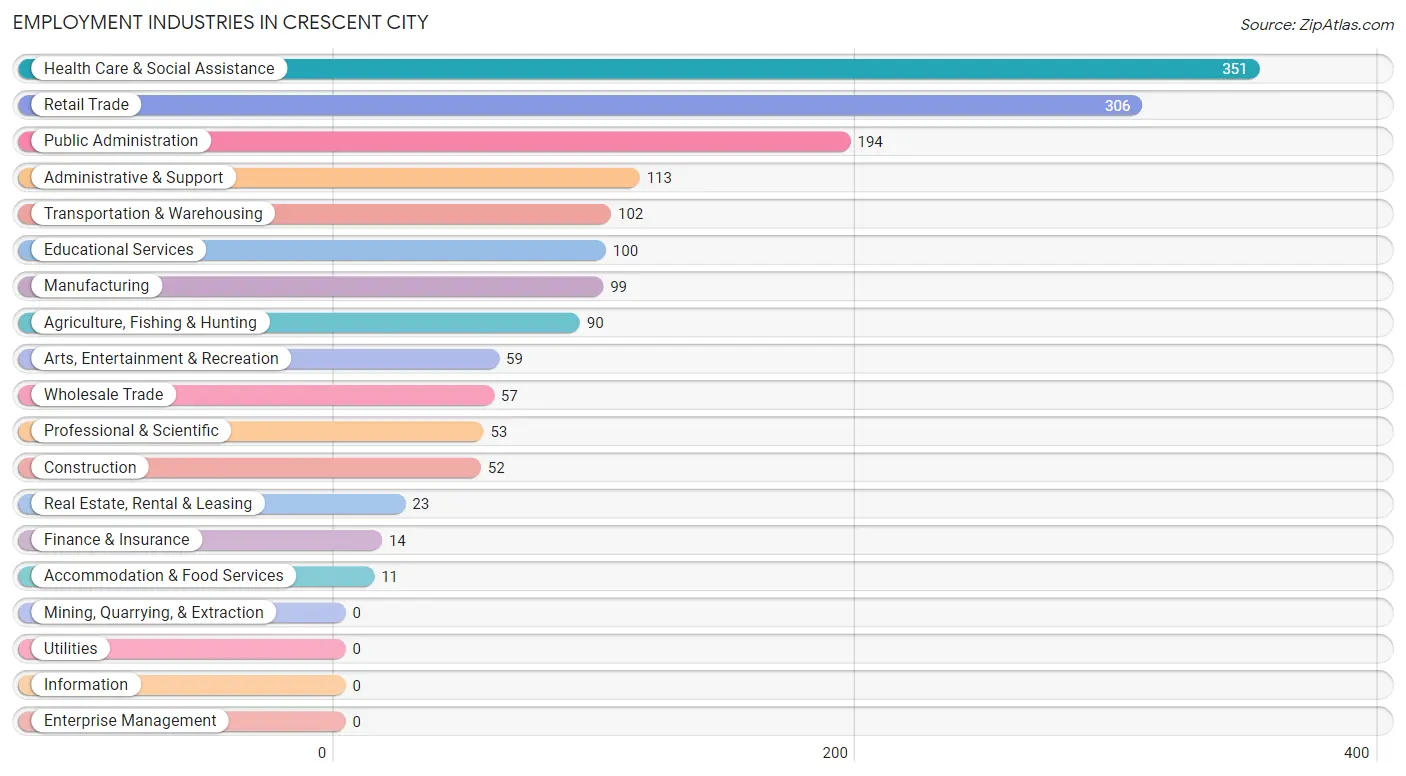
Employment Industries in Crescent City
The major employment industries in Crescent City include Health Care & Social Assistance (351 | 20.7%), Retail Trade (306 | 18.1%), Public Administration (194 | 11.5%), Administrative & Support (113 | 6.7%), and Transportation & Warehousing (102 | 6.0%).
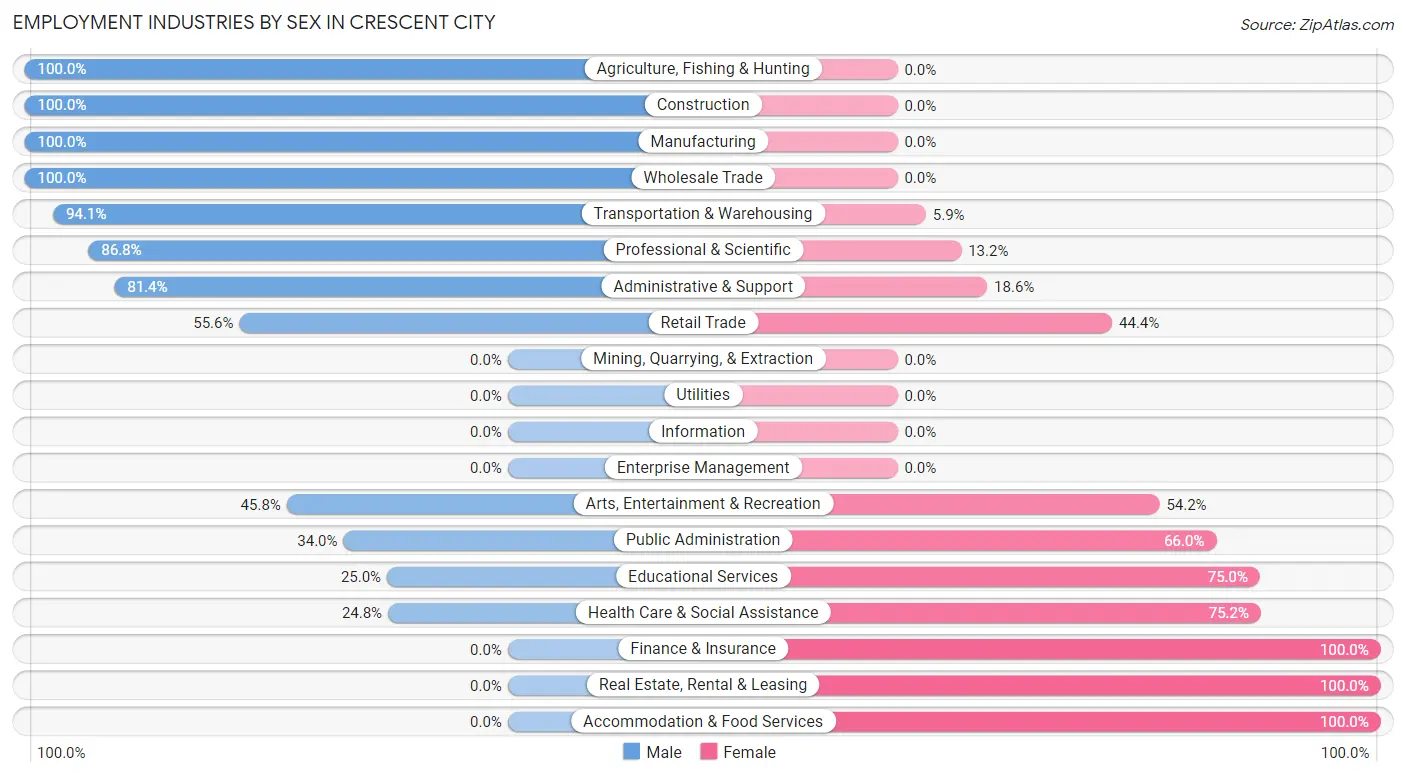
Employment Industries by Sex in Crescent City
The Crescent City industries that see more men than women are Agriculture, Fishing & Hunting (100.0%), Construction (100.0%), and Manufacturing (100.0%), whereas the industries that tend to have a higher number of women are Finance & Insurance (100.0%), Real Estate, Rental & Leasing (100.0%), and Accommodation & Food Services (100.0%).
| Industry | Male | Female |
| Agriculture, Fishing & Hunting | 90 (100.0%) | 0 (0.0%) |
| Mining, Quarrying, & Extraction | 0 (0.0%) | 0 (0.0%) |
| Construction | 52 (100.0%) | 0 (0.0%) |
| Manufacturing | 99 (100.0%) | 0 (0.0%) |
| Wholesale Trade | 57 (100.0%) | 0 (0.0%) |
| Retail Trade | 170 (55.6%) | 136 (44.4%) |
| Transportation & Warehousing | 96 (94.1%) | 6 (5.9%) |
| Utilities | 0 (0.0%) | 0 (0.0%) |
| Information | 0 (0.0%) | 0 (0.0%) |
| Finance & Insurance | 0 (0.0%) | 14 (100.0%) |
| Real Estate, Rental & Leasing | 0 (0.0%) | 23 (100.0%) |
| Professional & Scientific | 46 (86.8%) | 7 (13.2%) |
| Enterprise Management | 0 (0.0%) | 0 (0.0%) |
| Administrative & Support | 92 (81.4%) | 21 (18.6%) |
| Educational Services | 25 (25.0%) | 75 (75.0%) |
| Health Care & Social Assistance | 87 (24.8%) | 264 (75.2%) |
| Arts, Entertainment & Recreation | 27 (45.8%) | 32 (54.2%) |
| Accommodation & Food Services | 0 (0.0%) | 11 (100.0%) |
| Public Administration | 66 (34.0%) | 128 (66.0%) |
| Total | 959 (56.6%) | 735 (43.4%) |
Education in Crescent City
School Enrollment in Crescent City
The most common levels of schooling among the 1,297 students in Crescent City are high school (507 | 39.1%), college / undergraduate (338 | 26.1%), and elementary school (198 | 15.3%).
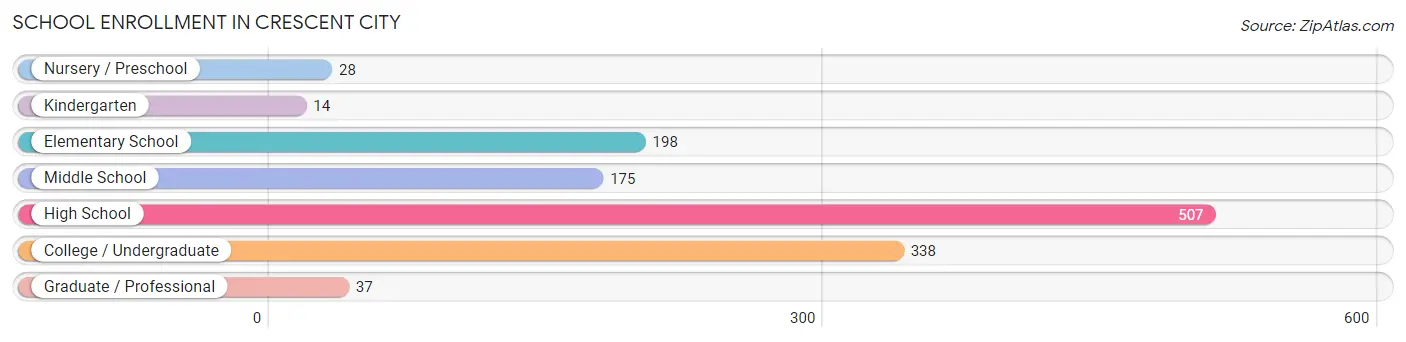
| School Level | # Students | % Students |
| Nursery / Preschool | 28 | 2.2% |
| Kindergarten | 14 | 1.1% |
| Elementary School | 198 | 15.3% |
| Middle School | 175 | 13.5% |
| High School | 507 | 39.1% |
| College / Undergraduate | 338 | 26.1% |
| Graduate / Professional | 37 | 2.9% |
| Total | 1,297 | 100.0% |
School Enrollment by Age by Funding Source in Crescent City
Out of a total of 1,297 students who are enrolled in schools in Crescent City, 236 (18.2%) attend a private institution, while the remaining 1,061 (81.8%) are enrolled in public schools. The age group of 3 to 4 year olds has the highest likelihood of being enrolled in private schools, with 11 (100.0% in the age bracket) enrolled. Conversely, the age group of 20 to 24 year olds has the lowest likelihood of being enrolled in a private school, with 99 (93.4% in the age bracket) attending a public institution.
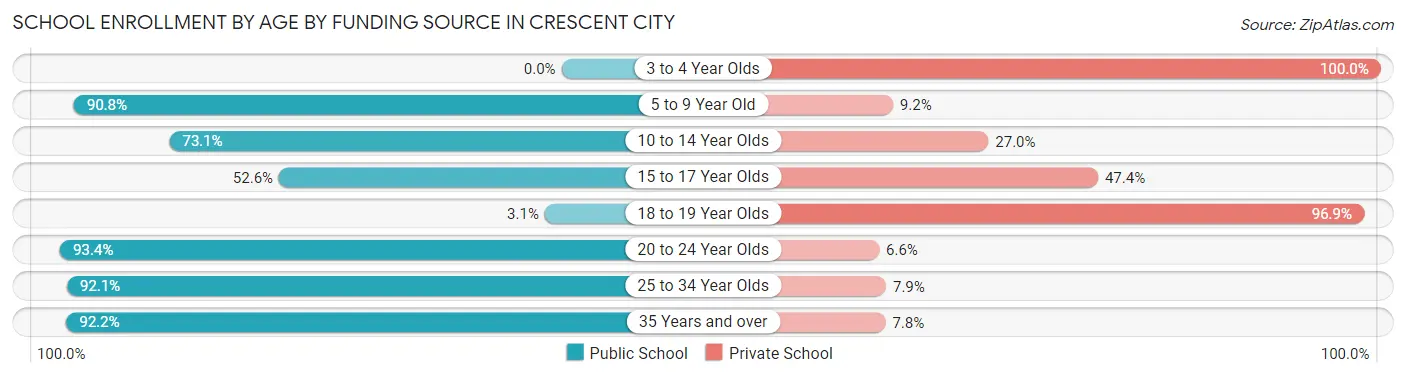
| Age Bracket | Public School | Private School |
| 3 to 4 Year Olds | 0 (0.0%) | 11 (100.0%) |
| 5 to 9 Year Old | 208 (90.8%) | 21 (9.2%) |
| 10 to 14 Year Olds | 187 (73.1%) | 69 (27.0%) |
| 15 to 17 Year Olds | 60 (52.6%) | 54 (47.4%) |
| 18 to 19 Year Olds | 1 (3.1%) | 31 (96.9%) |
| 20 to 24 Year Olds | 99 (93.4%) | 7 (6.6%) |
| 25 to 34 Year Olds | 257 (92.1%) | 22 (7.9%) |
| 35 Years and over | 249 (92.2%) | 21 (7.8%) |
| Total | 1,061 (81.8%) | 236 (18.2%) |
Educational Attainment by Field of Study in Crescent City
Social sciences (202 | 22.3%), education (197 | 21.7%), engineering (166 | 18.3%), bio, nature & agricultural (99 | 10.9%), and business (53 | 5.8%) are the most common fields of study among 908 individuals in Crescent City who have obtained a bachelor's degree or higher.
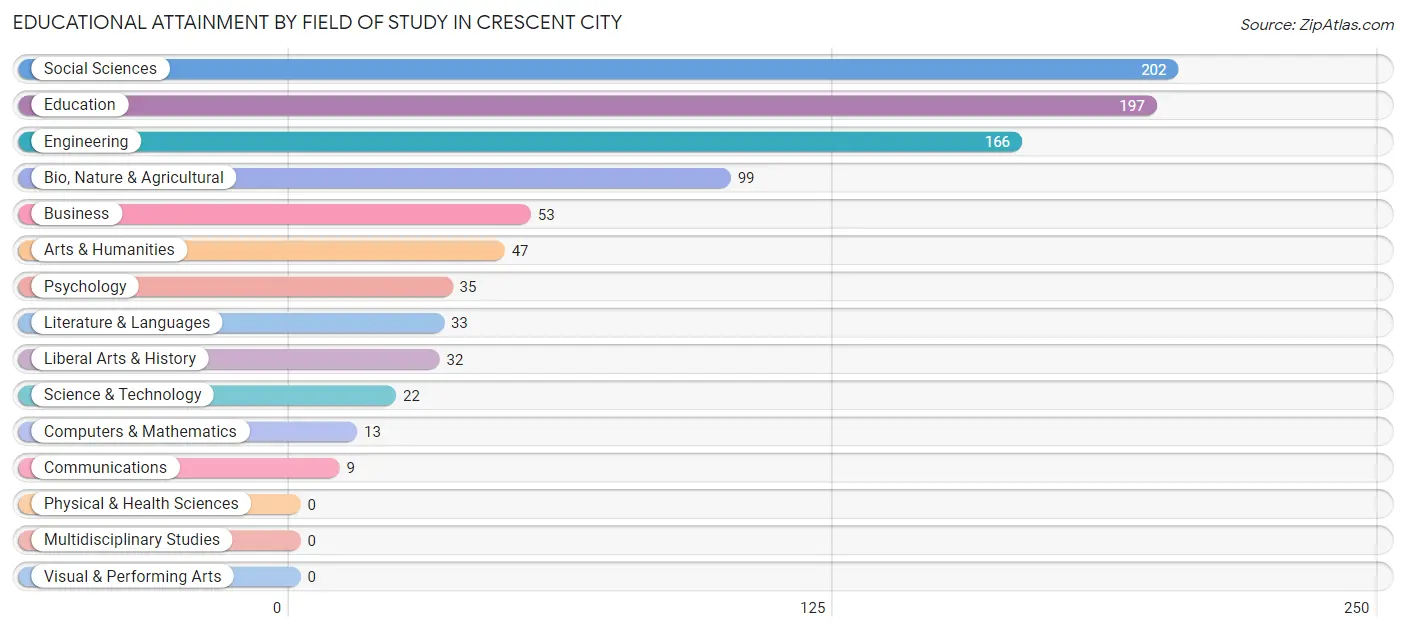
| Field of Study | # Graduates | % Graduates |
| Computers & Mathematics | 13 | 1.4% |
| Bio, Nature & Agricultural | 99 | 10.9% |
| Physical & Health Sciences | 0 | 0.0% |
| Psychology | 35 | 3.8% |
| Social Sciences | 202 | 22.3% |
| Engineering | 166 | 18.3% |
| Multidisciplinary Studies | 0 | 0.0% |
| Science & Technology | 22 | 2.4% |
| Business | 53 | 5.8% |
| Education | 197 | 21.7% |
| Literature & Languages | 33 | 3.6% |
| Liberal Arts & History | 32 | 3.5% |
| Visual & Performing Arts | 0 | 0.0% |
| Communications | 9 | 1.0% |
| Arts & Humanities | 47 | 5.2% |
| Total | 908 | 100.0% |
Transportation & Commute in Crescent City
Vehicle Availability by Sex in Crescent City
The most prevalent vehicle ownership categories in Crescent City are males with 1 vehicle (433, accounting for 46.1%) and females with 1 vehicle (338, making up 61.7%).
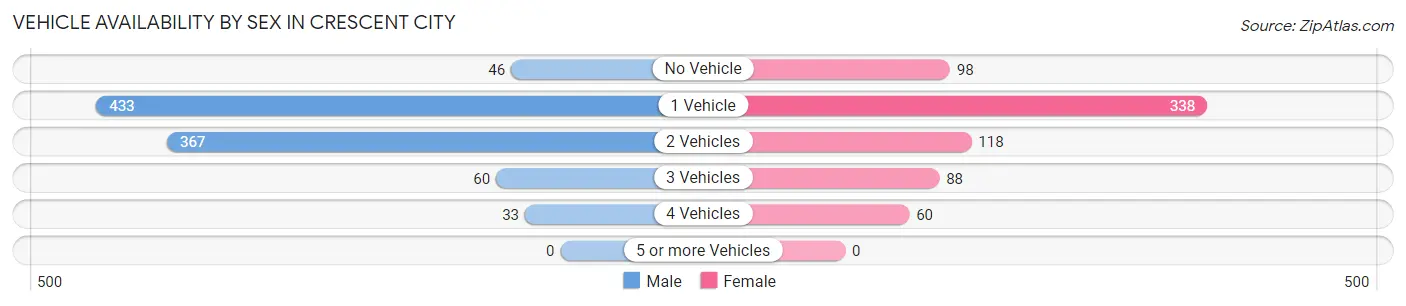
| Vehicles Available | Male | Female |
| No Vehicle | 46 (4.9%) | 98 (14.0%) |
| 1 Vehicle | 433 (46.1%) | 338 (48.1%) |
| 2 Vehicles | 367 (39.1%) | 118 (16.8%) |
| 3 Vehicles | 60 (6.4%) | 88 (12.5%) |
| 4 Vehicles | 33 (3.5%) | 60 (8.6%) |
| 5 or more Vehicles | 0 (0.0%) | 0 (0.0%) |
| Total | 939 (100.0%) | 702 (100.0%) |
Commute Time in Crescent City
The most frequently occuring commute durations in Crescent City are 5 to 9 minutes (520 commuters, 34.5%), 10 to 14 minutes (339 commuters, 22.5%), and 15 to 19 minutes (180 commuters, 12.0%).
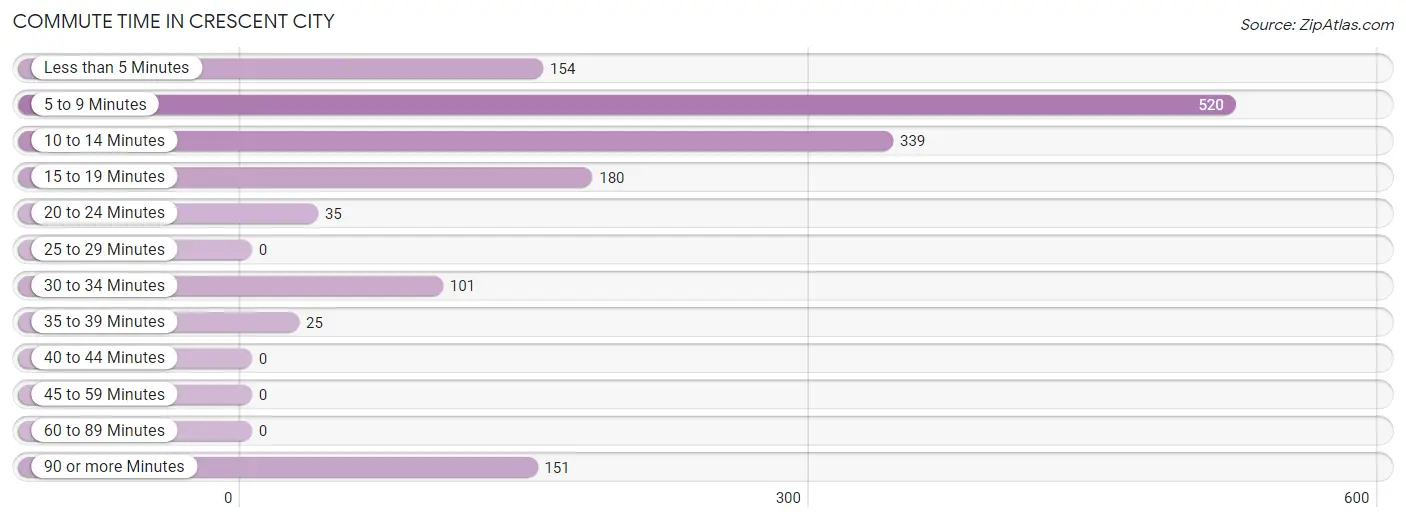
| Commute Time | # Commuters | % Commuters |
| Less than 5 Minutes | 154 | 10.2% |
| 5 to 9 Minutes | 520 | 34.5% |
| 10 to 14 Minutes | 339 | 22.5% |
| 15 to 19 Minutes | 180 | 12.0% |
| 20 to 24 Minutes | 35 | 2.3% |
| 25 to 29 Minutes | 0 | 0.0% |
| 30 to 34 Minutes | 101 | 6.7% |
| 35 to 39 Minutes | 25 | 1.7% |
| 40 to 44 Minutes | 0 | 0.0% |
| 45 to 59 Minutes | 0 | 0.0% |
| 60 to 89 Minutes | 0 | 0.0% |
| 90 or more Minutes | 151 | 10.0% |
Commute Time by Sex in Crescent City
The most common commute times in Crescent City are 5 to 9 minutes (276 commuters, 32.1%) for males and 10 to 14 minutes (287 commuters, 44.4%) for females.
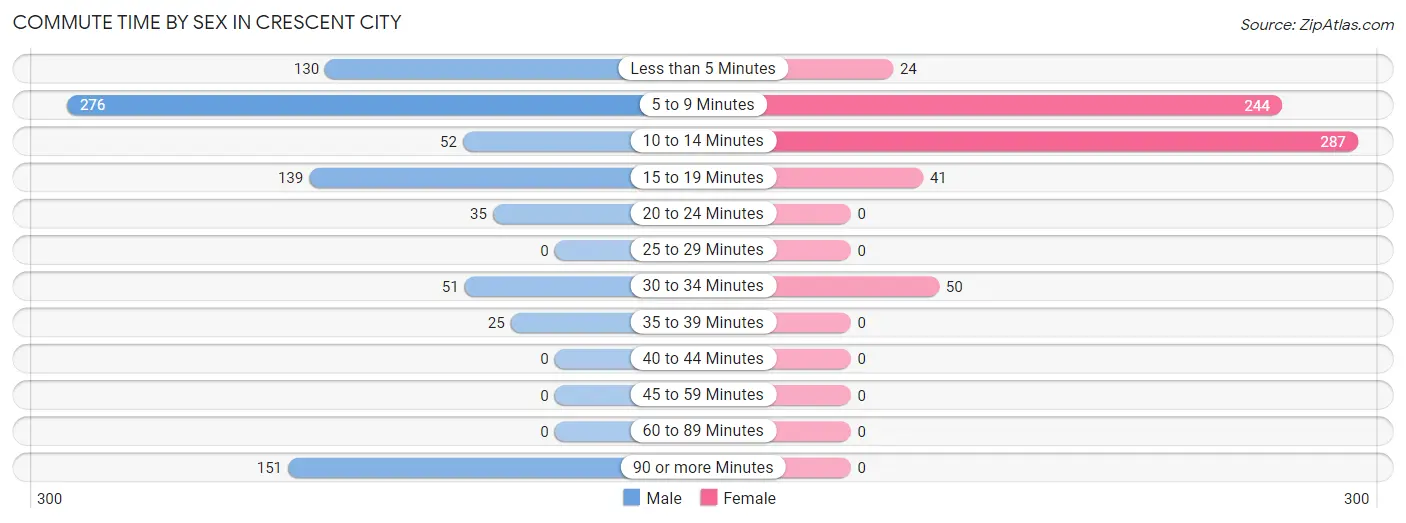
| Commute Time | Male | Female |
| Less than 5 Minutes | 130 (15.1%) | 24 (3.7%) |
| 5 to 9 Minutes | 276 (32.1%) | 244 (37.8%) |
| 10 to 14 Minutes | 52 (6.0%) | 287 (44.4%) |
| 15 to 19 Minutes | 139 (16.2%) | 41 (6.4%) |
| 20 to 24 Minutes | 35 (4.1%) | 0 (0.0%) |
| 25 to 29 Minutes | 0 (0.0%) | 0 (0.0%) |
| 30 to 34 Minutes | 51 (5.9%) | 50 (7.7%) |
| 35 to 39 Minutes | 25 (2.9%) | 0 (0.0%) |
| 40 to 44 Minutes | 0 (0.0%) | 0 (0.0%) |
| 45 to 59 Minutes | 0 (0.0%) | 0 (0.0%) |
| 60 to 89 Minutes | 0 (0.0%) | 0 (0.0%) |
| 90 or more Minutes | 151 (17.6%) | 0 (0.0%) |
Time of Departure to Work by Sex in Crescent City
The most frequent times of departure to work in Crescent City are 5:00 AM to 5:29 AM (128, 14.9%) for males and 7:30 AM to 7:59 AM (248, 38.4%) for females.
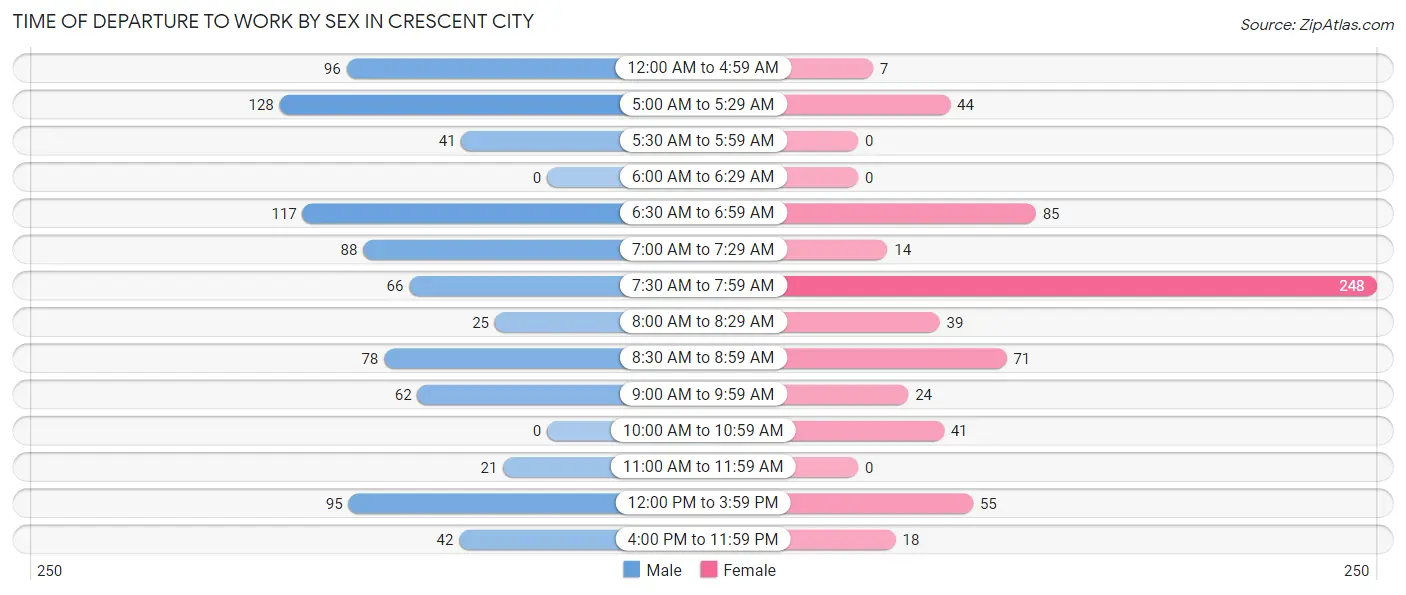
| Time of Departure | Male | Female |
| 12:00 AM to 4:59 AM | 96 (11.2%) | 7 (1.1%) |
| 5:00 AM to 5:29 AM | 128 (14.9%) | 44 (6.8%) |
| 5:30 AM to 5:59 AM | 41 (4.8%) | 0 (0.0%) |
| 6:00 AM to 6:29 AM | 0 (0.0%) | 0 (0.0%) |
| 6:30 AM to 6:59 AM | 117 (13.6%) | 85 (13.2%) |
| 7:00 AM to 7:29 AM | 88 (10.2%) | 14 (2.2%) |
| 7:30 AM to 7:59 AM | 66 (7.7%) | 248 (38.4%) |
| 8:00 AM to 8:29 AM | 25 (2.9%) | 39 (6.0%) |
| 8:30 AM to 8:59 AM | 78 (9.1%) | 71 (11.0%) |
| 9:00 AM to 9:59 AM | 62 (7.2%) | 24 (3.7%) |
| 10:00 AM to 10:59 AM | 0 (0.0%) | 41 (6.4%) |
| 11:00 AM to 11:59 AM | 21 (2.4%) | 0 (0.0%) |
| 12:00 PM to 3:59 PM | 95 (11.1%) | 55 (8.5%) |
| 4:00 PM to 11:59 PM | 42 (4.9%) | 18 (2.8%) |
| Total | 859 (100.0%) | 646 (100.0%) |
Housing Occupancy in Crescent City
Occupancy by Ownership in Crescent City
Of the total 2,029 dwellings in Crescent City, owner-occupied units account for 741 (36.5%), while renter-occupied units make up 1,288 (63.5%).
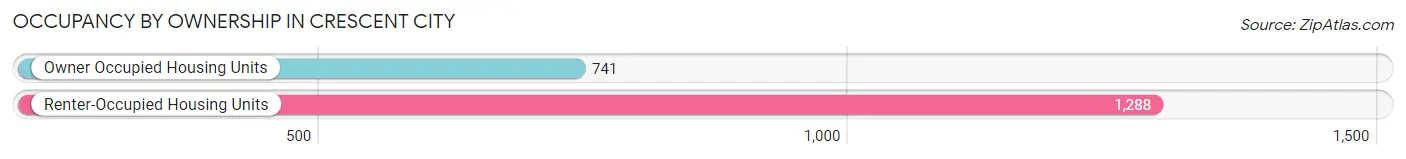
| Occupancy | # Housing Units | % Housing Units |
| Owner Occupied Housing Units | 741 | 36.5% |
| Renter-Occupied Housing Units | 1,288 | 63.5% |
| Total Occupied Housing Units | 2,029 | 100.0% |
Occupancy by Household Size in Crescent City
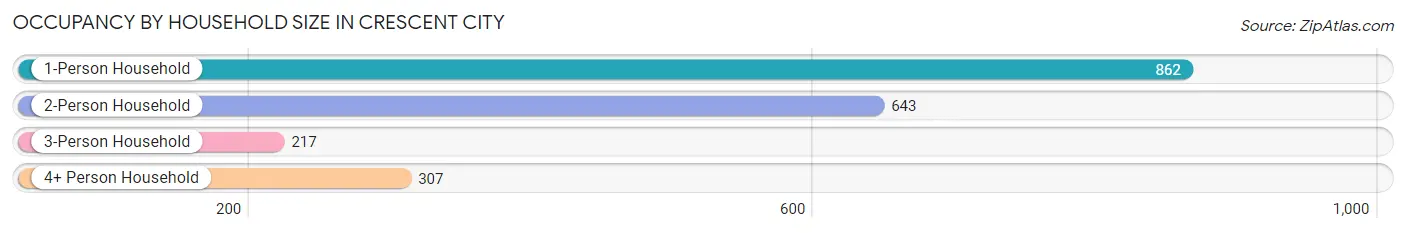
| Household Size | # Housing Units | % Housing Units |
| 1-Person Household | 862 | 42.5% |
| 2-Person Household | 643 | 31.7% |
| 3-Person Household | 217 | 10.7% |
| 4+ Person Household | 307 | 15.1% |
| Total Housing Units | 2,029 | 100.0% |
Occupancy by Ownership by Household Size in Crescent City
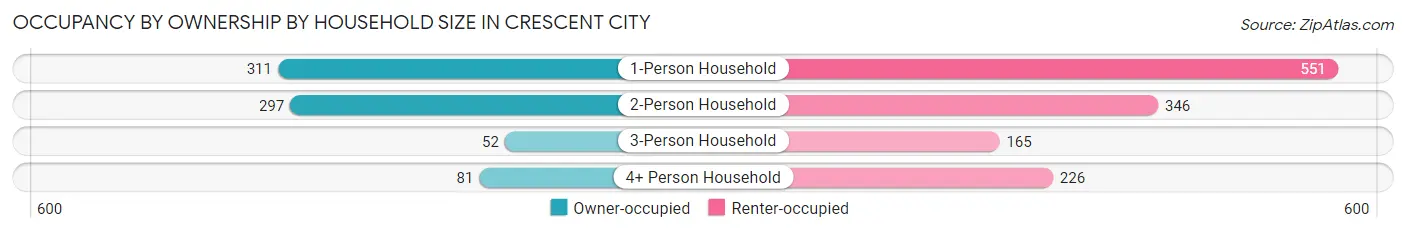
| Household Size | Owner-occupied | Renter-occupied |
| 1-Person Household | 311 (36.1%) | 551 (63.9%) |
| 2-Person Household | 297 (46.2%) | 346 (53.8%) |
| 3-Person Household | 52 (24.0%) | 165 (76.0%) |
| 4+ Person Household | 81 (26.4%) | 226 (73.6%) |
| Total Housing Units | 741 (36.5%) | 1,288 (63.5%) |
Occupancy by Educational Attainment in Crescent City
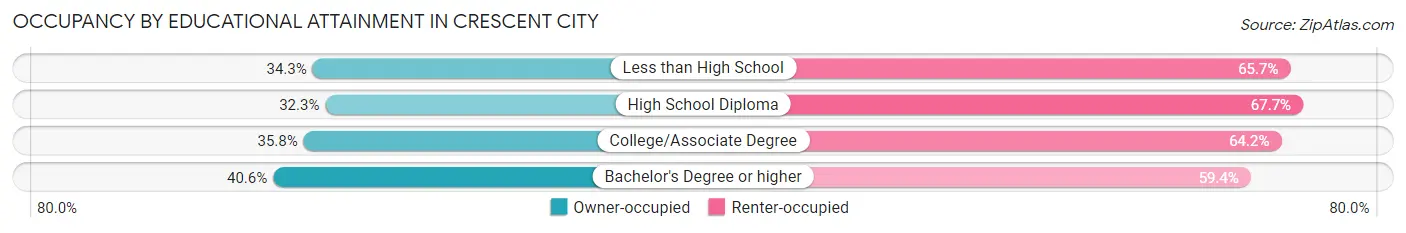
| Household Size | Owner-occupied | Renter-occupied |
| Less than High School | 160 (34.3%) | 306 (65.7%) |
| High School Diploma | 64 (32.3%) | 134 (67.7%) |
| College/Associate Degree | 275 (35.8%) | 494 (64.2%) |
| Bachelor's Degree or higher | 242 (40.6%) | 354 (59.4%) |
Occupancy by Age of Householder in Crescent City
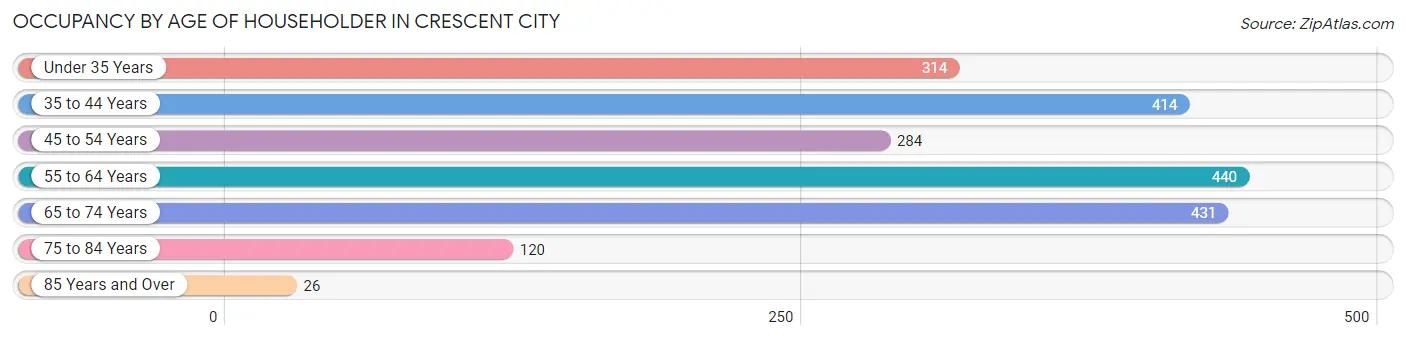
| Age Bracket | # Households | % Households |
| Under 35 Years | 314 | 15.5% |
| 35 to 44 Years | 414 | 20.4% |
| 45 to 54 Years | 284 | 14.0% |
| 55 to 64 Years | 440 | 21.7% |
| 65 to 74 Years | 431 | 21.2% |
| 75 to 84 Years | 120 | 5.9% |
| 85 Years and Over | 26 | 1.3% |
| Total | 2,029 | 100.0% |
Housing Finances in Crescent City
Median Income by Occupancy in Crescent City
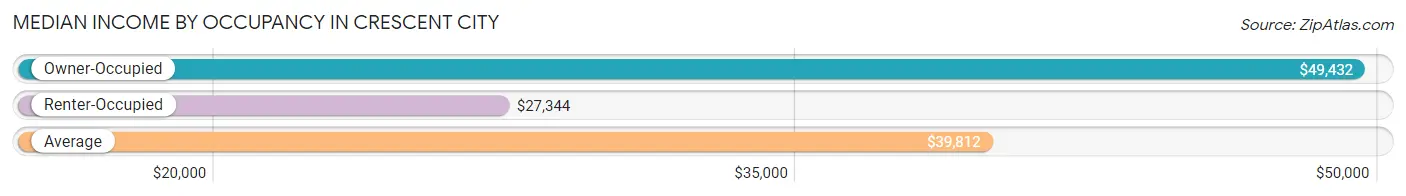
| Occupancy Type | # Households | Median Income |
| Owner-Occupied | 741 (36.5%) | $49,432 |
| Renter-Occupied | 1,288 (63.5%) | $27,344 |
| Average | 2,029 (100.0%) | $39,812 |
Occupancy by Householder Income Bracket in Crescent City
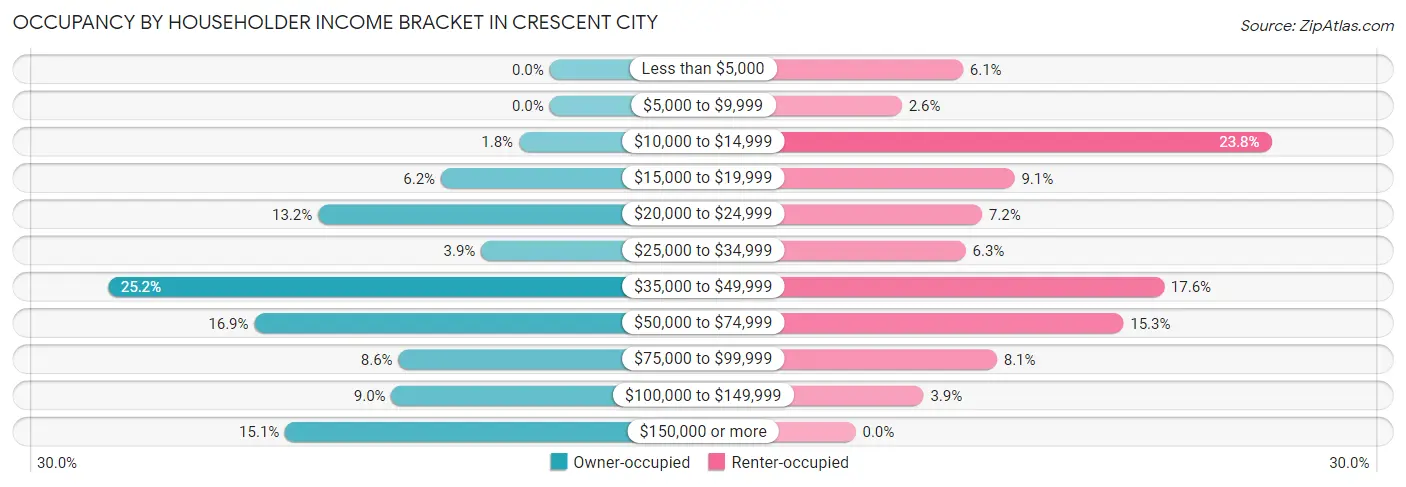
| Income Bracket | Owner-occupied | Renter-occupied |
| Less than $5,000 | 0 (0.0%) | 79 (6.1%) |
| $5,000 to $9,999 | 0 (0.0%) | 34 (2.6%) |
| $10,000 to $14,999 | 13 (1.8%) | 306 (23.8%) |
| $15,000 to $19,999 | 46 (6.2%) | 117 (9.1%) |
| $20,000 to $24,999 | 98 (13.2%) | 93 (7.2%) |
| $25,000 to $34,999 | 29 (3.9%) | 81 (6.3%) |
| $35,000 to $49,999 | 187 (25.2%) | 227 (17.6%) |
| $50,000 to $74,999 | 125 (16.9%) | 197 (15.3%) |
| $75,000 to $99,999 | 64 (8.6%) | 104 (8.1%) |
| $100,000 to $149,999 | 67 (9.0%) | 50 (3.9%) |
| $150,000 or more | 112 (15.1%) | 0 (0.0%) |
| Total | 741 (100.0%) | 1,288 (100.0%) |
Monthly Housing Cost Tiers in Crescent City
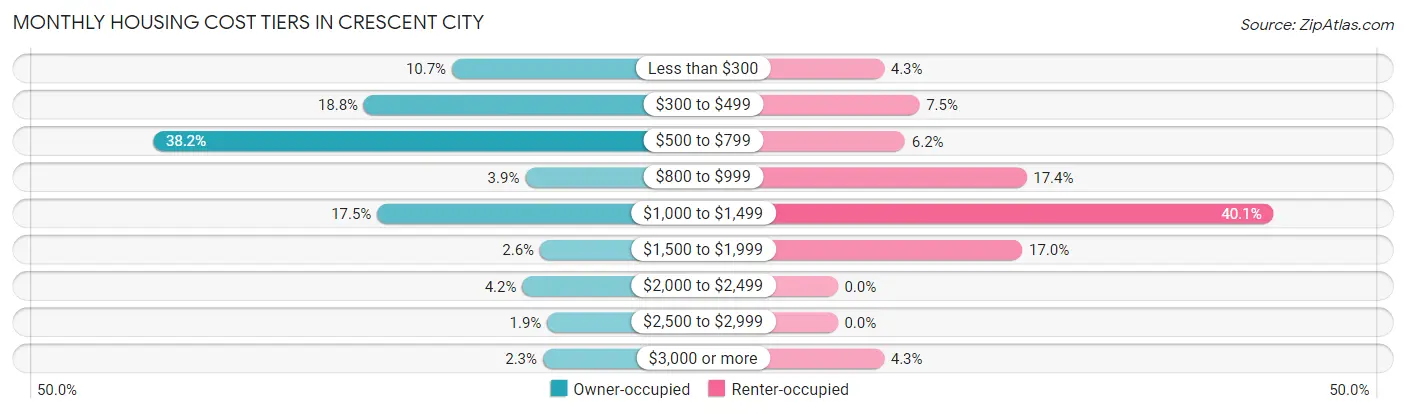
| Monthly Cost | Owner-occupied | Renter-occupied |
| Less than $300 | 79 (10.7%) | 55 (4.3%) |
| $300 to $499 | 139 (18.8%) | 97 (7.5%) |
| $500 to $799 | 283 (38.2%) | 80 (6.2%) |
| $800 to $999 | 29 (3.9%) | 224 (17.4%) |
| $1,000 to $1,499 | 130 (17.5%) | 517 (40.1%) |
| $1,500 to $1,999 | 19 (2.6%) | 219 (17.0%) |
| $2,000 to $2,499 | 31 (4.2%) | 0 (0.0%) |
| $2,500 to $2,999 | 14 (1.9%) | 0 (0.0%) |
| $3,000 or more | 17 (2.3%) | 55 (4.3%) |
| Total | 741 (100.0%) | 1,288 (100.0%) |
Physical Housing Characteristics in Crescent City
Housing Structures in Crescent City
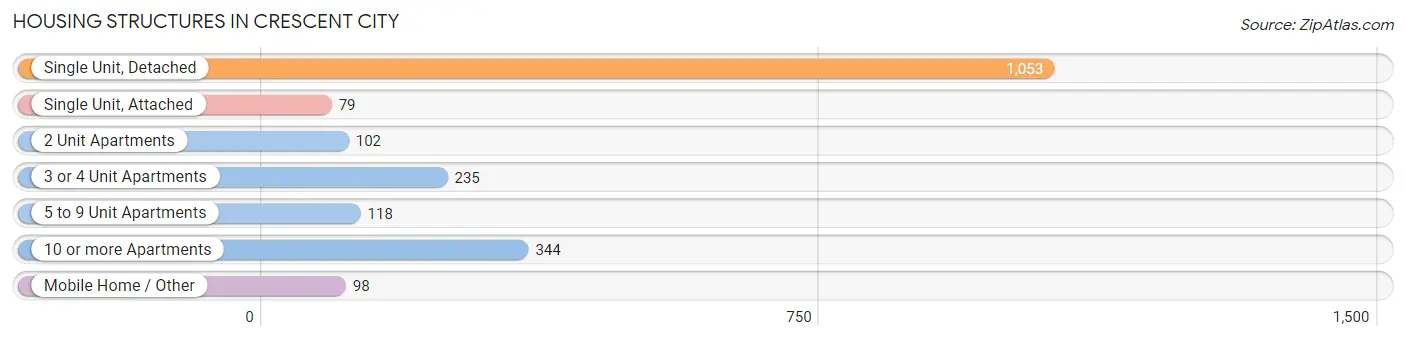
| Structure Type | # Housing Units | % Housing Units |
| Single Unit, Detached | 1,053 | 51.9% |
| Single Unit, Attached | 79 | 3.9% |
| 2 Unit Apartments | 102 | 5.0% |
| 3 or 4 Unit Apartments | 235 | 11.6% |
| 5 to 9 Unit Apartments | 118 | 5.8% |
| 10 or more Apartments | 344 | 17.0% |
| Mobile Home / Other | 98 | 4.8% |
| Total | 2,029 | 100.0% |
Housing Structures by Occupancy in Crescent City
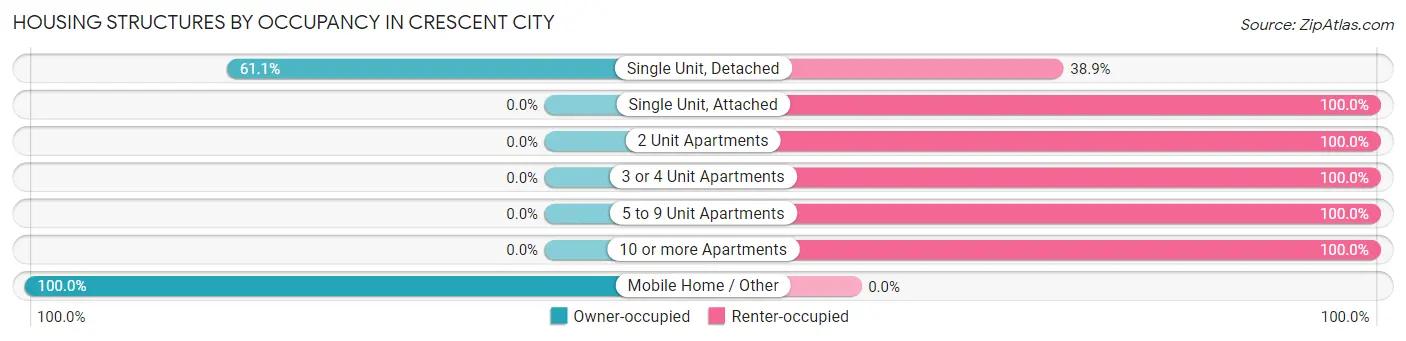
| Structure Type | Owner-occupied | Renter-occupied |
| Single Unit, Detached | 643 (61.1%) | 410 (38.9%) |
| Single Unit, Attached | 0 (0.0%) | 79 (100.0%) |
| 2 Unit Apartments | 0 (0.0%) | 102 (100.0%) |
| 3 or 4 Unit Apartments | 0 (0.0%) | 235 (100.0%) |
| 5 to 9 Unit Apartments | 0 (0.0%) | 118 (100.0%) |
| 10 or more Apartments | 0 (0.0%) | 344 (100.0%) |
| Mobile Home / Other | 98 (100.0%) | 0 (0.0%) |
| Total | 741 (36.5%) | 1,288 (63.5%) |
Housing Structures by Number of Rooms in Crescent City
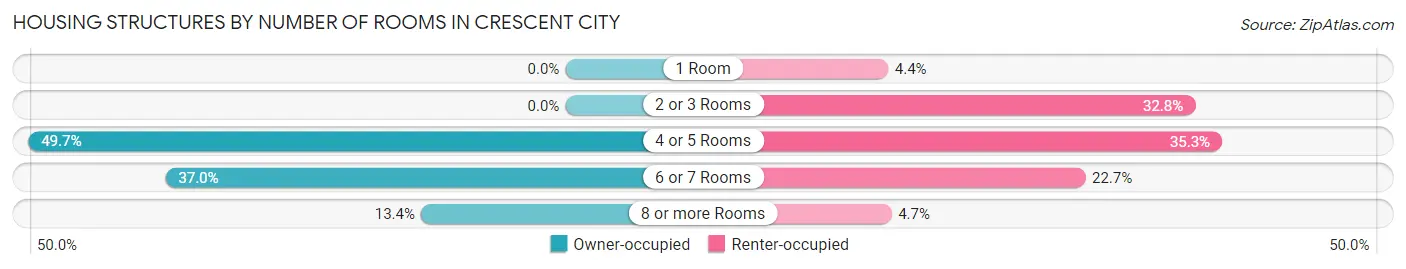
| Number of Rooms | Owner-occupied | Renter-occupied |
| 1 Room | 0 (0.0%) | 57 (4.4%) |
| 2 or 3 Rooms | 0 (0.0%) | 423 (32.8%) |
| 4 or 5 Rooms | 368 (49.7%) | 455 (35.3%) |
| 6 or 7 Rooms | 274 (37.0%) | 292 (22.7%) |
| 8 or more Rooms | 99 (13.4%) | 61 (4.7%) |
| Total | 741 (100.0%) | 1,288 (100.0%) |
Housing Structure by Heating Type in Crescent City
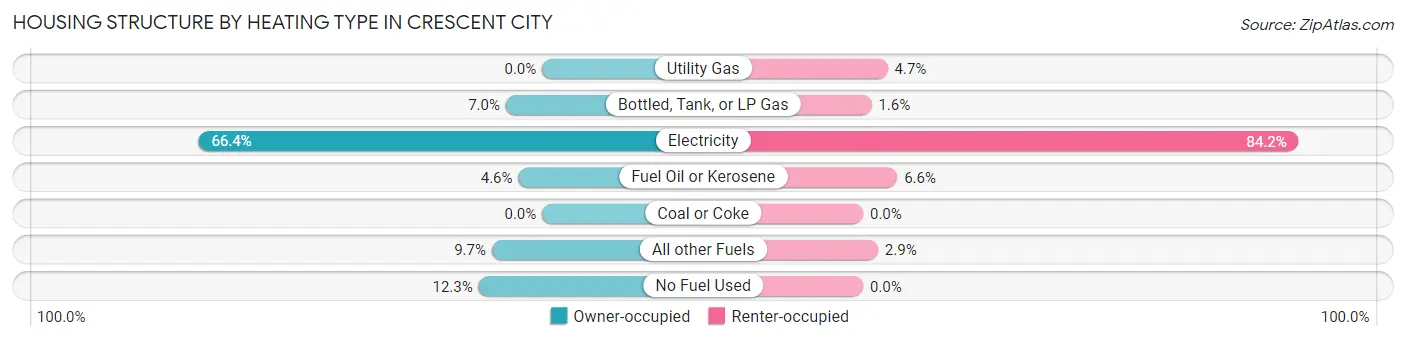
| Heating Type | Owner-occupied | Renter-occupied |
| Utility Gas | 0 (0.0%) | 61 (4.7%) |
| Bottled, Tank, or LP Gas | 52 (7.0%) | 21 (1.6%) |
| Electricity | 492 (66.4%) | 1,084 (84.2%) |
| Fuel Oil or Kerosene | 34 (4.6%) | 85 (6.6%) |
| Coal or Coke | 0 (0.0%) | 0 (0.0%) |
| All other Fuels | 72 (9.7%) | 37 (2.9%) |
| No Fuel Used | 91 (12.3%) | 0 (0.0%) |
| Total | 741 (100.0%) | 1,288 (100.0%) |
Household Vehicle Usage in Crescent City
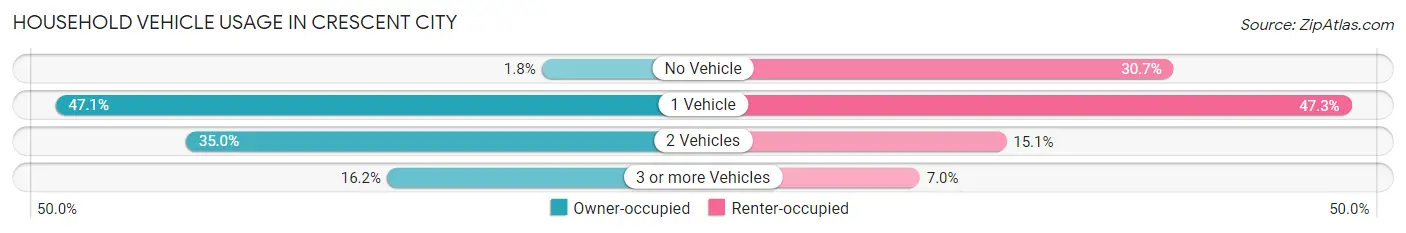
| Vehicles per Household | Owner-occupied | Renter-occupied |
| No Vehicle | 13 (1.8%) | 395 (30.7%) |
| 1 Vehicle | 349 (47.1%) | 609 (47.3%) |
| 2 Vehicles | 259 (34.9%) | 194 (15.1%) |
| 3 or more Vehicles | 120 (16.2%) | 90 (7.0%) |
| Total | 741 (100.0%) | 1,288 (100.0%) |
Real Estate & Mortgages in Crescent City
Real Estate and Mortgage Overview in Crescent City
| Characteristic | Without Mortgage | With Mortgage |
| Housing Units | 396 | 345 |
| Median Property Value | $292,500 | $247,600 |
| Median Household Income | $40,278 | $63 |
| Monthly Housing Costs | $469 | $17 |
| Real Estate Taxes | $1,694 | $20 |
Property Value by Mortgage Status in Crescent City
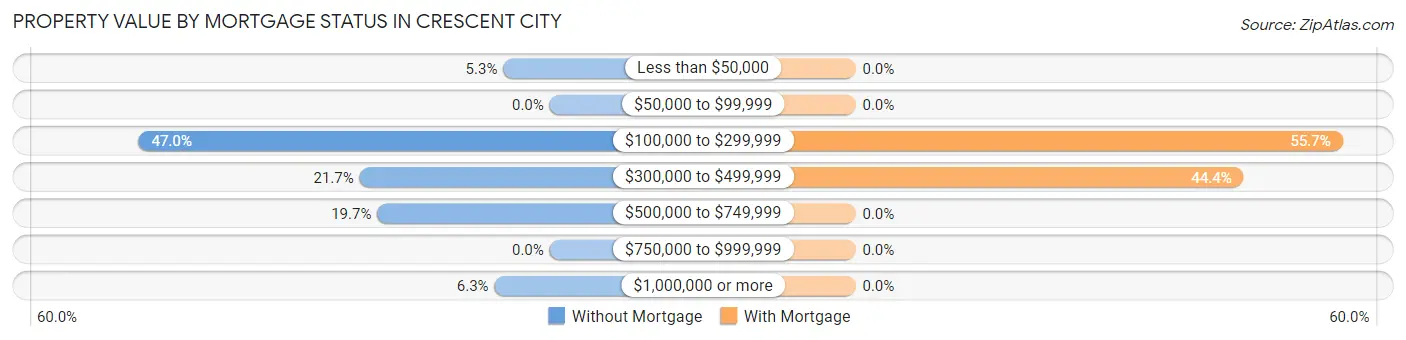
| Property Value | Without Mortgage | With Mortgage |
| Less than $50,000 | 21 (5.3%) | 0 (0.0%) |
| $50,000 to $99,999 | 0 (0.0%) | 0 (0.0%) |
| $100,000 to $299,999 | 186 (47.0%) | 192 (55.6%) |
| $300,000 to $499,999 | 86 (21.7%) | 153 (44.4%) |
| $500,000 to $749,999 | 78 (19.7%) | 0 (0.0%) |
| $750,000 to $999,999 | 0 (0.0%) | 0 (0.0%) |
| $1,000,000 or more | 25 (6.3%) | 0 (0.0%) |
| Total | 396 (100.0%) | 345 (100.0%) |
Household Income by Mortgage Status in Crescent City
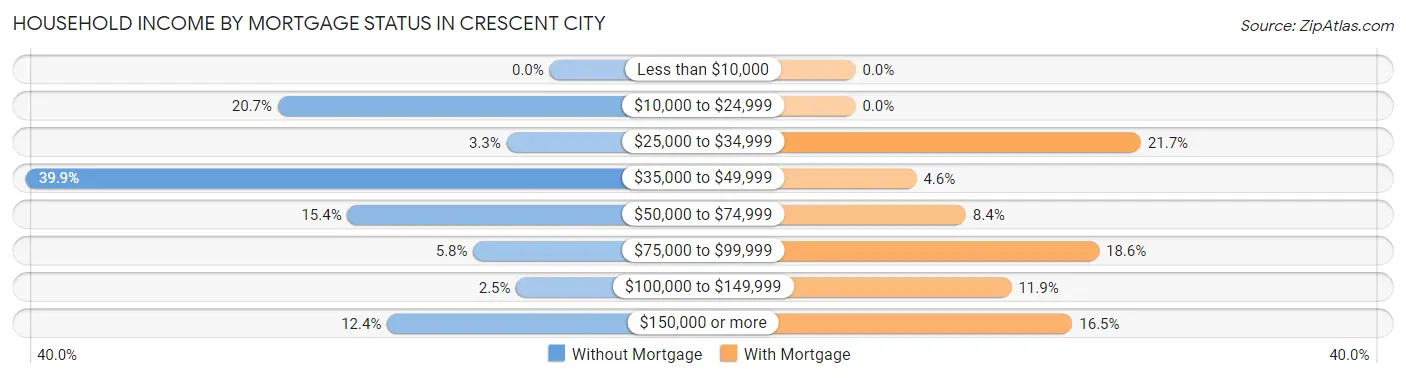
| Household Income | Without Mortgage | With Mortgage |
| Less than $10,000 | 0 (0.0%) | 0 (0.0%) |
| $10,000 to $24,999 | 82 (20.7%) | 0 (0.0%) |
| $25,000 to $34,999 | 13 (3.3%) | 75 (21.7%) |
| $35,000 to $49,999 | 158 (39.9%) | 16 (4.6%) |
| $50,000 to $74,999 | 61 (15.4%) | 29 (8.4%) |
| $75,000 to $99,999 | 23 (5.8%) | 64 (18.5%) |
| $100,000 to $149,999 | 10 (2.5%) | 41 (11.9%) |
| $150,000 or more | 49 (12.4%) | 57 (16.5%) |
| Total | 396 (100.0%) | 345 (100.0%) |
Property Value to Household Income Ratio in Crescent City
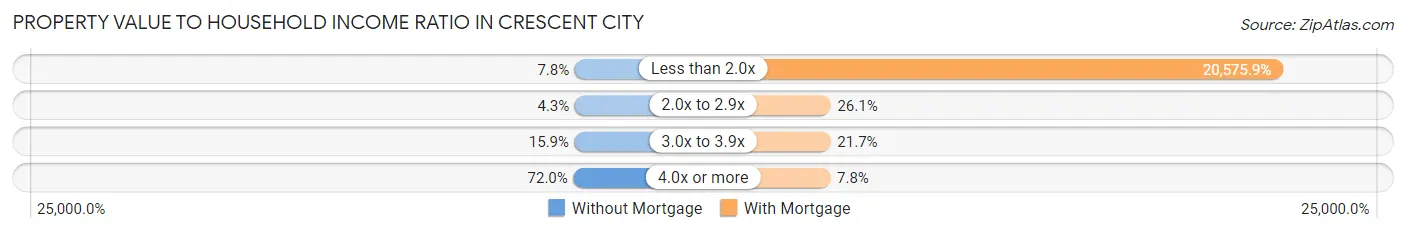
| Value-to-Income Ratio | Without Mortgage | With Mortgage |
| Less than 2.0x | 31 (7.8%) | 70,987 (20,575.9%) |
| 2.0x to 2.9x | 17 (4.3%) | 90 (26.1%) |
| 3.0x to 3.9x | 63 (15.9%) | 75 (21.7%) |
| 4.0x or more | 285 (72.0%) | 27 (7.8%) |
| Total | 396 (100.0%) | 345 (100.0%) |
Real Estate Taxes by Mortgage Status in Crescent City
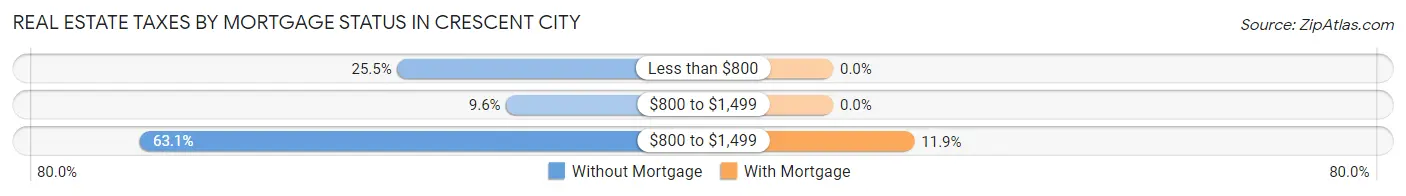
| Property Taxes | Without Mortgage | With Mortgage |
| Less than $800 | 101 (25.5%) | 0 (0.0%) |
| $800 to $1,499 | 38 (9.6%) | 0 (0.0%) |
| $800 to $1,499 | 250 (63.1%) | 41 (11.9%) |
| Total | 396 (100.0%) | 345 (100.0%) |
Health & Disability in Crescent City
Health Insurance Coverage by Age in Crescent City
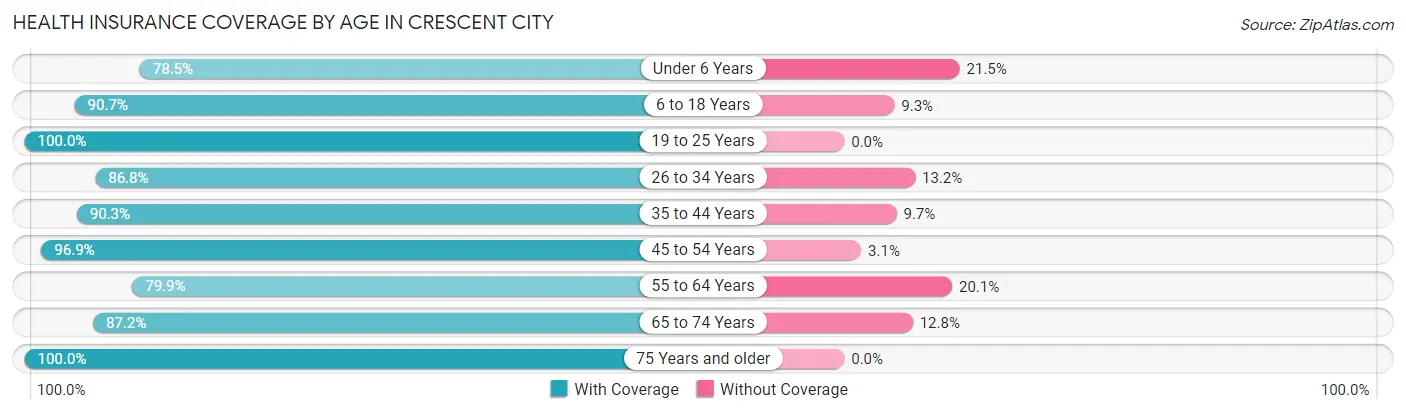
| Age Bracket | With Coverage | Without Coverage |
| Under 6 Years | 157 (78.5%) | 43 (21.5%) |
| 6 to 18 Years | 553 (90.7%) | 57 (9.3%) |
| 19 to 25 Years | 394 (100.0%) | 0 (0.0%) |
| 26 to 34 Years | 329 (86.8%) | 50 (13.2%) |
| 35 to 44 Years | 593 (90.3%) | 64 (9.7%) |
| 45 to 54 Years | 525 (96.9%) | 17 (3.1%) |
| 55 to 64 Years | 545 (79.9%) | 137 (20.1%) |
| 65 to 74 Years | 465 (87.2%) | 68 (12.8%) |
| 75 Years and older | 254 (100.0%) | 0 (0.0%) |
| Total | 3,815 (89.7%) | 436 (10.3%) |
Health Insurance Coverage by Citizenship Status in Crescent City
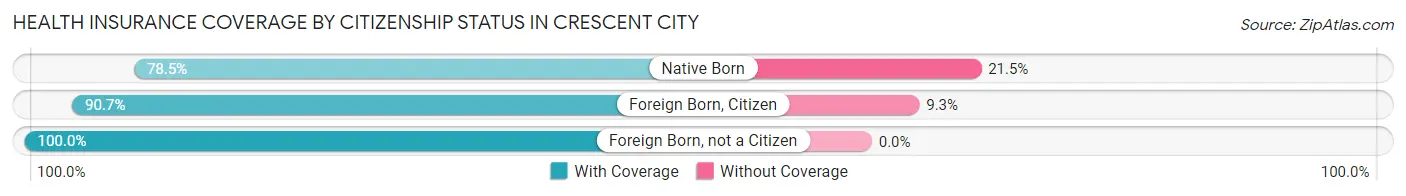
| Citizenship Status | With Coverage | Without Coverage |
| Native Born | 157 (78.5%) | 43 (21.5%) |
| Foreign Born, Citizen | 553 (90.7%) | 57 (9.3%) |
| Foreign Born, not a Citizen | 394 (100.0%) | 0 (0.0%) |
Health Insurance Coverage by Household Income in Crescent City
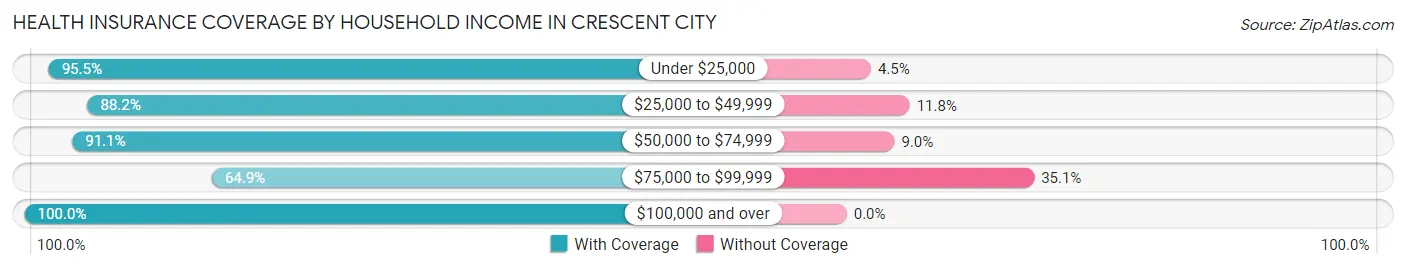
| Household Income | With Coverage | Without Coverage |
| Under $25,000 | 1,350 (95.5%) | 64 (4.5%) |
| $25,000 to $49,999 | 905 (88.2%) | 121 (11.8%) |
| $50,000 to $74,999 | 682 (91.0%) | 67 (8.9%) |
| $75,000 to $99,999 | 340 (64.9%) | 184 (35.1%) |
| $100,000 and over | 513 (100.0%) | 0 (0.0%) |
Public vs Private Health Insurance Coverage by Age in Crescent City
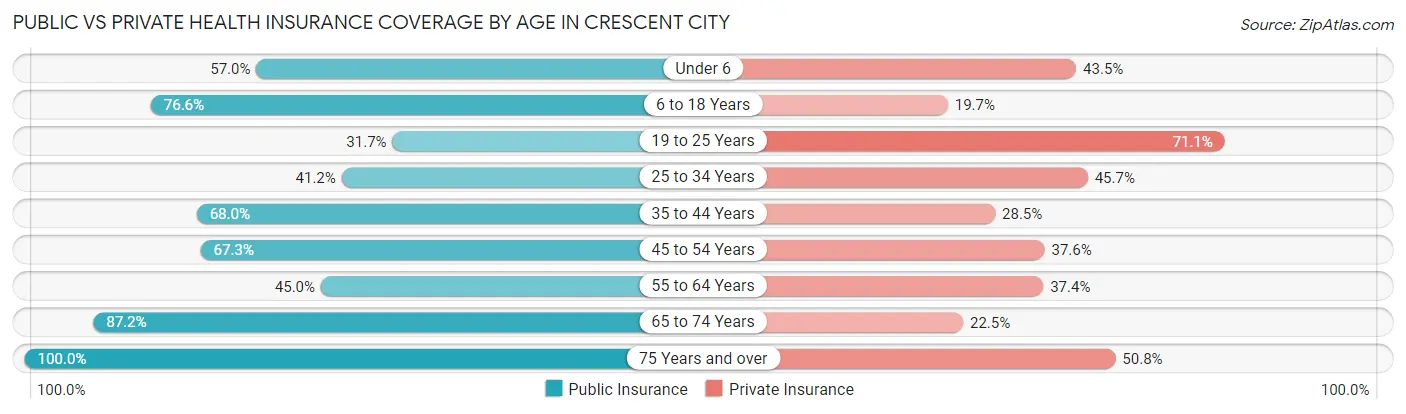
| Age Bracket | Public Insurance | Private Insurance |
| Under 6 | 114 (57.0%) | 87 (43.5%) |
| 6 to 18 Years | 467 (76.6%) | 120 (19.7%) |
| 19 to 25 Years | 125 (31.7%) | 280 (71.1%) |
| 25 to 34 Years | 156 (41.2%) | 173 (45.7%) |
| 35 to 44 Years | 447 (68.0%) | 187 (28.5%) |
| 45 to 54 Years | 365 (67.3%) | 204 (37.6%) |
| 55 to 64 Years | 307 (45.0%) | 255 (37.4%) |
| 65 to 74 Years | 465 (87.2%) | 120 (22.5%) |
| 75 Years and over | 254 (100.0%) | 129 (50.8%) |
| Total | 2,700 (63.5%) | 1,555 (36.6%) |
Disability Status by Sex by Age in Crescent City
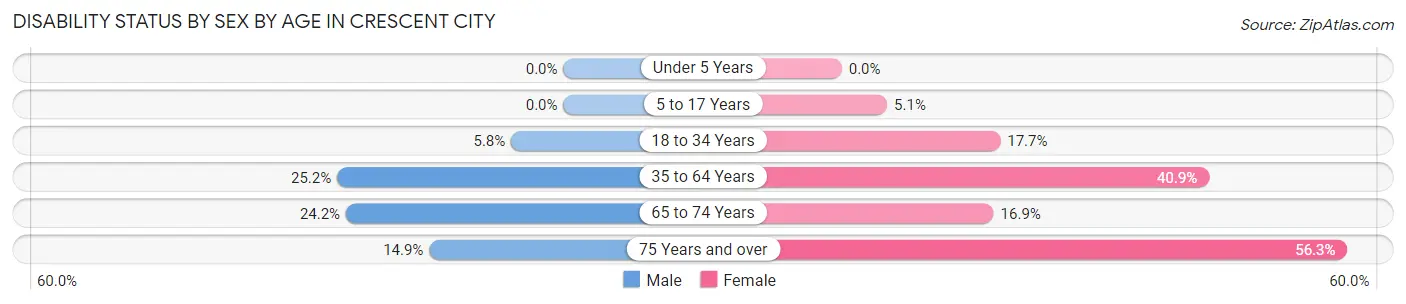
| Age Bracket | Male | Female |
| Under 5 Years | 0 (0.0%) | 0 (0.0%) |
| 5 to 17 Years | 0 (0.0%) | 14 (5.1%) |
| 18 to 34 Years | 27 (5.8%) | 60 (17.6%) |
| 35 to 64 Years | 219 (25.2%) | 414 (40.9%) |
| 65 to 74 Years | 46 (24.2%) | 58 (16.9%) |
| 75 Years and over | 13 (14.9%) | 94 (56.3%) |
Disability Class by Sex by Age in Crescent City
Disability Class: Hearing Difficulty
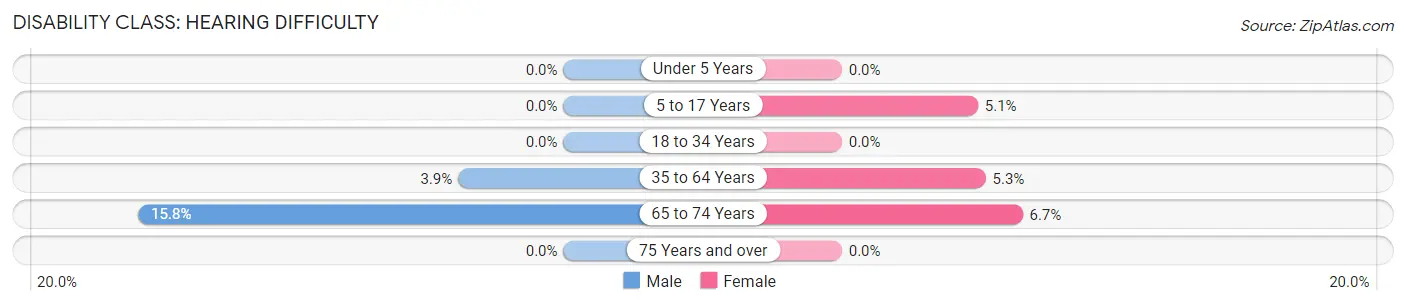
| Age Bracket | Male | Female |
| Under 5 Years | 0 (0.0%) | 0 (0.0%) |
| 5 to 17 Years | 0 (0.0%) | 14 (5.1%) |
| 18 to 34 Years | 0 (0.0%) | 0 (0.0%) |
| 35 to 64 Years | 34 (3.9%) | 54 (5.3%) |
| 65 to 74 Years | 30 (15.8%) | 23 (6.7%) |
| 75 Years and over | 0 (0.0%) | 0 (0.0%) |
Disability Class: Vision Difficulty
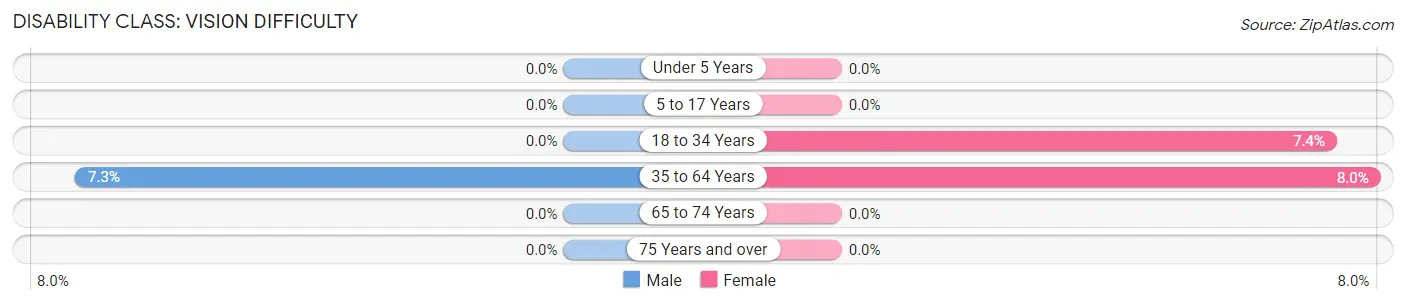
| Age Bracket | Male | Female |
| Under 5 Years | 0 (0.0%) | 0 (0.0%) |
| 5 to 17 Years | 0 (0.0%) | 0 (0.0%) |
| 18 to 34 Years | 0 (0.0%) | 25 (7.3%) |
| 35 to 64 Years | 63 (7.2%) | 81 (8.0%) |
| 65 to 74 Years | 0 (0.0%) | 0 (0.0%) |
| 75 Years and over | 0 (0.0%) | 0 (0.0%) |
Disability Class: Cognitive Difficulty
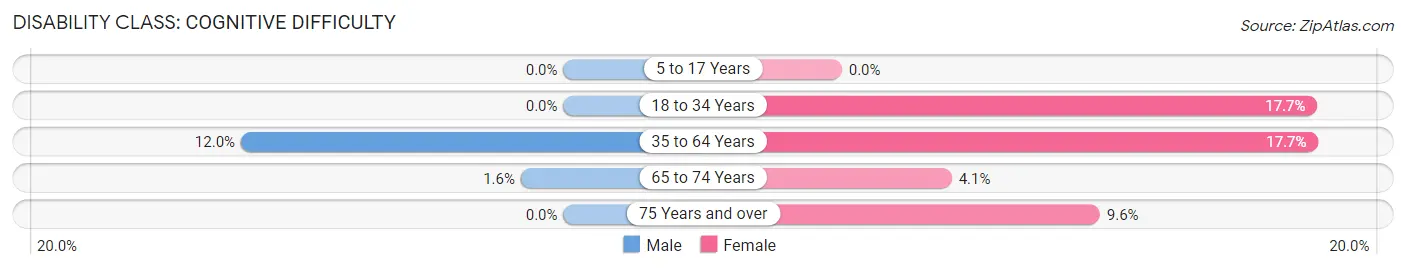
| Age Bracket | Male | Female |
| 5 to 17 Years | 0 (0.0%) | 0 (0.0%) |
| 18 to 34 Years | 0 (0.0%) | 60 (17.6%) |
| 35 to 64 Years | 104 (12.0%) | 179 (17.7%) |
| 65 to 74 Years | 3 (1.6%) | 14 (4.1%) |
| 75 Years and over | 0 (0.0%) | 16 (9.6%) |
Disability Class: Ambulatory Difficulty
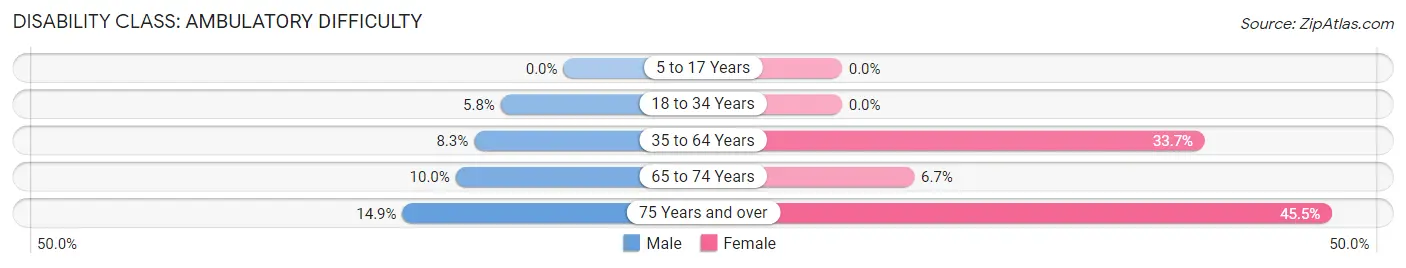
| Age Bracket | Male | Female |
| 5 to 17 Years | 0 (0.0%) | 0 (0.0%) |
| 18 to 34 Years | 27 (5.8%) | 0 (0.0%) |
| 35 to 64 Years | 72 (8.3%) | 341 (33.7%) |
| 65 to 74 Years | 19 (10.0%) | 23 (6.7%) |
| 75 Years and over | 13 (14.9%) | 76 (45.5%) |
Disability Class: Self-Care Difficulty
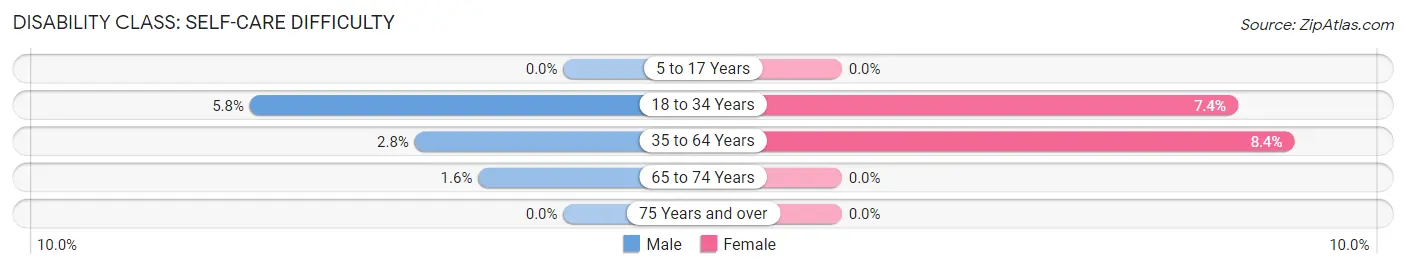
| Age Bracket | Male | Female |
| 5 to 17 Years | 0 (0.0%) | 0 (0.0%) |
| 18 to 34 Years | 27 (5.8%) | 25 (7.3%) |
| 35 to 64 Years | 24 (2.8%) | 85 (8.4%) |
| 65 to 74 Years | 3 (1.6%) | 0 (0.0%) |
| 75 Years and over | 0 (0.0%) | 0 (0.0%) |
Technology Access in Crescent City
Computing Device Access in Crescent City
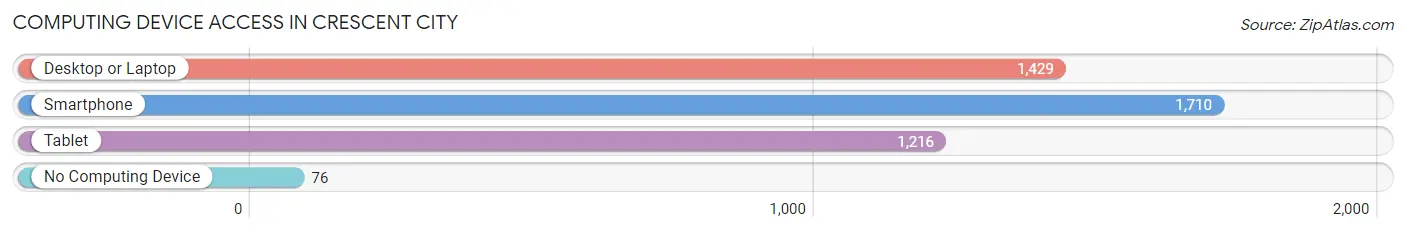
| Device Type | # Households | % Households |
| Desktop or Laptop | 1,429 | 70.4% |
| Smartphone | 1,710 | 84.3% |
| Tablet | 1,216 | 59.9% |
| No Computing Device | 76 | 3.7% |
| Total | 2,029 | 100.0% |
Internet Access in Crescent City
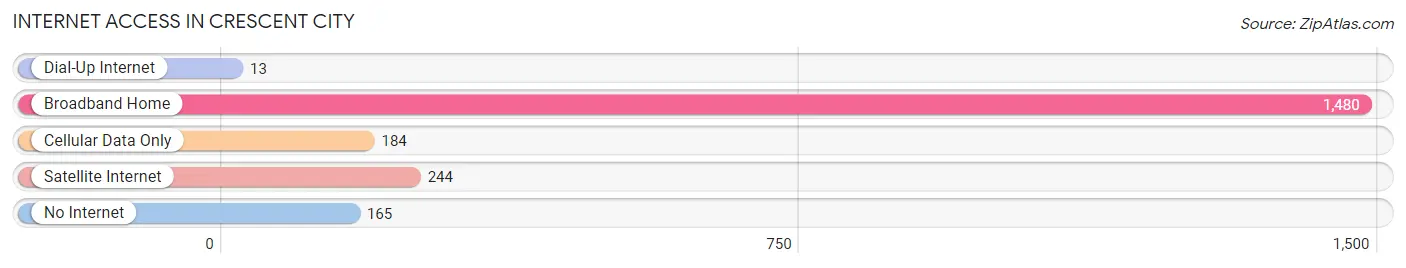
| Internet Type | # Households | % Households |
| Dial-Up Internet | 13 | 0.6% |
| Broadband Home | 1,480 | 72.9% |
| Cellular Data Only | 184 | 9.1% |
| Satellite Internet | 244 | 12.0% |
| No Internet | 165 | 8.1% |
| Total | 2,029 | 100.0% |
Crescent City Summary
Crescent City is a small coastal city located in Del Norte County, California. It is situated on the northernmost part of the state, near the Oregon border. The city is known for its stunning views of the Pacific Ocean, its rugged coastline, and its abundance of outdoor activities.
History
Crescent City was first settled in 1853 by a group of settlers from Oregon. The city was named after the crescent-shaped bay that it is located on. The city was incorporated in 1854 and quickly became a popular destination for travelers and settlers.
In the late 1800s, Crescent City was a bustling port town, with a large fishing industry and a thriving lumber industry. The city was also home to a number of canneries, which processed the abundant seafood caught in the area.
In 1964, Crescent City was hit by a devastating tsunami, which caused extensive damage to the city and killed 11 people. The city was rebuilt and has since become a popular tourist destination.
Geography
Crescent City is located on the northernmost part of California, near the Oregon border. The city is situated on a crescent-shaped bay, which is surrounded by rugged coastline and stunning views of the Pacific Ocean.
The city is located in a temperate rainforest climate, with mild temperatures year-round. The city receives an average of 50 inches of rain per year, making it one of the wettest cities in California.
Economy
Crescent City’s economy is largely based on tourism and fishing. The city is home to a number of seafood processing plants, which process the abundant seafood caught in the area. The city is also home to a number of tourist attractions, including the Battery Point Lighthouse, the Redwood National and State Parks, and the Crescent City Harbor.
The city is also home to a number of retail stores, restaurants, and other businesses. The city is served by the Del Norte County Regional Airport, which provides air service to the city and the surrounding area.
Demographics
As of the 2010 census, Crescent City had a population of 7,643. The city is predominantly white, with a large Hispanic population. The median household income in the city is $37,845, and the median home value is $179,000.
The city is served by the Del Norte County Unified School District, which includes four elementary schools, one middle school, and one high school. The city is also home to College of the Redwoods, a two-year community college.
Conclusion
Crescent City is a small coastal city located in Del Norte County, California. It is known for its stunning views of the Pacific Ocean, its rugged coastline, and its abundance of outdoor activities. The city’s economy is largely based on tourism and fishing, and it is home to a number of retail stores, restaurants, and other businesses. The city is predominantly white, with a large Hispanic population, and the median household income is $37,845. Crescent City is a popular tourist destination and is home to a number of attractions, including the Battery Point Lighthouse, the Redwood National and State Parks, and the Crescent City Harbor.
Common Questions
What is Per Capita Income in Crescent City?
Per Capita income in Crescent City is $16,379.
What is the Median Family Income in Crescent City?
Median Family Income in Crescent City is $44,848.
What is the Median Household income in Crescent City?
Median Household Income in Crescent City is $39,812.
What is Income or Wage Gap in Crescent City?
Income or Wage Gap in Crescent City is 19.7%.
Women in Crescent City earn 80.3 cents for every dollar earned by a man.
What is Inequality or Gini Index in Crescent City?
Inequality or Gini Index in Crescent City is 0.45.
What is the Total Population of Crescent City?
Total Population of Crescent City is 6,379.
What is the Total Male Population of Crescent City?
Total Male Population of Crescent City is 4,052.
What is the Total Female Population of Crescent City?
Total Female Population of Crescent City is 2,327.
What is the Ratio of Males per 100 Females in Crescent City?
There are 174.13 Males per 100 Females in Crescent City.
What is the Ratio of Females per 100 Males in Crescent City?
There are 57.43 Females per 100 Males in Crescent City.
What is the Median Population Age in Crescent City?
Median Population Age in Crescent City is 37.1 Years.
What is the Average Family Size in Crescent City
Average Family Size in Crescent City is 2.9 People.
What is the Average Household Size in Crescent City
Average Household Size in Crescent City is 2.1 People.
How Large is the Labor Force in Crescent City?
There are 1,839 People in the Labor Forcein in Crescent City.
What is the Percentage of People in the Labor Force in Crescent City?
32.3% of People are in the Labor Force in Crescent City.
What is the Unemployment Rate in Crescent City?
Unemployment Rate in Crescent City is 7.9%.